
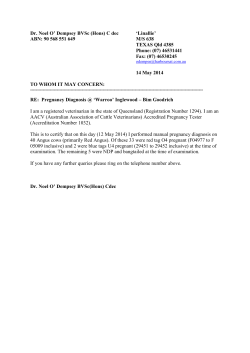
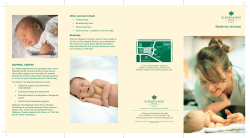
Maternity Leave and Employment Patterns of First-Time Mothers: 1961–2003 Household Economic Studies
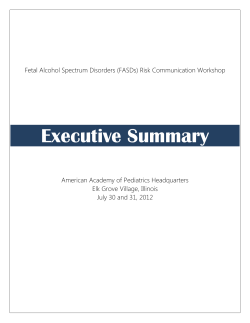
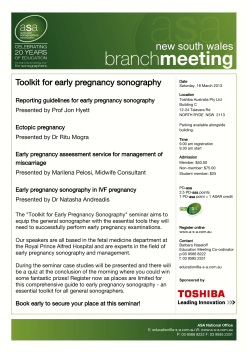
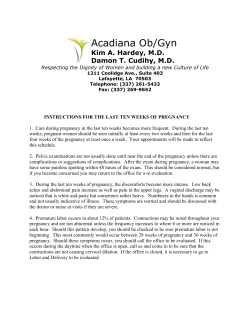
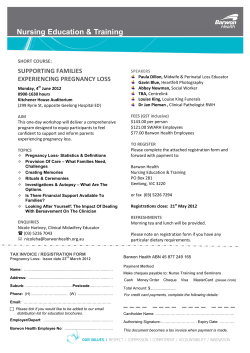
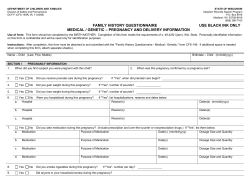
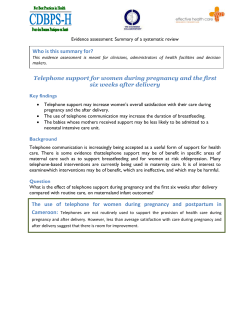
Maternity Leave and Employment
Patterns of First-Time Mothers:
1961–2003
Issued February 2008
Household Economic Studies
P70-113
INTRODUCTION
A little over half of all American women
with a child under 1 year of age were in
the labor force in 2004.1 A child’s birth
often requires changes in a mother’s
work schedule.2 This report examines
trends in maternity leave and the
employment patterns of women who
gave birth to their first child between
January 1961 and December 2003.3
The analysis primarily uses retrospective
fertility, employment, and maternity
leave data from the 2004 panel of the
U.S. Census Bureau’s Survey of Income
and Program Participation (SIPP) conducted in 2004.4 Previously published
results based on similarly collected
1
Jane Lawler Dye, Fertility of American Women:
June 2004, Current Population Reports, P20-555,
U.S. Census Bureau, Washington, DC, 2005.
2
Mothers with infants consistently have both
lower labor force participation rates and lower proportions working full-time than do mothers with
older children. Jane Lawler Dye, Fertility of American
Women: June 2004, Current Population Reports, P20555, U.S. Census Bureau, Washington, DC, 2005.
3
The estimates in this report (which may be
shown in text, figures, and tables) are based on
responses from a sample of the population and may
differ from the actual values because of sampling
variability or other factors. As a result, apparent differences between the estimates for two or more
groups may not be statistically significant. All comparative statements have undergone statistical testing and are significant at the 90-percent confidence
level unless otherwise noted.
4
The data in this report were collected from June
through September 2004 in the second wave (interview) of the 2004 SIPP; from June through
September 2001 in the second wave of the 2001
SIPP; from August through November 1996 in the
second wave of the 1996 SIPP; from January through
April 1986 in the fourth wave of the 1985 SIPP; and
from January through March 1986 in the eighth wave
of the 1984 SIPP. The population represented (population universe) is the civilian noninstitutionalized
population living in the United States.
information from the 1984, 1985, 1996,
and 2001 SIPP panels are also included.5
The report first analyzes trends in
women’s work experience prior to their
first birth and the factors associated with
employment during pregnancy. Changes
are placed in the historical context of the
enactment of family-related legislation
during the last quarter of the twentieth
century. The next section identifies the
maternity leave arrangements used by
women before and after their first birth
and the shifts that have occurred in the
mix of leave arrangements that are used.
The final section examines how rapidly
mothers return to work after their first
birth and the factors related to the
length of time they are absent from the
labor force.
In addition to updating childbearing,
employment, and maternity leave trends
through the 1990s, the report provides
details on changes many new mothers
experience in the number of hours
worked, pay level, and job skill level after
the first birth. These changes are examined in relation to whether a woman
returned to the same employer she had
during pregnancy or changed employer
after the birth of the child.
5
For more information on the previously published reports, see Martin O’Connell, “Maternity
Leave Arrangements: 1961–85,” Work and Family
Patterns of American Women, Current Population
Reports, Series P-23, No. 165, Bureau of the Census,
Washington, DC, 1990; Kristin Smith, Barbara
Downs, and Martin O’Connell, Maternity Leave and
Employment Patterns: 1961–1995, Current
Population Reports, P70-79, U.S. Census Bureau,
Washington, DC, 2001; Julia Overturf Johnson and
Barbara Downs, Maternity Leave and Employment
Patterns: 1961–2000, Current Population Reports,
P70-103, U.S. Census Bureau, Washington, DC, 2005.
USCENSUSBUREAU
U.S. Department of Commerce
Economics and Statistics Administration
U.S. CENSUS BUREAU
Helping You Make Informed Decisions
Current
Population
Reports
By
Tallese D. Johnson
CHARACTERISTICS OF
MOTHERS AT FIRST BIRTH
Social and economic changes that
have occurred among women since
1961 have been noted to be associated with changes in families, childbearing, and work.6 At the same
time, the demographic picture of
new mothers has also changed.
This section analyzes some of these
events and shows how the characteristics of first-time mothers have
changed over time.
Age and Educational
Attainment of
First-Time Mothers
Young women giving birth in their
late teens and early twenties are
just beginning to start families at
ages when other women are completing high school and entering
college. Women who have delayed
childbearing until their late twenties and thirties are more likely to
have completed their schooling
and accumulated more years of
work experience than their
younger counterparts. Education
and experience can influence
income levels and job security,
which may in turn influence their
decisions about working during
pregnancy and how soon to return
to work after their first birth.
Age at first birth and the educational attainment of new mothers
have changed over time. Data from
the National Center for Health
Statistics (NCHS) show that the
mean (average) age at first birth
increased from 21.4 years in 1970
to 24.9 years in 2000.7 The
6
“Work and Family: A Changing
Dynamic,” BNA Special Report, Bureau of
National Affairs, Washington, DC, 1986.
7
T.J. Matthews and B.E. Hamilton, “Mean
Age of Mother, 1970-2000,” National Vital
Statistics Reports, Vol. 51, No. 1, National
Center for Health Statistics, Hyattsville, MD,
2002.
2
SIPP FERTILITY, EMPLOYMENT, AND
MATERNITY LEAVE DATA
The 2004 panel of the nationally representative Survey of Income
and Program Participation (SIPP) included a fertility topical module in
the second wave of interviews conducted in June–September 2004.
Information was collected on the birth dates of the first and last children born to all women 15 to 64 years old at the time of the survey.
Women whose first child was born between 1991 and the survey
date were also asked a series of questions concerning their employment history before and after the birth, as well as their receipt of
maternity-leave benefits. Data from this survey were used in combination with similar information collected in the 1984, 1985, 1996,
and 2001 SIPP panels to provide an extended series of employment
and maternity leave data between 1961 and 2003.
The most recent data shown in this report, for the time period
2001–2003, are from Wave 2 of the 2004 SIPP. In previous reports,
data for prior decades were often generated retrospectively from the
most recent survey. For this report, data presented from 1961–2000
were obtained from earlier maternity leave reports produced by the
Census Bureau or were retabulated and the most recent time period
was generated by the survey year closest to that period. Generally,
data from 1961–1965 to 1981–1985 are from the Bureau of the
Census, Current Population Reports, Series P23-165 (Work and
Family Patterns of American Women), except as noted in individual
tables and figures; data from 1986–1990 to 1991–1995 are from
P70-79 (Maternity Leave and Employment Patterns: 1961–1995); and
data from 1996–2000 are from P70-103 (Maternity Leave and
Employment Patterns: 1961–2000). For this reason, some of the data
for prior survey years shown in this report may not be identical to
those published in previous reports for similar time periods.
percentage of first births that were
to women aged 30 and over
increased between 1970 and 2000,
from 4 percent to 24 percent. At
the same time, the percentage of
first births that were to women
under 20 years of age dropped
from 36 percent to 23 percent.
Although not available by birth
order, educational attainment
among all mothers has also
increased since 1970. In 2000, 25
percent of mothers had completed
16 or more years of school, compared with 9 percent in 1970.
Among mothers aged 30 to 34, the
proportion completing 16 or more
years of school increased from 15
percent to 43 percent.8
During this time, an increasing proportion of women 25 to 34 years
old continued their education
beyond high school. The proportion who had completed 4 or more
years of college approximately
doubled from 12 percent in 1970
8
Data for 1970 are from Vital Statistics
of the United States, Vol. 1, National Center
for Health Statistics, Rockville, MD, 1975.
Data for 2000 are from J.A. Martin, et al.,
“Births: Final Data for 2000,” National Vital
Statistics Reports, Vol. 50, No. 5, National
Center for Health Statistics, Hyattsville, MD,
2002.
U.S. Census Bureau
to 23 percent by 1990. By 2006,
the proportion with a bachelor’s
degree or more education had
reached 33 percent.9 The age and
educational attainment of first-time
mothers as related to their work
history around the time of their
child’s birth are examined in ensuing sections of this report.
Factors Related to Employment
and Maternity Leave
In the 1970s, the common expectation that women would leave work
upon becoming pregnant began to
change.10 Another change during
the 1970s was an increase in the
proportion of families with a second
income. More mothers, to maintain
economic well-being and for other
reasons, began to enter and stay in
the workforce, resulting in an
increase in homes where both
spouses worked.11
Legislative, judicial, and regulatory
changes related to maternal
employment were enacted in the
1970s and 1980s that affected
employer practices during an
employee’s pregnancy and after
giving birth and revised policies on
child care support. For example, in
1976 the federal tax code was
changed to permit working families with a dependent child to take
a tax credit for child care costs.
The affordability of child care services may be an issue for many
women in deciding whether and
Educational Attainment Historical
Tables: Table A-1, Current Population Survey,
U.S. Census Bureau, Washington, DC, 2007,
<www.census.gov/population/socdemo
/education/cps2006/tabA-1.xls>. Prior to
1992, educational attainment was measured
by years of schooling completed. Four or
more years of college is equivalent to a
bachelor’s degree or more education.
10
Andrew Cherlin, Marriage, Divorce,
Remarriage, Harvard University Press,
Massachusetts, 1992.
11
Frank Levy, The New Dollars and
Dreams, American Incomes and Economic
Change, Russell Sage Foundation, New York,
1998.
9
U.S. Census Bureau
when to return to work.12 In 1978,
the Pregnancy Discrimination Act
was passed, which prohibited
employment discrimination on the
basis of pregnancy or childbirth.
This act covered hiring and firing
policies as well as promotions and
pay levels.
Flexible work schedules,
employment-based child care benefits, and maternity leave emerged
as issues during the 1980s at
about the same time that birth
rates among women 30 and older
began to increase steadily in the
United States.13 A U.S. Supreme
Court decision in 1987, California
Federal Savings and Loan
Association v. Guerra, upheld a
California law requiring most
employers to grant pregnant
women 4 months of unpaid disability leave and the right to return
to their same job. At the federal
level, The Family and Medical
Leave Act of 1993 (FMLA) mandates up to 12 weeks of unpaid
leave for childbearing or family
care over a 12-month period for
eligible employees. Studies so far
have found little evidence that
such laws have increased the
amount of leave women take by
any considerable amount.14
EMPLOYMENT HISTORY
BEFORE THE FIRST BIRTH
This section describes overall
trends in women’s employment
12
Daphne Spain and Suzanne Bianchi,
Balancing Act: Motherhood, Marriage, and
Employment Among American Women,
Russell Sage Foundation, New York, 1996.
13
Harriet B. Presser, “Can We Make Time
for Children? The Economy, Work Schedules,
and Child Care,” Demography, Vol. 26, 1989,
pp. 523–543. See Historical Fertility Tables,
U.S. Census Bureau, Washington, DC, 2005,
Table H3, <www.census.gov/population
/socdemo/fertility/tabH3.xls>.
14
Wen-Jui Hen and Jane Waldfogel,
“Parental Leave: The Impact of Recent Legislation on Parent’s Leave Taking,” Demography,
Vol. 40, No. 2, 2003, pp. 191–200. Jacob
Klerman and Arleen Leibowitz, “Job Continuity
Among New Mothers,” Demography, Vol. 36,
No. 2, 1999, pp. 145–155.
history from 1961–1965 to
2001–2003 and the characteristics
of women who worked during
their first pregnancy.
Overall Trends:
1961–1965 to 2001–2003
In the Fertility History portion of the
SIPP, all mothers are asked if they
ever worked for pay for at least 6
consecutive months before their
first birth and if they worked for
pay at a job at any time during the
pregnancy leading to their first
birth.15 The categories do not necessarily overlap, as new mothers may
have worked for a few months during their pregnancy while never
having worked for 6 months in a
row.16 Other mothers may have
worked for 6 months but quit working before they got pregnant.
Table 1 shows that for mothers who
had their first child between 2001
and 2003, 74 percent had worked
for at least a 6-month period in
their lives. This percentage had
increased since the early 1960s,
when it was 60 percent of new
mothers. Most of the increase since
1961–1965 occurred by the time of
the 1986–1990 first-birth cohort,
when the percentage reached 76
percent. Since then, no major
changes have occurred. Age is
related to whether women have
worked before having their first
child. For women 30 years and
older, 9 out of 10 women who had
a first birth in 2001–2003 had
worked for at least 6 consecutive
months, compared with 55 percent
of women under 22 years of age.17
15
For the remainder of this report, the
term “pregnancy” is used to refer to the
pregnancy preceding the first birth.
16
Working for 6 consecutive months is a
standard labor force indicator that measures
the likelihood of a serious commitment to
the labor force.
17
Separate analysis, not shown in tables.
3
Table 1.
Employment History of Women Before First Birth: 1961–1965 to 2001–2003
Women with a first birth who—
Year of first birth
1961–1965
1966–1970
1971–1975
1976–1980
1981–1985
1986–1990
1991–1995
1996–2000
2001–2003
.......
.......
.......
.......
.......
.......
.......
.......
.......
Ever worked for 6 or
more months
continuously1
Worked during
pregnancy
Worked full-time
during pregnancy2
Worked part-time
during pregnancy2
Number of
women with a
first birth
(thousands)
Percent
Margin of
error3
Percent
Margin of
error3
Percent
Margin of
error3
Percent
Margin of
error3
6,306
6,956
6,920
7,192
8,129
8,568
8,599
8,558
4,905
60.0
66.4
68.9
73.1
75.2
75.5
73.8
74.0
74.0
2.0
1.8
1.8
1.7
1.4
1.3
1.6
1.6
2.0
44.4
49.4
53.5
61.4
64.5
67.2
66.8
67.2
67.0
2.0
1.9
1.9
1.9
1.5
1.4
1.8
1.7
2.1
39.7
44.2
47.6
53.1
54.0
58.3
54.5
56.6
57.1
2.0
1.9
2.0
1.9
1.5
1.5
1.8
1.8
2.2
4.7
5.2
5.9
8.3
10.5
8.9
12.2
10.6
9.9
0.9
0.9
0.9
1.1
0.8
0.9
1.0
1.1
1.3
1
At any time before first birth.
Full-time/part-time status refers to last job held before first child’s birth.
The margin of error, when added to or subtracted from the estimate, provides the 90-percent confidence interval around the estimate.
Source: 1961–1965 to 1981–1985: Bureau of the Census, Current Population Reports, Series P-23, No. 165 (Work and Family Patterns of American
Women), Tables C, B-2, and B-3; 1986–1990 to 1991–1995: P70-79 (Maternity Leave and Employment Patterns: 1961–1995), Table A; 1996–2001: P70-103
(Maternity Leave and Employment Patterns: 1961–2000), Table 1; and 2001–2003: Survey of Income and Program Participation, 2004 Panel, Wave 2.
2
3
The percentage of new mothers
who worked at all during their pregnancy increased by 23 percentage
points since 1961–1965. Forty-four
percent of women who had their
first birth between 1961 and 1965
worked while pregnant. For the
2001–2003 first-birth cohort, 67
percent of new mothers worked
while pregnant, not different from
the proportions working while pregnant since 1986–1990.18
Fifty-seven percent of first-time
mothers in 2001–2003 worked at
full-time jobs during their pregnancy (35 hours or more per week,
Table 1). The proportion of firsttime mothers working full-time during pregnancy was 40 percent in
1961–1965, increased to over 50
percent by the late 1970s, and
stayed above 50 percent through
2003. The proportion of first-time
18
Overall labor force participation rates
for women, regardless of pregnancy status,
were as follows: 32 percent in 1960, 43 percent in 1970, 52 percent in 1980, 58 percent
in 1990, and 60 percent in 2000. See the
Bureau of Labor Statistics Web site at
<www.bls.gov/cps/cpsaat2.pdf>.
4
mothers working part-time during
pregnancy in 1961–1965 was 5 percent. The percentage doubled to 11
percent in 1981–1985 and has
remained between 9 percent and 12
percent since then. Subsequent sections of this report will show the
extent to which weekly hours
worked while pregnant and the
amount of leave taken from the
workforce around the time of a first
birth are related to the type of
maternity benefits received.
Women Who Worked
During Pregnancy
Table 2 summarizes differences in
women’s work experience during
pregnancy in 2001–2003. Overall,
67 percent of mothers who had
their first births in 2001–2003
worked during pregnancy. First-time
mothers under age 22 had lower
rates of employment during pregnancy than older first-time mothers.
Among women at the ends of the
age spectrum, 30 percent of new
mothers under age 18 worked
while pregnant, compared with 85
percent of mothers 30 and older.
Among the racial groups shown,
non-Hispanic White women had the
highest percentage (77 percent)
that worked during their first pregnancy.19 Fifty-eight percent of Asian
women worked during pregnancy,
followed by 56 percent of Black
19
Federal surveys now give respondents
the option of reporting more than one race.
Therefore, two basic ways of defining a race
group are possible. A group such as Asian
may be defined as those who reported Asian
and no other race (the race-alone or singlerace concept) or as those who reported
Asian regardless of whether they also
reported another race (the race-alone-or-incombination concept). The body of this
report (text, figures, and tables) shows data
for women who reported they were the single race White and not Hispanic, women who
reported the single race Black, and women
who reported the single race Asian. Use of
the single-race populations does not imply
that it is the preferred method of presenting
or analyzing data. The Census Bureau uses a
variety of approaches.
For further information, see the Census
2000 Brief, Overview of Race and Hispanic
Origin: 2000, (C2KBR/01-1) <www.census.gov
/population/www/cen2000/briefs.html>.
Hispanics may be any race. Data for the
American Indian and Alaska Native population
are not shown in this report because of their
small sample size in the SIPP. Based on the
population of women who had a first birth
between 2001–2003 surveyed in the 2004
SIPP, 3.2 percent of the single-race Black population and .54 percent of the single-race
Asian population were also Hispanic.
U.S. Census Bureau
Table 2.
Work History of Women During Pregnancy Preceding First Birth by Selected
Characteristics: 2001–2003
Among women who worked while pregnant,
percent who were working—
Characteristic
Number of women
with a first birth
(thousands)
Percent who worked
during pregnancy
Less than 3 months
before child’s birth
Less than 1 month
before child’s birth1
Total . . . . . . . . . . . . . . . .
4,905
67.0
87.1
64.0
Age at First Birth
Less than 18 years . . . . . . . . .
18 and 19 years . . . . . . . . . . . .
20 and 21 years . . . . . . . . . . . .
22 to 24 years . . . . . . . . . . . . . .
25 to 29 years . . . . . . . . . . . . . .
30 years and over . . . . . . . . . .
361
663
619
743
1,259
1,260
29.6
42.2
61.4
66.8
75.9
84.8
82.2
77.9
85.0
82.5
87.9
92.2
56.1
63.2
68.2
51.0
66.0
67.7
Race and Hispanic Origin
White alone . . . . . . . . . . . . . . . .
Non-Hispanic . . . . . . . . . . . . .
Black alone . . . . . . . . . . . . . . . .
Asian alone . . . . . . . . . . . . . . . .
Hispanic (any race) . . . . . . . . .
3,818
2,924
625
280
942
69.6
76.7
55.5
57.9
47.0
88.2
88.4
77.2
91.4
86.5
64.6
65.5
63.4
60.5
60.7
Timing of First Birth2
Before first marriage . . . . . . . .
Within first marriage . . . . . . . . .
After first marriage . . . . . . . . . .
1,896
2,766
243
53.3
74.9
84.4
82.8
89.2
87.3
59.6
65.5
69.8
Educational Attainment
Less than high school . . . . . . .
High school graduate . . . . . . .
Some college . . . . . . . . . . . . . .
Bachelor’s degree or higher . .
692
1,194
1,534
1,485
29.9
59.1
75.1
82.2
81.6
82.4
86.8
91.1
57.5
61.3
63.5
67.1
1
Includes women who responded that they never stopped working during their pregnancy.
Refers to marital status at time of first birth. Before first marriage includes never-married women. After first marriage includes first births outside marriage
or within second or subsequent marriages.
Source: U.S. Census Bureau, Survey of Income and Program Participation, 2004 Panel, Wave 2.
2
women and 47 percent of Hispanic
women.20
percent to 75 percent of women in
other educational categories).
A mother’s educational level is also
associated with the probability that
she worked during her first pregnancy. Table 2 shows that for new
mothers in 2001–2003, those with
a bachelor’s degree or higher were
more likely to have worked during
pregnancy (82 percent) than
women with less education (30
Figure 1 shows how educational
attainment and age at first birth
are related to the likelihood of
working during pregnancy. At
every level of educational attainment, women 25 or older at the
time of their first birth had higher
rates of working during pregnancy
than younger first-time mothers.
Women who became mothers later
in life were more likely to have
worked at some time prior to their
first birth, probably because they
had more years of potential
20
The proportion of women who worked
during pregnancy is not statistically different
between Asian women, Black women, and
Hispanic women.
U.S. Census Bureau
working life before their first birth
than mothers who had their first
birth at younger ages. This finding
may reflect a decision to postpone
pregnancy in order to gain more
work experience, regardless of
their level of education.
Women who had their first child
before their first marriage rather
than within or after their first marriage were less likely to have
worked during pregnancy (53 percent, 75 percent, and 84 percent,
respectively). This difference by
marital status in terms of employment during pregnancy has been
5
consistently noted since
1966–1970.21 Women who have
their first child prior to marriage
are generally younger, more likely
to be a minority race or Hispanic,
and to have lower levels of education. All of these factors are related
to lower levels of employment during pregnancy.22 Women who have
their first birth during or after their
first marriage are more likely to be
older and already in the labor force
at the time they become pregnant.
Figure 1.
Percent of Women Who Worked During Pregnancy
Preceding First Birth by Age at First Birth and
Educational Attainment: 2001–2003
Less than
high school
High school
graduate
Some
college
Bachelor's
degree or higher
83
82
84
75
68
70
65
59
55
Duration of Work During
Pregnancy
Among all first-time mothers who
worked while pregnant, 87 percent
worked into their last trimester (less
than 3 months before their child’s
birth, Table 2) while 64 percent
worked into their last month of
pregnancy. Older mothers were
more likely than younger mothers
to work closer to the end of their
pregnancies. Eighty-nine percent of
mothers 22 and older worked into
the last 3 months of their pregnancy, compared with 82 percent of
mothers less than 22 years of age.
In the early 1960s, high school
dropouts worked longer into their
pregnancy.23 During the 1980s, a
larger proportion of collegeeducated women began to work
into the last trimester of their pregnancy than women with less than a
high school education.24
21
Kristin Smith, Barbara Downs, and
Martin O’Connell. “Maternity Leave and
Employment Patterns: 1961–1995,” Current
Population Reports, P70-79, U.S. Census
Bureau, Washington, DC, 2001. O’Connell,
op. cit., pp. 14–15.
22
Smith, Downs, and O’Connell, op cit.,
Tables C and E. These differences by marital
status were also found to persist in being
related to employment levels in a multivariate analysis controlling for many socioeconomic factors.
23
O’Connell, op. cit., pp. 16–17.
24
Smith, Downs, and O’Connell, op cit.,
pp. 7–9.
6
47
30
27
All ages
Under 25
25 and over
Age at first birth
Source: U.S. Census Bureau, Survey of Income and Program Participation, 2004 Panel,
Wave 2.
By 2001–2003, 91 percent of
college graduates who worked during their pregnancy were employed
into their last trimester, compared
with 82 percent of women who had
not graduated from high school.
Black women were less likely than
other women to work during their
last trimester of pregnancy.
Seventy-seven percent of Black
mothers-to-be worked during their
last trimester of pregnancy, not
statistically significant different
from Hispanics (87 percent) but
statistically less than that of nonHispanic Whites (88 percent) and
Asians (91 percent).
Table 3 shows how late into pregnancy first-time mothers have
worked since 1961. For the
1961–1965 first-birth cohort,
13 percent of those who worked
during pregnancy reported they
stopped working during their first
trimester (6 or more months
before the birth), while 35 percent
worked one month or less before
their child’s birth. By 1986–1990,
the percentage of women who left
work in their first trimester had
declined to 5 percent, while the
proportion working 1 month or
less before their child’s birth more
than doubled to 76 percent. During
1991–1995, 7 percent of women
left work in their first trimester,
compared with 4 percent by the
2001–2003 birth cohort. However,
the proportion working 1 month or
less before their child’s birth
increased from 73 percent in
1991–1995 to 80 percent in
2001–2003.
U.S. Census Bureau
Table 3.
Women Who Worked During Pregnancy Preceding First Birth by When They Stopped
Working: 1961–1965 to 2001–2003
(Numbers in thousands)
Characteristic
1961–
1965
1966–
1970
1971–
1975
1976–
1980
1981–
1985
1986–
1990
1991–
1995
1996–
2000
2001–
2003
Number of women with a first birth . . . . . . .
6,306
6,956
6,920
7,192
8,129
8,568
8,599
8,558
4,905
Number of women who worked during
pregnancy . . . . . . . . . . . . . . . . . . . . . . . . . . .
2,797
3,435
3,700
4,414
5,239
5,758
5,740
5,749
3,287
100.0
34.6
17.1
35.4
12.9
100.0
39.1
18.3
28.4
13.9
100.0
43.1
20.9
22.9
13.1
100.0
58.9
14.7
18.6
7.7
100.0
64.7
13.0
13.5
8.7
100.0
75.7
9.1
10.0
5.2
100.0
72.9
9.0
11.0
7.1
100.0
76.6
8.1
7.9
7.3
100.0
79.7
7.4
8.6
4.3
Percent Distribution of Women by
Number of Months Before First
Birth They Stopped Working1
1
2
3
6
Total . . . . . . . . . . . . . . . . . . . . . . . . .
month or less2 . . . . . . . . . . . . . . . . . . . . . .
months . . . . . . . . . . . . . . . . . . . . . . . . . . . .
to 5 months . . . . . . . . . . . . . . . . . . . . . . . .
or more months . . . . . . . . . . . . . . . . . . . .
1
Among women who worked during pregnancy.
Includes women who responded that they never stopped working during their pregnancy.
Source: 1961–1965 to 1981–1985: Bureau of the Census, Current Population Reports, Series P-23, No. 165 (Work and Family Patterns of American
Women) Tables B-3 and B-6; 1986–1990 to 1991–1995: P70-79 (Maternity Leave and Employment Patterns: 1961–1995), Table D; 1996–2000: P70-103 (Maternity Leave and Employment Patterns: 1961–2000), Table 3; and 2001–2003: Survey of Income and Program Participation, 2004 Panel, Wave 2.
2
Table 4.
Women Who Worked Full-Time During Pregnancy Preceding First Birth by When They
Stopped Working: 1961–1965 to 2001–2003
(Numbers in thousands)
Characteristic
1961–
1965
1966–
1970
1971–
1975
1976–
1980
1981–
1985
1986–
1990
1991–
1995
1996–
2000
2001–
2003
Number of women with a first birth . . . . . . .
6,306
6,956
6,920
7,192
8,129
8,568
8,599
8,558
4,905
Number of women who worked during
pregnancy . . . . . . . . . . . . . . . . . . . . . . . . . . .
Worked full-time (number)1 . . . . . . . . . . .
Worked full-time (percent)2 . . . . . . . . . . . .
2,797
2,502
89.5
3,435
3,074
89.5
3,700
3,291
88.9
4,414
3,821
86.6
5,239
4,387
83.7
5,758
4,992
86.7
5,740
4,690
81.7
5,749
4,846
84.3
3,287
2,802
85.2
Percent Working Full-Time Among
Women Who Stopped Working at
Each Time Interval
1 month or less3 . . . . . . . . . . . . . . . . . . . .
2 months . . . . . . . . . . . . . . . . . . . . . . . . . .
3 to 5 months . . . . . . . . . . . . . . . . . . . . . .
6 or more months . . . . . . . . . . . . . . . . . .
89.5
86.2
91.8
87.5
91.7
90.0
88.5
85.1
90.5
93.7
86.9
80.0
89.7
84.5
79.8
83.2
87.1
76.7
76.6
80.7
90.0
82.1
73.4
72.0
86.1
71.2
66.2
72.4
86.8
84.4
74.0
68.3
87.5
78.6
77.8
69.7
1
Full-time employment status refers to last job held before birth of first child.
Among women who worked during pregnancy.
Includes women who responded that they never stopped working during their pregnancy.
Source: 1961–1965 to 1981–1985: Bureau of the Census, Current Population Reports, Series P-23, No. 165 (Work and Family Patterns of American
Women), Tables B-3 and B-6; 1986–1990 to 1991–1995: P70-79 (Maternity Leave and Employment Patterns: 1961–1995), Table D; 1996–2000: P70-103
(Maternity Leave and Employment Patterns: 1961–2000), Table 4; and 2001–2003: Survey of Income and Program Participation, 2004 Panel, Wave 2.
2
3
The proportion of women who
worked full-time during their pregnancy, according to when they
stopped working, is highlighted in
Table 4. In the 1960s, 90 percent
of women who worked during
pregnancy worked full-time. By the
2001–2003 first-birth cohort, the
U.S. Census Bureau
percentage of working women who
worked full-time during pregnancy
declined to 85 percent.25 By
2001–2003, 70 percent of women
who worked only in their first
trimester had full-time jobs, compared with 88 percent of women
who were still working 1 month or
less before their child’s birth.
25
Bureau of Labor Statistics’ data show
that the percentage of employed workers
working full-time decreased from the 1970s
to the mid-1980s and then began to rise. See
Women in the Labor Force: A Data Book,
Report 985, U.S. Bureau of Labor Statistics,
2005, Table 20, <www.bls.gov/cps
/wlf-databook-2005.pdf>.
7
MATERNITY LEAVE
ARRANGEMENTS
This section first provides an
overview of the changes in maternity leave arrangements since
1980, when comparable questions
on types of leave arrangements
were first asked on SIPP panels.
The report highlights differences in
leave arrangements women use
before and after the birth of their
first child. It concludes with a look
at how the use of various categories of leave differs according to
selected characteristics of women.
Changes in Leave
Arrangements Since the 1980s
Types of leave used by first-time
mothers include paid leave,
unpaid leave, and disability. Other
circumstances that lead to time
away from a job include quitting a
job, being let go from a job, and
having an employer go out of
business. They are included as
types of leave arrangements in
this report. Some women use only
one type of leave while others
may combine several types.
Table 5 shows the changes over
the past 20 years in the type of
leave arrangements used by
women who worked during their
pregnancy. A drop in the proportion quitting their jobs was noted
between the 1981–1985 first-birth
cohort and the subsequent
1986–1990 first-birth cohort from
36 percent to 27 percent. No statistically significant change in the
proportion quitting their job
occurred in the following periods.
Conversely, the percentage of
mothers who took paid leave
(including paid maternity, sick,
vacation leave, and all other paid
leave) increased from 37 percent in
1981–1985 to 43 percent in
1986–1990, remaining at that level
8
MATERNITY LEAVE ARRANGEMENTS
In the 1996, 2001, and 2004 Survey of Income and Program
Participation panels, two separate questions on leave arrangements
were asked of every woman who worked during pregnancy. The first
question concerned arrangements used between the time she
stopped working and when the child was born, while the second
question asked about the arrangements used between the child’s
birth and up to 12 weeks after the child was born. The 1984 and
1985 SIPP panels asked only one question about arrangements used
at any time during pregnancy or up to 6 weeks after the child was
born. If a woman said she had never stopped working during pregnancy, no other leave arrangements were tabulated.
In the 1996, 2001, and 2004 panels, questions about leave arrangements used after the child was born were asked of all women,
including those who reported that they had never stopped working
before the child’s birth. This change from the earlier SIPP panels complicates any comparisons with leave arrangements used by women
prior to 1980. Maternity leave arrangement data for the 1980s were
obtained from the 1996 panel that asked these questions of women
who had a first birth since 1980. Beginning in the 1996 panel, “disability leave” was included as a separate response. Women may have
conceptually included it in either the paid or the unpaid leave categories in the prior SIPP panels.
until 2001–2003, when 49 percent
received paid leave. Employers
may offer paid maternity leave as a
job benefit when they weigh the
costs of finding and training a new
employee against a short leave of
absence.26
For all of the first-birth cohorts,
less than 5 percent of women
reported being let go from their
job while pregnant or within 12
weeks after giving birth. Disability
leave usage over the past two
decades appears to have reached a
high point in 1991–1995 at 11
percent. Unpaid maternity leave
usage increased from 34 percent
to 41 percent during the 1980s,
and further increased to 45 percent by 1996–2000. An apparent
26
A Workable Balance: Report to
Congress on Family and Medical Leave
Policies, U.S. Department of Labor,
Commission on Family and Medical Leave,
Washington, DC, 1996.
6 percentage-point decline in
unpaid maternity leave usage
occurred by 2001–2003, coincidental with the increase in the percentage of women receiving some
type of paid maternity leave.
Leave Arrangements Before
and After the First Birth
Table 6 provides a detailed picture
of leave arrangements—both
before and after their child’s
birth—used by employed women
who had their first birth between
2001 and 2003. Women were
allowed to identify more than one
type of leave arrangement. One in
four women quit their job around
the time of the birth of their child
(25 percent). Seventeen percent of
women quit their job before the
birth of their child, compared with
8 percent who quit after the birth
of their child.
U.S. Census Bureau
Table 5.
Leave Arrangements Used by Women Who Worked During Pregnancy Preceding First
Birth: 1981–1985 to 2001–2003
Year of first birth
1981–1985
1986–1990
1991–1995
1996–2000
2001–2003
Number of
women who
worked during
pregnancy
(thousands)
Quit job
Paid leave2
Unpaid leave3
Disability leave
Let go from job
5,147
5,758
5,740
5,749
3,287
35.7
26.5
26.9
25.6
25.3
37.3
43.3
42.7
42.0
49.1
33.7
41.0
40.3
45.0
39.1
6.3
7.5
11.2
6.9
8.5
3.5
2.3
4.2
2.2
3.8
...................
...................
...................
...................
...................
Percent of women using type of specified leave arrangement1
1
The total in individual leave arrangements exceeds 100 percent because of multiple answers. Leave arrangements may have been used before, or up to,
12 weeks after the birth.
2
Paid leave includes all paid maternity, sick, and vacation leave and other paid leave.
3
Unpaid leave includes all unpaid maternity, sick, and vacation leave and other unpaid leave.
Source: 1981–1985 to 1991–1995: U.S. Census Bureau, Current Population Reports, P70-79 (Maternity Leave and Employment Patterns: 1961-1995), Table
F; 1996–2000: P70-103 (Maternity Leave and Employment Patterns: 1961–2000), Table 5; and 2001–2003: Survey of Income and Program Participation, 2004
Panel, Wave 2.
Table 6.
Detailed Leave Arrangements Used by Women Who Worked During Pregnancy Preceding
First Birth: 2001–2003
Before or after birth1
Before birth
After birth
Number of women who worked during
pregnancy (thousands) . . . . . . . . . . . . . . . . . . . .
3,287
3,287
3,287
Percent Using Leave Arrangement2
Quit job . . . . . . . . . . . . . . . . . . . . . . . . . . . . . . . . . . . . .
Paid leave3 . . . . . . . . . . . . . . . . . . . . . . . . . . . . . . . . .
Maternity leave . . . . . . . . . . . . . . . . . . . . . . . . . . . .
Sick leave . . . . . . . . . . . . . . . . . . . . . . . . . . . . . . . .
Vacation leave . . . . . . . . . . . . . . . . . . . . . . . . . . . .
Other paid leave . . . . . . . . . . . . . . . . . . . . . . . . . . .
Unpaid leave4 . . . . . . . . . . . . . . . . . . . . . . . . . . . . . . .
Maternity leave . . . . . . . . . . . . . . . . . . . . . . . . . . . .
Sick leave . . . . . . . . . . . . . . . . . . . . . . . . . . . . . . . .
Vacation leave . . . . . . . . . . . . . . . . . . . . . . . . . . . .
Other unpaid leave . . . . . . . . . . . . . . . . . . . . . . . .
Disability leave . . . . . . . . . . . . . . . . . . . . . . . . . . . . . .
Other leave . . . . . . . . . . . . . . . . . . . . . . . . . . . . . . . . .
Self-employed . . . . . . . . . . . . . . . . . . . . . . . . . . . . .
Employer went out of business . . . . . . . . . . . . . .
Other . . . . . . . . . . . . . . . . . . . . . . . . . . . . . . . . . . . . .
Let go from job . . . . . . . . . . . . . . . . . . . . . . . . . . . . . .
25.3
49.1
38.6
8.7
9.1
2.8
39.1
28.5
4.4
3.4
5.4
8.5
8.5
1.1
0.4
7.0
3.8
16.9
22.0
17.6
3.4
2.3
0.5
15.5
10.6
1.2
1.8
2.0
3.6
4.2
0.5
0.4
3.3
2.9
8.4
43.4
32.3
6.7
7.4
2.4
34.2
24.8
3.7
2.5
4.2
6.2
5.6
1.0
0.1
4.6
3.0
Type of leave
1
2
3
4
Leave arrangements are only counted once if used before and after birth.
Total in individual leave arrangements exceeds the percent who took leave because of multiple answers.
Paid leave includes all paid maternity, sick, and vacation leave and other paid leave.
Unpaid leave includes all unpaid maternity, sick, and vacation leave and other unpaid leave.
Source: U.S. Census Bureau, Survey of Income and Program Participation, 2004 Panel, Wave 2.
Both paid and unpaid leave (all
types combined) were more likely
to be used after the child’s birth
(43 percent and 34 percent,
respectively) than during pregnancy (22 percent and 16 percent,
respectively). These findings suggest that for women who plan to
U.S. Census Bureau
return to work after having their
child, many may work as long as
possible into their pregnancy in
order to have more leave available
to use once their child is born.
Overall, 39 percent of women
received paid maternity leave and
29 percent of women received
unpaid maternity leave. Both of
these types of leave were more
likely to be used after birth than
before. Whether it was used during
pregnancy or after giving birth,
sick leave and vacation leave were
more likely to be paid than unpaid.
9
Another leave-taking strategy that
women use is to combine different
types of leave. Figure 2 shows the
percentage of women who worked
during pregnancy who used paid
leave only, used unpaid leave only,
quit their job only, and used multiple types of leave. These data are
shown separately for the time during pregnancy, up to 12 weeks
after giving birth, and the combined periods. While 5 percent
used more than one leave arrangement before birth and 12 percent
used more than one type after
birth, 32 percent of women used
multiple leave arrangements in the
combined periods of pregnancy
and up to 12 weeks after giving
birth (different arrangements
before and after their child’s birth).
Using only paid leave was more
common for women after giving
birth than before (33 percent and
18 percent, respectively). The proportion of women who used only
unpaid leave after the birth was
almost twice as high as the proportion who used only unpaid leave
before birth (24 percent and 13 percent, respectively). Among women
who identified quitting their job as
their only leave arrangement, 16
percent quit their job while they
were pregnant while 7 percent quit
their job after giving birth.
Use of Different
Leave Arrangements
This section examines the types of
leave arrangements used by
women—either before or after their
child’s birth—by various social and
demographic characteristics.
Among first-time mothers in
2001–2003, younger women were
more likely than women who had
their first child at a later age to
quit their jobs (Table 7). Forty-one
percent of women who had their
first birth as a teenager quit their
jobs, compared with 20 percent of
10
Figure 2.
Percent of Women Using Selected Leave Arrangements
and Multiple Arrangements Before or After
Their First Birth: 2001–2003
(Among women who worked during pregnancy)
Multiple types
Paid only
33
32
27
24
18
13
Quit only
Unpaid only
19
16
14
12
7
5
Before birth
After birth
Before or after birth
Note: Multiple types of leave used “Before or after birth” include using more than one type
before birth only, after birth only, and using a different type before birth than after birth.
Paid leave includes all paid maternity, sick, and vacation leave and other paid leave.
Unpaid leave includes all unpaid maternity, sick, and vacation leave and other unpaid leave.
Source: U.S. Census Bureau, Survey of Income and Program Participation, 2004 Panel Wave 2.
women who had their first child at
age 25 or older. The proportion of
women using paid leave for their
first birth generally increased with
age, from 27 percent of women
under age 22 at their first birth to
59 percent of those 25 and older.
Older women, who have more
years of labor force experience
than younger women, may benefit
from this experience by receiving
more paid benefits.
Employment characteristics of last
job held during pregnancy are also
associated with the type of leave
arrangements women use for the
birth of their first child. Full-time
workers were more likely to use
paid-leave benefits than part-time
workers (55 percent and 17 percent, respectively), while part-time
workers were more likely to quit
their jobs than were full-time workers (43 percent and 22 percent,
respectively). Women who worked
into the last month of pregnancy
were more likely to receive paidleave benefits (54 percent) than
those who left work 6 months or
more prior to their first birth (23
percent). A small proportion of
women who worked until their last
month of pregnancy were let go
from their job (2 percent).
Increasing levels of education go
hand-in-hand with increases in the
use of paid-leave benefits. Sixty
percent of women with a bachelor’s degree or more used paid
leave, compared with 22 percent
of women who had less than a
high school education. The use of
unpaid maternity leave did not differ statistically between women
who had less than a high school
education and those with a bachelor’s degree or more. Almost twice
as many women who had less than
a high school education quit their
jobs as did women who had a
bachelor’s degree or more (37 percent and 19 percent, respectively).
U.S. Census Bureau
Table 7.
Type of Leave Arrangements Used Before or After Birth by Women Who Worked During
Pregnancy Preceding Their First Birth by Selected Characteristics: 2001–2003
Number of
women who
worked during
pregnancy
(thousands)
Quit job
Paid leave1
Unpaid
leave2
Disability
leave
Let go
from job
Total . . . . . . . . . . . . . . . . . . . . . . . . . .
3,287
25.3
49.1
39.1
8.5
3.8
Employment Status at Last Job
Full-time . . . . . . . . . . . . . . . . . . . . . . . . . . . . .
Part-time . . . . . . . . . . . . . . . . . . . . . . . . . . . . .
2,802
486
22.2
42.6
54.7
16.7
37.8
46.1
9.0
5.3
3.5
6.0
Month Stopped Working Before Birth
1 month or less3 . . . . . . . . . . . . . . . . . . . . . .
2 months . . . . . . . . . . . . . . . . . . . . . . . . . . . . .
3 to 5 months . . . . . . . . . . . . . . . . . . . . . . . . .
6 or more months . . . . . . . . . . . . . . . . . . . . .
2,620
243
284
140
18.5
39.1
56.0
65.0
53.7
43.2
24.6
22.9
41.3
42.8
19.7
29.3
9.1
8.2
5.6
2.1
1.6
2.9
22.5
8.6
Age at First Birth
Less than 18 years . . . . . . . . . . . . . . . . . . . .
18 and 19 years . . . . . . . . . . . . . . . . . . . . . .
20 and 21 years . . . . . . . . . . . . . . . . . . . . . .
22 to 24 years . . . . . . . . . . . . . . . . . . . . . . . .
25 to 29 years . . . . . . . . . . . . . . . . . . . . . . . .
30 years and over . . . . . . . . . . . . . . . . . . . . .
107
280
380
496
955
1,069
49.5
37.9
29.5
31.7
19.0
20.8
9.3
26.4
33.2
40.7
56.0
62.3
51.4
46.1
41.8
38.9
38.4
35.6
5.6
2.5
6.8
7.9
7.1
12.4
4.7
5.7
3.7
5.6
4.4
2.0
Race and Hispanic Origin
White alone . . . . . . . . . . . . . . . . . . . . . . . . . .
Non-Hispanic . . . . . . . . . . . . . . . . . . . . . . .
Black alone . . . . . . . . . . . . . . . . . . . . . . . . . . .
Asian alone . . . . . . . . . . . . . . . . . . . . . . . . . .
2,658
2,244
347
162
25.4
24.7
23.6
21.0
48.9
50.1
49.6
56.8
39.2
39.5
40.6
35.8
8.2
8.5
5.5
17.9
4.4
4.1
2.6
–
Hispanic (any race) . . . . . . . . . . . . . . . . . . . .
443
27.5
42.4
38.1
7.0
5.9
Timing of First Birth
Before first marriage . . . . . . . . . . . . . . . . . . .
Within first marriage . . . . . . . . . . . . . . . . . . .
After first marriage . . . . . . . . . . . . . . . . . . . .
1,011
2,071
205
30.8
23.3
18.0
35.9
54.5
59.0
43.2
37.7
32.7
5.8
10.2
4.4
6.5
2.2
6.8
Educational Attainment
Less than high school . . . . . . . . . . . . . . . . .
High school graduate . . . . . . . . . . . . . . . . . .
Some college . . . . . . . . . . . . . . . . . . . . . . . . .
Bachelor’s degree or more . . . . . . . . . . . . .
207
706
1,152
1,221
37.2
31.4
26.3
18.8
21.7
39.1
48.5
60.0
45.9
38.2
41.3
36.4
1.4
7.6
7.6
10.9
8.2
4.4
4.0
2.6
Characteristic
Percent of women using specified leave arrangement
4
– Represents zero or rounds to zero.
1
Paid leave includes all paid maternity, sick, and vacation leave and other paid leave.
2
Unpaid leave includes all unpaid maternity, sick, and vacation leave and other unpaid leave.
3
Includes women who responded that they never stopped working during their pregnancy.
4
Refers to marital status at time of first birth. Before first marriage includes never-married women. After first marriage includes first births outside or within
second or subsequent marriages.
Note: The total in individual leave arrangements exceeds 100 percent because of multiple answers. Leave arrangements may have been used before or up
to 12 weeks after the birth.
Source: U.S. Census Bureau, Survey of Income and Program Participation, 2004 Panel, Wave 2.
In the early 1960s, the use of paid
maternity leave for a first birth did
not differ statistically by educational level. The relationship
between educational attainment
and use of paid leave began to
appear in the early 1970s and
became pronounced by the early
U.S. Census Bureau
1980s (Figure 3). The percentage
of women with a bachelor’s degree
or more who received paid leave
increased from 27 percent for the
1971–1975 first-birth cohort to 59
percent for those with a first birth
between 1981–1985 and remained
at 60 percent of new mothers
between 2001 and 2003. The use
of paid leave by mothers with less
than a high school degree was 22
percent in 2001–2003, not statistically different from the levels in
prior first-birth cohorts shown in
Figure 3.
11
Figure 3.
Percent of Women Who Received Paid Leave Before or After Their First Birth by
Educational Attainment: Selected Years, 1961–1965 to 2001–2003
Less than high school
High school graduate
Some college
Bachelor's degree or higher
63
60
59
49
49
43
16
16
18
22
39
29
27
26
19
40
22
20
18
14
1961-1965
1971-1975
1981-1985
1991-1995
2001-2003
Note: Paid leave includes all paid maternity, sick, and vacation leave and other paid leave used before the birth and up to 12 weeks after the birth.
Source: 1961–1965 to 1971–1975: Bureau of the Census, Current Population Reports, Series P23-165 (Work and Family Patterns of American
Women), Table B-9; 1981–1985 to1991–1995: P70-79 (Maternity Leave and Employment Patterns: 1961-1995), Figure 4; and 2001–2003:
Survey of Income and Program Participation, 2004 Panel, Wave 2.
In summary, many changes have
occurred in mothers’ employment
during and after pregnancy since
the 1960s. Women are now working longer into their pregnancy.
Paid benefits are more likely to be
received by more educated
women, those who work at fulltime jobs, and those who work
very close to their child’s birth.
WORKING AFTER THE
FIRST BIRTH
This section looks at how rapidly
women begin working after the
birth of their first child. Overall
trends since the 1960s will be
examined. Also, recent data from
the 2004 SIPP panel are analyzed
to determine the characteristics of
women who start working most
rapidly and whether changing
12
employer after birth is related to
changes in job characteristics.
Trends Since the 1960s
Figure 4 shows the monthly
employment paths of women during their first pregnancy and for the
first 12 months after their child’s
birth. Clearly, women in the most
recent first-birth cohort of 2000–
2002 worked longer into their pregnancy and started working after
childbirth sooner than their counterparts in the early 1960s. As shown
in Figure 4, most of the increases in
the percentage of women working
later into their pregnancy and working after their first birth came about
by the early 1980s.
This trend is also evident in
Table 8, which shows the monthly
cumulative percentage of women
working after the birth of their first
child. In the early 1960s, 14 percent of all mothers with newborns
were working by the sixth month,
increasing to 17 percent by the
twelfth month. These percentages
more than doubled by 1976–1980,
with further increases occurring by
1986–1990. By 2000–2002, 55
percent of mothers were working
by the sixth month after their
child’s birth and 64 percent by the
twelfth month, not statistically different from the proportions
recorded for 1986–1990.27
27
The time period of analysis for working
after a first birth is restricted to those who
gave birth by 2002 because some who gave
birth in 2003 did not have one full year of
employment data by the time of the interview in 2004.
U.S. Census Bureau
Figure 4.
Percent of Women Working During Pregnancy and Percent Working
After Their First Birth by Month Before or After Birth: Selected Years,
1961–1965 to 2000–2002
Working during pregnancy
Working after birth
Cumulative percent
70
60
2000–2002
2000–2002
1991–1994
1981–1984
1991–1994
50
1971–1975
40
1961–1965
1981–1984
30
1971–1975
20
10
0
1961–1965
9
8
7
6
5
4
3
Months before birth
2 1 month
or less
1 month 2
or less
3
4
5
6
7
8
9
10
11
12
Months after birth
Source: 1961–1965 to 1981–1984: Bureau of the Census, Current Population Reports, Series P-23, No. 165 (Work and Family Patterns of
American Women), Table B-5; 1991–1994: P70-79 (Maternity Leave and Employment Patterns: 1961–1995), Figure 7; and 2000–2002: Survey
of Income and Program Participation, 2004 Panel, Wave 2.
Not all women begin working at
the same interval after their child’s
birth. Table 8 shows the relationship between work experience during pregnancy and the rate at
which women work in the first
year after giving birth for the periods 1961–1965 to 2000–2002.
Among women who worked during
their pregnancy, 17 percent of
women in the 1961–1965 firstbirth cohort returned to work 3
months after their child’s birth.
Twenty years later, this percentage
increased to 46 percent for the
1981–1984 first-birth cohort and
to 58 percent for the 2000–2002
first-birth cohort. Women who did
not work during their first pregnancy have considerably lower percentages working at this 3-month
interval: 5 percent (1961–1965),
U.S. Census Bureau
10 percent (1981–1984), and 12
percent (2000–2002) for these
three first-birth cohorts.28 This suggests that a prior employeremployee relation is likely to be an
important determinant in employment after a woman’s first birth.
Characteristics of Mothers
To examine the characteristics of
women by when they returned to
work, data are shown in Table 9 in
two ways: for all mothers and for
mothers who worked during pregnancy. This latter group, women
who worked during pregnancy, is
used to control for the negative
effect of job-search costs on the
28
There is no statistical difference among
women who did not work during their first
pregnancy between the 1981–1984 and
2000–2002 birth cohorts.
likelihood of securing work for
those not being employed during
pregnancy. Characteristics are
shown by time intervals of when
mothers started working after the
child’s birth—less than 3 months, 3
to 5 months, or 6 to 11 months
after the child’s birth. To complete
the distribution, proportions are
also shown for women who were
not working within the first year
after their child’s birth.29
29
The June 2002 Current Population
Survey found that 59.8 percent of women
who had their first birth in the year prior to
the survey were in the labor force at the time
of the interview. (See Jane Lawler Dye,
Fertility of American Women: June 2004,
Current Population Reports, P20-555, U.S.
Census Bureau, Washington, DC, 2005,
Table 4.) The SIPP for the period 2000–2002
shows that 62.6 percent of women who had a
birth in this period had ever worked within 12
months of their child’s birth (Table 9).
13
Table 8.
Women Working at Monthly Intervals After First Birth by Year of First Birth: 1961–1965 to
2000–2002
Characteristic
1961–
1965
1966–
1970
1971–
1975
1976–
1980
1981–
1984
1986–
1990
1991–
1994
1996–
1999
2000–
2002
6,306
100.0
6,956
100.0
6,920
100.0
7,192
100.0
6,671
100.0
8,568
100.0
6,995
100.0
6,918
100.0
5,077
100.0
9.9
13.7
16.8
12.7
18.3
23.9
15.6
21.9
27.9
22.4
32.2
38.8
32.9
43.5
52.5
41.6
52.9
60.8
40.8
52.3
60.1
44.7
57.2
64.6
42.4
55.0
63.7
2,797
100.0
3,435
100.0
3,700
100.0
4,414
100.0
4,237
100.0
5,758
100.0
4,621
100.0
4,592
100.0
3,386
100.0
16.5
21.4
25.8
19.6
26.7
32.7
24.1
32.1
38.8
32.6
45.4
52.6
46.0
59.3
69.7
57.3
70.6
78.6
57.3
70.4
77.7
59.7
74.8
81.5
57.7
72.4
79.4
3,509
100.0
3,522
100.0
3,221
100.0
2,778
100.0
2,434
100.0
2,810
100.0
2,374
100.0
2,327
100.0
1,691
100.0
4.6
7.5
9.6
6.0
10.2
15.3
5.9
10.1
15.3
6.3
11.1
16.8
9.9
16.2
22.5
9.4
16.6
24.3
8.7
17.3
25.8
15.1
22.5
31.2
11.8
20.1
32.2
Women With a First Birth
Number of women (thousands) . .
Percent . . . . . . . . . . . . . . . . . . . . . . .
Cumulative percent working after:
3 months . . . . . . . . . . . . . . . . . . . .
6 months . . . . . . . . . . . . . . . . . . . .
12 months . . . . . . . . . . . . . . . . . . .
Women Who Worked During
Pregnancy
Number of women (thousands) . .
Percent . . . . . . . . . . . . . . . . . . . . . . .
Cumulative percent working after:
3 months . . . . . . . . . . . . . . . . . . . .
6 months . . . . . . . . . . . . . . . . . . . .
12 months . . . . . . . . . . . . . . . . . . .
Women Who Did Not Work
During Pregnancy
Number of women (thousands) . .
Percent . . . . . . . . . . . . . . . . . . . . . . .
Cumulative percent working after:
3 months . . . . . . . . . . . . . . . . . . . .
6 months . . . . . . . . . . . . . . . . . . . .
12 months . . . . . . . . . . . . . . . . . . .
Note: 2000–2002 estimates are used for the most recent birth cohort to allow for at least 1 year of post-birth employment data. No data are available for
either the 1985 or 1995 birth cohort for the full calendar year to derive the work after birth proportion.
Source: 1961–1965 to 1981–1984: Bureau of the Census, Current Population Reports, Series P-23, No.165 (Work and Family Patterns of American
Women), Table B-5; 1986–1990 to 1991–1994: P70-79 (Maternity Leave and Employment Patterns: 1961–1995), Table I; 1996–1999: P70-103 (Maternity Leave
and Employment Patterns: 1961–2000), Table 8; and 2000–2002: Survey of Income and Program Participation, 2004 Panel, Wave 2.
Some women may be motivated to
maintain ties to the labor force
because of career goals or because
their jobs offer attractive leave
benefits and do not penalize them
for choosing to become mothers.
They may also feel they have too
much invested in their careers in
terms of education, training, and
wages to leave the labor force.30
Previous research has shown that
in the 1960s and 1970s, those
who were most economically in
need of and dependent on their
own earnings (teenagers, Black
30
Sonalde Desai and Linda Waite,
“Women’s Employment During Pregnancy and
After the First Birth: Occupational
Characteristics and Work Commitment,”
American Sociological Review, Vol. 56, 1991,
pp. 551–556.
14
women, and women with premarital first births) returned to work
the most rapidly.31
Table 9 shows that for 2000–2002,
older first-time mothers were more
likely to work in the first few
months after giving birth than
younger first-time mothers.
Twenty-eight percent of mothers
30 or older were working within 3
months, compared with 15 percent
of mothers less than 18 years old.
Most of these women were old
enough to have completed high
school or college and were potentially old enough to have had some
work experience prior to the
child’s birth.
31
O’Connell, op. cit., pp. 23–25.
In terms of education, women with
a high school degree, some college, or a bachelor’s degree or
more were more likely to work in
the first 3 months after their child’s
birth (30 percent or more) than
women with less than a high
school degree (14 percent). Women
with less than a high school
degree were most likely not to
work at all in the year after their
first child’s birth (62 percent). A
larger percentage of non-Hispanic
White women than Hispanic
women were working within 3
months after childbirth (34 percent
compared with 25 percent) and a
smaller percentage did not work in
the first year (33 percent and 52
percent, respectively).
U.S. Census Bureau
Table 9.
Women Working at Stated Time Intervals After First Birth by Selected Characteristics:
2000–2002
Women with a first birth who worked
during pregnancy
All women with a first birth
Started working after first birth
Characteristic
Number . . . . . . . . . . . . . . . . . . . . . .
PERCENT DISTRIBUTION
Total . . . . . . . . . . . . . . . . .
Started working after first birth
Total
(thousands)
Less
than 3
months1
3 to 5
months
6 to 11
months
Did not
work
during
first
year2
Total
(thousands)
Less
than 3
months1
3 to 5
months
6 to 11
months
Did not
work
during
first
year2
5,077
1,553
1,096
528
1,899
3,386
1,404
954
296
732
100
30.6
21.6
10.4
37.4
100.0
41.5
28.2
8.7
21.6
Employment Status During
Pregnancy
Not employed . . . . . . . . . . . . . . .
Full-time . . . . . . . . . . . . . . . . . . . . .
Part-time . . . . . . . . . . . . . . . . . . . .
1,691
2,928
458
8.9
42.1
37.1
8.5
29.1
22.3
13.7
8.3
11.8
69.0
20.5
29.0
(X)
2,928
458
(X)
42.1
37.1
(X)
29.1
22.3
(X)
8.3
11.8
(X)
20.5
29.0
Age at First Birth
Less than 18 years . . . . . . . . . . .
18 and 19 years . . . . . . . . . . . . .
20 and 21 years . . . . . . . . . . . . .
22 to 24 years . . . . . . . . . . . . . . .
25 to 29 years . . . . . . . . . . . . . . .
30 years and over . . . . . . . . . . .
405
723
699
747
1,275
1,227
15.3
24.6
36.9
31.6
37.3
28.0
12.1
15.1
19.0
18.5
22.7
30.6
9.1
18.4
13.3
8.3
7.2
9.0
63.5
41.8
30.6
41.6
32.7
32.4
118
326
441
493
978
1,029
37.3
49.4
53.1
43.2
43.8
31.5
11.0
21.5
22.4
25.8
28.7
35.4
16.1
15.0
10.0
7.3
6.9
7.8
35.6
14.4
14.3
23.5
20.8
25.4
Race and Hispanic Origin
White alone . . . . . . . . . . . . . . . . .
Non-Hispanic . . . . . . . . . . . . . .
Black alone . . . . . . . . . . . . . . . . .
Asian alone . . . . . . . . . . . . . . . . .
3,908
3,036
679
260
32.2
34.1
26.1
21.2
21.0
23.1
25.0
24.2
9.7
10.0
16.5
5.4
37.2
32.8
32.4
49.2
2,684
2,283
384
167
42.6
41.8
38.5
29.9
27.9
28.5
33.1
27.5
8.3
8.3
9.9
8.4
21.2
21.4
18.2
34.1
Hispanic (any race) . . . . . . . . . .
941
25.3
13.8
9.0
51.9
442
46.6
23.3
9.5
20.6
Timing of First Birth3
Before first marriage . . . . . . . . .
Within first marriage . . . . . . . . . .
After first marriage . . . . . . . . . . .
2,016
2,821
240
28.7
31.0
41.7
17.4
24.8
19.2
14.7
7.4
8.8
39.2
36.8
30.0
1,084
2,115
186
46.2
39.0
41.9
23.5
30.9
24.2
11.6
7.4
7.5
18.7
22.7
25.8
Educational Attainment
Less than high school . . . . . . . .
High school graduate . . . . . . . . .
Some college . . . . . . . . . . . . . . . .
Bachelor’s degree or higher . . .
677
1,255
1,665
1,481
13.6
33.0
34.9
31.5
13.7
15.9
19.2
32.7
10.9
11.5
10.6
9.0
61.7
39.7
35.3
26.7
208
717
1,207
1,254
37.5
47.6
45.5
34.8
25.0
20.4
23.2
38.0
11.1
11.3
8.0
7.7
26.4
20.8
23.4
19.6
Month Stopped Working
Before Birth
1 month or less1 . . . . . . . . . . . . .
2 months . . . . . . . . . . . . . . . . . . .
3 to 5 months . . . . . . . . . . . . . . .
6 or more months . . . . . . . . . . . .
( 5)
( 5)
( 5)
( 5)
(5)
(5)
(5)
(5)
( 5)
( 5)
( 5)
( 5)
(5)
(5)
(5)
(5)
( 5)
( 5)
( 5)
( 5)
2,717
250
281
137
44.9
39.2
22.4
16.8
30.2
18.8
21.7
17.5
6.8
9.6
14.6
33.6
18.1
32.4
41.3
32.1
Type of Leave Arrangement
Used4
Quit job . . . . . . . . . . . . . . . . . . . . .
Paid leave . . . . . . . . . . . . . . . . . .
Unpaid leave . . . . . . . . . . . . . . . .
Disability leave . . . . . . . . . . . . . .
Let go from job . . . . . . . . . . . . . .
Other leave . . . . . . . . . . . . . . . . .
( 5)
( 5)
( 5)
( 5)
( 5)
( 5)
(5)
(5)
(5)
(5)
(5)
(5)
( 5)
( 5)
( 5)
( 5)
( 5)
( 5)
(5)
(5)
(5)
(5)
(5)
(5)
( 5)
( 5)
( 5)
( 5)
( 5)
( 5)
845
1,717
1,312
239
108
294
23.1
42.2
46.6
33.1
21.3
36.1
14.1
33.4
33.9
43.5
23.1
26.2
14.3
8.0
8.5
5.0
10.2
7.5
48.5
16.3
10.8
18.8
45.4
30.3
(X) Not applicable.
1
Includes women who responded that they never stopped working during their pregnancy or after their birth.
Includes women who were working after one year and those who never returned to work.
Refers to marital status at time of first birth. Before first marriage includes never-married women. After first marriage includes first births outside or within
second or subsequent marriages.
4
Leave arrangement may have been used before or after the birth. The total in individual leave arrangements exceed 100 percent because of multiple
answers.
5
Only applicable for women who worked during pregnancy.
2
3
Note: 2000–2002 estimates are used for the most recent birth cohort to allow for at least one year of post-birth employment data.
Source: U S Census Bureau Survey of Income and Program Participation 2004 Panel Wave 2
U.S. Census Bureau
15
The variations in the timing of
returning to work previously noted
diminish or disappear when only
women who worked during pregnancy are considered. For example,
among all mothers, 14 percent of
mothers with less than a high
school education were working
within 3 months of their child’s
birth, compared with 32 percent of
mothers with a bachelor’s degree
or more. Among mothers who
worked during pregnancy, there
was no statistically significant difference in the percentage returning
within 3 months between those
without a high school education
and those with a bachelor’s degree
or more (38 percent and 35 percent, respectively).
About 25 percent of Hispanic mothers, regardless of their work status
during pregnancy, were working
less than 3 months after their
child’s birth, compared with 34 percent of non-Hispanic White mothers.
However, among those mothers
who worked during their pregnancy, the reverse relationship was
noted—47 percent of Hispanics and
42 percent of non-Hispanic Whites
were working within 3 months of
giving birth.32
For women who worked during
pregnancy, when they returned to
work after their child’s birth was
related to when they left work during their pregnancy. Women who
worked later into their pregnancy
were more likely to return to work
sooner than those who left work
earlier in their pregnancy. For example, 45 percent of women who
32
The proportion of women who were
working less than 3 months after their child’s
birth was statistically different for Hispanic
women and non-Hispanic White women.
16
stopped working 1 month or less
prior to their child’s birth were back
at work within 3 months of their
birth. In comparison, 17 percent of
women who left 6 or more months
before their child’s birth went back
to work within 3 months.
The type of leave arrangement
women used was also related to
when or if they returned to work in
the first year after having their
child. Women who said they quit a
job around the time of their first
birth were less likely to return to
work in the first year of their
child’s birth—49 percent compared
with 16 percent of women who
used paid-leave arrangements. In
contrast, women who used paid
leave at any time during their pregnancy or after their child’s birth
were more likely to return to work
less than 3 months after their
child’s birth (42 percent) than were
women who quit their jobs around
the time of their first child’s birth
(23 percent). Women who quit their
job during pregnancy or after their
child’s birth would likely have to
expend job-search time to find
new employment before they could
go back to work.
Job Characteristics
Before and After Birth
For the 2000–2002 cohort of first
births, 83 percent of the women
who worked during their pregnancy and who returned to work
within 12 months of their child’s
birth returned to their pre-birth
employer (Table 10). Seventy-eight
percent of those who returned to
their pre-birth employer experienced no change in the number of
hours they worked per week,
about the same as in 1991–1994.
About 1 of 5 women worked fewer
hours after having their first child
for the 1991–1994 and 2000–2002
birth cohorts. For both of these
first-birth cohorts, about 9 of 10
women returning to their pre-birth
employer earned around the same
pay and 98 percent were at the
same or higher job skill level as
before their birth.
Compared with mothers who
returned to their pre-birth employers, a larger proportion of women
who changed employers for their
first job after childbirth experienced change in at least one of
their job characteristics. For the
2000–2002 first-birth cohort, 22
percent of women who changed
employers maintained consistency
in hours, pay, and skill level before
and after the birth of their child,
compared with 71 percent of
women who had the same
employer. Fifty-three percent of
new mothers in 2000–2002 who
changed employers worked the
same number of hours after the
child’s birth, compared with 42
percent in the 1991–1994 cohort.
For women who had their first child
between 2000 and 2002, those who
switched employers were more
likely to have a change in salary.
Thirty-one percent of women who
changed employers, compared with
91 percent of women who returned
to the same employer, had jobs at
the same pay level. Some women
may have switched employers with
better compensation in mind, as 35
percent of those who switched
received higher pay, compared with
7 percent of women who stayed
with the same employer. However,
34 percent took jobs with different
employers at a lower pay level,
compared with 2 percent who
returned to the same employer.
U.S. Census Bureau
Table 10.
Job Characteristics of Women Who Worked During Pregnancy Preceding First Birth and
Returned to Work Within 12 Months After Birth: 1991–1994 to 2000–2002
Characteristic
1991–1994
1995–1999
2000–2002
Women who returned to work (thousands)1 . . . . . . . . . . . . . . . . . . . .
3,539
4,466
2,586
Returned to Pre-Birth Employer
Number of women (thousands) . . . . . . . . . . . . . . . . . . . . . . . . . . . . . . . . .
Percent (among women returning to work) . . . . . . . . . . . . . . . . . . . . . . .
2,750
77.7
3,388
75.9
2,146
83.0
Percent Among Women Returning to Pre-Birth Employer
Number of hours worked after first birth . . . . . . . . . . . . . . . . . . . . . . . . .
More than before first birth . . . . . . . . . . . . . . . . . . . . . . . . . . . . . . . . . . . .
Same as before first birth . . . . . . . . . . . . . . . . . . . . . . . . . . . . . . . . . . . . .
Fewer than before first birth . . . . . . . . . . . . . . . . . . . . . . . . . . . . . . . . . . .
100.0
2.8
77.2
20.0
100.0
2.7
77.6
19.7
100.0
1.9
78.4
19.8
Pay level after first birth . . . . . . . . . . . . . . . . . . . . . . . . . . . . . . . . . . . . . . .
Higher than before first birth . . . . . . . . . . . . . . . . . . . . . . . . . . . . . . . . . .
Same as before first birth . . . . . . . . . . . . . . . . . . . . . . . . . . . . . . . . . . . . .
Lower than before first birth . . . . . . . . . . . . . . . . . . . . . . . . . . . . . . . . . . .
100.0
7.5
88.3
4.1
100.0
7.9
89.0
3.1
100.0
7.0
91.1
1.8
Skill level after first birth . . . . . . . . . . . . . . . . . . . . . . . . . . . . . . . . . . . . . . .
Higher than before first birth . . . . . . . . . . . . . . . . . . . . . . . . . . . . . . . . . .
Same as before first birth . . . . . . . . . . . . . . . . . . . . . . . . . . . . . . . . . . . . .
Lower than before first birth . . . . . . . . . . . . . . . . . . . . . . . . . . . . . . . . . . .
100.0
5.6
92.6
1.8
100.0
3.6
94.1
2.3
100.0
3.0
95.3
1.7
Hours, pay, and skill level all the same as before . . . . . . . . . . . . . . . . .
69.1
70.5
71.1
Different Employer After First Birth
Number of women (thousands) . . . . . . . . . . . . . . . . . . . . . . . . . . . . . . . . .
Percent (among women returning to work) . . . . . . . . . . . . . . . . . . . . . . .
790
22.3
1,078
24.1
440
17.0
Percent Among Women Returning to Different Employer
Number of hours worked after first birth . . . . . . . . . . . . . . . . . . . . . . . . .
More than before first birth . . . . . . . . . . . . . . . . . . . . . . . . . . . . . . . . . . . .
Same as before first birth . . . . . . . . . . . . . . . . . . . . . . . . . . . . . . . . . . . . .
Fewer than before first birth . . . . . . . . . . . . . . . . . . . . . . . . . . . . . . . . . . .
100.0
22.7
41.6
35.8
100.0
19.6
47.7
32.7
100.0
13.6
53.4
33.2
Pay level after first birth . . . . . . . . . . . . . . . . . . . . . . . . . . . . . . . . . . . . . . .
Higher than before first birth . . . . . . . . . . . . . . . . . . . . . . . . . . . . . . . . . .
Same as before first birth . . . . . . . . . . . . . . . . . . . . . . . . . . . . . . . . . . . . .
Lower than before first birth . . . . . . . . . . . . . . . . . . . . . . . . . . . . . . . . . . .
100.0
38.0
34.7
27.3
100.0
34.0
41.4
24.7
100.0
35.2
30.9
34.1
Skill level after first birth . . . . . . . . . . . . . . . . . . . . . . . . . . . . . . . . . . . . . . .
Higher than before first birth . . . . . . . . . . . . . . . . . . . . . . . . . . . . . . . . . .
Same as before first birth . . . . . . . . . . . . . . . . . . . . . . . . . . . . . . . . . . . . .
Lower than before first birth . . . . . . . . . . . . . . . . . . . . . . . . . . . . . . . . . . .
100.0
24.8
53.9
21.2
100.0
28.0
53.1
18.9
100.0
22.7
55.7
21.6
Hours, pay, and skill level all the same as before . . . . . . . . . . . . . . . . .
16.0
21.3
22.3
1
Excludes self-employed women and women whose pre-birth employer went out of business.
Note: 2000–2002 estimates are used for the most recent birth cohort to allow for at least 1 year of post-birth employment data.
Source: 1991–1994: U.S. Census Bureau, Current Population Reports, P70-79 (Maternity Leave and Employment Patterns: 1961–1995), Table K;
1995–1999: Survey of Income and Program Participation (SIPP), 2001 Panel, Wave 2; and 2000–2002: SIPP, 2004 Panel, Wave 2.
In the 2000–2002 first-birth
cohort, 95 percent of women
returning to their pre-birth
employer worked at a job requiring
the same level of skill as before
the birth of their first child compared with 56 percent of women
U.S. Census Bureau
who switched employers. Twentythree percent of women who
changed employers took jobs at a
higher skill level compared with 3
percent of women who returned to
the same employer. However, a
larger proportion of those who
took jobs with a new employer
took a job at a lower skill level
than they held during pregnancy
(22 percent) than did women who
returned to the same employer
(2 percent).
17
CONCLUSIONS
SOURCE OF THE DATA
Since the 1960s, women have
experienced gains in education
beyond the high school years and
have continued to delay childbearing to older ages. The work experience of women both before and
during the pregnancy preceding
the birth of their first child has
also increased. Women are more
likely to work both before and during their pregnancy than they were
30 to 40 years ago and are working later into their pregnancy.
Sixty-four percent of women who
worked during their pregnancy in
2001–2003 did so into the last
month of their pregnancy. In addition, more women are working
within a year of giving birth (64
percent in 2000–2002 compared
with 39 percent in 1976–1980 and
17 percent in 1961–1965).
The population represented (the
population universe) in the 1984,
1985, 1996, 2001, and 2004 panels
of the SIPP is the civilian noninstitutionalized population living in the
United States. The SIPP is a longitudinal survey conducted at 4-month
intervals. The employment history
and maternity leave information
were part of the Fertility History
topical module collected in the SIPP
panels referenced below. The data
in this report were collected from
June through September 2004
(2004 Panel), June through
September 2001 (2001 Panel),
August through November 1996
(1996 Panel), January through April
1986 (1985 Panel), and January
through March 1986 (1984 Panel).
The number of designated housing
units in sample in Wave 1 was
62,700 (2004 Panel), 50,500 (2001
Panel), 49,200 (1996 Panel), 17,800
(1985 Panel), and 26,000 (1984
Panel). The number of eligible units
and the number interviewed in
Wave 1 were 51,400 and 43,700 for
the 2004 Panel; 40,500 and 35,000
for the 2001 Panel; 40,100 and
36,700 for the 1996 Panel; 14,400
and 13,400 for the 1985 Panel; and
20,900 and 19,900 for the 1984
Panel. In Wave 2 of the 2004 Panel,
40,600 interviews were obtained
from 44,100 eligible units. In Wave
2 of the 2001 Panel, 28,100 interviews were obtained from 30,500
eligible units. In Wave 2 of the 1996
Panel, 35,000 interviews were
obtained from 37,500 eligible units.
In Wave 4 of the 1985 Panel,
11,400 interviews were obtained
from 13,500 eligible units. In Wave
8 of the 1984 Panel, 11,100 interviews were obtained from 13,500
eligible units.
One in four women quit their jobs
before or shortly after the birth of
their child in 2001–2003. Paid
leave benefits were received by 49
percent of pregnant workers in
2001–2003; 39 percent of pregnant workers received unpaid
leave; and 9 percent took disability
leave. Data in this report also show
that 83 percent of mothers who
returned to work within 12 months
of their child’s birth returned to
their same employer. Women who
returned to their same employer
had a good chance of returning to
a job with the same pay, skill level,
and hours.
Overall, these findings indicate that
women are staying longer at work,
returning more rapidly after having
their first child, and, in general,
choosing to incorporate work life
with childbearing and childrearing
more than did women in the 1960s.
18
The institutionalized population,
which is excluded from the population universe, is composed primarily of the population in correctional institutions and nursing
homes (91 percent of the 4.1 million institutionalized population in
Census 2000).
ACCURACY OF
THE ESTIMATES
Statistics from surveys are subject
to sampling and nonsampling error.
All comparisons presented in this
report have taken sampling error
into account and are significant at
the 90-percent confidence level
unless otherwise noted. This means
the 90-percent confidence interval
for the difference between the estimates being compared does not
include zero. Nonsampling errors in
surveys may be attributed to a variety of sources, such as how the survey was designed, how respondents
interpret questions, how able and
willing respondents are to provide
correct answers, and how accurately the answers are coded and
classified. To minimize these errors,
the Census Bureau employs quality
control procedures throughout the
production process including the
overall design of surveys, the wording of questions, review of the work
of interviewers and coders, and statistical review of reports. The SIPP
weighting procedure uses ratio estimation, whereby sample estimates
are adjusted to independent estimates of the national population by
age, race, sex, and Hispanic origin.
This weighting partially corrects for
bias due to undercoverage, but
biases may still be present when
people who are missed by the
survey differ from those interviewed in ways other than age,
U.S. Census Bureau
race, sex, and Hispanic origin. How
this weighting procedure affects
other variables in the survey is not
precisely known. All of these considerations affect comparisons
across different surveys or
data sources.
For further information on the
source of the data and accuracy of
the estimates, including standard
errors and confidence intervals, go
to <www.sipp.census.gov/sipp
/sourceac/S&A2_SIPP2001_w1tow9
_20050214.pdf> or contact Charles
D. Sissel of the Census Bureau’s
Demographic Statistical Methods
Division via e-mail at
<[email protected]>.
Additional information on the SIPP,
including questions on the topical
modules, can be found at the following Web sites:
<www.sipp.census.gov/sipp
/sourceac/s&a96_040501.pdf>,
<www.sipp.census.gov/sipp/>
(main SIPP Web site),
U.S. Census Bureau
<www.sipp.census.gov/sipp
/workpapr/wp230.pdf>
(SIPP Quality Profile), and
<www.sipp.census.gov/sipp
/usrguide/sipp2001.pdf>
(SIPP User’s Guide).
MORE INFORMATION
The report is available on the
Internet <www.census.gov> by
clicking on the letter “F” in the
“Subjects A to Z” section of the
Web page and selecting “Fertility of
American Women Data.” Scroll
down to the maternity leave data
section. Other research on maternity leave can be found in the following report: Kristin Smith and
Amara Bachu, Women’s Labor Force
Attachment Patterns and Maternity
Leave: A Review of the Literature,
Population Division Working Paper
Series, No. 32, U.S. Census Bureau,
Washington, DC, 1999. This report
is on the Internet on the
“Population: Working Papers” section under “Subjects A to Z.”
CONTACTS
Maternity leave issues:
Tallese D. Johnson
<[email protected]>
USER COMMENTS
The Census Bureau welcomes the
comments and advice of users of
its data and reports. If you have
any suggestions or comments,
please write to:
Chief, Housing and Household
Economic Statistics Division
U.S. Census Bureau
Washington, DC 20233
or send an e-mail inquiry to:
<[email protected]>.
SUGGESTED CITATION
Johnson, Tallese D., 2007.
Maternity Leave and Employment
Patterns: 2001–2003. Current
Population Report, P70-113. U.S.
Census Bureau, Washington, DC.
19
U.S. Department of Commerce
Economics and Statistics Administration
U.S. CENSUS BUREAU
Washington, DC 20233
OFFICIAL BUSINESS
Penalty for Private Use $300
FIRST-CLASS MAIL
POSTAGE & FEES PAID
U.S. Census Bureau
Permit No. G-58


© Copyright 2026