
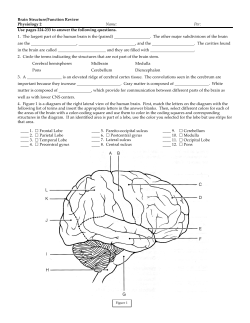
Felt and Seen Pain Evoke the Same Local Patterns of... Activity in Insular and Cingulate Cortex Behavioral/Systems/Cognitive Corrado Corradi-Dell’Acqua,
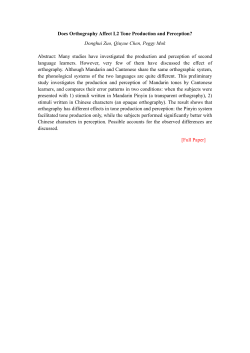
17996 • The Journal of Neuroscience, December 7, 2011 • 31(49):17996 –18006 Behavioral/Systems/Cognitive Felt and Seen Pain Evoke the Same Local Patterns of Cortical Activity in Insular and Cingulate Cortex Corrado Corradi-Dell’Acqua,1,2 Christoph Hofstetter,1,2 and Patrik Vuilleumier1,2 1 Swiss Centre for Affective Sciences, University of Geneva, CH-1205 Geneva, Switzerland, and 2Laboratory for Neurology and Imaging of Cognition, Department of Neurosciences and Clinic of Neurology, University Medical Center, CH-1211 Geneva, Switzerland The discovery of regions in the human brain (e.g., insula and cingulate cortex) that activate both under direct exposure to pain and when perceiving pain in others has been interpreted as a neural signature of empathy. However, this overlap raises the question of whether it may reflect a unique distributed population of bimodal neurons or, alternatively, the activity of intermingled but independent populations. We used fMRI on 28 female volunteers and used multivariate pattern analysis techniques to probe for more fine-grain spatial representations of seen and felt pain. Using a whole-brain approach, we found that only in the anterior insula (bilaterally) the distribution of cortical activity evoked by seeing another person’s hand in pain was spatially similar to that of pain felt on one’s own hand. Subsequent region of interest analyses also implicated the middle insula (right hemisphere) and the middle cingulate cortex. Furthermore, for the anterior insula, the spatial distribution of activity associated with one’s pain also replicates that of the perception of negative but painless stimuli. Our data show how the neural representations of aversive events affecting oneself are also recruited when the same events affect others, and provide the stronger evidence thus far of a unique distributed cortical ensemble coding for aversive events regardless of the subject who is affected. Introduction One of the most striking breakthroughs in neuroscience in recent years has been the identification of shared emotional networks: regions of the human brain similarly active to an emotional state affecting oneself or others. In particular, the anterior insula (AIns) is engaged not only when experiencing disgusting/pleasing tastes and odors, but also when viewing disgusted/pleased faces (Wicker et al., 2003; Jabbi et al., 2007). Likewise, direct pain experience activates a network called the pain matrix, including insular, cingulate, periaqueductal, and somatosensory areas (Peyron et al., 2000; Rainville, 2002; Farrell et al., 2005; SalimiKhorshidi et al., 2009), among which several regions (especially insula and cingulate cortex) are also activated when observing pain delivered to others (Singer et al., 2004; Lamm et al., 2011). These observations have been interpreted as evidence for embodied models of emotional coding and empathy, according to which the representation of others’ emotional states is partly instantiated in those neural structures coding for one’s own bodily sen- Received May 31, 2011; revised Oct. 22, 2011; accepted Oct. 28, 2011. Author contributions: C.C.-D. and P.V. designed research; C.C.-D. and C.H. performed research; C.C.-D. analyzed data; C.C.-D. and P.V. wrote the paper. This work was supported by the National Center of Competence in Research for the Affective Sciences financed by the Swiss National Science Foundation (Grant 51NF40-104897) and hosted by the University of Geneva, and a grant from the Geneva Academic Society to P.V. We thank Alessio Avenanti, Inda Morrison, Yuichi Ogino, and Pascal Vrticka for sharing their stimuli with us. We also thank David Lawi for helping us create the stimuli database, Christophe Mermoud for his assistance in all matters concerning the thermal stimulator setup, and Kim Doell for proofreading this manuscript. Correspondence should be addressed to Corrado Corradi-Dell’Acqua, Swiss Centre for Affective Sciences, University of Geneva, 7 Rue des Battoirs, 1205 Geneva, Switzerland. E-mail: [email protected]. DOI:10.1523/JNEUROSCI.2686-11.2011 Copyright © 2011 the authors 0270-6474/11/3117996-11$15.00/0 sations/reactions (Bastiaansen et al., 2009; Goldman and de Vignemont, 2009; Caruana et al., 2011). Empirical support for shared emotional networks has been obtained mainly by neuroimaging techniques, such as functional magnetic resonance imaging (fMRI), whose spatial resolution does not allow recording from isolated neurons, but provides pooled signal from a large volume of gray matter (usually voxels ⬃2–3 mm per side). Furthermore, brain regions showing shared emotional activations, such as AIns, have been associated with many other functions beside pain, emotion, and empathy (Kurth et al., 2010), including attention (Corbetta et al., 2008; Menon and Uddin, 2010), time perception (Kosillo and Smith, 2010), and motor agency (Karnath and Baier, 2010). It is therefore unclear whether shared activations in these regions reflect the activity of a unique population of bimodal neurons sensitive to one’s and others’ pain or distinct but intermingled neuronal groups each recruited by a different pain target, and whether these neurons code for somatic pain specifically or for other negative/aversive information more generally. Multivariate pattern analysis (MVPA) allows for more detailed investigation of fMRI activation maps. Because the variability of neural signal over a cortical area may reflect the inhomogeneous distribution of a given neuronal population (or populations) across neighboring voxels, the replication of equal response patterns in two independent conditions may reflect generalization of the same activation map (Haynes and Rees, 2005; Lewis-Peacock and Postle, 2008). This would represent the strongest evidence for the same neuronal population(s) responding to both conditions. We therefore studied volunteers in two fMRI sessions: in the first (pain localizer), noxious hot and nonnoxious warm thermal stimulations were delivered on partici- Corradi-Dell’Acqua et al. • Shared Patterns of Activity in the Pain Matrix J. Neurosci., December 7, 2011 • 31(49):17996 –18006 • 17997 Figure 1. Example for each stimulus category. pants’ hand in alternating blocks. In the second session (handedness task), participants viewed hands in either painful, arousing painless, or non-arousing painless situations. We used MVPA to isolate regions where patterns associated with feeling noxious (but not non-noxious) stimuli were identical to those associated with seeing hands in painful (but not painless) situations. Based on previous research, we predicted to isolate shared patterns at the level of the insula, with or without additional areas in the pain matrix. Materials and Methods Participants Since previous neuroimaging studies reported that females exhibit stronger neural responses in tasks testing empathy and visual processing of hands in pain (Yang et al., 2009; Derntl et al., 2010) (but see Lamm et al., 2011), we recruited female subjects only (N ⫽ 28; age, 19 –31 years) in the current experiment. None of the participants had any history of neurological or psychiatric illness. Written informed consent was obtained from all subjects. The study was approved by the local ethics committee and conducted according to the declaration of Helsinki. Visual stimuli As in many studies in the field, our critical experimental stimuli comprehended images of hands displaying painful touches, whereas control stimuli depicted painless touches. However, unlike in previous studies, our control stimuli were not exclusively neutral pictures (Cheng et al., 2007; Morrison et al., 2007; Lamm et al., 2010, 2011), but also emotionally negative images, representing frightening/sad/disgusting, but always painless, situations. This yielded four categories of stimuli: two of them were negative (one painful and one painless), whereas the remaining two were matched neutral controls for the negative stimuli. In particular, we created 180 color hand pictures (768 ⫻ 768 pixels, corresponding to 14.25 ⫻ 14.25° of visual angle) by merging stimuli from the International Affective Picture System database (Lang et al., 1997), previous studies (Ogino et al., 2007; Morrison et al., 2007; Vrticka et al., 2011), and Web search. These pictures were sorted as follows (Fig. 1). The first group depicted hands in pain (NegPainful): in 30 of these stimuli, pain was inferable exclusively by the presence of wounds/burns on the skin, whereas for another 30 of these stimuli pain was inferable both by the presence of wounds/marks on the skin and by the display of an external object (scalpel, syringe, etc.) acting on the skin surface. The second group (NegPainless) was composed by 30 pictures of hands in emotionally aversive, but painless situations (hands holding knifes/guns, hands with handcuffs). For both painful and painless stimuli, we also created neutral control stimuli that were matched with the previous two categories for hand laterality (right/left) orientation (angular distance from the viewer’s own hand position at rest) and for visual features (presence of objects, human bodies, etc.), but purged from any emotionally salient (painful, arousing) features. Thus, the control for painful stimuli (NeuPainful) included 30 pictures of hands holding (without being hurt by) various sharp/cutting instruments and 30 pictures of hands exhibiting painless marks on the skin (e.g., depigmentation, rash). The controls for non-painful stimuli (NeuPainless) were 30 pictures of hands interacting in a non-arousing fashion with potentially threatening objects (hands using a knife to cook, playing with toy guns/handcuffs). This yielded a two-by-two design with stimuli (painful, painless) and emotional arousal (negative, neutral) as factors. All images were equated in luminance. Experimental setup Participants lay supine with their head fixated by firm foam pads. Stimuli were presented using E-Prime 2.0 (Psychology Software Tools) inside the scanner bore on a LCD projector (CP-SX1350; Hitachi) subtending about 14.25° (vertical) ⫻ 19° of visual angle. Participants saw the monitor through a mirror mounted on the MR head coil. Key presses were recorded on an MRI-compatible bimanual response button box (HH2 ⫻ 4-C; Current Designs). For each experimental trial, one of the 180 hand stimuli was presented for 2500 ms, followed by an intertrial interval that ranged from 2500 to 4100 ms (mean and median, 3300 ms) with incremental steps of 320 ms. Participants were asked to perform a handedness task: if the stimulus depicted a right hand, they had to press the key corresponding to the right hand, whereas if the stimulus was a left hand, they had to press the key corresponding to the left hand. This task is known to be accomplished by mentally imagining to move one’s own hand until it is aligned with the viewed hand (Parsons, 1987; Corradi-Dell’Acqua et al., 2009), but did not make any explicit demand to process the painful or emotional cues in pictures (for a similar implementation in a pain empathy study, see Gu et al., 2010). Participants were instructed to respond as fast as possible and to ignore all image features (e.g., blades, wounds), which were irrelevant to the task. The four experimental conditions were presented in a randomized order together with 30 null events, in which an empty screen replaced the stimuli. All 210 trials were presented in a unique scanning session, which lasted about 21 min. Subjective rating session After scanning, participants were asked to rate each of the 180 stimuli on four dimensions as follows: (1) Familiarity judgments: “how much is the content described in this picture familiar to you? Participants responded by using a 10-point Likert 17998 • J. Neurosci., December 7, 2011 • 31(49):17996 –18006 scale ranging from 1 to 10, where 10 referred to extremely familiar stimuli, and 1 referred to totally unfamiliar stimuli. (2) Pain intensity judgments: “how intense is the pain felt by the hand depicted on this image?” Participants responded on a 10-point Likert scale ranging from 1 to 10, where 10 referred to the strongest pain possible, and 1 referred to the absence of pain. Participants were explicitly instructed to assess exclusively the pain visible in the image (e.g., a blade cutting a hand) but not predictable in the near future (e.g., a blade about to cut a hand). Furthermore, as some stimuli were hand-surgery photos, we asked participants to rate pain while assuming that no anesthesia or pain treatment was delivered. (3) Valence assessment: “does this image elicit positive or negative emotions?” Participants responded on a nine-point Likert scale ranging from ⫺4 to ⫹4, where negative values referred to pictures eliciting negative emotions and positive values referred to pictures eliciting positive emotions. (4) Emotional intensity judgment: “how intense is the emotion triggered by this image?” Participants responded by marking a 10-point Likert scale ranging from 1 to 10, where 10 referred to the most intense emotional response (regardless of whether this is positive or negative) and 1 referred to the weakest. The ratings were divided in four blocks, one for each question, during which all 180 stimuli were rated. To avoid habituation biases due to the presentation of the same stimuli four times, the order of the blocks, and the order of the stimuli within each block, was randomized across participants. Behavioral data processing Values obtained for the each rating dimension in the post-scanning session were used to calculate a median score for each condition. Differences between conditions were then assessed by non-parametric permutationbased t tests (Good, 2000) in which the t value was compared with the null distribution of 5000 t values calculated on shuffled data sets. A t value was considered significant if it was either lower or higher than the 2.5th or 97.5th percentile of the t distribution, respectively. All analyses of behavioral data were performed with R.2.13 open source software (http://cran.r-project.org). Pain localizer We delivered noxious and non-noxious thermal stimulation to the right palm, using a computer controlled thermal stimulator with an MRIcompatible 25 ⫻ 50 mm fluid-cooled Peltier probe (MSA Thermotest). Noxious and non-noxious thermal stimuli were delivered. The nonnoxious temperature was 35°C. The noxious temperature varied on a participant-by-participant basis and ranged between 42 and 50°C (average, 46.32°C; SD, 2.11). This temperature was selected, through ascending method of limits, immediately before the pain localizer session and corresponded to stimulation sufficiently strong to be considered painful but sufficiently weak to be felt without moving. Noxious and nonnoxious stimuli were delivered in 10 blocks (each 18 s): five blocks with noxious temperature alternated with five blocks with a non-noxious temperature. Blocks were separated by an interblock interval of 18 s in which the temperature was fixed to 30°C. Each block was organized into two consecutive thermal shifts, each lasting 9 s (3 s of temperature increase, 3 s of plateau, and 3 s of temperature decrease). A visual cue (identical for noxious and non-noxious shifts) informed participants of each of these shifts. Participants were informed that they could move the hand away from the stimulator if the temperature ceased to be supportable. Post-session informal debriefing was performed to assess whether this was indeed the case. Corradi-Dell’Acqua et al. • Shared Patterns of Activity in the Pain Matrix Preprocessing. Statistical analysis was performed using the SPM8 software (http://www.fil.ion.ucl.ac.uk/spm/). For each subject and for each experimental session, the first three volumes were discarded. The remaining images were corrected for head movement between scans by an affine registration (Ashburner and Friston, 2004). For realignment, a two-pass procedure was used, by which images were initially realigned to the first image of each sessions and subsequently realigned again to the mean of all images after the first step. The resulting functional images were aligned to the T1-weighted anatomical image through rigid-body registration (Collignon et al., 1995). The anatomical image was then spatially normalized to the Montreal Neurological Institute (MNI) single-subject template (Evans et al., 1992; Collins et al., 1994; Holmes et al., 1998) using the “unified segmentation” function in SPM8. This algorithm is based on a probabilistic framework that enables image registration, tissue classification, and bias correction to be combined within the same generative model. The resulting parameters of a discrete cosine transform, which define the deformation field necessary to move the anatomical image into the space of the MNI tissue probability maps (Evans et al., 1994), were then combined with the deformation field transforming between the latter and the MNI single-subject template. The ensuing deformation was subsequently applied to all individual functional images, which were thereby transformed into standard stereotaxic space and resampled at 2 ⫻ 2 ⫻ 2 mm voxel size. The normalized images were spatially smoothed using an 8 mm full-width at halfmaximum (FWHM) Gaussian kernel to compensate for residual macroanatomical variations across subjects. First-level analysis. Data were analyzed using the general linear model (GLM) framework implemented in SPM (Kiebel and Holmes, 2004). For the pain localizer, we modeled each of the two active conditions (noxious vs non-noxious) with a boxcar function. For the handedness task, trial time onsets from each condition of our design were modeled with a delta (or “stick”) function. For the handedness task, variability among trials of the same conditions was also accounted for through an additional vector in which participants response times were modulated parametrically. In both the analysis of pain localizer and the handedness task, we accounted for putative habituation effects in neural responses by using the timemodulation option implemented in SPM, which creates, for each active condition, an additional regressor in which the block/trial order is modulated parametrically. Furthermore, each regressor was convolved with a canonical hemodynamic response function and associated with a regressor describing its first-order temporal derivative. To account for movement-related variance, we included six differential movement parameters [x, y, and z translations (in millimeters) and pitch, roll, and yaw rotations (radiants)] as covariates of no interest. Low-frequency signal drifts were filtered using a cutoff period of 128 s. Global scaling was applied, with each fMRI value rescaled to a percentage value of the average whole-brain signal for that scan. Second-level analyses. Functional contrasts, testing differential parameter estimate images associated with one experimental condition versus the other were then fed in a second level, one-sample t test, using random-effect analysis. Voxels were identified as significant only if they passed a threshold corresponding to p ⬍ 0.05 corrected at the cluster level, with an underlying height threshold of at least t(27) ⫽ 3.42, corresponding to p ⬍ 0.001 (uncorrected). We used as extent threshold the 95th percentile of the distribution of the largest cluster obtained through 5000 replications of the same analysis on permuted data sets. This analysis was performed using the SnPM toolbox of SPM (http:// www2.warwick.ac.uk/fac/sci/statistics/staff/academic-research/Nichols/ software/snpm/). Multivariate pattern analysis Imaging processing Data acquisition. A Siemens Trio 3-T whole-body scanner was used to acquire both T1-weighted anatomical images and gradient echoplanar T2*-weighted MRI images with blood oxygenation level-dependent contrast. The scanning sequence was a trajectory-based reconstruction sequence with a repetition time of 2100 ms, an echo time of 30 ms, a flip angle of 90°, an in-plane resolution of 64 ⫻ 64 voxels (voxel size, 3 ⫻ 3 mm), 32 slices, a slice thickness of 3 mm, and no gap between slices. Multivariate approaches to the analysis of brain imaging have attracted growing interest in recent years given their enhanced ability to gather information, not from isolated voxels (as in univariate approaches) but from the combined activity of many voxels. MVPA in neuroimaging literature has usually relied on classification or correlation methods. In classification (or decoding) approaches (Haynes and Rees, 2005; Dinstein et al., 2008; Etzel et al., 2008; Lewis-Peacock and Postle, 2008; Ethofer et al., 2009), patterns classifiers are trained on the multivoxel data Corradi-Dell’Acqua et al. • Shared Patterns of Activity in the Pain Matrix J. Neurosci., December 7, 2011 • 31(49):17996 –18006 • 17999 Figure 2. Processing steps in MVPA. For each voxel of the individual native brain image, a cubic-shaped volume of interest surrounding the voxel was defined (5 voxels per side). Data from these voxels were subjected to both classification and correlation analyses. A, Schematic representation of classification analysis. A SVM classifier estimated the optimal linear boundary separating noxious from non-noxious thermal stimulations. The modeled boundary was then tested to test whether it could as well discriminate NegPainful from NeuPainful stimuli. B, Schematic representation of correlation analysis (data from one participant). The left panel describes, for each voxel of the volume of interest, the differential response to felt pain (noxious–non-noxious, pain localizer). The central panel describes, for the same voxels, the differential response to seen pain (NegPainful–NeuPainful, handedness task). The correlation between the two pain effects in the volume of interest was calculated. from one experimental session to discriminate between two experimental conditions. Data from an independent session are then used to test the performance of the classifier. In our case, classification can be achieved in two ways: first, by training the classifier to discriminate painful from non-painful events from the pain localizer data and then testing its ability to discriminate painful from non-painful events from the handedness task (felt3seen), and second, by training the classifier on the handedness task data and testing it on the pain localizer data (seen3felt). In correlation approaches (Dinstein et al., 2008; Peelen et al., 2010), the spatial activity pattern from one session is correlated with the spatial activity pattern from an independent session to assess whether the spatial variability of the neural activity in the two session is shared. Despite their diversity, these approaches (correlation; classification, felt3seen and seen3felt) all provide reliable MVPA tests for common cortical representations across conditions. Thus, strong evidence for shared patterns of neural activity should be obtained consistently across these three approaches, as we describe here. Classification analysis. MVPA was performed on preprocessed data from each individual, which, at variance with the standard univariate approach, did not undergo normalization and smoothing. For each subject, we first analyzed our data with GLMs that were identical to those performed for the univariate analysis, with the exception that we separately modeled each of the blocks from the pain localizer session and each of the trials from the handedness task session. Following previous studies (Kriegeskorte et al., 2006; Peelen et al., 2010), we performed a small volume searchlight procedure in which, for each voxel of the individual native brain image, a cubic-shaped volume of interest surrounding the voxel was defined (5 voxels per side, 125 voxels total). We extracted the parameters estimates (s) associated with each block from the pain localizer data and each trial from the handedness task session in this volume of interest. Data were then fed into a linear kernel support vector machine (SVM) classifier. SVMs operate by finding an optimal linear decision boundary (hyperplane) that separates experimental classes with maximum margin. New data are classified according to which side of the hyperplane they fall onto (Boser et al., 1992). Here, after training a SVM on the pain localizer data to find the hyperplane separating noxious from non-noxious stimuli, we assessed whether this hyperplane could correctly classify the two experimental conditions (e.g., NegPainful vs NeuPainful) of the handedness task data (Fig. 2a). The analysis was then repeated with the inverse logic, that is, by training a SVM on the handedness task data and testing it on the pain localizer data. Note that the small volume searchlight procedure used in this analysis insures that the classification performance is based on local information, whereas it would not be sensitive to regional patterns at a larger scale. Signal detection methods were used to compute d⬘ (Green and Swets, 1966) as a measure of the sensitivity of the hyperplane to discriminate, in a new set of data, one experimental condition from another. These d⬘ values were then assigned to the center voxel of the cube. Classification analysis was performed with the Bioinformatics Toolbox 3.6 implemented in Matlab 7.9 Software (Mathworks). Correlation analysis. MVPA was also performed through correlation analysis (Dinstein et al., 2008; Peelen et al., 2010). For this purpose, data were analyzed in the same manner as in our univariate analysis. However, unlike the univariate analysis and analogously to the classification anal- Corradi-Dell’Acqua et al. • Shared Patterns of Activity in the Pain Matrix 18000 • J. Neurosci., December 7, 2011 • 31(49):17996 –18006 Table 1. Behavioral data Familiarity Pain intensity Emotional intensity Valence Accuracy Reaction times NegPainful NegPainless NeuPainful NeuPainless 2.21 关1.76, 2.66兴 7.26 关6.74, 7.77兴 6.76 关6.17, 7.35兴 ⫺2.82 关⫺2.69, ⫺3.02兴 0.90 关0.88, 0.93兴 1250 关1165, 1335兴 2.36 关2.05, 2.67兴 1.52 关1.16, 1.87兴 4.92 关4.20, 5.65兴 ⫺2.21 关⫺1.91, ⫺2.52兴 0.73 关0.69, 0.77兴 1510 关1410, 1611兴 5.01 关4.38, 5.65兴 2.62 关2.34, 2.90兴 2.62 关2.23, 3.02兴 ⫺0.84 关⫺0.62, ⫺1.05兴 0.89 关0.87, 0.92兴 1197 关1116, 1278兴 4.41 关4.02, 4.79兴 1.08 关1.02, 1.14兴 2.95 关3.43, 2.47兴 0.24 关0.00, 0.47兴 0.89 关0.91, 0.87兴 1319 关1241, 1397兴 Average values are shown for each experimental condition (brackets values are 95% confidence intervals). ysis, unnormalized and unsmoothed preprocessed data were fed to the GLMs. We then applied, for each subject, the same small volume searchlight approach used in the classification analysis. For each voxel, we extracted the differential parameters estimates associated with the two block conditions (noxious, non-noxious) from the pain localizer data, and with two conditions of the handedness task session (NegPainful, NeuPainful), using a cubic-shaped volume of interest (125 voxels). The extracted values from the pain localizer and the handedness task were then correlated (Fig. 2b), thus yielding a correlation coefficient r that was Fisher transformed: rf ⫽ (0.5 * loge[(1 ⫹ r)/(1 ⫺ r)]) (Peelen et al., 2010). These rf values were then assigned to the center voxel of the cube. Both correlation and classification approaches resulted in rf and d⬘ maps that were normalized to the MNI template and smoothed with an 8 mm FWHM Gaussian kernel. As the null hypothesis in these analyses sees the spatial variability of the two pain-specific activities to be unrelated, significant rejection of the null hypothesis was achieved by testing, at the group level, for rf ⬎ 0 and d⬘ ⬎ 0. Second-level one-sample t tests were performed, using random-effects analysis with the same nonparametrical routines used in the standard univariate analysis. Results Behavioral results Behavioral data are shown in Table 1. As expected, painful pictures were rated as more painful than their corresponding controls (NegPainful vs NeuPainful). A mild increase in pain ratings was also observed for hand pictures seen in the negative painless condition (NegPainless vs NeuPainless), although this effect was of ⬃ 0.5 points in the Likert scale, as opposed to an effect of ⬃5 points for painful stimuli (see Table 1); furthermore NegPainful were rated as reliably more painful than NegPainless stimuli. Emotion and valence ratings revealed that both painful and negative painless stimuli were judged as more negatively arousing than their corresponding controls, but among negative stimuli, painful pictures were rated as more negative and arousing than non-painful ones. Finally, neutral control pictures (both painful and painless) were rated more familiar than negative pictures. All these effects were confirmed by permutation-based t tests, all associated with 兩t兩 ⬎ 2.49 (2.5th and 97.5th percentiles of the null t distribution within ⫺2.12, 2.11) and always p ⬍ 0.05. Neural activations Only regions surviving rigorous non-parametric permutationbased correction for multiple comparisons over the whole brain were considered significant (see Materials and Methods). Complete activation lists are reported in Tables 2-4. We first report standard univariate analyses (based on SPM) and then describe pattern analyses (using three complementary MVPA approaches; see Materials and Methods). Univariate analysis We first tested for significant increases for noxious (vs nonnoxious) thermal stimulations in the pain localizer session and found, in line with previous studies (Peyron et al., 2000; Rainville, 2002; Farrell et al., 2005; Salimi-Khorshidi et al., 2009), a robust activation of the entire pain matrix (Table 2; Fig. 3, red areas). A Table 2. Clusters showing significant increases in activation during the pain localizer session: Noxious versus non-noxious (critical cluster size: 145 voxels) Coordinates Insula Putamen/pallidum Middle frontal gyrus Midbrain Middle cingulate cortex Anterior cingulate cortex Insula Putamen/pallidum Supramarginal gyrus Parietal operculum Cerebellum Supramarginal gyrus Parietal operculum Middle frontal gyrus Middle temporal gyrus Side x y Z Cluster size R R R M M M L L L L L R R R L R 36 26 34 0 ⫺4 2 ⫺30 ⫺20 ⫺62 ⫺58 ⫺24 20 64 62 ⫺34 50 14 0 42 14 6 12 18 2 34 20 ⫺68 ⫺66 ⫺38 ⫺20 32 ⫺28 0 0 20 ⫺8 32 24 8 ⫺2 26 18 ⫺28 ⫺36 32 22 30 ⫺12 28723*** 8397*** 3693*** 940** 185* All clusters survived correction for multiple comparisons over the whole brain. Coordinates (in standard MNI space) refer to maximally activated foci: x ⫽ distance (mm) to the right (⫹) or left (⫺) of the midsagittal line; y ⫽ distance anterior (⫹) or posterior (⫺) to the vertical plane through the anterior commissure; z ⫽ distance above (⫹) or below (⫺) the intercommissural line. L, Left hemisphere; R, right hemisphere; M, medial activations. ***p ⬍ 0.001, **p ⬍ 0.01, *p ⬍ 0.05, permutation-based correction for multiple comparisons. subportion of this network— e.g., the middle insula (MIns) and AIns, supramarginal and postcentral gyrus (SMG/PCG), middle cingulate cortex (MCC), and midbrain—was also implicated in the handedness task session when testing for suprathreshold activations for NegPainful (relative to NeuPainful) stimuli (Table 3; Fig. 3a, yellow areas). These results converge with previous literature (Lamm et al., 2011), by showing how brain regions usually activated during nociception are also active when pain is observed in others. We also tested for suprathreshold activations associated with negative painless stimuli compared with their corresponding controls (NegPainless vs NeuPainless). These effects were found bilaterally in the AIns as well as in the intraparietal sulcus, extending to the angular gyrus, and more medially, in the precuneus and supplementary motor area. Interestingly, a few of these regions also overlapped with those isolated by the pain localizer session; these included the insula, specifically its most anterior portion, and the supplementary motor area (Fig. 3b). Finally, we directly compared negative painful and negative painless stimuli, allowing us to test for specific effects of perceived pain while controlling for the negative or aversive nature of stimuli (NegPainful vs NegPainless). This contrast (Fig. 3c, green areas) revealed activations that strongly resembled those obtained when comparing NegPainful stimuli to their controls NeuPainful, with bilateral effects in MIns, SMG/PCG, and medial regions in posterior and middle cingulate cortex (Fig. 3c). However, no differential activation was found in AIns. Corradi-Dell’Acqua et al. • Shared Patterns of Activity in the Pain Matrix J. Neurosci., December 7, 2011 • 31(49):17996 –18006 • 18001 Table 3. Clusters showing significant increases in activation during the handedness task session Coordinates Side NegPainful versus NeuPainful (critical cluster size: 240) Calcarine gyrus Fusiform gyrus Inferior temporal gyrus Intraparietal sulcus Inferior occipital gyrus Fusiform gyrus Inferior temporal gyrus Intraparietal sulcus Inferior frontal gyrus Middle/anterior insula Amygdala Supramarginal/postcentral gyrus Anterior cingulate cortex Middle cingulate cortex Middle insula Amygdala Anterior insula Midbrain NegPainless versus NeuPainless (critical cluster size: 222) Supplementary motor area Precentral gyrus Anterior insula Supplementary motor area Precuneus Intraparietal sulcus Inferior parietal cortex Precuneus Middle temporal gyrus Hippocampus Intraparietal sulcus Inferior frontal gyrus Anterior insula x y Z Cluster size R R R R L L L L R R R R L M M L L L M 18 28 48 24 ⫺14 ⫺28 ⫺44 ⫺20 42 36 22 62 ⫺62 ⫺2 2 ⫺38 ⫺20 ⫺32 ⫺2 ⫺92 ⫺48 ⫺64 ⫺60 ⫺96 ⫺54 ⫺66 ⫺70 32 12 ⫺6 ⫺18 ⫺22 2 20 2 ⫺6 26 ⫺8 ⫺2 ⫺16 ⫺10 44 ⫺8 ⫺16 ⫺10 44 2 2 ⫺14 34 40 30 30 ⫺4 ⫺16 4 ⫺10 10071*** R L 10 ⫺34 ⫺28 ⫺8 16 ⫺30 ⫺38 ⫺8 42 36 38 46 32 20 ⫺4 24 22 ⫺60 ⫺62 ⫺44 ⫺66 32 12 ⫺44 16 24 50 50 ⫺2 44 42 44 44 46 2 2 42 8 ⫺6 2696*** R L R R R Table 4. Clusters showing significant increases in activation during the handedness task session Coordinates Side x y z Cluster size 18 26 ⫺10 ⫺28 62 ⫺56 42 ⫺42 ⫺4 ⫺4 ⫺88 ⫺60 ⫺92 ⫺68 ⫺18 ⫺24 0 4 ⫺38 22 2 ⫺14 0 ⫺14 32 30 ⫺6 ⫺6 32 24 8112*** Posterior cingulate cortex Middle cingulate cortex R R L L R L R L M M NegPainless versus NegPainful (critical cluster size: 237) Middle occipital gyrus Middle temporal gyrus Intreparietal sulcus Middle frontal gyrus Superior medial gyrus Inferior frontal gyrus Middle occipital gyrus Middle temporal gyrus Angular gyrus Middle frontal gyrus Precentral gyrus Inferior frontal gyrus Precuneus Fusiform gyrus L L L L L L R R R L L L M R ⫺48 ⫺54 ⫺42 ⫺26 ⫺6 ⫺54 50 44 38 34 46 50 ⫺8 42 ⫺74 ⫺52 ⫺52 12 28 24 ⫺70 ⫺62 ⫺68 8 ⫺16 28 ⫺60 ⫺46 6 14 48 58 46 28 24 16 44 56 56 28 50 ⫺18 5812*** NegPainful versus NegPainless (critical cluster size: 248) Calcarine gyrus Fusiform gyrus Calcarine gyrus Fusiform gyrus Supramarginal/postcentral gyrus Middle insula 1511** 727** 324* 439* 369* 110 26 2468*** 858** 476* 827** 748** 467* 299* 4195*** 3482*** 2777*** 1669*** 318* *p ⬍ 0.001, **p ⬍ 0.01, ***p ⬍ 0.05, permutation-based correction for multiple comparisons. L, Left hemisphere; R, right hemisphere; M, medial activations. 788** 544* 457* L, Left hemisphere; R, right hemisphere; M, medial activations. ***p ⬍ 0.001, **p ⬍ 0.01, *p ⬍ 0.05, permutation-based correction for multiple comparisons. Multivariate analysis of pain-related activity Felt and observed pain revealed partly overlapping voxels (Fig. 3a), as described previously in different paradigms (for a metaanalysis, see Lamm et al., 2011). The critical novel question of our study was whether such overlay corresponded to a true replication of neural activity with the same spatially distributed pattern over the cortex. We used MVPA with three different procedures (see Materials and Methods): two analyses involved classification (an SVM trained to discriminate responses to felt pain and then tested on responses to seen pain, felt3seen; and conversely, an SVM trained on responses to seen pain and tested on felt pain, seen3felt), and the third analysis involved multivoxel correlation. For our purposes, we considered strong and reliable evidence for shared patterns when such effects were consistent across all three approaches. Table 5 and Figure 4a report those MVPA results from voxelwise analysis who survived a rigorous permutation-based correction for multiple comparisons across the whole brain. The three approaches resulted in comparable, although non-identical, effects. In particular, our first classification approach (felt3seen) implicated the right AIns only (Fig. 4a, magenta areas). The second classification approach (seen3felt) again revealed an involvement of the right AIns, but together with the left AIns in a very symmetrical site (Fig. 4a, blue areas). Finally, the correlation approach implicated the left AIns (yellow areas). We then lowered our statistical threshold to test specifically whether both the right and left AIns yielded to evidence of shared patterns that was consistent across all (classification and correlation) approaches. In particular, a region of interest (ROI) analysis was performed by extracting the average d⬘ and rf values from voxels of bilateral insula ROIs displayed in Figure 4a (right hemisphere, magenta and blue voxels areas overlay in 185 voxels; left hemisphere, yellow and blue areas overlay in 9 voxels). We subjected these values to one-tailed permutation-based t tests to assess any significant difference from zero. For both the right and left AIns, we found significant evidence of shared patterns that was consistent across all approaches [t ⬎ 2.68 (95th percentiles ⬍ 1.73); p ⬍ 0.01; Table 6]. We also wondered whether shared patterns could be found at the level of other regions that were activated by both one’s and others’ pain in our univariate analysis (Fig. 3b, yellow areas). We therefore repeated our ROI analysis on the averaged d⬘ and rf values from those regions, other than AIns, that responded to both noxious ⬎ non-noxious blocks and NegPainful ⬎ NeuPainful trials (Table 6). We found effects consistent across all three approaches only at the level of the MCC of the right MIns [t ⬎ 1. 72 (95th percentile ⬍ 1.72); p ⬍ 0.05]. No consistent effect was found for the SMG, midbrain, and occipital cortex. Multivariate analysis of negative painless stimuli Finally, we examined the patterns of neural response to pictures showing hands in emotionally negative but painless conditions. Indeed, our initial univariate analysis also revealed bilateral increases in AIns when seeing NegPainless stimuli (Fig. 3b). We 18002 • J. Neurosci., December 7, 2011 • 31(49):17996 –18006 Corradi-Dell’Acqua et al. • Shared Patterns of Activity in the Pain Matrix Figure 3. Univariate analysis. A, B, Whole-brain maps showing significant increase of neural activity associated with noxious (vs non-noxious) thermal stimulations (red areas), together with responses to pictures of hands in NegPainful (vs NeuPainful) conditions (green areas; A) or NegPainless (vs NeuPainless) conditions (cyan areas; B). Regions activated in both the pain localizer and handedness task are displayed in yellow and pink, respectively. C, Whole-brain maps showing significant differences in neural activity between NegPainful and NegPainless hand pictures. Activations are displayed on an inflated brain surface, thus allowing free vision of the insular cortex. PCC, Posterior cingulate cortex; SMA, supplementary motor area. MNI x, y, and z coordinates for each region are also displayed. therefore asked whether such activation overlap would also correspond to a replication of patterns evoked by the pain localizer data, as found in the case of painful hand pictures. We repeated our multivariate pattern analysis but now tested whether activation patterns discriminating noxious from non-noxious thermal stimulations (in localizer session) could also enable us to discrim- inate between trials with NegPainless versus NeuPainless pictures (in the handedness task session). This analysis of the negative painless condition revealed a consistent multivoxel overlap with responses evoked by selfexperienced pain in the AIns bilaterally. Indeed, when using the classification analysis (felt3seen), we found a significant in- Corradi-Dell’Acqua et al. • Shared Patterns of Activity in the Pain Matrix J. Neurosci., December 7, 2011 • 31(49):17996 –18006 • 18003 Table 5. Multivariate pattern analysis Coordinates Side x y z NegPainful ⬎ NeuPainful Classification: pain localizer 3 handedness task (critical cluster size: 406) Anterior insula R 36 24 6 Classification: handedness task 3 pain localizer (critical cluster size: 144) Anterior insula R 28 30 8 L ⫺36 22 ⫺16 Correlation (critical cluster size: 435) Anterior insula L ⫺26 22 8 NegPainless ⬎ NeuPainless Classification: pain localizer 3 handedness task (critical cluster size: 374) Anterior insula R 36 26 ⫺12 L ⫺34 ⫺24 ⫺4 Classification: handedness task 3 pain localizer (critical cluster size: 174) Subcallosal gyrus M ⫺14 24 ⫺10 Cluster size 443* 567*** 211* 467* 511* 445* 269* Brain areas showing d⬘ and rf significantly greater than zero. ***p ⬍ 0.001, *p ⬍ 0.05 permutation-based correction for multiple comparisons. L, Left hemisphere; R, right hemisphere; M, medial activations. volvement of AIns in both hemispheres (Fig. 4b; Table 5). However, this effect in AIns did not reach significance when testing for shared patterns through the other two approaches (classification felt3seen and correlation). Nevertheless, a detailed inspection of the average parameters extracted in the AIns regions depicted in Figure 4b showed that the effects were consistent across all classification and correlation techniques [t ⬎ 2.49 (95th ⬍ 1.75); p ⬍ 0.01]. The d⬘ (ranging from 0.09 to 0.15) and rf values (from 0.08 to 0.09) in this analysis approached the corresponding values in the analysis of painful stimuli (d⬘ from 0.09 to 0.15, rf from 0.10 to 0.14; Table 6), suggesting that cortical patterns associated with noxious thermal stimulation in AIns were comparably able to discriminate the NegPainful (from NeuPainful) and NegPainless (from NeuPainless) conditions. Note that NegPainful stimuli were rated more negative arousing than NegPainless stimuli (Table 1), which might potentially explain the smaller rf values in the analysis of painless stimuli. Moreover, the overlap for negative painless stimuli was specific to AIns but not present in other ROIs responding to pain. In particular, no significant effect was found when the same analysis was performed for the right MIns or for the MCC [t ⬍ ⫺0.28 (95th ⬎ 1.66; p ⬎ 0.05]. For these regions, the d⬘ (ranging from ⫺0.02 to 0.01) and rf values (from ⫺0.01 to 0.02) suggest that patterns of neural activity evoked by felt pain cannot discriminate between NegPainless and NeuPainless stimuli, despite the fact that the latter two conditions reliably differed in valence and emotional intensity ratings (Table 1). Thus, the degree to which the activity in MCC and right MIns during the handedness task was shared with the activity associated with noxious thermal experiences did not depend on the presence of negative arousing features in the stimuli (as in the case of AIns), but most likely on the presence of pain-related information. This result further indicates that shared patterns are not generally found across all areas responding to pain and negative stimuli. Discussion We provide first evidence for shared patterns of neural activity in bilateral AIns, right MIns, and MCC between pain felt on oneself and seen in others. This was demonstrated by comparing the spatial distribution of cortical activity evoked by noxious stimuli on the participants’ own hand (pain localizer) with the distribution of activity evoked by viewing pictures of other people’s hands in pain (handedness task). These results were consistent across three independent analyses aimed at testing the same hypothesis and shed new light on the existence and nature of shared neural representations of affective states (Decety and Lamm, 2006; Singer and Lamm, 2009). Activations vs patterns While previous studies have shown activation of brain regions involved in nociception during observation of pain in others, the degree of overlap and exact significance of these shared responses have been debated. Insular and cingulate regions exhibit functional properties that are not limited to pain and emotional processing, but also encompass various cognitive processes such as attention (Corbetta et al., 2008; Menon and Uddin, 2010), motor agency (Karnath and Baier, 2010), social interactions (Ethofer et al., 2011), and economical choices (Knutson et al., 2005; Preuschoff et al., 2006), among others (for meta-analyses, see Kurth et al., 2010; Shackman et al., 2011; Torta and Cauda, 2011). The multiplicity of functions associated with these regions could have different (non-mutually exclusive) causes: first, their neurons might respond to cognitive or emotional features that are common to all situations reported above (Craig, 2009; Singer et al., 2009; Lindquist et al., 2011; Shackman et al., 2011); second, they might contain distinct (but nearby) neuronal populations each involved in specific processes. Therefore, cingulate or insular activation alone cannot be taken as conclusive evidence for “shared” pain, nor interpreted as necessarily reflecting the recruitment of similar processes, pain-related or otherwise. Our results are critical in this perspective: first, they provide unprecedented evidence that pain felt by oneself and seen in others do not only share insula and cingulate activity in general, but those specific components in the heterogeneous insular and cingulate signal that are maximally informative about nociception; second, they provide much more stringent (although still indirect) evidence in favor of the recruitment of the same neuronal population(s) for the two kinds of pain. In particular, we distinguished between regions whose activation is shared only at a macroscopical level, such as the PCG and midbrain, from those regions whose activation is shared also at the pattern level, such as insula and MCC. Such distinction could not be achieved by previous studies relying only on univariate approaches. MVPA has been used successfully in several recent studies to determine whether a unique activation pattern generalizes across independent conditions. For instance, the premotor cortex exhibits patterns that are sensitive to a body part movement (mouth, hand) either when the movement is executed or perceived through audition (Etzel et al., 2008); likewise, patterns sensitive to given visual stimuli in the prefrontal cortex are reinstated when the same stimuli are held in working memory (Lewis-Peacock and Postle, 2008); finally, both medial prefrontal and superior temporal cortices disclose patterns associated with specific emotions perceived in either voice, face, or body expressions (Peelen et al., 2010). To the best of our knowledge, the current study is the first to test whether similar distributed patterns are evoked by felt and perceived pain. MVPA has often been considered to allow inference from fMRI data at a sub-voxel resolution (Haynes and Rees, 2005; Kamitani and Tong, 2006), but this view was recently challenged by studies showing that large-scale biases also contribute to decoding (Op de Beeck, 2010; Freeman et al., 2011). Because this might also apply to our study, two interpretations are possible to account for our results: first, a unique population of insular/ cingulate neurons might underlie activations associated with pain that is felt and seen; alternatively, the same spatial bias might Corradi-Dell’Acqua et al. • Shared Patterns of Activity in the Pain Matrix 18004 • J. Neurosci., December 7, 2011 • 31(49):17996 –18006 Figure 4. Multivariate pattern analysis. Whole-brain maps show areas in which voxels had d⬘ (classification analysis, blue and magenta blobs) and rf (correlation analyses, yellow blobs) significantly greater than zero, reflecting the degree of similarity between the pain-related activation patterns in the localizer and handedness task sessions. Overlaps between magenta and blue blobs are displayed in light pink, whereas overlaps between yellow and blue blobs are displayed in light turquoise. A, Regions exhibiting shared patterns between the noxious versus non-noxious (pain localizer) and NegPainful versus NeuPainful contrasts (handedness task), corresponding to felt and seen pain, respectively. B, Regions exhibiting shared patterns between the noxious versus non-noxious (pain localizer) and NegPainless versus NeuPainless contrasts (handedness task). The different classification analyses are depicted in distinct colors with arrows illustrating the different procedures: experimental conditions on the arrow’s left side are those on which the classifier is trained, conditions on the arrow’s right side are those on which the classifier is tested. Table 6. ROI analysis Classification (d⬘) Region of interest 1 Left AIns Right AIns 2 Left MIns 3 Right MIns 4 MCC 3 Left PCG/SMG 3 Right PCG/SMG 3 Midbrain 3 Left ventral occipital cortex 3 Right ventral occipital cortex 3 Size Felt 3 seen 9 185 229 734 418 251 664 25 497 0.09 关⫾0.07兴** 0.12 关⫾0.05兴*** 0.04 关⫾0.06兴 0.07 关⫾0.04兴** 0.06 关⫾0.06兴* 0.03 关⫾0.06兴 0.03 关⫾0.06兴 0.06 关⫾0.05兴** ⬃0 关⫾0.05兴 154 ⫺0.02 关⫾0.04兴 Seen 3 felt Correlation (rf) 0.09 关⫾0.05兴*** 0.14 关⫾0.07兴*** 0.15 关⫾0.07兴*** 0.10 关⫾0.07兴** 0.03 关⫾0.06兴 ⬃0 关⫾0.06兴 0.04 关⫾0.05兴* 0.06 关⫾0.05兴* 0.07 关⫾0.04兴*** 0.07 关⫾0.08兴* 0.06 关⫾0.07兴* 0.06 关⫾0.08兴 0.04 关⫾0.03兴** 0.05 关⫾0.09兴 0.06 关⫾0.10兴 0.02 关⫾0.07兴 ⬃0 关⫾0.02兴 ⫺0.05 关⫾0.07兴 ⬃0 关⫾0.02兴 ⻫ ⻫ ⻫ ⻫ ⫺0.06 关⫾0.08兴 Each ROI is described in terms of the functional contrast defining it (e.g., noxious ⬎ non-noxious in conjunction with 关艚兴 NegPainful ⬎ NeuPainful), the number of consecutive voxels comprehending it, their associated average d⬘ and rf values (brackets refer to 95% confidence intervals), the significance (***p ⬍ 0.001, **p ⬍ 0.01, *p ⬍ 0.05) of permutation-based one-sample t test testing for d⬘ and rf ⬎ 0, and whether these tests yielded to significant effects consistent across all MVPA approaches (⻫). ROI defined by the analysis 1classification: seen 3 felt 艚 correlation; 2classification: felt 3 seen 艚 seen 3 felt; and 3noxious ⬎ non-noxious 艚 NegPainful ⬎ NeuPainful. 4Same effects with either noxious ⬎ non-noxious 艚 NegPainful ⬎ NeuPainful or noxious ⬎ non-noxious 艚 NegPainful ⬎ NegPainless, although the former ROI (1099 voxels) also involves portions of AIns. originate from two or more independent populations that would need to be highly spatially and functionally correlated in such a way that similar voxel patterns would still arise in different conditions. The latter interpretation (although possible) is less parsimonious. In either case, our results support the notion that pain-related information embedded in insular and cingulate activity is shared between oneself and others. Like previous studies using MVPA (Haynes and Rees, 2005; Etzel et al., 2008), we tested for just-above-chance correlations between voxels. Such an approach reveals effects that are reliable and significant, although often small and associated with a consistent amount of residual (non-shared) spatial variability. Such non-shared variability could reflect (1) noise from data acquisition and analysis, (2) discriminative changes in firing rate in some parts of the shared neuronal populations among the conditions (Dinstein et al., 2008), or (3) the copresence of activations specific for pain in one modality only. Moreover, the presence of modality-specific pain signals mixed with shared signals might also lead to asymmetrical classification effects, as found here for the bilateral PCG/SMG, in which significant results were obtained only when training a classifier on the handedness task data and then testing it on the pain localizer (seen3felt), but not vice Corradi-Dell’Acqua et al. • Shared Patterns of Activity in the Pain Matrix versa (felt3seen). Although somatosensory regions have been implicated previously in coding others’ pain (for review, see Keysers et al., 2010), it is possible that the non-significant felt3seen classification might indicate that a smaller percentage of nociceptive neurons with bimodal properties exist in this area, such that the portion of the signal informative about one’s felt pain is estimated mainly from unimodal neuronal populations [Etzel et al. (2008) raised a similar argument for executed/observed actions in premotor areas]. What information is shared? Our results distinguished between two subportions of the shared pain matrix: right MIns and MCC exhibited shared patterns of activity exclusively when pictures displayed actual pain; instead, AIns also responded to negative stimuli in which pain was neither visible nor perceptually rated. Thus, whereas MIns and MCC data converge with embodied accounts of processing others’ pain (de Vignemont and Singer, 2006; Goldman and de Vignemont, 2009), the functional properties of AIns go beyond the mirroring of somatic experiences and involve processes that are also common to the perception of other affective stimuli. Several findings support this heterogeneity within the insula. For instance, a meta-analysis using a Bayesian approach found that it is the activity in MIns (but not AIns) that is the most likely revealing of pain-related tasks (Yarkoni et al., 2011). Clinical observations (Greenspan et al., 1999; Starr et al., 2009) suggest that abnormal pain thresholds follow lesions in middle/posterior insula, but not selective AIns damage. Electrophysiological studies on epileptic patients demonstrated that painful/thermal sensations are elicited by stimulation of MIns but not AIns (Afif et al., 2010). Finally, patients with congenital insensitivity to pain do not recruit, when watching injured body parts, the middle/posterior insula, although they still exhibit the same AIns activation as healthy controls (Danziger et al., 2006). The apparent causal role played by MIns in nociception, combined with evidence of MIns activity when processing others’ pain (Lamm et al., 2011), would speak in favor of embodied accounts of pain empathy, but only in the assumption that signals associated with one’s and others’ sensations originate from the same neural ensemble. Our data support this assumption. On the other hand, neuroimaging data suggest that, whereas MIns may code physical properties of painful stimuli, AIns primarily reflects its perceived unpleasantness (Rainville et al., 1997; Craig et al., 2000). Furthermore, AIns has been more generally implicated in pain expectation/prediction. Increased aching sensations occur when a noxious event is preceded by an informative cue and reflect pre-stimulation activity in AIns (Porro et al., 2002; Atlas et al., 2010; Wiech et al., 2010). AIns shared properties have also been documented for painless emotional states, such as disgust (Wicker et al., 2003; Jabbi et al., 2007) or even positive events (Hennenlotter et al., 2005; Jabbi et al., 2007). Finally, AIns activity correlates with physiological indices of emotional arousal (galvanic response, hearth beat, etc.) and their voluntary control (Critchley et al., 2000, 2004), as well as with anxiety level (Critchley et al., 2004). These findings led to recent proposals according to which AIns integrates MIns’ interoceptive representations with contextual/ emotional information into a higher-level “meta-representation” (Craig, 2003, 2009) or predictive models about the affective consequence of events (Singer et al., 2009; Lamm and Singer, 2010). In this perspective, the shared properties of AIns outlined in our study may not reflect the mirroring of a somatic sensation, but the coding of their most likely emotional effects (e.g., fear or aversion). Indeed, J. Neurosci., December 7, 2011 • 31(49):17996 –18006 • 18005 although frequently associated with noxious sensations, emotional responses are not limited to this experience and might occur also in painless contexts, such as those seen in the NegPainless images in our study. Our data extend current theoretical accounts of empathy by defining both anatomically and functionally two sets of regions in the pain matrix that exhibit different shared properties: one (MIns and MCC) sharing information specific to the presence of pain, and the other (AIns) sharing information about its associated emotional effects. References Afif A, Minotti L, Kahane P, Hoffmann D (2010) Anatomofunctional organization of the insular cortex: a study using intracerebral electrical stimulation in epileptic patients. Epilepsia 51:2305–2315. Ashburner JT, Friston KJ (2004) Rigid body registration In: Human brain function (Frackowiak RSJ, Ashburner JT, Penny WD, Zeki S, eds), pp 653– 655. San Diego: Academic. Atlas LY, Bolger N, Lindquist MA, Wager TD (2010) Brain mediators of predictive cue effects on perceived pain. J Neurosci 30:12964 –12977. Bastiaansen JACJ, Thioux M, Keysers C (2009) Evidence for mirror systems in emotions. Philos Trans R Soc Lond B Biol Sci 364:2391–2404. Boser BE, Guyon IM, Vapnik VN (1992) A training algorithm for optimal margin classifiers. In: Proceedings of the fifth annual workshop on computational learning theory, p. 144 –152. New York: Association for Computing Machinery. Caruana F, Jezzini A, Sbriscia-Fioretti B, Rizzolatti G, Gallese V (2011) Emotional and social behaviors elicited by electrical stimulation of the insula in the macaque monkey. Curr Biol 21:195–199. Cheng Y, Lin CP, Liu HL, Hsu YY, Lim K-E, Hung D, Decety J (2007) Expertise modulates the perception of pain in others. Curr Biol 17:1708 –1713. Collignon A, Maes F, Delaere D, Vandermeulen D, Suetens P, Marchal G (1995) Automated multi-modality image registration based on information theory. In: 14th International conference on information processing in medical imaging (Bizais Y, Barillot C, Di Paola R, eds), pp 263–274. Dordrecht, The Netherlands: Kluwer Academic. Collins DL, Neelin P, Peters TM, Evans AC (1994) Automatic 3D intersubject registration of MR volumetric data in standardized Talairach space. J Comput Assist Tomogr 18:192–205. Corbetta M, Patel G, Shulman GL (2008) The reorienting system of the human brain: from environment to theory of mind. Neuron 58:306 –324. Corradi-Dell’Acqua C, Tomasino B, Fink GR (2009) What is the position of an arm relative to the body? Neural correlates of body schema and body structural description. J Neurosci 29:4162– 4171. Craig AD (2003) Interoception: the sense of the physiological condition of the body. Curr Opin Neurobiol 13:500 –505. Craig AD (2009) How do you feel—now? The anterior insula and human awareness. Nat Rev Neurosci 10:59 –70. Craig AD, Chen K, Bandy D, Reiman EM (2000) Thermosensory activation of insular cortex. Nat Neurosci 3:184 –190. Critchley HD, Elliott R, Mathias CJ, Dolan RJ (2000) Neural activity relating to generation and representation of galvanic skin conductance responses: a functional magnetic resonance imaging study. J Neurosci 20:3033–3040. Critchley HD, Wiens S, Rotshtein P, Ohman A, Dolan RJ (2004) Neural systems supporting interoceptive awareness. Nat Neurosci 7:189 –195. Danziger N, Prkachin KM, Willer JC (2006) Is pain the price of empathy? The perception of others’ pain in patients with congenital insensitivity to pain. Brain 129:2494 –2507. Decety J, Lamm C (2006) Human empathy through the lens of social neuroscience. ScientificWorldJournal 6:1146 –1163. Derntl B, Finkelmeyer A, Eickhoff SB, Kellermann T, Falkenberg DI, Schneider F, Habel U (2010) Multidimensional assessment of empathic abilities: neural correlates and gender differences. Psychoneuroendocrinology 35:67– 82. de Vignemont F, Singer T (2006) The empathic brain: how, when and why? Trends Cogn Sci 10:435– 441. Dinstein I, Gardner JL, Jazayeri M, Heeger DJ (2008) Executed and observed movements have different distributed representations in human aIPS. J Neurosci 28:11231–11239. Ethofer T, Van De Ville D, Scherer K, Vuilleumier P (2009) Decoding of 18006 • J. Neurosci., December 7, 2011 • 31(49):17996 –18006 emotional information in voice-sensitive cortices. Curr Biol 19:1028 –1033. Ethofer T, Gschwind M, Vuilleumier P (2011) Processing social aspects of human gaze: a combined fMRI-DTI study. Neuroimage 55:411– 419. Etzel JA, Gazzola V, Keysers C (2008) Testing simulation theory with crossmodal multivariate classification of fMRI data. PLoS One 3:e3690. Evans AC, Marrett S, Neelin P, Collins DL, Worsley K, Dai W, Milot S, Meyer E, Bub D (1992) Anatomical mapping of functional activation in stereotactic coordinate space. Neuroimage 1:43–53. Evans AC, Kamber M, Collins DL, MacDonald D (1994) An MRI based probabilistic atlas of neuroanatomy In: Magnetic resonance scanning and epilepsy (Shorvon S, Fish D, Andermann F, Byder GM, eds), pp 263–274. New York: Plenum. Farrell MJ, Laird AR, Egan GF (2005) Brain activity associated with painfully hot stimuli applied to the upper limb: a meta-analysis. Hum Brain Mapp 25:129 –139. Freeman J, Brouwer GJ, Heeger DJ, Merriam EP (2011) Orientation decoding depends on maps, not columns. J Neurosci 31:4792– 4804. Goldman A, de Vignemont F (2009) Is social cognition embodied? Trends Cogn Sci 13:154 –159. Good P (2000) Permutation tests, Ed 2. New York: Springler-Verlag. Green DM, Swets JA (1966) Signal detection theory and psychophysics. New York: Wiley. Greenspan JD, Lee RR, Lenz FA (1999) Pain sensitivity alterations as a function of lesion location in the parasylvian cortex. Pain 81:273–282. Gu X, Liu X, Guise KG, Naidich TP, Hof PR, Fan J (2010) Functional dissociation of the frontoinsular and anterior cingulate cortices in empathy for pain. J Neurosci 30:3739 –3744. Haynes JD, Rees G (2005) Predicting the orientation of invisible stimuli from activity in human primary visual cortex. Nat Neurosci 8:686 – 691. Hennenlotter A, Schroeder U, Erhard P, Castrop F, Haslinger B, Stoecker D, Lange KW, Ceballos-Baumann AO (2005) A common neural basis for receptive and expressive communication of pleasant facial affect. Neuroimage 26:581–591. Holmes CJ, Hoge R, Collins DL, Woods R, Toga AW, Evans AC (1998) Enhancement of MR images using registration for signal averaging. J Comput Assist Tomogr 22:324 –333. Jabbi M, Swart M, Keysers C (2007) Empathy for positive and negative emotions in the gustatory cortex. Neuroimage 34:1744 –1753. Kamitani Y, Tong F (2006) Decoding seen and attended motion directions from activity in the human visual cortex. Curr Biol 16:1096 –1102. Karnath H-O, Baier B (2010) Right insula for our sense of limb ownership and self-awareness of actions. Brain Struct Funct 214:411– 417. Keysers C, Kaas JH, Gazzola V (2010) Somatosensation in social perception. Nat Rev Neurosci 11:417– 428. Kiebel S, Holmes AP (2004) General linear model In: Human brain function (Frackowiak RSJ, Ashburner JT, Penny WD, Zeki S, eds), pp 725–760. San Diego: Academic. Knutson B, Taylor J, Kaufman M, Peterson R, Glover G (2005) Distributed neural representation of expected value. J Neurosci 25:4806 – 4812. Kosillo P, Smith AT (2010) The role of the human anterior insular cortex in time processing. Brain Struct Funct 214:623– 628. Kriegeskorte N, Goebel R, Bandettini P (2006) Information-based functional brain mapping. Proc Natl Acad Sci U S A 103:3863–3868. Kurth F, Zilles K, Fox PT, Laird AR, Eickhoff SB (2010) A link between the systems: functional differentiation and integration within the human insula revealed by meta-analysis. Brain Struct Funct 214:519 –534. Lamm C, Singer T (2010) The role of anterior insular cortex in social emotions. Brain Struct Funct 214:579 –591. Lamm C, Meltzoff AN, Decety J (2010) How do we empathize with someone who is not like us? A functional magnetic resonance imaging study. J Cogn Neurosci 22:362–376. Lamm C, Decety J, Singer T (2011) Meta-analytic evidence for common and distinct neural networks associated with directly experienced pain and empathy for pain. Neuroimage 54:2492–2502. Lang PJ, Bradley MM, Cuthbert BN (1997) International Affective Picture System (IAPS): technical manual and affective ratings. Gainesville, FL: NIMH Center for the Study of Emotion and Attention. Corradi-Dell’Acqua et al. • Shared Patterns of Activity in the Pain Matrix Lewis-Peacock JA, Postle BR (2008) Temporary activation of long-term memory supports working memory. J Neurosci 28:8765– 8771. Lindquist KA, Wager TD, Kober H, Bliss-Moreau E, Barrett LF (2011) The brain basis of emotion: a meta-analytic review. Behav Brain Sci, in press. Menon V, Uddin LQ (2010) Saliency, switching, attention and control: a network model of insula function. Brain Struct Funct 214:655– 667. Morrison I, Peelen MV, Downing PE (2007) The sight of others’ pain modulates motor processing in human cingulate cortex. Cereb Cortex 17:2214 –2222. Ogino Y, Nemoto H, Inui K, Saito S, Kakigi R, Goto F (2007) Inner experience of pain: imagination of pain while viewing images showing painful events forms subjective pain representation in human brain. Cereb Cortex 17:1139 –1146. Op de Beeck HP (2010) Probing the mysterious underpinnings of multivoxel fMRI analyses. Neuroimage 50:567–571. Parsons LM (1987) Imagined spatial transformation of one’s body. J Exp Psychol Gen 116:172–191. Peelen MV, Atkinson AP, Vuilleumier P (2010) Supramodal representations of perceived emotions in the human brain. J Neurosci 30:10127–10134. Peyron R, Laurent B, García-Larrea L (2000) Functional imaging of brain responses to pain. A review and meta-analysis. Neurophysiol Clin 30:263–288. Porro CA, Baraldi P, Pagnoni G, Serafini M, Facchin P, Maieron M, Nichelli P (2002) Does anticipation of pain affect cortical nociceptive systems? J Neurosci 22:3206 –3214. Preuschoff K, Bossaerts P, Quartz SR (2006) Neural differentiation of expected reward and risk in human subcortical structures. Neuron 51:381–390. Rainville P (2002) Brain mechanisms of pain affect and pain modulation. Curr Opin Neurobiol 12:195–204. Rainville P, Duncan GH, Price DD, Carrier B, Bushnell MC (1997) Pain affect encoded in human anterior cingulate but not somatosensory cortex. Science 277:968 –971. Salimi-Khorshidi G, Smith SM, Keltner JR, Wager TD, Nichols TE (2009) Meta-analysis of neuroimaging data: a comparison of image-based and coordinate-based pooling of studies. Neuroimage 45:810 – 823. Shackman AJ, Salomons TV, Slagter HA, Fox AS, Winter JJ, Davidson RJ (2011) The integration of negative affect, pain and cognitive control in the cingulate cortex. Nat Rev Neurosci 12:154 –167. Singer T, Lamm C (2009) The social neuroscience of empathy. Ann N Y Acad Sci 1156:81–96. Singer T, Seymour B, O’Doherty J, Kaube H, Dolan RJ, Frith CD (2004) Empathy for pain involves the affective but not sensory components of pain. Science 303:1157–1162. Singer T, Critchley HD, Preuschoff K (2009) A common role of insula in feelings, empathy and uncertainty. Trends Cogn Sci 13:334 –340. Starr CJ, Sawaki L, Wittenberg GF, Burdette JH, Oshiro Y, Quevedo AS, Coghill RC (2009) Roles of the insular cortex in the modulation of pain: insights from brain lesions. J Neurosci 29:2684 –2694. Torta DM, Cauda F (2011) Different functions in the cingulate cortex, a meta-analytic connectivity modeling study. Neuroimage 56:2157–2172. Vrticka P, Sander D, Vuilleumier P (2011) Effects of emotion regulation strategy on brain responses to the valence and social content of visual scenes. Neuropsychologia 49:1067–1082. Wicker B, Keysers C, Plailly J, Royet JP, Gallese V, Rizzolatti G (2003) Both of us disgusted in My insula: the common neural basis of seeing and feeling disgust. Neuron 40:655– 664. Wiech K, Lin CS, Brodersen KH, Bingel U, Ploner M, Tracey I (2010) Anterior insula integrates information about salience into perceptual decisions about pain. J Neurosci 30:16324 –16331. Yang CY, Decety J, Lee S, Chen C, Cheng Y (2009) Gender differences in the mu rhythm during empathy for pain: an electroencephalographic study. Brain Res 1251:176 –184. Yarkoni T, Poldrack RA, Nichols TE, Van Essen DC, Wager TD (2011) Large-scale automated synthesis of human functional neuroimaging data. Nat Methods 8:665– 670.


© Copyright 2026