
Original Investigation GFR and Cardiovascular Outcomes After Acute Myocardial
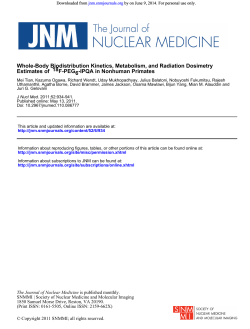
Original Investigation GFR and Cardiovascular Outcomes After Acute Myocardial Infarction: Results From the Korea Acute Myocardial Infarction Registry Eun Hui Bae, MD, PhD,1* Sang Yup Lim, MD, PhD,2* Kyung Hoon Cho, MD,1,3 Joon Seok Choi, MD,1 Chang Seong Kim, MD,1 Jeong Woo Park, MD, PhD,1 Seong Kwon Ma, MD, PhD,1 Myung Ho Jeong, MD, PhD,1,3 and Soo Wan Kim, MD, PhD1 Background: Despite strong evidence linking decreased glomerular filtration rate (GFR) to worse outcomes, the impact of GFR on mortality and morbidity in patients with acute myocardial infarction (AMI) is not well defined. Study Design: Retrospective cohort study. Setting & Participants: 12,636 patients with AMI in the Korea AMI Registry database from November 2005 to July 2008. 93% of patients in this registry had coronary angiography, and 91% of patients with coronary angiography had percutaneous coronary intervention (PCI). Predictor: GFR was estimated (eGFR) using the Chronic Kidney Disease Epidemiology Collaboration (CKD-EPI) equation, and patients were grouped into 5 eGFR categories: ⬎90, 60-89, 30-59, 15-29, and ⬍15 mL/min/1.73 m2. Outcomes: Primary end points were death and in-hospital complications. Secondary end points were major adverse cardiac events (MACEs) during a 1-month (short-term) and 1-year (long-term) follow-up after AMI. Results: Mean eGFR was 72.8 ⫾ 24.6 mL/min/1.73 m2, mean age was 64 ⫾ 13 years, and 70.4% were men. A graded association was observed between eGFR and clinical outcomes. In adjusted analyses, compared with eGFR ⬎90 mL/min/1.73 m2, patients with eGFR of 30-59, 15-29, and ⬍15 mL/min/1.73 m2 experienced increased risks of short- (respective HRs of 2.30 [95% CI, 1.70-3.11], 3.10 [95% CI, 2.14-4.14], and 3.64 [95% CI, 2.44-5.43]; P ⬍ 0.001) and long-term MACEs (HRs of 1.58 [95% CI, 1.32-1.90], 2.12 [95% CI, 1.63-2.75], and 2.50 [95% CI, 1.89-3.29]; P ⬍ 0.001). Older age, Killip class higher than I, PCI, and high-sensitivity C-reactive protein level also were associated with higher short- and long-term MACEs. Use of -blockers, angiotensin-converting enzyme (ACE) inhibitors or angiotensin receptor blockers (ARBs), and statins was associated with decreased risk of MACEs. Limitations: Single assessment of serum creatinine. Conclusion: eGFR was associated independently with mortality and complications after AMI. PCI, -blocker, ACE inhibitor or ARB, and statin use were associated with decreased risks of short- and long-term MACEs. Am J Kidney Dis. 59(6):795-802. © 2012 by the National Kidney Foundation, Inc. INDEX WORDS: Acute myocardial infarction; glomerular filtration rate; major adverse cardiac event. C hronic kidney disease (CKD) is a worldwide public health problem.1 Kidney function is a strong risk factor for fatal and nonfatal cardiovascular events,2 with patients requiring long-term renal replacement therapy at particularly high risk.3 The most common cause of death in patients with CKD is cardiovascular disease.4 There is limited accuracy in using serum creatinine level as an indicator of kidney function on account of a nonlinear association with glomerular filtration rate (GFR) that varies by age, sex, race, and lean body mass.5,6 As a result, the National Kidney Foundation recommends using estimates of GFR determined from validated equations instead of serum creatinine level to define decreased kidney function. Moreover, recent studies suggested that even mildly decreased kidney function is an independent predictor of long-term mortality in patients who have known or suspected coronary artery disease.5,7,8 The reasons for this assoAm J Kidney Dis. 2012;59(6):795-802 ciation may be higher prevalences of coronary risk factors and lower use of established strategies to modify cardiovascular risk.9 However, although there is strong evidence linking lower GFR to poorer outcomes, the effect of GFR on mortality and morbidity From the 1Department of Internal Medicine, Chonnam National University Medical School, Gwangju; 2Department of Internal Medicine, Korea University, Ansan; and 3Cardiovascular Research Institute of Chonnam National University, Gwangju, Korea. * E.H.B. and S.Y.L. contributed equally to this work. Received April 29, 2011. Accepted in revised form January 21, 2012. Originally published online March 26, 2012. Address correspondence to Soo Wan Kim, MD, PhD, Department of Internal Medicine, Chonnam National University Medical School, Hakdong 8, Dongku, Gwangju 501-757, Korea. E-mail: [email protected] © 2012 by the National Kidney Foundation, Inc. 0272-6386/$36.00 doi:10.1053/j.ajkd.2012.01.016 795 Bae et al in patients who experience acute myocardial infarction (AMI) may not be fully appreciated, and patients with decreased GFR receiving acute cardiac care may receive less aggressive treatments than usual or be less likely to received evidence-based therapies as those without decreased GFR.10-13 In addition, providers may be hesitant to explore coronary anatomy due to potential contrast toxicity. The present study was undertaken to evaluate the effect of kidney function on clinical outcomes, including major adverse cardiac events (MACEs), in patients with AMI. In addition, we explored prognostic factors of AMI in relation to level of GFR. METHODS Korea AMI Registry The Korea AMI Registry (KAMIR) is a prospective multicenter online registry designed to describe characteristics and clinical outcomes of patients with AMI and reflects current management of patients with AMI in Korea. The registry included 52 community and university hospitals with the capability of primary percutaneous coronary intervention (PCI). Data were collected retrospectively at each site by a trained study coordinator based on a standardized protocol. We analyzed the enrolled data to investigate the impact of GFR on mortality and morbidity in patients with AMI. The study protocol was approved by the ethics committee at each participating institution, and all patients were informed about their participation in this registry. Study Design and Patient Population The registry included 13,901 consecutive patients who were admitted to the hospital between November 2005 and July 2008, whose discharge diagnosis was AMI based on cardiac enzyme levels and electrocardiographic findings. Patients who were lost to follow-up within 1 year of AMI and those with missing data were excluded. Overall, 12,636 patients (91% of the cohort) had all data available for calculation of estimated GFR (eGFR) and constituted the final study sample. Exposure The CKD Epidemiology Collaboration (CKD-EPI) equation was used to estimate GFR in milliliters per minute per 1.73 m2.14 Serum creatinine concentration was determined by the Jaffé method, which was calibrated to isotope-dilution mass spectrometry. Patients were divided into 5 eGFR groups corresponding to strata used to define CKD stages9: ⱖ90, ⱖ60-⬍90, ⱖ30-⬍60, ⱖ15⬍30, and ⬍15 mL/min/1.73 m2. Outcomes AMI was defined as the presence of clinical signs or symptoms: increased cardiac biomarker levels (creatine kinase-MB [0-25 U/L], troponin I [0-0.1 ng/mL], or troponin T [0-0.04 ng/mL]), and 12-lead electrocardiographic findings. For patients with AMI, ST-segment elevation myocardial infarction (STEMI) was defined as the presence of new ST-segment elevation of at least 1 mm (0.1 mV) in continuous leads or new left bundle-branch block on the index electrocardiogram, and those who were not classified as STEMI were considered to have non-STEMI (NSTEMI) given the presence of positive biomarkers in all. Left ventricular ejection fraction (LVEF) was checked by 2-dimensional echocardiography using a modified Simpson’s method. Primary end points were 796 death and complications, including cardiogenic shock, ventricular tachycardia and fibrillation (need for antiarrhythmic agent and/or defibrillation), atrioventricular block (need for pacemaker), recurrent ischemia and myocardial infarction (MI), cerebrovascular accident, major bleeding, or multiorgan failure during hospitalization. Secondary end points were MACEs, including cardiac death, MI or stroke, need for emergency or elective repeated revascularization, or coronary artery bypass graft (CABG) surgery during follow-up. Other Variables Baseline variables included age, sex, body mass index, and several coronary risk factors, including hypertension (defined as history of hypertension, admission blood pressure ⬎140 mm Hg systolic or ⬎90 mm Hg diastolic), current smoking, previous history of ischemic heart disease, hyperlipidemia (defined as history of hyperlipidemia, total cholesterol level of 240 mg/dL, or low-density lipoprotein [LDL] cholesterol level ⬎101 mg/dL), diabetes mellitus (DM; defined as history of DM or random blood glucose level ⬎200 mg/dL), clinical symptoms at admission (chest pain or dyspnea), high-sensitivity C-reactive protein (hs-CRP) level, and Killip class. Use of certain medications was recorded on admission (aspirin, angiotensin-converting enzyme [ACE] inhibitors, angiotensin receptor blockers [ARBs], diuretics, statins, -blockers, or vasopressors). Surgical interventions (CABG, thrombolysis, or PCI) and coronary care unit stay were recorded. Statistical Analysis Continuous variables with normal distributions were expressed as mean ⫾ standard deviation for each of the 5 groups based on level of kidney function and were compared using 1-way analysis of variance. Continuous data with skewed distribution were presented as median (with 25th and 75th percentiles) and compared using the Kruskal-Wallis test. Categorical variables were compared using 2 tests, when appropriate. All P values were 2 sided, with ␣ ⫽ 0.05. Univariate and multivariate analyses were performed to determine the prognostic significance of clinical variables for in-hospital and long-term clinical end points. Variables with P ⬍ 0.25 on univariate analysis were entered into multivariate logistic regression models and Cox proportional hazard models. Multivariate logistic regression modeling was used to compare in-hospital outcomes by eGFR stratum, and candidates for adjustment included age, sex, comorbid conditions (previous MI, DM, hypertension, elevated lipid concentrations, and current smoking), Killip class higher than I, LVEF ⬍40%, therapeutic modalities and medical treatments during hospitalization, angiographic findings, and PCI-related complications. Cox proportional hazards modeling was used to compare 1-month and 1-year clinical outcomes by eGFR. The following variables were included in adjustment: age, sex, comorbid conditions (previous MI, previous PCI, DM, hypertension, and current smoking), Killip class higher than I, LVEF ⬍40%, therapeutic modalities, medical treatments during hospitalization, and hs-CRP level. Increasingly adjusted models were built for 1-month and 1-year MACEs to assess the relative confounding contributed by certain factors. Statistical analysis was done with SPSS software, version 17.0 for Windows (SPSS Inc, www.spss. com). RESULTS Baseline Characteristics A total of 12,636 patients were included in the present study; 3,491 (27.6%) patients with eGFR ⬎90 mL/min/ Am J Kidney Dis. 2012;59(6):795-802 GFR in Acute Myocardial Infarction Table 1. Baseline Characteristics Baseline Variables Age (y) Men BMI (kg/m2) Risk factor Hypertension Diabetes mellitus Smoking Hyperlipidemia History of IHD At admission SBP (mm Hg) DBP (mm Hg) Killip class Diagnosis STEMI NSTEMI Group 1 eGFR >90 (n ⴝ 3,491) Group 2 eGFR 60-89 (n ⴝ 5,791) Group 3 eGFR 30-59 (n ⴝ 2,609) Group 4 eGFR 15-29 (n ⴝ 439) Group 5 eGFR <15 (n ⴝ 306) P 55.1 ⫾ 10.5 2,799 (80.2) 64.1 ⫾ 11.8 4,215 (72.8) 71.9 ⫾ 10.2 1,485 (56.9) 73.7 ⫾ 9.5 211 (48.1) 66.2 ⫾ 12.3 178 (58.2) ⬍0.001 ⬍0.001 24.3 ⫾ 3.5 24.0 ⫾ 3.5 23.5 ⫾ 3.5 23.0 ⫾ 3.3 23.5 ⫾ 4.1 ⬍0.001 1,334 (38.2) 751 (21.5) 2,618 (45.2) 1,390 (24.0) 1,649 (63.2) 965 (37.0) 331 (75.3) 241 (54.9) 222 (72.5) 176 (57.4) ⬍0.001 ⬍0.001 2,381 (68.2) 363 (10.4) 394 (11.3) 3,463 (59.8) 521 (9.0) 880 (15.2) 1,143 (43.8) 243 (9.3) 556 (21.3) 167 (38.1) 51 (11.7) 123 (28.0) 110 (35.8) 35 (11.6) 93 (30.5) ⬍0.001 0.06 ⬍0.001 131.3 ⫾ 25.9 81.1 ⫾ 20.1 128.8 ⫾ 27.7 78.4 ⫾ 16.6 122.7 ⫾ 33.8 74.8 ⫾ 26.5 120.7 ⫾ 36.1 71.9 ⫾ 20.0 134.4 ⫾ 38.7 78.9 ⫾ 20.9 ⬍0.001 ⬍0.001 1.3 ⫾ 0.5 1.5 ⫾ 0.9 1.8 ⫾ 1.0 2.1 ⫾ 1.1 2.2 ⫾ 1.2 ⬍0.001 2,170 (62.2) 1,343 (37.8) 3,614 (62.4) 2,226 (37.6) 1,499 (59.4) 1,021 (40.6) 165 (45.1) 217 (54.9) 112 (38.9) 169 (61.1) ⬍0.001 ⬍0.001 Note: Categorical variables given as number (percentage); continuous variables, as mean ⫾ standard deviation. eGFR given in mL/min/1.73 m2. Abbreviations: BMI, body mass index; DBP, diastolic blood pressure; eGFR, estimated glomerular filtration rate; IHD, ischemic heart disease; NSTEMI, non–ST-segment myocardial infarction; SBP, systolic blood pressure; STEMI, ST-segment elevation myocardial infarction. 1.73 m2; 5,791 (45.8%) with eGFR of 60-89 mL/min/1.73 m2; 2,609 (20.6%) with eGFR of 30-59 mL/min/1.73 m2; 439 (3.5%) with eGFR of 15-29 mL/min/1.73 m2; and 306 (2.4%) with eGFR ⬍15 mL/min/1.73 m2; 61.6% had STEMI; and 39.4% had NSTEMI. Table 1 lists baseline characteristics of patients by eGFR category at baseline. Overall, median follow-up was 404 days, mean age was 64 years, 70.4% were men, and mean body mass index was 24 kg/m2. Hypertension was present in 48.8%, DM was present in 27.7%, 42.7% were current smokers, hyperlipidemia was present in 9.5%, and 16% had a history of ischemic heart disease. Lower GFR was associated with older age, higher prevalence of hypertension and DM, lower prevalence of current smoking, and higher Killip class. The proportion of patients who had NSTEMI was higher in patients with lower eGFR categories. Biochemical Parameters, LVEF, and Coronary Angiographic Findings Table 2 summarizes baseline continuous variables. Total cholesterol levels, LDL cholesterol levels, and LVEF were lower, whereas hs-CRP and NT-pro-BNP (N-terminal pro–B-type natriuretic peptide) levels were higher in patients with lower eGFR. Table 3 lists findings from coronary angiography: the number of involved vessels was higher with more decreased eGFR. In contrast, the prevalence of 1-vessel disease Am J Kidney Dis. 2012;59(6):795-802 was higher in patients with relatively normal kidney function. Other findings, such as infarct-related artery, American College of Cardiology/American Heart Association classification,15 and Thrombolysis in Myocardial Infarction (TIMI) flow, also varied by eGFR category. Hospital Treatment on Admission by Kidney Function and Medication Table 4 lists receipt of specific treatments at admission by eGFR category. The use of thrombolysis and PCI generally was lower with lower eGFR categories, although PCI use was slightly higher in patients with eGFR ⬍15 mL/min/1.73 m2 than in those with eGFR of 15-29 mL/min/1.73 m2 (Fig 1A). On the contrary, use of CABG was increased in patients with more greatly decreased kidney function. Use of -blockers, ACE inhibitors or ARBs, and statins was lower in patients with more decreased kidney function, again with the exception of patients with eGFR ⬍15 mL/min/ 1.73 m2 (Fig 1B). In contrast, lower eGFR was associated with higher use of vasopressors and diuretics. Outcomes According to eGFR Table 5 lists in-hospital, short-term, and long-term outcomes according to eGFR. The estimated inhospital death rate was 1.2% in patients with eGFR 797 Bae et al Table 2. Biochemical Parameters and LVEF Baseline Variables Group 1 eGFR >90 (n ⴝ 3,491) Group 2 eGFR 60-89 (n ⴝ 5,791) Group 3 eGFR 30-59 (n ⴝ 2,609) Group 4 eGFR 15-29 (n ⴝ 439) Group 5 eGFR <15 (n ⴝ 306) P 100 ⫾ 9.9 75 ⫾ 8.5 47 ⫾ 8.2 23 ⫾ 4.2 7.6 ⫾ 3.7 ⬍0.001 Troponin T (ng/mL) 1.4 (0.3-5.2) 1.8 (0.4-5.6) 1.9 (0.4-6.0) 2.9 (0.8-8.0) 1.6 (0.3-5.8) 0.06 Troponin I (ng/mL) 22 (4-50) 19 (3-50) 17 (3-50) 14 (4-44) 14 (3-45) 0.8 80 (21-206) 79 (19-211) 56 (15-177) 32 (12-100) 29 (10-105) ⬍0.001 Total cholesterol (mg/dL) 184 (158-213) 180 (155-208) 172 (145-203) 164 (135-192) 165 (135-197) ⬍0.001 LDL cholesterol (mg/dL) 119 (96-145) 114 (92-138) 108 (85-134) 98 (71-128) 98 (75-131) ⬍0.001 eGFR (mL/min/1.73 m2) CK-MB (U/L) hs-CRP (mg/dL) 0.7 (0.2-3.2) 0.8 (0.2-4.1) 1.6 (0.3-8.2) 4.1 (0.9-15.2) 2.6 (0.6-11.4) ⬍0.001 NT-pro-BNP (pg/mL) 255 (69-849) 430 (105-1,526) 1,750 (354-5,594) 7,575 (2,213-22,424) 24,777 (6,382-35,000) ⬍0.001 LVEF (%) 53.5 ⫾ 11.1 51.9 ⫾ 12.1 48.0 ⫾ 13.7 46.3 ⫾ 12.4 45.9 ⫾ 12.5 ⬍0.001 Note: Normally distributed variables given as mean ⫾ standard deviation; non–normally distributed variables, as median (25th-75th percentile). Conversion factors for units: eGFR in mL/min/1.73 m2 to mL/s/1.73 m2, ⫻0.01669; cholesterol in mg/dL to mmol/L, ⫻0.02586. No conversion necessary for troponins in ng/mL and g/L. Abbreviations: CK-MB, creatine kinase-MB; eGFR, estimated glomerular filtration rate; hs-CRP, high-sensitivity C-reactive protein; LDL, low-density lipoprotein; LVEF, left ventricle ejection fraction; NT-pro-BNP, N-terminal pro–B-type natriuretic peptide. ⬎90 mL/min/1.73 m2, but 18.3% in those with eGFR ⬍15 mL/min/1.73 m2. Mean length of coronary care unit stay was significantly increased at lower eGFRs. In 1 month, MACE, cardiac death, and noncardiac death rates were higher at lower GFRs, whereas rates of AMI and target-lesion revascularization did not differ across eGFR groups. At 12 months, MACE and cardiac death rates also increased with lower eGFR. Tables 6 and 7 list associations between baseline eGFR category and 1-month and 1-year MACEs in Table 3. Baseline Coronary Angiographic Findings Variable Group 1 eGFR >90 (n ⴝ 3,491) Group 2 eGFR 60-89 (n ⴝ 5,791) Group 3 eGFR 30-59 (n ⴝ 2,609) Group 4 eGFR 15-29 (n ⴝ 439) Group 5 eGFR <15 (n ⴝ 306) 3,358 (96.2) 5,562 (96.0) 2,270 (87.0) 319 (72.6) 249 (81.4) 0.001 P Coronary angiography Infarct-related artery Left anterior descending artery Left circumflex artery Right coronary artery Left main stem 1,713 (51.0) 2,648 (47.6) 981 (43.2) 108 (33.7) 109 (43.9) ⬍0.001 581 (17.3) 1,007 (30.0) 57 (1.7) 940 (16.9) 1,874 (33.7) 100 (1.8) 327 (14.4) 890 (39.2) 73 (3.2) 56 (17.5) 141 (44.1) 15 (4.8) 52 (20.9) 75 (30.0) 13 (5.2) 0.02 ⬍0.001 ⬍0.001 Involved vessel number 1 vessel 2 vessels 3 vessels Left main, complex Left main, isolated 1,679 (50.0) 960 (28.6) 635 (18.9) 67 (2.0) 17 (0.5) 2,357 (43.2) 1,713 (31.4) 1,233 (22.6) 136 (2.5) 16 (0.3) 692 (30.5) 697 (30.7) 788 (34.7) 84 (3.7) 9 (0.4) 72 (22.7) 98 (30.6) 127 (39.7) 20 (6.3) 2 (0.6) 62 (24.8) 68 (27.4) 105 (42.3) 13 (5.1) 1 (0.4) ⬍0.001 0.08 ⬍0.001 ⬍0.001 ⬍0.001 ACC/AHA classification A B1 B2 C 161 (4.8) 651 (19.4) 987 (29.4) 1,558 (46.4) 267 (4.9) 955 (17.5) 1,522 (27.9) 2,711 (49.7) 95 (4.2) 370 (16.3) 581 (25.6) 1,224 (53.9) 18 (5.5) 49 (15.4) 62 (19.5) 190 (59.6) 7 (2.8) 38 (15.4) 58 (23.4) 145 (58.4) 0.5 0.04 ⬍0.001 ⬍0.001 TIMI flow TIMI 0 TIMI 1 TIMI 2 TIMI 3 1,417 (42.2) 386 (11.6) 500 (14.9) 1,054 (31.4) 2,471 (45.3) 611 (11.2) 878 (16.1) 1,495 (27.4) 547 (24.1) 406 (17.9) 295 (13.0) 1,022 (45.0) 133 (41.8) 39 (12.1) 44 (13.7) 103 (32.4) 80 (31.2) 29 (11.8) 41 (16.6) 98 (39.4) ⬍0.001 0.07 0.08 ⬍0.001 Note: Values given as number (percentage). eGFR given in mL/min/1.73 m2. Abbreviations: ACC/AHA; American College of Cardiology/American Heart Association; eGFR, estimated glomerular filtration rate; TIMI; Thrombolysis in Myocardial Infarction. 798 Am J Kidney Dis. 2012;59(6):795-802 GFR in Acute Myocardial Infarction Table 4. Hospital Treatment at Admission Medical therapy Thrombolysis PCI CABG Aspirin -Blocker ACEi ARB Statin Diuretics Vasopressor Group 1 eGFR >90 (n ⴝ 3,491) Group 2 eGFR 60-89 (n ⴝ 5,791) Group 3 eGFR 30-59 (n ⴝ 2,609) Group 4 eGFR 15-29 (n ⴝ 439) Group 5 eGFR <15 (n ⴝ 306) P 398 (11.4) 44 (1.3) 2,979 (85.3) 70 (2.0) 3,453 (98.9) 2,719 (77.9) 2,639 (75.6) 429 (12.3) 2,726 (78.1) 684 (19.6) 461 (13.2) 689 (11.9) 63 (1.1) 4,876 (84.2) 162 (2.8) 5,722 (98.8) 4,198 (72.5) 4,129 (71.3) 776 (13.4) 4,297 (74.2) 1,633 (28.2) 984 (17.0) 524 (20.1) 34 (1.3) 1,974 (75.7) 76 (2.9) 2,539 (97.3) 1,709 (65.5) 1,680 (64.4) 454 (17.4) 1,730 (66.3) 1,255 (48.1) 376 (14.5) 144 (32.8) 4 (0.9) 257 (58.5) 34 (7.8) 422 (96.1) 262 (59.7) 244 (55.6) 82 (18.7) 268 (61.0) 287 (65.4) 143 (32.6) 97 (31.8) 2 (0.7) 206 (67.3) 1 (0.2) 296 (96.7) 211 (69.0) 164 (53.6) 86 (28.1) 181 (59.2) 148 (48.4) 97 (31.7) ⬍0.001 ⬍0.001 ⬍0.001 ⬍0.001 ⬍0.001 ⬍0.001 ⬍0.001 ⬍0.001 ⬍0.001 ⬍0.001 ⬍0.001 Note: Values given as number (percentage). eGFR given in mL/min/1.73 m2. Abbreviations: ACEi, angiotensin-converting enzyme inhibitor; ARB, angiotensin receptor blocker; CABG, coronary artery bypass graft; eGFR, estimated glomerular filtration rate; PCI, percutaneous coronary intervention. increasingly adjusted models. Although attenuated, a monotonic increase in risk of these outcomes by lower eGFR was found. Table 8 lists associations of CKD with PCI and medication use. Use of PCI and use of a higher number of treatments from -blocker, ACE inhibitor or ARB, and statin therapy were associated with decreased risk of short- and long-term MACEs. DISCUSSION Cardiovascular disease in patients with CKD is common and has major implications in terms of both human suffering and health care cost. The present study evaluated prognostic factors and clinical outcomes of patients experiencing AMI by eGFR level. Interestingly, STEMI was more common in patients with higher eGFR category, whereas the prevalence of NSTEMI was higher in patients with lower eGFR category, as previously shown by others.16 These findings may suggest that loss of kidney function is an important correlate of cardiovascular risk factor profile: nontraditional risk factors become increasingly prevalent at lower kidney function, which may contribute to the pathogenesis of NSTEMI. Vascular calcification is common in patients with CKD and is one of the predictors of cardiovascular death.17 Lower eGFR category was associated significantly with dyspnea, higher Killip class, higher clinical manifestations on admission, and higher NT-pro-BNP level. Moreover, LVEF was decreased and Killip class was increased with more decreased kidney function. In contrast, LDL cholesterol level was significantly lower in patients with decreasing GFR. The decrease in GFR with age and the lower prevalence of hyperlipidemia may indicate increased malnutrition and inflammation in patients with severely decreased kidney function.18 LDL cholesterol levels were lowest in groups 4 and 5, which is remarkable in light of some Figure 1. Rates of (A) percutaneous coronary intervention (PCI) and (B) -blocker, angiotensin-converting enzyme inhibitor (ACEi) or angiotensin receptor blocker (ARB), and statin use. Am J Kidney Dis. 2012;59(6):795-802 799 Bae et al Table 5. Outcomes According to eGFR Outcomes CCU stay (d) In-hospital death Out-of-hospital outcome 1-mo MACEs Cardiac death Noncardiac death MI TLR 12-mo MACEs Cardiac death MI TLR Group 1 eGFR >90 (n ⴝ 3,491) Group 2 eGFR 60-89 (n ⴝ 5,791) Group 3 eGFR 30-59 (n ⴝ 2,609) Group 4 eGFR 15-29 (n ⴝ 439) Group 5 eGFR <15 (n ⴝ 306) P 3.3 ⫾ 3.4 42 (1.2) 3.5 ⫾ 3.3 174 (3.0) 4.7 ⫾ 5.6 305 (11.7) 6.6 ⫾ 8.5 88 (20.0) 6.7 ⫾ 9.9 56 (18.3) ⬍0.001 ⬍0.001 126 (3.6) 59 (1.7) 7 (0.2) 17 (0.5) 42 (1.2) 374 (11.5) 84 (2.4) 35 (1.0) 255 (7.3) 353 (6.1) 226 (3.9) 29 (0.5) 23 (0.4) 69 (1.2) 724 (12.5) 295 (5.1) 41 (0.7) 388 (6.7) 467 (17.9) 376 (14.4) 39 (1.5) 21 (0.8) 31 (1.2) 678 (26.0) 493 (18.9) 31 (1.2) 154 (5.9) 137 (31.2) 117 (26.7) 12 (2.7) 5 (1.0) 3 (0.8) 191 (43.4) 154 (35.0) 12 (2.7) 25 (5.7) 80 (26.2) 62 (20.2) 11 (3.7) 3 (1.1) 3 (1.1) 130 (42.5) 107 (35.1) 7 (2.2) 16 (5.2) ⬍0.001 ⬍0.001 ⬍0.001 0.1 0.2 ⬍0.001 ⬍0.001 0.001 0.001 Note: Categorical variables given as number (percentage); continuous variables, as mean ⫾ standard deviation. eGFR given in mL/min/1.73 m2. Abbreviations: CCU, coronary care unit; eGFR, estimated glomerular filtration rate; MACE, major adverse cardiac event; MI, myocardial infarction; TLR, target-lesion revascularization. previous studies in which lipid-lowering treatments did not reduce the risk of cardiovascular mortality in patients with advanced CKD.19,20 We also found that hs-CRP level was increased, whereas body mass index was decreased with lower eGFR. These findings suggest that individuals with advanced kidney dysfunction become more and more malnourished, as seen by low levels of albumin, prealbumin, and transferrin, which has been suggested to be a means by which inflammation is activated.18,21 Kidney failure leads to alterations in plasma components and endothelial structure and function that favor vascular injury, which potentially could help instigate the inflammatory response.22-24 The ongoing loss of kidney function in patients with CKD may result in dyslipidemia or accumulation of uremic toxins, which can trigger oxidative stress and inflammation and, as a result, have a role in endothelial dysfunction and worsening atherosclerosis.22 Our analysis confirms that by coronary angiography, there were more involved vessels in patients with more severely decreased kidney function, and significant independent predictors of shortand long-term MACEs. There is convincing evidence, obtained mainly through randomized controlled trials, of the benefits of aspirin, ACE inhibitors, -blockers, and statins in blocking recurrent events and improving survival after acute coronary syndrome.25 However, major cardiovascular disease trials frequently do not include patients with kidney disease, thus not providing data for the effect of interventions and treatment on patients with kidney disease.10,11,13 We found that use of -blockers, ACE inhibitors, and statins was associated with decreased risk of Table 6. Multivariate Analysis of 1-Month MACEs After AMI Outcomes Group 2: eGFR 60-89 (n ⴝ 5,791) Group 3: eGFR 30-59 (n ⴝ 2,609) Group 4: eGFR 15-29 (n ⴝ 439) Group 5: eGFR <15 (n ⴝ 306) Unadjusted (1) Adjusted for age (2) Model 1 ⫹ Killip class ⬎I (3) Model 2 ⫹ DM, HTN (4) Model 3 ⫹ hs-CRP (5) Model 4 ⫹ PCI (6) Model 5 ⫹ medicationb 1.75 (1.40-2.19)a 1.30 (1.03-1.65)a 1.18 (0.93-1.49) 1.20 (0.95-1.52) 1.28 (0.96-1.71) 1.30 (0.97-1.73) 1.16 (0.87-1.56) 5.76 (4.65-7.15)a 3.40 (2.67-4.33)a 2.62 (2.05-3.45)a 2.73 (2.15-3.47)a 2.84 (2.11-3.83)a 2.81 (2.09-3.78)a 2.30 (1.70-3.11)a 10.9 (8.44-14.3)a 6.09 (4.56-8.12)a 4.04 (3.00-5.43)a 4.34 (3.24-5.79)a 4.22 (2.93-6.09)a 3.76 (2.61-5.43)a 3.10 (2.14-4.14)a 8.85 (6.53-11.9)a 6.38 (4.65-8.74)a 4.17 (3.01-5.77)a 4.16 (3.02-5.74)a 4.45 (2.99-6.60)a 3.90 (2.61-5.82)a 3.64 (2.44-5.43)a Note: Analysis used sequential stratified adjustment with confounders. Values shown are hazard ratio (95% confidence interval). Group 1 (eGFR ⬎90 mL/min/1.73 m2; n ⫽ 3,491) is the reference group. Abbreviations: AMI, acute myocardial infarction; DM, diabetes mellitus; eGFR, estimated glomerular filtration rate; hs-CRP, high-sensitivity C-reactive protein; HTN, hypertension; MACE, major adverse cardiac event; PCI, percutaneous coronary intervention. a P ⬍ 0.05. b -Blockers, diuretics, angiotensin-converting enzyme inhibitors, angiotensin receptor blockers, and statins. 800 Am J Kidney Dis. 2012;59(6):795-802 GFR in Acute Myocardial Infarction Table 7. Multivariate Analysis of 1-Year MACEs After AMI Outcomes Group 2: eGFR 60-89 (n ⴝ 5,791) Group 3: eGFR 30-59 (n ⴝ 2,609) Group 4: eGFR 15-29 (n ⴝ 439) Group 5: eGFR <15 (n ⴝ 306) Unadjusted (1) Adjusted for age (2) Model 1 ⫹ Killip class ⬎I (3) Model 2 ⫹ DM, HTN (4) Model 3 ⫹ hs-CRP (5) Model 4 ⫹ PCI (6) Model 5 ⫹ medicationsb 1.23 (1.07-1.40)a 1.01 (0.88-1.17) 0.96 (0.84-1.11) 0.96 (0.83-1.11) 0.96 (0.81-1.13) 0.97 (0.82-1.14) 0.93 (0.79-1.09) 2.98 (2.60-3.42)a 2.12 (1.82-2.47)a 1.82 (1.56-2.12)a 1.77 (1.51-2.07)a 1.73 (1.45-2.07)a 1.73 (1.44-2.07)a 1.58 (1.32-1.90)a 5.29 (4.35-6.43)a 3.67 (2.98-4.51)a 2.82 (2.28-3.49)a 2.67 (2.15-3.31)a 2.43 (1.88-3.15)a 2.26 (1.74-2.93)a 2.12 (1.63-2.75)a 5.13 (4.12-6.40)a 4.11 (3.28-5.15)a 3.20 (2.54-4.03)a 3.04 (2.40-3.83)a 2.90 (2.20-3.83)a 2.69 (2.04-3.56)a 2.50 (1.89-3.29)a Note: Analysis used sequential stratified adjustment with confounders. Values shown are hazard ratio (95% confidence interval). Group 1 (eGFR ⬎90 mL/min/1.73 m2; n ⫽ 3,491) is the reference group. Abbreviations: AMI, acute myocardial infarction; DM, diabetes mellitus; eGFR, estimated glomerular filtration rate; hs-CRP, high-sensitivity C-reactive protein; HTN, hypertension; MACE, major adverse cardiac event; PCI, percutaneous coronary intervention. a P ⬍ 0.05. b -Blockers, diuretics, angiotensin-converting enzyme inhibitors, angiotensin receptor blockers, and statins. short- and long-term MACEs during follow up, which indicates the potential effectiveness of -blocker, ACE-inhibitor or ARB, and statin treatments for secondary prevention after AMI and of PCI to decrease MACEs in patients with severely decreased kidney function. In this context, the relationship between kidney disease and cardiovascular mortality has been shown to apply to individuals with advanced renal functional impairment. The risk of MACEs and cardiac death at both 1 month and 1 year increased with lower eGFR. These findings are consistent with previous studies,26,27 indicating that low eGFR is associated independently with greater risk of cardiovascular mortality and complications. Patients who have lower GFRs have more severe cardiovascular disease on presentation of MI, underutilization of cardioprotective medications (blockers, ACE inhibitors, ARBs, and statins), and less intensive application of PCI or CABG, which in part contributes to poor outcomes in patients with CKD. Interestingly, the present study showed the stark inTable 8. Composite Effect of Medication and PCI on 1-Month and 1-Year MACE After AMI Outcomes 1-mo MACE 1-y MACE No medicationa 1 medicationa 2 medicationsa 3 medicationsa No PCI PCI 1.00 (reference) 0.26 (0.21-0.31)b 0.14 (0.12-0.17)b 0.11 (0.94-0.13)b 1.00 (reference) 0.39 (0.35-0.45)b 1.00 (reference) 0.31 (0.26-0.36)b 0.26 (0.20-0.26)b 0.20 (0.18-0.23)b 1.00 (reference) 0.54 (0.48-0.60)b Note: Values shown are hazard ratio (95% confidence interval). Abbreviations: AMI, acute myocardial infarction; MACE, major adverse cardiac event; PCI, percutaneous coronary intervention. a P ⬍ 0.05. b -Blockers, angiotensin-converting enzyme inhibitors, angiotensin receptor blockers, and statins. Am J Kidney Dis. 2012;59(6):795-802 crease in risk of cardiovascular death at 1 year without a concomitant increase in risk of MI. This finding is not consistent with the previous study, which showed that cardiovascular death was increased with reinfarction risk in patients with lower eGFRs.26 The discrepancy is unclear, although it might be due to racial differences, different treatment modalities, and underlying diseases. The Framingham Heart Study provided early evidence of the association between mildly decreased kidney function and death and adverse cardiovascular events in the general population.28 In a large study published in 2004, Go et al2 convincingly showed, in a diverse population of adults, an independent and graded inverse correlation between lower kidney function and greater event rates of cardiovascular morbidity and mortality. However, this study showed that groups 1 and 2, normal and mildly decreased kidney function, did not show a difference in short- and long-term MACEs. In particular, severely decreased kidney function increased the risk of in-hospital death and coronary care unit stay. Thus, patients with more advanced CKD needed aggressive treatment and careful monitoring to experience better clinical outcomes. The present study has several limitations. First, KAMIR is a multicenter retrospective registry study and not a randomized controlled study. Therefore, the present analysis could not account for unmeasured confounders, including time from onset of symptoms to presentation or time from presentation to reperfusion in STEMI cases. The treatment bias with evidence-based therapy may be a proxy for better care or more attentive clinicians; thus, the association of a favorable outcome with a particular medication may be a reflection in part due to such bias. The study also is limited in that serum creatinine was measured at admission and may have included individuals with 801 Bae et al acute kidney injury whose eGFR was not estimated at equilibrium. In conclusion, lower eGFR was found to be an important predictor of short- and long-term MACEs. Age, Killip class higher than I, DM, hypertension, and hs-CRP level were risk predictors of short- and longterm MACEs. Receipt of PCI and use of -blockers, ACE inhibitors or ARBs, and statins was associated with decreased risk of MACEs. ACKNOWLEDGEMENTS Support: This research was supported by Basic Science Research Program through the National Research Foundation of Korea funded by the Ministry of Education, Science and Technology (2010-0008732), and by the Korea Science and Engineering Foundation through the Medical Research Center for Gene Regulation (grant 2011-0030732) at Chonnam National University. Financial Disclosure: The authors declare that they have no other relevant financial interests. REFERENCES 1. US Renal Data System. USRDS 1998 Annual Data Report. Bethesda, MD: National Institutes of Health, National Institute of Diabetes and Digestive and Kidney Diseases; 1998. http:// www.usrds.org/adr_1998.htm. Accessed September 12, 2003. 2. Go AS, Chertow GM, Fan D, McCulloch CE, Hsu CY. Chronic kidney disease and the risks of death, cardiovascular events, and hospitalization. N Engl J Med. 2004;351:1296-1305. 3. Chertow GM, Normand SL, Silva LR, McNeil BJ. Survival after acute myocardial infarction in patients with end-stage renal disease: results from the Cooperative Cardiovascular Project. Am J Kidney Dis. 2000;35:1044-1051. 4. Sarnak MJ, Levey AS, Schoolwerth AC, et al. Kidney disease as a risk factor for development of cardiovascular disease: a statement from the American Heart Association Councils on Kidney in Cardiovascular Disease, High Blood Pressure Research, Clinical Cardiology, and Epidemiology and Prevention. Hypertension. 2003;42:1050-1065. 5. Walsh CR, O’Donnell CJ, Camargo CA Jr, Giugliano RP, Lloyd-Jones DM. Elevated serum creatinine is associated with 1-year mortality after acute myocardial infarction. Am Heart J. 2002;144:1003-1011. 6. Shlipak MG. Pharmacotherapy for heart failure in patients with renal insufficiency. Ann Intern Med. 2003;138:917-924. 7. van Domburg RT, Hoeks SE, Welten GM, Chonchol M, Elhendy A, Poldermans D. Renal insufficiency and mortality in patients with known or suspected coronary artery disease. J Am Soc Nephrol. 2008;19:158-163. 8. Al Suwaidi J, Reddan DN, Williams K, et al. Prognostic implications of abnormalities in renal function in patients with acute coronary syndromes. Circulation. 2002;106:974-980. 9. National Kidney Foundation. K/DOQI Clinical Practice Guidelines for Chronic Kidney Disease: evaluation, classification, and stratification. Am J Kidney Dis. 2002;39(2)(suppl 1):S1-S266. 10. Wright RS, Reeder GS, Herzog CA, et al. Acute myocardial infarction and renal dysfunction: a high-risk combination. Ann Intern Med. 2002;137:563-570. 11. Shlipak MG, Heidenreich PA, Noguchi H, Chertow GM, Browner WS, McClellan MB. Association of renal insufficiency with treatment and outcomes after myocardial infarction in elderly patients. Ann Intern Med. 2002;137:555-562. 802 12. Coca SG, Krumholz HM, Garg AX, Parikh CR. Underrepresentation of renal disease in randomized controlled trials of cardiovascular disease. JAMA. 2006;296:1377-1384. 13. Beattie JN, Soman SS, Sandberg KR, et al. Determinants of mortality after myocardial infarction in patients with advanced renal dysfunction. Am J Kidney Dis. 2001;37:1191-1200. 14. Skali H, Uno H, Levey AS, et al. Prognostic assessment of estimated glomerular filtration rate by the new Chronic Kidney Disease Epidemiology Collaboration equation in comparison with the Modification of Diet in Renal Disease Study equation. Am Heart J. 2011;162:548-554. 15. Ryan TJ, Faxon DP, Gunnar RM, et al. Guidelines for percutaneous transluminal coronary angioplasty. A report of the American College of Cardiology/American Heart Association Task Force on Assessment of Diagnostic and Therapeutic Cardiovascular Procedures (Subcommittee on Percutaneous Transluminal Coronary Angioplasty). Circulation. 1988;78:486-502. 16. Charytan DM, Setoguchi S, Solomon DH, Avorn J, Winkelmayer WC. Clinical presentation of myocardial infarction contributes to lower use of coronary angiography in patients with chronic kidney disease. Kidney Int. 2007;71:938-945. 17. El-Shehaby AM, Zakaria A, El-Khatib M, Mostafa N. Association of fetuin-A and cardiac calcification and inflammation levels in hemodialysis patients. Scand J Clin Lab Invest. 2010;70: 575-582. 18. Kalantar-Zadeh K, Ikizler TA, Block G, Avram MM, Kopple JD. Malnutrition-inflammation complex syndrome in dialysis patients: causes and consequences. Am J Kidney Dis. 2003;42:864881. 19. Fellstrom BC, Jardine AG, Schmieder RE, et al. Rosuvastatin and cardiovascular events in patients undergoing hemodialysis. N Engl J Med. 2009;360:1395-1407. 20. Wanner C, Krane V, März W, et al. Atorvastatin in patients with type 2 diabetes mellitus undergoing hemodialysis. N Engl J Med. 2005;353:238-248. 21. Qureshi AR, Alvestrand A, Danielsson A, et al. Factors predicting malnutrition in hemodialysis patients: a cross-sectional study. Kidney Int. 1998;53:773-782. 22. Ross R. Atherosclerosis—an inflammatory disease. N Engl J Med. 1999;340:115-126. 23. Pecoits-Filho R, Heimburger O, Barany P, et al. Associations between circulating inflammatory markers and residual renal function in CRF patients. Am J Kidney Dis. 2003;41:1212-1218. 24. Kaysen GA, Eiserich JP. The role of oxidative stress-altered lipoprotein structure and function and microinflammation on cardiovascular risk in patients with minor renal dysfunction. J Am Soc Nephrol. 2004;15:538-548. 25. Lonn E. Grewal J. Drug therapies in the secondary prevention of cardiovascular diseases: successes, shortcomings and future directions. Curr Vasc Pharmacol. 2006;4:253-268. 26. Anavekar NS, McMurray JJ, Velazquez EJ, et al. Relation between renal dysfunction and cardiovascular outcomes after myocardial infarction. N Engl J Med. 2004;351:1285-1295. 27. Fox CS, Muntner P, Chen AY, et al. Use of evidence-based therapies in short-term outcomes of ST-segment elevation myocardial infarction and non-ST-segment elevation myocardial infarction in patients with chronic kidney disease: a report from the National Cardiovascular Data Acute Coronary Treatment and Intervention Outcomes Network registry. Circulation. 2010;121: 357-365. 28. Culleton BF, Larson MG, Wilson PW, Evans JC, Parfrey PS, Levy D. Cardiovascular disease and mortality in a communitybased cohort with mild renal insufficiency. Kidney Int. 1999;56: 2214-2219. Am J Kidney Dis. 2012;59(6):795-802


© Copyright 2026