
Ovarian cancer in Australia An overview, 2010
CANCER SERIES Number 52 Ovarian cancer in Australia An overview, 2010 Australian Institute of Health and Welfare and National Breast and Ovarian Cancer Centre February 2010 Australian Institute of Health and Welfare Canberra Cat. no. CAN 48 The Australian Institute of Health and Welfare is Australia’s national health and welfare statistics and information agency. The Institute’s mission is better information and statistics for better health and wellbeing. National Breast and Ovarian Cancer Centre (NBOCC) is Australia’s authority and source of evidencebased information on breast and ovarian cancer. Funded by the Australian Government, NBOCC works in partnership with health professionals, cancer organisations, researchers, governments and those diagnosed to improve outcomes in breast and ovarian cancer. NBOCC plays a vital role in the translation of worldwide cancer research into meaningful and evidence-based information to guide the work of Australian health professionals, improve health service delivery, inform people with breast or ovarian cancer about all aspects of their diagnosis and treatment, inform policy and raise community awareness about these diseases. For more information, visit <www.nbocc.org.au>. © Australian Institute of Health and Welfare 2010 This work is copyright. Apart from any use as permitted under the Copyright Act 1968, no part may be reproduced without prior written permission from the Australian Institute of Health and Welfare. Requests and enquiries concerning reproduction and rights should be directed to the Head, Media and Communications Unit, Australian Institute of Health and Welfare, GPO Box 570, Canberra ACT 2601. This publication is part of the Australian Institute of Health and Welfare’s Cancer series. A complete list of the Institute’s publications is available from the Institute’s website <www.aihw.gov.au>. ISSN 1039-3307 ISBN 978 1 74024 996 6 Suggested citation Australian Institute of Health and Welfare & National Breast and Ovarian Cancer Centre 2010. Ovarian cancer in Australia: an overview, 2010. Cancer series no. 52. Cat. no. CAN 48. Canberra: AIHW. Australian Institute of Health and Welfare National Breast and Ovarian Cancer Centre Board Chair Hon. Peter Collins, AM, QC Board Chair Dr Megan Keaney Director Dr Penny Allbon Chief Executive Officer Dr Helen Zorbas Any enquiries about or comments on this publication should be directed to: Dr Adriana Vanden Heuvel Australian Institute of Health and Welfare GPO Box 570 Canberra ACT 2601 Phone: (02) 6244 1184 Email: [email protected] Published by the Australian Institute of Health and Welfare Printed by Blue Star Print Group Foreword Ovarian cancer in Australia: an overview, 2010 brings together in one volume the most up-todate statistical information available on the epidemiology, public health and health services impact of ovarian cancer in Australia. These data, collected through population-based cancer registries and other sources, are central to advancing our efforts to understand and ultimately control this disease. This report not only builds on previous monitoring reports but additionally provides data about the burden of disease due to ovarian cancer, as well as survival from ovarian cancer by Indigenous status and by histology types. Ovarian cancer in Australia: an overview, 2010 also represents the significant contributions and the continuing partnership of National Breast and Ovarian Cancer Centre (NBOCC), the Australian Institute of Health and Welfare (AIHW) and the Australasian Association of Cancer Registries (AACR) and it highlights the importance of registries as a national resource. The report provides a nationwide snapshot of a major condition affecting a substantial number of Australian women. The value of data and monitoring is its relevance to outcomes and its capacity to impact on change. This report identifies areas of significant gain over time and provides some predictions for the future. Our ability to plan for services and patient needs are predicated on this understanding of the impact of the disease as it affects our population. We would like to thank the staff of the various cancer registries and data repositories. It is through their effort and diligence that these data are available to the Australian public. We anticipate that the information contained in Ovarian cancer in Australia: an overview, 2010 will be used extensively to further reduce mortality from ovarian cancer and improve the wellbeing of women with the disease. Dr Helen Zorbas Chief Executive Officer National Breast and Ovarian Cancer Centre iii Dr Penny Allbon Director Australian Institute of Health and Welfare Contents Acknowledgments........................................................................................................................... viii Abbreviations...................................................................................................................................... ix Symbols............................................................................................................................................x Executive summary ............................................................................................................................ xi 1 Introduction....................................................................................................................................1 What is ovarian cancer?.................................................................................................................1 Purpose and structure of this report............................................................................................2 Data interpretation.........................................................................................................................2 Data sources ....................................................................................................................................4 2 Incidence of ovarian cancer .........................................................................................................5 Incidence in 2006 ............................................................................................................................5 Differences by age at diagnosis.............................................................................................6 Trends ..............................................................................................................................................6 Trends by age at diagnosis ....................................................................................................8 Risk of ovarian cancer and average age at diagnosis................................................................9 Projections .....................................................................................................................................10 Types of ovarian cancer...............................................................................................................11 Trends in types of ovarian cancer.......................................................................................12 Incidence by stage at diagnosis ..................................................................................................15 Differences across groups ...........................................................................................................17 Differences by geographical area........................................................................................18 Differences by socioeconomic status..................................................................................19 Differences by Aboriginal and Torres Strait Islander status...........................................20 Differences by country of birth ...........................................................................................21 International comparisons ..........................................................................................................22 3 Mortality from ovarian cancer ..................................................................................................25 Mortality in 2006...........................................................................................................................25 Differences by age at death..................................................................................................26 Trends ............................................................................................................................................27 Trends by age at death .........................................................................................................28 Risk of death from ovarian cancer and average age at death.........................................29 Differences across groups ...........................................................................................................30 Differences by geographical area........................................................................................30 Differences by socioeconomic status..................................................................................31 Differences by Aboriginal and Torres Strait Islander status...........................................31 Differences by country of birth ...........................................................................................32 International comparisons ..........................................................................................................33 Ovarian cancer as an associated cause of death.......................................................................34 4 Survival after a diagnosis of ovarian cancer ..........................................................................36 Survival of those diagnosed between 2000 and 2006 ..............................................................37 v Survival from ovarian cancer compared with other cancers ..........................................37 Differences by age at diagnosis...........................................................................................38 Trends ............................................................................................................................................39 Trends by age at diagnosis ..................................................................................................40 Survival by type of ovarian cancer ............................................................................................41 Survival by stage at diagnosis ....................................................................................................44 Differences by Aboriginal and Torres Strait Islander status..................................................45 International comparisons ..........................................................................................................46 5 Prevalence of ovarian cancer .....................................................................................................48 Prevalence in 2006 ........................................................................................................................49 Differences by age .................................................................................................................50 Differences across groups ....................................................................................................50 6 Burden of disease due to ovarian cancer ................................................................................53 Burden of disease in 2003............................................................................................................53 Differences by age .................................................................................................................56 Trends and projections ................................................................................................................57 7 Hospitalisations for ovarian cancer .........................................................................................58 Hospitalisations in 2007–08.........................................................................................................58 Differences by age .................................................................................................................59 Average length of stay..........................................................................................................59 Trends ............................................................................................................................................60 Trends in average length of stay.........................................................................................61 Procedures undertaken during hospitalisations......................................................................63 8 Expenditure on ovarian cancer .................................................................................................64 Expenditure in 2004–05 ...............................................................................................................64 Differences by age .................................................................................................................65 Trends ............................................................................................................................................66 Appendix A: Classifications.............................................................................................................67 International Statistical Classification of Diseases and Related Health Problems..............67 International Statistical Classification of Diseases and Related Health Problems, Australian modification .......................................................................................................67 Australian Classification of Health Interventions ...................................................................67 International Classification of Diseases for Oncology ............................................................68 Australian Standard Geographical Classification Remoteness Areas ..................................68 Index of Relative Socio-economic Disadvantage.....................................................................68 Standard Australian Classification of Countries .....................................................................68 Appendix B: Statistical methods and technical notes .................................................................69 Age-specific rates .........................................................................................................................69 Age-standardised rates................................................................................................................69 Confidence intervals ....................................................................................................................70 Definition of ovarian cancer .......................................................................................................71 What ICD codes are included in the definition ................................................................71 Whether or not borderline tumours are included ............................................................72 vi Incidence projections ...................................................................................................................72 Mortality data differences ...........................................................................................................73 Mortality-to-incidence ratio........................................................................................................73 Relative survival analysis............................................................................................................74 Risk to age 75 and 85 years .........................................................................................................75 Appendix C: Data sources.................................................................................................................76 Australian Cancer Database .......................................................................................................76 Non-melanoma skin cancers ...............................................................................................77 Burden of disease data.................................................................................................................78 Disease Expenditure Database ...................................................................................................78 GLOBOCAN .................................................................................................................................79 National Death Index...................................................................................................................79 National Hospital Morbidity Database.....................................................................................80 National Mortality Database ......................................................................................................80 Population data ............................................................................................................................81 Appendix D: Additional tables........................................................................................................82 Additional tables for Chapter 2: Incidence of ovarian cancer................................................82 Additional tables for Chapter 3: Mortality from ovarian cancer...........................................92 Additional tables for Chapter 4: Survival after a diagnosis of ovarian cancer....................98 Additional table for Chapter 6: Burden of disease due to ovarian cancer .........................103 Additional tables for Chapter 7: Hospitalisations for ovarian cancer ................................104 Additional table for Chapter 8: Expenditure on ovarian cancer .........................................106 Appendix E: Stage at diagnosis .....................................................................................................107 FIGO staging system..................................................................................................................107 TNM staging system..................................................................................................................108 Summary staging system ..........................................................................................................108 Appendix F: Definition of ovarian cancer–related hospitalisations.......................................109 Glossary..............................................................................................................................................112 References..........................................................................................................................................115 List of tables ......................................................................................................................................121 List of figures ....................................................................................................................................124 vii Acknowledgments This report was commissioned by National Breast and Ovarian Cancer Centre (NBOCC). Advice on content was provided by Professor Tom Dodd and Professor Peter Russell, with additional input from Ms Margot Osinski. Special thanks are due to Dr Penny Webb and Clinical Associate Professor Peter Grant, who reviewed the report. The following NBOCC staff are acknowledged for their contribution to the development of this report: Professor David Roder; Dr Helen Zorbas; Ms Rosemary Wade; Ms Jane Francis; and Associate Professor Christine Giles. The work of NBOCC is funded by the Australian Government Department of Health and Ageing. This report was prepared by staff in the Cancer and Screening Unit of the Australian Institute of Health and Welfare (AIHW). The main authors were Dr Adriana Vanden Heuvel and Ms Anne Ganner Bech. The main data analyst was Ms Candice Rabusa. Other AIHW staff who made a substantial contribution are, in alphabetical order, Ms Chun Chen, Dr Brett Davis, Ms Melissa Goodwin, Mr David Meere, Ms Galina Prosselkova, Dr Mark Short, Ms Christine Sturrock and Ms Kun Zhao. The authors would like to thank those AIHW staff who commented on earlier drafts of this report. The support of the Australasian Association of Cancer Registries in both providing data and reviewing the draft report is gratefully acknowledged. viii Abbreviations AACR Australasian Association of Cancer Registries ABS Australian Bureau of Statistics ACD Australian Cancer Database ACHI Australian Classification of Health Interventions ACT Australian Capital Territory ASGC Australian Standard Geographical Classification AIHW Australian Institute of Health and Welfare AS age-standardised ASR age-standardised rate BCC basal cell carcinoma CI confidence interval CS crude survival DALY disability-adjusted life year DoHA Australian Government Department of Health and Ageing FIGO International Federation of Gynecology and Obstetrics IARC International Agency for Research on Cancer ICD-7 International Statistical Classification of Diseases and Related Health Problems, seventh revision ICD-10 International Statistical Classification of Diseases and Related Health Problems, tenth revision ICD-10-AM International Statistical Classification of Diseases and Related Health Problems, tenth revision, Australian modification ICD-O-2 International Classification of Diseases for Oncology, second edition ICD-O-3 International Classification of Diseases for Oncology, third edition IRSD Index of Relative Socio-economic Disadvantage MIR mortality-to-incidence ratio NBOCC National Breast and Ovarian Cancer Centre NHMD National Hospital Morbidity Database NMD National Mortality Database NMSC non-melanoma skin cancer No. number NOS not otherwise specified NSW New South Wales NT Northern Territory NZ New Zealand Qld Queensland RS relative survival SA South Australia ix SACC Standard Australian Classification of Countries SCC squamous cell carcinoma SEER Surveillance Epidemiology End Results Tas Tasmania TNM a staging system based on size/extent of the tumour (T), lymph node involvement (N) and presence of distant metastases (M) UICC International Union Against Cancer UK United Kingdom USA United States of America Vic Victoria WA Western Australia WHO World Health Organization YLL years of life lost YLD years lost due to disability Symbols .. not applicable % per cent less than > greater than + and over n.a. not available n.p. not published (data cannot be released due to quality issues) x Executive summary Although a relatively uncommon cancer, ovarian cancer is often diagnosed at a stage where the cancer has spread beyond the ovary. Such cases often have a poor prognosis. Ovarian cancer in Australia: an overview, 2010 provides a comprehensive picture of national statistics on ovarian cancer using a range of data sources, with the latest available data and trends over time presented. Throughout this report, the term ‘ovarian cancer’ refers to invasive ovarian cancers; borderline tumours are not included. The number of ovarian cancer cases is increasing In 2006, ovarian cancer was the ninth most commonly diagnosed cancer among Australian women (excluding non-reportable skin cancers) and the second most commonly diagnosed gynaecological cancer, with a total of 1,226 ovarian cancer cases diagnosed. Ovarian cancer is mainly a disease of postmenopausal women, with six in ten (60%) cases diagnosed in women aged 60 years and over. The number of ovarian cancer cases increased by 47% between 1982 and 2006 (from 833 cases to 1,226 cases) due to an ageing and growing population. It is anticipated that the number of new cases will continue to increase, with an estimated 1,434 women expected to be diagnosed with ovarian cancer in 2015. Nonetheless, the age-standardised incidence rate of ovarian cancer decreased significantly by 14% between 1982 and 2006 (from 12.4 to 10.7 new cases per 100,000 females). The rate of death from ovarian cancer has fallen A total of 795 women died from ovarian cancer in 2006, making it the sixth most common cause of cancer-related death for Australian women, and the most common cause of gynaecological cancer death, representing over half (55%) of such deaths. The age-standardised mortality rates for ovarian cancer decreased significantly by 26% between 1968 and 2006 (from 9.1 to 6.7 deaths per 100,000 females). In addition, the 2006 mortality rate was the lowest rate observed for any year to date. Possible reasons for the decrease in the mortality rate over time include the observed decline in the incidence rate, improvements in access to and quality of treatments, and change over time in the types of ovarian cancers occurring among women. However, the data also indicate that the decline in the mortality rate was not observed for all age groups, with the ovarian cancer mortality rate for older women (those aged 70 years and over at death) increasing rather than decreasing over the period considered. The prognosis of women with ovarian cancer has improved The prognosis for women with ovarian cancer is relatively poor. Women who were diagnosed with ovarian cancer between 2000 and 2006 were 40% as likely to live five years after diagnosis as their counterparts in the general population. Significantly poorer survival was seen for older women, with 5-year relative survival estimates ranging from a high of 86% for those aged less than 30 years when diagnosed with ovarian cancer to a low of 15% for those aged 80 years or older at diagnosis. Possible reasons for poorer survival of older women include a greater likelihood that these women were diagnosed with advanced stage cancer and/or with more-aggressive types of cancers, as well as a greater likelihood of xi co-morbidities. Differences by age in the treatment provided to those with ovarian cancer are also believed to be a factor. Improvement in the prognosis of those diagnosed with ovarian cancer has occurred over time, with the 5-year relative survival rate increasing significantly from 33% in 1982–1987 to 40% in 2000–2006. Nonetheless, the improvements in survival were focused on women in the middle age groups, with no significant change in the survival estimates over time for those aged less than 40 years and those aged 80 years and over. xii 1 Introduction Ovarian cancer is often referred to as a ‘challenging cancer’. Unlike breast and cervical cancer, no effective tests are currently available for population-based screening for ovarian cancer (NBOCC 2009). Further, the symptoms of ovarian cancer (such as abdominal swelling, abdominal or back pain, and intestinal and urinary symptoms) tend to be similar to the symptoms of many other common conditions. Thus, ovarian cancer is often diagnosed at an advanced stage. What is ovarian cancer? The ovaries are a pair of solid, oval-shaped organs that are part of the female reproductive system, with one ovary on each side of the uterus (Figure 1.1). Each ovary is around 3 centimetres long and 1 centimetre thick. Ovarian cancer is a disease in which abnormal cells in the ovaries multiply and form an invasive (i.e. malignant) tumour. Such tumours can spread to other parts of the body and, if the spread is not controlled, can result in death. Benign tumours can also form in the ovaries; such tumours do not spread and, with very rare exceptions, are not life-threatening. There are three main types of ovarian cancers, each of which begin in a different type of cell in the ovary. Epithelial cells form an outer covering over the ovary. Most ovarian cancers begin in this layer of cells and are called epithelial ovarian cancers. Germ cells are found inside the ovary and these cells eventually mature into the eggs (ova) that are released into the fallopian tubes. Cancers which develop in these cells are called germ cell ovarian cancers. Stromal cells release the hormones oestrogen and progesterone. Ovarian cancers which begin in these cells are called sex cord-stromal ovarian cancers. Similar to invasive epithelial ovarian cancers, borderline tumours (also known as tumours of Source: National Cancer Institute 2009. low malignant potential) develop in the Figure 1.1: The ovaries and nearby organs epithelium of the ovaries but these tumours are not as aggressive as other epithelial ovarian tumours and there is less risk that they will spread or recur. As discussed in more detail later in this chapter, borderline tumours are not regarded as malignant tumours in the current version of the international coding standards for cancers and thus these tumours are not considered in this report. While the cause of ovarian cancer is unknown, two of the main risk factors are advancing age and a family history of ovarian cancer, while important protective factors are increased parity and use of the contraceptive pill (ACN & NBCC 2004). 1 Purpose and structure of this report The purpose of this report is to provide a comprehensive snapshot of national statistics on ovarian cancer in Australia. The aim is to increase the level of understanding about this disease and to inform decision-making, resource allocation and the evaluation of programs and policies. The report is aimed at a wide audience—including health professionals, policy makers, health planners, educators, researchers, consumers and the general public. This report brings together the latest available statistics and trend data on the following topics: • the number of cases of ovarian cancer diagnosed each year (Chapter 2) • the number of women who die from this disease each year (Chapter 3) • survival prospects for those diagnosed with ovarian cancer (Chapter 4) • the number of women alive who have been diagnosed with ovarian cancer (Chapter 5) • the burden of disease due to ovarian cancer (Chapter 6) • the number of hospitalisations for ovarian cancer (Chapter 7) • the extent of health care spending on ovarian cancer (Chapter 8). Compared with the previous edition of this report (AIHW & NBCC 2006), this edition includes, for the first time, information on how incidence differs within Australia according to country of birth. It also provides additional information on how Australian ovarian cancer data compare globally and by Aboriginal and Torres Strait Islander status. Data interpretation In this report, the term ‘ovarian cancer’ is used to refer to primary ovarian tumours which are invasive (i.e. malignant). It does not encompass secondary ovarian cancers, nor does it include benign or non-invasive ovarian tumours. Furthermore, borderline tumours are not included. In the second edition of the International Classification of Diseases for Oncology (ICD-O-2), ovarian tumours of borderline malignancy were considered malignant. However, in the third edition of ICD-O (i.e. ICD-O-3), borderline tumours are considered to be of uncertain behaviour and are no longer considered malignant. For the 2006 version of this report (AIHW & NBCC 2006), tumours were classified according to ICD-O-2 and thus the results presented in that report are not strictly comparable to the results shown in this report, which are based on ICD-O-3. As shown in the earlier report, 6% of ovarian cancer cases diagnosed in 2002 were borderline tumours (AIHW & NBCC 2006). In this report, ovarian cancer is defined, when possible, as those cancers classified as ‘C56’ in the tenth revision of the International Statistical Classification of Diseases and Related Health Problems (i.e. ICD-10). However, in some data sets used in this report (namely the burden of disease data, the expenditure data and the international GLOBOCAN data), data were not available for the ICD-10 code of ‘C56’ but instead were available for the ICD-10 codes of ‘C56 and C57.0–C57.4’ grouped together (see Appendix Table B.2). This grouping of cancers is referred to as ‘ovarian and related cancers’ in this report. Information about the classifications referred to in this report, including ICD and ICD-O, is provided in Appendix A. Information on tumour stage (i.e. extent of spread) at time of diagnosis is important in relation to both prognosis and determining the most appropriate type of treatment. Information on change over time in stage at diagnosis also assists in the monitoring of ovarian cancer control policies and programs. While some of the Australian states and 2 territories collect information on stage at diagnosis for ovarian cancer, not all do so and there are no nationally agreed standards for the collection of these data. While national data on these items are not available, some state-level and overseas data on incidence and survival are presented by stage at diagnosis in this report. Information on the actual number of ovarian cancer cases and deaths is presented in this report, together with age-standardised rates. The use of age-standardised rates is important when making comparisons between groups and within groups over time in order to take into account differences in the age structure and size of the population. This is especially important in regard to ovarian cancer since the risk of this disease increases with age. Rates have been standardised to the Australian population at 30 June 2001 and are generally expressed per 100,000 females. In addition, for some of the key statistics and the international comparisons, age-standardised rates based on a World Standard Population are shown. The use of a world standard allows for the comparison of Australian data with those of other countries. Further information on age standardisation and other technical matters can be found in Appendix B. Note that all discussion of age-standardised rates in the text of this report pertains to rates that were standardised to the Australian population, with the exception of the discussion on international comparisons, which pertains to rates standardised to the world standard. Confidence intervals (at the 95% level) are shown in graphs (as error bars) and tables in this report. As explained more fully in Appendix B, confidence intervals can be used as a guide when considering whether differences in rates may be a result of chance variation. Where confidence intervals do not overlap, the difference between rates may be greater than would readily be attributable to chance. While such differences may be regarded as ‘significant’ in statistical terms, they may or may not be ‘significant’ from a practical or clinical perspective. In this report, comparisons are often made with international and state/territory-based data in order to help put the Australian situation into a broader context, and to give some indication as to whether the observed findings have been found in other studies as well. However, caution must be taken when making such comparisons since observed differences may be influenced not only by the underlying number of ovarian cancer cases (or the number of deaths when considering mortality data), but also by differences between Australia and individual jurisdictions or other countries in the following: • cancer detection • types of treatment provided and access to treatment services • characteristics of the cancer such as stage at diagnosis and histological type • coding practices and cancer registration methods, as well as the accuracy and level of cancer coverage of the data. The last point is of particular relevance in regard to ovarian cancer since different jurisdictions and countries include different types of cancers within the definition of ‘ovarian cancer’. In addition, ovarian borderline tumours are included in some data but excluded from others (see Appendix B for further details). Finally, difficulties in distinguishing between ovarian cancers and borderline tumours (Kricker 2002), as well as between ovarian cancers and other types of cancers (such as peritoneum cancers or cancers of an unknown primary site) also contribute to observed variations in ovarian cancer rates between jurisdictions and countries, as well as over time. 3 Data sources A key data source for this report was the Australian Cancer Database (ACD), which was previously known as the National Cancer Statistics Clearing House. The ACD is a database that holds information on 1.8 million Australian cancer cases diagnosed between 1982 and 2006. The AIHW compiles and maintains the ACD, in partnership with the Australasian Association of Cancer Registries (AACR), whose member registries provide data to the AIHW on an annual basis. Each Australian state and territory has legislation that makes the reporting of all cancers (other than two types of non-melanoma skin cancers (NMSC)) mandatory. Note that compared with past reports prepared by the AIHW, a different approach to the exclusion of non-melanoma skin cancers from the data was used when preparing this report. Additional information about this change, as well as about the ACD itself, can be found in Appendix C. Another key data source was the National Mortality Database (NMD). This database contains information on the date and cause of death for all registered deaths in Australia from 1964 onwards. Depending on the coding version used (ICD-7 in 1964 through to ICD-10 at present), some diseases may not have had a unique code that identifies the disease separately from other closely-related diseases for some of the years. Ovarian cancer is an example of this, with data on mortality due specifically to ovarian cancer (rather than from ovarian and related cancers) available from 1968 onwards. Additional information about the NMD is provided in Appendix C. In addition, several other data sources—including the National Death Index, the National Hospital Morbidity Database, the Disease Expenditure Database and the 2002 GLOBOCAN database—have been used to present a broad picture of ovarian cancer in Australia in this report. Information about each of these data sources can also be found in Appendix C. Throughout this report: • The term ‘ovarian cancer’ refers to primary, invasive ovarian cancers, with cancers classified as ‘C56’ in ICD-10 included (unless otherwise indicated). Borderline tumours are excluded. • Differences that are described as ‘significant’ refer to a statistically significant difference. Such differences may or may not be significant from a practical or clinical perspective. 4 2 Incidence of ovarian cancer Incidence data indicate the number of new cases of ovarian cancer diagnosed during a specified time period, usually one year. While these data refer to the number of cases diagnosed and not the number of women diagnosed with ovarian cancer, it is rare (although possible) that any one woman would be diagnosed with two or more primary ovarian cancers during a 1-year period. Thus, the annual number of new ovarian cancer cases is practically the same as the annual number of women newly diagnosed with ovarian cancer. Details on the incidence of ovarian cancer over time are provided in this chapter, as is information on the projected number of new cases to 2015, the risk of a woman being diagnosed with ovarian cancer by the age of 75 and 85 years, and disparities in incidence among women according to age, geographical area, socioeconomic status, Aboriginal and Torres Strait Islander status and country of birth. Information on how Australia’s ovarian cancer rates compare internationally is also shown. As mentioned in Chapter 1, only those cases in which ovarian cancer was a primary, invasive cancer are considered. Additionally, to be counted, the case must be a ‘new’ primary cancer and not a reoccurrence of a previous primary cancer (IARC 2004). The main data source for this chapter was the Australian Cancer Database. Incidence in 2006 The ten most commonly diagnosed cancers among females in 2006 are shown in Table 2.1. Since two types of skin cancer—namely, basal cell carcinoma and squamous cell carcinoma— are not reported to cancer registries, data on these two types of cancer are not included in either the ACD or Table 2.1. Past research shows that these skin cancers are by far the most frequently diagnosed cancers in Australia in both females and males (AIHW & CA 2008). In 2006, a total of 1,226 cases of ovarian cancer were diagnosed in Australia; this equates to an average of 3 women being diagnosed with this disease every day. Ovarian cancer was the ninth most commonly diagnosed cancer among females (excluding basal and squamous cell carcinomas of the skin) and the second most commonly diagnosed gynaecological cancer, after cancer of the uterus (1,860 cases). Ovarian cancer accounted for 3% of all reported cancer cases in women in 2006 and 29% of all gynaecological cancers. The age-standardised rate of ovarian cancer incidence stood at 10.7 cases per 100,000 females in 2006. This compares with a rate of 112.4 cases per 100,000 females for breast cancer and 16.3 cases per 100,000 females for cancer of the uterus. 5 Table 2.1: Incidence of the 10 most commonly diagnosed cancers(a), females, 2006 Number of cases Per cent of all gynaecological cancer cases Per cent of all (a) cancer cases Agestandardised (b) rate 95% confidence interval 12,614 .. 27.7 112.4 110.4–114.4 Bowel (C18–C20) 6,159 .. 13.5 52.1 50.8–53.4 Melanoma of skin (C43) 4,275 .. 9.4 38.2 37.1–39.4 Lung (C33–C34) 3,533 .. 7.8 30.3 29.3–31.3 Lymphoma (C81–C85, C96) 1,961 .. 4.3 17.2 16.4–18.0 Uterus (C54, C55) 1,860 43.8 4.1 16.3 15.6–17.1 Unknown primary site (C26, C39, C76, C80) 1,592 .. 3.5 12.6 12.0–13.3 Thyroid (C73) 1,270 .. 2.8 11.8 11.2–12.5 Ovary (C56) 1,226 28.9 2.7 10.7 10.1–11.4 All leukaemias (C91–C95) 1,111 .. 2.4 9.7 9.1–10.3 45,534 .. 100.0 396.3 392.6–400.0 Cancer type (ICD-10 codes) Breast (C50) All cancers (c) (a) Excluding basal and squamous cell carcinomas of the skin. (b) The age-standardised rates were standardised to the Australian population as at 30 June 2001 and are expressed per 100,000 females. (c) Includes cancers coded in ICD-10 as C00–C97, D45, D46, D47.1 and D47.3 with the exception of those C44 codes which indicate a basal or squamous cell carcinoma. Source: Australian Cancer Database, AIHW. Differences by age at diagnosis In 2006, the majority of cases of ovarian cancer were diagnosed among women aged 60 years and over (60%). In addition, one in fourteen cases (7%) were diagnosed in women under the age of 40 years, and one-third (33%) were diagnosed in those aged 40 to 59 years (Appendix Table D2.1). The mean age at first diagnosis was 63 years. Figure 2.1 shows differences in the incidence rate of ovarian cancer by age group in 2006. The likelihood of being diagnosed with ovarian cancer increased with age. The rates were relatively low for those aged less than 40 years (i.e. less than 5 cases per 100,000 females for each of those age groups). In contrast, there was an observable increase between most age groups from the age of 40 to 44 years onwards, but these increases were not always statistically significant. The highest rate was observed for women aged 80 to 84 years (48.0 per 100,000), followed by those aged 85 years and over (44.5 per 100,000). Trends The number of new ovarian cancer cases diagnosed each year increased over the 25-year period from 1982 (the year in which national cancer incidence data were first available) to 2006 (Figure 2.2). In 1982, 833 new cases of ovarian cancer were diagnosed among Australian women compared with 1,226 in 2006, indicating an overall increase of 47% cases over this period. Furthermore, the number of ovarian cancer cases diagnosed in 2006 was slightly higher than the number diagnosed in the previous year (1,219 cases) but lower than the number diagnosed in 2004 (1,267 cases) when the largest number of ovarian cancer cases diagnosed to date was reported. 6 50 New cases per 100,000 females 45 40 35 30 25 20 15 10 5 85+ 80–84 75–79 70–74 65–69 60–64 55–59 50–54 45–49 40–44 35–39 30–34 25–29 20–24 <20 0 Age group (years) Notes 1. The rates shown are age-specific rates. 2. The data for this figure are shown in Appendix Table D2.1. Source: Australian Cancer Database, AIHW. Figure 2.1: Incidence of ovarian cancer by age at diagnosis, 2006 14 New cases per 100,000 1,600 12 Number of new cases 1,400 10 1,200 8 1,000 800 6 Number of new cases 600 4 400 2 200 Notes 1. The rates were age-standardised to the Australian population as at 30 June 2001. 2. The data for this figure are shown in Appendix Table D2.2. Source: Australian Cancer Database, AIHW. Figure 2.2: Incidence of ovarian cancer, 1982 to 2006 7 2006 2005 2004 2003 2002 2001 2000 1999 1998 1997 1996 1995 1994 1993 1992 1991 1990 1989 1988 1987 1986 1985 1984 1983 0 1982 0 New cases per 100,000 females 1,800 In contrast, there was a statistically significant decrease in the age-standardised incidence rate of ovarian cancer. In 1982, the incidence rate stood at 12.4 (per 100,000 females), while it was 10.7 (per 100,000 females) in 2006, indicating an overall decrease of 14%. This indicates that the increase in the absolute number of ovarian cancer cases over the years can be explained by the ageing and increasing size of the population. The reason for the decline in the age-standardised rate is unclear, with possible reasons being change over time in the proportion of women with various ovarian cancer risk and protective factors (e.g. use of the contraceptive pill), changes in the classification systems and approaches used to diagnose borderline versus invasive tumours and, in some cases, the removal of precancerous lesions which prevented ovarian cancer from developing (Skirnisdottir et al. 2008). The share of all reportable cancers diagnosed in females that were ovarian cancer decreased between 1982 and 2006, from 3.8% to 2.7% respectively (Appendix Table D2.2). Meanwhile, the proportion of all gynaecological cancers diagnosed in females that were ovarian cancer ranged over the years from 27.2% (1986) to 31.2% (2002). Trends by age at diagnosis While overall there was a slight decrease in the rate of ovarian cancer over the years considered, this did not apply equally to all of the age groups (Figure 2.3). Instead, the observed decrease in incidence rates over the years was centred on those aged 50 to 69 years, with rates decreasing significantly from 32.7 cases per 100,000 females in 1982 to 24.6 cases per 100,000 females in 2006; this equates to a decrease of 25%. The incidence rate of ovarian cancer for women aged less than 50 years also decreased somewhat from 1982 (3.9 cases per 100,000 females) to 2006 (3.1 per 100,000), but this decrease was not statistically significant. For women aged 70 years and over, incidence rates fluctuated considerably over the period, with no statistically significant difference found between the 1982 rate (35.8 per 100,000) and the 2006 rate (40.9 per 100,000). 50 70+ years New cases per 100,000 females 45 40 35 50–69 years 30 25 20 All ages 15 10 <50 years 5 0 1982 1984 1986 1988 1990 1992 1994 1996 1998 2000 Notes 1. The rates were age-standardised to the Australian population as at 30 June 2001. 2. The data for this figure are shown in Appendix Table D2.3. Source: Australian Cancer Database, AIHW. Figure 2.3: Incidence of ovarian cancer by age at diagnosis, 1982 to 2006 8 2002 2004 2006 Risk of ovarian cancer and average age at diagnosis Table 2.2 shows the risk of a woman being diagnosed with ovarian cancer by the age of 75 years and 85 years (see Appendix B for an explanation of how these risks were calculated). While the risk of being diagnosed with ovarian cancer fluctuated somewhat between 1982 and 2006, an overall decline in the risk is evident. The risk of being diagnosed with ovarian cancer by the age of 75 years was 1 in 94 in 1982, compared with 1 in 116 in 2006. The corresponding values in the risk of being diagnosed by the age of 85 years was 1 in 71 (in 1982) to 1 in 77 (in 2006). Table 2.2 also indicates change over time in the mean and median age at first diagnosis of ovarian cancer. Both the mean and median ages at diagnosis have been tending upwards over time, with the mean age increasing from 60 years in 1982 to 63 years in 2006. Table 2.2: Risk and average age at diagnosis of ovarian cancer, 1982 to 2006 Year Risk to age 75 years Risk to age 85 years Mean age at first diagnosis Median age at first diagnosis 1982 1 in 94 1 in 71 59.6 60.0 1983 1 in 98 1 in 70 59.8 61.0 1984 1 in 95 1 in 69 60.5 62.0 1985 1 in 101 1 in 67 60.7 62.0 1986 1 in 104 1 in 74 60.5 62.0 1987 1 in 98 1 in 72 60.6 62.0 1988 1 in 104 1 in 74 60.4 62.0 1989 1 in 93 1 in 66 61.2 63.0 1990 1 in 96 1 in 67 61.7 64.0 1991 1 in 100 1 in 68 62.1 64.0 1992 1 in 97 1 in 69 60.7 62.0 1993 1 in 97 1 in 66 61.3 64.0 1994 1 in 99 1 in 69 61.5 63.0 1995 1 in 105 1 in 67 62.1 64.0 1996 1 in 108 1 in 70 63.2 65.0 1997 1 in 113 1 in 74 62.9 64.0 1998 1 in 106 1 in 69 62.9 65.0 1999 1 in 109 1 in 74 62.8 64.0 2000 1 in 114 1 in 74 63.7 65.0 2001 1 in 120 1 in 76 64.3 65.0 2002 1 in 112 1 in 69 63.9 65.0 2003 1 in 118 1 in 77 63.3 64.0 2004 1 in 109 1 in 72 63.9 65.0 2005 1 in 120 1 in 75 64.1 65.0 2006 1 in 116 1 in 77 63.3 64.5 Source: Australian Cancer Database, AIHW. 9 Projections To estimate the incidence of ovarian cancer from 2007 to 2015, data on the number of new cases of ovarian cancer diagnosed over the 10-year period from 1997 to 2006 were extrapolated (see Appendix B for further details on the methodology used). This estimation approach assumes that the trends in the incidence of ovarian cancer during that 10-year period will continue to 2015. Since it is impossible to anticipate and quantify future developments that might cause a change in the number of women diagnosed with ovarian cancer, these projections should be interpreted as only indicative of future trends. Note also that there is greater margin of error surrounding the projections for the later years than the earlier years. The number of women diagnosed with ovarian cancer is expected to continue to increase in the future due to continued ageing and growth of the population (Figure 2.4). The projections suggest that 1,324 new cases of ovarian cancer will be diagnosed in 2010. By 2015, the number of new ovarian cancer cases diagnosed is estimated to be 1,434, which would be 17% higher than in 2006 (1,226 cases). If these projections are accurate, an average of 4 women would be diagnosed with ovarian cancer each day in 2015. Figure 2.4 also indicates the projected age-standardised incidence rate for ovarian cancer from 2007 to 2015. When expected changes in the age structure and size of the population are taken into account, the results suggest that the rate at which new ovarian cancer cases are diagnosed will continue to decrease slightly through to 2015, reaching 10.1 new cases per 100,000 females in that year. However, due to the wide confidence interval around this estimate, the projected incidence rate for 2015 is not statistically different from the 2006 rate of 10.7 cases per 100,000 females. New cases per 100,000 12 10 Number of new cases 2,000 8 1,500 6 1,000 4 500 Observed cases Projected cases 2 0 2015 2014 2013 2012 2011 2010 2009 2008 2007 2006 2005 2004 2003 2002 2001 2000 1999 1998 1997 0 Notes 1. The projections were based on ovarian cancer incidence data for 1997 to 2006. 2. The rates were age-standardised to the Australian population as at 30 June 2001. 3. For the years 2007 to 2015, grey lines around the age-standardised rates indicate the 95% prediction intervals. 4. The data for this figure are shown in Appendix Tables D2.2 and D2.4. Source: Australian Cancer Database, AIHW. Figure 2.4: Incidence of ovarian cancer, observed for 1997 to 2006 and projected for 2007 to 2015 10 New cases per 100,000 females 2,500 Types of ovarian cancer Ovarian cancer consists of a heterogeneous set of invasive tumours that arise from the different cell types in the ovary (as discussed in Chapter 1). Pathologists classify ovarian cancers into histological types, with each of the types associated with different genetic risk factors, patterns of transformation and responses to chemotherapy (Kobel et al. 2008). Due to the large number of histological types of ovarian cancer and the relative infrequency of many of these types in the Australian Cancer Database, similar types of tumours have been grouped into broader categories for the purposes of this report. As shown in Table 2.3, the three main categories are: ‘group 1: carcinoma’ (which is also referred to as epithelial tumours)’; ‘group 2: sex cord-stromal tumours’; and ‘group 3: germ cell tumours’. Two additional categories capture other specified types of ovarian cancers (group ‘4’) and ovarian cancers that were unspecified (group ‘5’). One of the groups—namely ‘group 1: carcinoma’— is further divided into seven subgroups. The histology types included in each group and sub-group are listed in Appendix Table D2.5. This system of grouping ovarian cancers was based primarily on documentation from the International Agency for Research on Cancer (Curado et al. 2007), with additional input from National Breast and Ovarian Cancer Centre. In 2006, 84% of the ovarian cancers were classified as carcinoma (group 1) with the most common type within this group being serous carcinoma (group 1.1) (52% of carcinomas), followed by adenocarcinoma not otherwise specified (group 1.5) (15% of carcinomas). Meanwhile, 4% of ovarian cancers were classified as germ cell tumours (group 3), 3% were coded as other specified malignant neoplasm (group 4) and 1% were coded as sex cord-stromal tumours (group 2). The histological type was unspecified (group 5) in 1 in 13 (8%) ovarian cancer cases. Table 2.3: Incidence of ovarian cancer and average age at diagnosis by type of ovarian cancer, 2006 Mean age at first diagnosis Median age at first diagnosis Per cent of all ovarian cancers Per cent of carcinomas 1,026 83.7 100.0 63.5 64.0 530 43.2 51.7 63.1 64.0 85 6.9 8.3 62.2 62.0 103 8.4 10.0 56.8 53.0 63 5.1 6.1 59.6 59.0 152 12.4 14.8 69.4 73.0 1.6: Other specified carcinoma 30 2.4 2.9 56.8 57.0 1.7: Unspecified carcinoma 63 5.1 6.1 72.2 78.0 2: Sex cord-stromal tumours 16 1.3 .. 51.9 50.0 3: Germ cell tumours 48 3.9 .. 33.7 29.0 4: Other specified malignant neoplasm 39 3.2 .. 64.2 65.0 97 7.9 .. 77.1 82.0 1,226 100.0 .. 63.3 64.5 Type of ovarian cancer (a) 1: Carcinoma (epithelial tumours) 1.1: Serous carcinoma 1.2: Mucinous carcinoma 1.3: Endometrioid carcinoma 1.4: Clear cell carcinoma 1.5: Adenocarcinoma NOS 5: Unspecified malignant neoplasm Total (a) Number of cases All cases were coded as primary site, invasive ovarian cancers. Appendix Table D2.5 provides a list of the histology types included in each group. Source: Australian Cancer Database, AIHW. 11 The average age at the first diagnosis of ovarian cancer differed by histology type (Table 2.3). The mean age of occurrence was highest for those cases in which the type of ovarian cancer was unspecified (group 5) (77 years). In contrast, the mean age at diagnosis was lowest for women diagnosed with germ cell tumours (group 3) (34 years) and sex cord-stromal tumours (group 2) (52 years). The mean age for women diagnosed with carcinoma (group 1) was 64 years, but considerable variation is seen across the various types of carcinomas. Those with an unspecified type of carcinoma (group 1.7) had a relatively high mean age at diagnosis (72 years), while those in ‘group 1.6: other specified carcinoma’ and ‘group 1.3: endometrioid carcinoma’ had a relatively low mean age (57 years). Further information about the relationship between age and histological type of ovarian cancer in 2006 is provided in Table 2.4. For each of the three age groups, carcinoma (group 1) was the most commonly diagnosed type of ovarian cancer, although differences in the proportion of all ovarian cancers coded to this group of ovarian cancers are evident. Specifically, among those aged less than 50 years, three in four (75%) ovarian cancer cases were carcinoma, compared with 91% of those who were aged 50 to 69 years and 80% of those aged 70 years and over at diagnosis. Relative to the other age groups, the younger women were more likely to have been diagnosed with a germ cell tumour (group 3) (17% of those with ovarian cancer who were aged less than 50 years compared with less than 2% of those in the other age groups). One in 6 cases (16%) of ovarian cancer among those aged 70 years and over was coded as an unspecified ovarian cancer (group 5); this compares with 3% of those in the two other age groups. Trends in types of ovarian cancer Trends in the proportion of the various types of ovarian cancers are shown in Table 2.5, with the data grouped into four time periods. Caution should be exercised when interpreting these data since changes in histological assessment and coding practices may have affected the observed trends. There was minimal change in the proportion of ovarian cancers that were classified as carcinoma (group 1), with values ranging from 86% (in 2000 to 2006) to 89% (in 1988 to 1993). However, within the group of carcinomas, there was change over time in the proportion of a number of the subgroups. In particular, three out of ten (30%) ovarian cancers were classified as serous carcinoma (group 1.1) in 1982 to 1987; this proportion had increased to 43% by 2000 to 2006. Over the same period, the proportion of ovarian cancers that were coded as adenocarcinoma not otherwise specified (group 1.5) fell from 25% to 14% of ovarian cancers. For each of the time periods, the proportion of ovarian cancers that were classified as germ cell tumours (group 3) remained at around 3%, while the proportion of sex cord-stromal tumours (group 2) fell from 2% in 1982 to 1987 to 1% in 2000 to 2006, and the proportion that were coded as other specified ovarian cancer (group 4) increased from 2% to 4%. The proportion that was classified as unspecified ovarian cancer (group 5) fluctuated over the four time periods, with no clear pattern evident. Further information on the histological types of ovarian cancers by age group is provided in Appendix Tables D2.6 to D2.8, with those tables showing trends from 1982–1987 to 2000– 2006 for the three age groups of those less than 50 years, those 50 to 69 years, and those 70 years and over at diagnosis. 12 15 1.5: Adenocarcinoma NOS 546 229 451 73 16 1 1 41 4 84 13 19 28 171 360 70+ years 1,226 97 39 48 16 63 30 152 63 103 85 530 1,026 Total 13 100.0 3.1 2.2 16.6 3.5 3.1 3.5 6.6 7.0 14.8 6.6 33.2 74.7 <50 years All cases were coded as primary site, invasive ovarian cancers. Appendix Table D2.5 provides a list of the histology types included in each group. Source: Australian Cancer Database, AIHW. (a) Total 17 7 5: Unspecified malignant neoplasm 18 9 7 5 38 8 15 18 53 34 50 42 283 495 50–59 years Number of cases 4: Other specified malignant neoplasm 3: Germ cell tumours 2: Sex cord-stromal tumours 7 16 1.4: Clear cell carcinoma 1.7: Unspecified carcinoma 34 1.3: Endometrioid carcinoma 8 15 1.2: Mucinous carcinoma 1.6: Other specified carcinoma 76 171 <50 years 1.1: Serous carcinoma 1: Carcinoma (epithelial tumours) Type of ovarian cancer (a) Table 2.4: Incidence by type of ovarian cancer and age at diagnosis, 2006 100.0 3.1 3.3 1.6 1.3 2.7 3.3 9.7 6.2 9.2 7.7 51.8 90.7 50–69 years Per cent 100.0 16.2 3.5 0.2 0.2 9.1 0.9 18.6 2.9 4.2 6.2 37.9 79.8 70+ years 100.0 7.9 3.2 3.9 1.3 5.1 2.4 12.4 5.1 8.4 6.9 43.2 83.7 Total 217 1,309 1.4: Clear cell carcinoma 1.5: Adenocarcinoma NOS 265 5: Unspecified malignant neoplasm 6,042 221 190 188 88 392 68 1,161 307 559 673 2,195 5,355 1988–1993 6,534 298 203 180 87 394 64 1,067 329 557 627 2,728 5,766 1994–1999 Number of cases 8,330 550 293 270 77 535 178 1,170 437 679 586 3,555 7,140 2000–2006 14 100.0 5.1 2.3 3.0 1.9 6.9 0.9 25.1 4.2 10.0 11.4 29.5 87.8 1982–1987 All cases were coded as primary site, invasive ovarian cancers. Appendix Table D2.5 provides a list of the histology types included in each group. Source: Australian Cancer Database, AIHW. (a) 5,224 119 4: Other specified malignant neoplasm Total 155 98 358 3: Germ cell tumours 2: Sex cord-stromal tumours 1.7: Unspecified carcinoma 45 522 1.3: Endometrioid carcinoma 1.6: Other specified carcinoma 597 1,539 4,587 1982–1987 1.2: Mucinous carcinoma 1.1: Serous carcinoma 1: Carcinoma (epithelial tumours) Type of ovarian cancer (a) Table 2.5: Incidence by type of ovarian cancer, 1982–1987 to 2000–2006 100.0 3.7 3.1 3.1 1.5 6.5 1.1 19.2 5.1 9.3 11.1 36.3 88.6 1988–1993 100.0 4.6 3.1 2.8 1.3 6.0 1.0 16.3 5.0 8.5 9.6 41.8 88.2 1994–1999 Per cent 100.0 6.6 3.5 3.2 0.9 6.4 2.1 14.0 5.2 8.2 7.0 42.7 85.7 2000–2006 Incidence by stage at diagnosis Stage at diagnosis refers to the extent or spread of cancer at the time of diagnosis. Such information is essential for a number of reasons, including determining an individual’s prognosis, assisting in the planning and evaluation of treatment, and contributing to cancer monitoring and research (Odicino et al. 2008; Pecorelli et al. 2000). The fact that ovarian cancer is often diagnosed at an advanced stage is noted repeatedly in the literature and is considered to be one of the major contributors to the high mortality rate for this type of cancer (e.g. Laurvick et al. 2003; Menon & Jacobs 2001; Tracey et al. 2009). A number of different staging systems are used to classify ovarian cancers, including the International Federation of Gynecology and Obstetrics (FIGO) system, the International Union Against Cancer (UICC) TNM system, and the Surveillance Epidemiology End Results (SEER) Summary Staging system (or ‘summary staging system’ for short). In both the FIGO and the TNM systems, ovarian tumours are given a value from I (indicating early disease with the tumours confined to the ovaries and of relatively small size) to IV (indicating clearly distant metastatic disease, with metastasis found beyond the peritoneal cavity such as inside the liver, the lungs or other organs). In the summary staging system, which is a simpler system, tumours are allocated to one of three categories: local (the tumour is confined to one or both ovaries); regional (the tumour has spread to surrounding tissue or nearby lymph nodes); and distant (the tumour has spread to distant organs or other parts of the body and has begun to grow at the new location) (Young et al. 2001). Further details about these staging systems are provided in Appendix E. There is currently no national requirement in Australia for the collection of data on stage at diagnosis and not all states and territories collect this information. In addition, in the data that does exist, varying definitions of ovarian cancer are often used, with some including borderline ovarian tumours (which skew the results towards the less advanced stages) and others including only the staged cases (rather than all cases including those with an unknown stage), thus making comparison difficult with data that considered all cases. To give an indication of the proportion of ovarian cancers diagnosed at various stages, Table 2.6 presents data from New South Wales (NSW) for 1980 to 2003 (Tracey et al. 2009) and for the United States of America (USA) for 1999 to 2005 (Horner et al. 2009). Although the time periods to which the data apply differ markedly from each other, the advantage of presenting data from both NSW and the USA is that ovarian cancer was defined in these studies in the same way in which it was defined for the purposes of this report (i.e. those cancers coded as ‘C56’ in ICD-10, with borderline tumours excluded). Based on NSW data for 1980 to 2003, one-quarter (25%) of staged ovarian cancer cases were diagnosed when the tumour was localised, about two in nine (22%) were diagnosed when the tumour was at the regional stage, while over half (53%) were diagnosed when the tumour was at a distant stage. The 1999 to 2005 data from the USA also show that the majority of staged cases were at the distant stage when diagnosed, although the proportion is considerably higher (67%) than suggested by the NSW data. In addition, in 7% of the USA ovarian cancer cases, the stage at diagnosis was unknown. Change over time in the proportion of ovarian and other female genital organ cancers (i.e. ICD-10 codes of C56 and C57.0 to C57.7) that are diagnosed at different stages in NSW are shown in Table 2.7 (Tracey et al. 2007). The proportion of cases that had an unknown stage at diagnosis was similar over the two time periods considered (13% and 12% respectively). 15 Table 2.6: Incidence of ovarian cancer by stage at diagnosis, New South Wales and United States of America Stage at (a) diagnosis New South Wales (1980–2003) (b) (b,c) United States of America (1999–2005) (d) No. of cases % of staged cases No. of cases % of all cases Localised 1,763 25.4 n.a. 15 16 Regional 1,522 21.9 n.a. 17 18 Distant 3,649 52.6 n.a. 62 67 n.a. .. n.a. 7 .. 6,934 100.0 29,168 100 100 Unknown Total % of staged cases (a) Based on the SEER summary staging system. ‘Localised’ tumours were defined as those that were confined to one or both ovaries, ‘regional’ tumours had spread to surrounding tissue or nearby lymph nodes and ‘distant’ tumours had spread to distant organs or other parts of the body and had begun to grow at the new location (see Appendix E). (b) Includes ovarian cancers coded in ICD-10 as C56; borderline ovarian tumours are excluded. (c) Data were from the SEER 17 areas which cover approximately a quarter of the USA (see Table 21.7 in Horner et al. 2009). (d) These values are approximations that were calculated by the AIHW since only the percentage (rather than the exact number) of unknown cases was provided. Source: Tracey et al. 2009; Horner et al. 2009. Meanwhile, the proportion that was at the distant stage at diagnosis increased over time from 50% of staged cases in 1980–1998 to 60% of staged cases in 1999–2003. Tracey and associates (2009) suggest that this increase may reflect improvements in testing sensitivity due to advances in imaging and other diagnostic testing. Studies on ovarian cancer based on Californian data (Morris et al. 2008) and Florida data (FDH 2009) also found an increase over time in the proportion of ovarian cancer cases diagnosed with distant metastases. In contrast, other studies have not found such an increase, with one example being a study using Danish data (Kjaerbye-Thygesen et al. 2005). In that study, the proportion of cases with distant metastases at diagnosis decreased significantly between 1978–1982 and 1998–2002. The authors of the Danish study suggest that the different trends observed internationally may be due to the use of different staging systems and practices for classifying stage at diagnosis in different countries. Table 2.7: Incidence of ovarian and other female genital organ cancers(a) by stage at diagnosis, New South Wales, 1980–1998 and 1999–2003 1980–1998 Stage at (b) diagnosis 1999–2003 No. of (a) cases % of all cases % of staged cases No. of (a,c) cases % of all cases % of staged cases Localised 1,422 23.1 26.5 368 19.0 21.7 Regional 1,266 20.5 23.6 302 15.6 17.8 Distant 2,685 43.5 50.0 1,023 52.9 60.4 796 12.9 .. 240 12.4 .. 6,169 100.0 100.0 1,933 100.0 100.0 Unknown Total (a) Includes ovarian and other female genital organ cancers coded in ICD-10 as C56 and C57.0–C57.7 (see Appendix Table B.2); excludes borderline ovarian tumours. (b) Based on the SEER summary staging system. ‘Localised’ tumours were defined as those that were confined to one or both ovaries, ‘regional’ tumours had spread to surrounding tissue or nearby lymph nodes and ‘distant’ tumours had spread to distant organs or other parts of the body and had begun to grow at the new location (see Appendix E). (c) The number of cases for 1999 to 2003 were derived from Table 25 in Tracey et al. 2007. Source: Tracey et al. 2007. 16 Table 2.8 presents information on the stage of ovarian cancer according to age at diagnosis, using data from the USA for 1999 to 2005. Older women were more likely to be diagnosed with advanced stage ovarian cancer (69% of women aged 65 years and over) than other women (55% of those aged less than 65 years). This difference by age has also been observed in other research (e.g. Grossi et al 2002; Kosary 2007; WHC & NCRI 2006). In addition, the USA data indicate that an unknown stage at diagnosis was also more likely among older women than others (10% and 4% of cases, respectively). Table 2.8: Incidence of ovarian cancer(a) by stage and age at diagnosis, United States of America, 1999–2005 <65 years 65+ All ages No. of cases % of all cases % of staged (c) cases No. of cases % of all cases % of staged (c) cases No. of cases % of all cases % of staged (c) cases Localised n.a. 21 22 n.a. 7 8 n.a. 15 16 Regional n.a. 20 21 n.a. 13 14 n.a. 17 18 Distant n.a. 55 58 n.a. 69 77 n.a. 62 67 Unknown n.a. 4 .. n.a. 10 .. n.a. 7 .. 16,000 100 100 13,168 100 100 29,168 100 100 Stage at (b) diagnosis Total (a) Includes ovarian cancers coded in ICD-10 as C56; borderline ovarian tumours were excluded. Data were from the SEER 17 areas which cover approximately a quarter of the USA (see Table 21.7 in Horner et al. 2009). (b) Based on the SEER summary staging system. ‘Localised’ tumours were defined as those that were confined to one or both ovaries, ‘regional’ tumours had spread to surrounding tissue or nearby lymph nodes and ‘distant’ tumours had spread to distant organs or other parts of the body and had begun to grow at the new location (see Appendix E). (c) These values are approximations since only the percentage (rather than the exact number) of unknown cases was provided. Source: Horner et al. 2009. Differences across groups In this section, data on the incidence of ovarian cancer are provided according to geographical area, socioeconomic status, Aboriginal and Torres Strait Islander status and country of birth. In order to take into account differences in the age structures and the size of the groups being compared, age-standardised rates are provided for each of the comparisons. The data are presented for the 5-year period of 2002 to 2006 rather than for just 1 year since presenting the data for multiple years reduces random variation in the data. This is especially important for comparisons of small sub-groups (e.g. Indigenous women or women in smaller states and territories). Observed differences by the characteristics examined in this section may result from a number of factors including variation in: • population characteristics (e.g. a relatively greater proportion of Indigenous women in remote areas) • the prevalence of risk and/or protective factors (e.g. reproductive patterns, use of the contraceptive pill) • the availability of diagnostic services. 17 Differences by geographical area In the 2002 to 2006 period, the largest average number of ovarian cancer cases diagnosed each year was in New South Wales (408 cases annually) and the smallest number in the Northern Territory (7 cases annually) (Table 2.9). When the age structure and size of the population in each state and territory was taken into account, the results indicate that the Northern Territory had the lowest incidence rate (9.1 cases per 100,000 females), followed by South Australia (9.4 per 100,000) and Tasmania (9.5 per 100,000). While the rates for the Northern Territory and Tasmania did not differ significantly from that of the other states and territories, the rate for South Australia was significantly lower than the rates for New South Wales (11.0 per 100,000), Victoria (11.8 per 100,000) and Western Australia (12.2 per 100,000). The highest incidence rates were observed for Western Australia and the Australian Capital Territory, with 12.2 cases of ovarian cancer diagnosed per 100,000 females in each of those jurisdictions. While the rate for the Australian Capital Territory was not significantly different from that of other states and territories, the rate for Western Australia was significantly higher than the rates for Queensland and South Australia (10.5 and 9.4 cases per 100,000 females). Table 2.9: Incidence of ovarian cancer by state and territory, 2002–2006 State or territory Average annual (a) number of cases Total number of cases Age-standardised (b) rate 95% confidence interval New South Wales 408 2,042 11.0 10.5–11.5 Victoria 327 1,633 11.8 11.2–12.4 Queensland 213 1,066 10.5 9.9–11.2 Western Australia 123 617 12.2 11.3–13.2 South Australia 89 446 9.4 8.6–10.4 Tasmania 28 138 9.5 8.0–11.3 Australian Capital Territory 19 93 12.2 9.8–15.0 7 33 9.1 5.8–13.3 1,214 6,068 11.1 10.8–11.3 Northern Territory Total (a) Numbers may not sum to the total due to rounding. (b) The age-standardised rates were standardised to the Australian population as at 30 June 2001 and are expressed per 100,000 females. The rates are based on the total number of cases over the 5-year period from 2002–2006. Source: Australian Cancer Database, AIHW. Age-standardised incidence rates according to level of remoteness of the area in which the women lived at diagnosis are shown in Figure 2.5. The Australian Standard Geographical Classification (ASGC) Remoteness Areas was used to categorise areas of Australia. Information about this classification is provided in Appendix A. While the incidence rate for women who lived in Remote and very remote areas at diagnosis (12.2 cases per 100,000 females) was higher than those for other women, the difference was not statistically significant. 18 18 New cases per 100,000 females 16 14 12 10 8 6 4 2 0 Major cities Inner regional Outer regional Remote and very remote Total Remoteness area Notes 1. Remoteness was classified according to the Australian Standard Geographical Classification (ASGC) Remoteness Areas (see Appendix A). 2. The rates were age-standardised to the Australian population as at 30 June 2001 and are based on the total number of cases over the 5-year period from 2002–2006. 3. The ‘Total’ column includes cases for which information on remoteness area was not available. 4. The data for this figure are shown in Appendix Table D2.9. Source: Australian Cancer Database, AIHW. Figure 2.5: Incidence of ovarian cancer by remoteness area, 2002–2006 Differences by socioeconomic status The findings from studies that have addressed the associations between socioeconomic status and the risk of ovarian cancer have been inconsistent. For example, there was no significant association found using South Australian data for 1977 to 2001 (Cancer Council SA 2009) and Irish data for 2000 to 2004 (Donnelly et al. 2009), while disadvantaged women in Queensland were significantly more likely than more advantaged women to be diagnosed with ovarian cancer between 1996 and 2002 (Baade et al. 2005). In this report, the Index of Relative Socio-economic Disadvantage (IRSD) is used to indicate socioeconomic status (ABS 2008a), with the first group (which is labelled ‘1’) corresponding to geographical areas containing the 20% of the population with the lowest socioeconomic status according to the IRSD and the fifth group corresponding to the 20% of the population with the highest status. Appendix A provides further information about the IRSD. As shown in Figure 2.6, there was no statistically significant association between the incidence of ovarian cancer and socioeconomic status in Australia in 2002 to 2006. 19 New cases per 100,000 females 14 12 10 8 6 4 2 0 1 (Lowest) 2 3 4 5 (Highest) Total Socioeconomic status Notes 1. Socioeconomic status was classified using the ABS Index of Relative Socio-economic Disadvantage (see Appendix A). 2. The rates were age-standardised to the Australian population as at 30 June 2001 and are based on the total number of cases over the 5-year period from 2002–2006. 3. The ‘Total’ column includes cases for which information on socioeconomic status was not available. 4. The data for this figure are shown in Appendix Table D2.10. Source: Australian Cancer Database, AIHW. Figure 2.6: Incidence of ovarian cancer by socioeconomic status, 2002–2006 Differences by Aboriginal and Torres Strait Islander status Across a range of health-related and socioeconomic indicators, Aboriginal and Torres Strait Islander people are disadvantaged relative to other Australians. They are more likely to live in remote areas of Australia and have a relatively younger age structure, with a median age of 21 years compared with 37 years for the non-Indigenous population (ABS & AIHW 2008). This age difference is thought to be largely due to higher rates of fertility, as well as a shorter life expectancy among the Indigenous population (ABS 2009g,h). Reliable national data on the incidence of cancer for Indigenous women are not available. While all state and territory cancer registries collect Indigenous status information, the quality of the data in some areas is insufficient for analysis. In this report, data for four states and territories—Queensland, Western Australia, South Australia and the Northern Territory—are used to examine the incidence of ovarian cancer by Indigenous status. While the majority (60%) of Australian Indigenous women live in these four jurisdictions (ABS 2009f), the degree to which data for these jurisdictions are representative of data for all Indigenous women is unknown. Furthermore, due to the small number of Indigenous women who had been diagnosed with ovarian cancer in the four jurisdictions between 2002 and 2006—namely, an average of 8 women per year—caution should be taken when making use of the data on ovarian cancer rates by Indigenous status. For the four jurisdictions, the level of missing data on Indigenous status for ovarian cancer cases diagnosed between 2002 and 2006 was 3% (Table 2.10). 20 Although the age-standardised incidence rate for Indigenous women was slightly higher than that for non-Indigenous women (12.4 and 11.2 cases per 100,000 females, respectively), the difference was not statistically significant. Table 2.10: Incidence of ovarian cancer by Indigenous status, Queensland, Western Australia, South Australia and the Northern Territory, 2002–2006 Indigenous status (a) Total number of cases 8 38 12.4 410 2,050 11.2 15 74 .. 432 2,162 11.6 Annual average number of cases Indigenous Non-Indigenous Not stated Total Age-standardised rate (b,c) (a) Numbers may not sum to the total due to rounding. (b) Indirectly age-standardised to the 2002–2006 non-Indigenous population for the four jurisdictions (see Appendix B) and based on the total number of cases over the 5-year period from 2002–2006. (c) The 95% confidence interval around the age-standardised rate for Indigenous women is 8.8–17.0. Source: Australian Cancer Database, AIHW. A study using Northern Territory data for the years from 1991 to 2001 also found no significant difference in ovarian cancer incidence by Indigenous status (Condon 2004), as did a study using Queensland data for 1982 to 1996 (Coory et al. 2000). A study using New Zealand data for 2005 (NZ Ministry of Health 2009a, 2009b) also showed no significant difference by Indigenous status, whereas data from the USA indicated that American Indians and Alaska native women had a significantly lower incidence rate of ovarian cancer than their white counterparts (USCSWG 2009; Wiggins et al. 2008). Differences by country of birth Australia has one of the largest proportions of immigrant populations in the world. In 2006, it was home to 4.4 million overseas-born people and one in four (25%) residents was born outside of the country (ABS 2009a). Research has found that most migrants are at least as healthy, if not more so, as the Australian-born population. The ‘healthy migrant effect’ is believed to result from two main factors: a self-selection process in which those people who are physically and economically able to migrate are the ones who do; and government eligibility criteria for migrants based on health, education, language and job skills (AIHW 2008a). However, research suggests that this migrant health advantage decreases over time. In regard to ovarian cancer, it is thought that incidence rates for migrants also tend to converge with that of the host country over time, particularly so for any offspring (Kliewer & Smith 1995; Parkin & Iscovich 1997). Immigrants are more likely than Australian-born people to live in urban areas (ABS 2009a); this often provides immigrants with relatively easier access to health care services. At the same time, though, language and cultural barriers may mean that some immigrants are less likely or able to access available services. In the earlier edition of this report (AIHW & NBCC 2006), data on ovarian cancer incidence by country of birth were only available for New South Wales, whereas in this edition, national data are provided. Note that these data do not take into account the length of time the immigrants lived in Australia, although some groups—for instance, people from Asia— tend to be more recent immigrants while people from many European countries tend to have been in Australia for longer periods of time (ABS 2009a). 21 In this report, country of birth data were classified using the Standard Australian Classification of Countries (SACC), second edition. Further information about this classification can be found in Appendix A. Information on the woman’s country of birth was not available for 5% of the ovarian cancer cases diagnosed in Australia between 2002 and 2006. Figure 2.7 shows that women living in Australia who were born in the Americas had the highest rate of ovarian cancer (13.7 cases per 100,000 females), with this rate significantly higher than the rates for women born in Australia (9.9 per 100,000). The lowest agestandardised incidence rate was seen among women who were born in North-East Asia (9.3 per 100,000). This rate was not significantly different from that of those who were born in Australia. Americas Sub-Saharan Africa Southern and Central Asia North-West Europe Oceania and Antarctica, excl. Australia South-East Asia North Africa and the Middle East Australia Southern and Eastern Europe North-East Asia 0 3 6 9 12 15 18 New cases per 100,000 females Notes 1. Country of birth was classified according to the Standard Australian Classification of Countries, second edition (see Appendix A). 2. The rates were indirectly age-standardised to the 2002–2006 Australian-born population and are based on the total number of cases over the 5-year period from 2002–2006 (see Appendix B). 3. The data for this figure are shown in Appendix Table D2.11. Source: Australian Cancer Database, AIHW. Figure 2.7: Incidence of ovarian cancer by country/region of birth, 2002–2006 International comparisons In this section of the report, the incidence rate of ovarian cancer in Australia is compared with the rate for other countries using data from the GLOBOCAN database—a database which is prepared by the International Agency for Research on Cancer (IARC) (Ferlay et al. 2004). The most recent GLOBOCAN estimates are for 2002, with these estimates based on cancer incidence rates from approximately two to five years earlier. The GLOBOCAN data for ovarian cancer pertain to ‘ovarian and related cancers’ (that is, the ICD-10 codes of C56 and C57.0–C57.4) and thus encompass a broader range of cancers than is generally considered in this report. However, in line with the definition of ovarian cancer used in this report, borderline ovarian tumours were not included in the 2002 GLOBOCAN data. See 22 Appendix C for further details about this database. As discussed in Chapter 1, caution must be taken when comparing data from different countries since observed differences may be due to a range of methodological factors, not just differences in the underlying rates. The estimated number of new cases of ovarian and related cancers around the world in 2002 was approximately 204,500 (Appendix Table D2.12). Figure 2.8 shows the estimated incidence rates of these cancers by country (for Australia and New Zealand) and by region. The estimated age-standardised rate for Australia was 8.9 new cases per 100,000 females. Thus, Australia was estimated to have a significantly higher incidence rate than the average world rate (6.6 cases per 100,000 females) and than of all the African and Asian regions. Northern Europe New Zealand Western Europe Northern America Central and Eastern Europe Southern Europe Australia South America Polynesia Central America South-Eastern Asia World Melanesia Micronesia Eastern Africa Western Asia South-Central Asia Southern Africa Western Africa Caribbean Eastern Asia Middle Africa Northern Africa 0 2 4 6 8 10 12 14 Estimated new cases per 100,000 females Notes 1. The data were estimated for 2002 by the International Agency for Research on Cancer (IARC) and are based on data from approximately 3 to 5 years earlier. 2. The data pertain to cancers coded in ICD-10 as C56 and C57.0–C57.4. 3. The rates were age-standardised by the IARC using the Doll et al. (1966) World Standard Population. The confidence intervals (as shown by the error bars) are approximations and were calculated by the AIHW (see Appendix B). 4. The data for this figure are shown in Appendix Table D2.12. Source: Ferlay et al. 2004. Figure 2.8: International comparison of estimated incidence of ovarian and related cancers, 2002 23 However, Australia’s rate was significantly lower than the rates of all other Westernised countries and regions, including New Zealand (12.4 per 100,000), Northern America (10.7 per 100,000) and all of the European regions (which ranged from 9.7 to 13.3 cases per 100,000 females). The differences by region and country in the incidence rates for ovarian and related cancers may be due to a number of factors, including differences in diagnostic and classification practices, completeness of cancer registration, the proportion of women with various risk and protective factors (e.g. parity and use of oral contraceptives) and genetic susceptibility (Bray et al. 2005; Colombo et al 2006; Kliewer & Smith 1995; Kricker 2002). 24 3 Mortality from ovarian cancer The number of deaths from ovarian cancer in a given time period is a result of the incidence of ovarian cancer, as well as factors that affect the likelihood of fatality such as the characteristics of the ovarian cancers diagnosed (e.g. stage at diagnosis and histological type of ovarian cancer), and the nature and quality of treatments received. In this report, mortality refers to the number of deaths for which the underlying cause was a primary site ovarian cancer. The ovarian cancer that led to the death may have been diagnosed many years previously, in the same year in which the person died or, in some cases, after death (e.g. at autopsy). Information on the underlying cause of death is derived from the medical certificate of cause of death which is issued by a certified medical practitioner. The main data source used in this chapter was the National Mortality Database. This database contains information about deaths due specifically to ovarian cancer from 1968 onwards (see Appendix C for further information). In this chapter, information is presented on the number of deaths attributed to ovarian cancer in 2006, as well as in previous years. In addition, differences in mortality rates according to age, geographical area, socioeconomic status, Indigenous status and country of birth are provided. Lastly, mortality rates for Australia and other countries are compared. Mortality in 2006 A total of 795 women died from ovarian cancer in 2006 (Table 3.1); thus, across Australia, an average of 2 women died every day from this disease. Ovarian cancer was the sixth most Table 3.1: The 10 most common types of cancer deaths, females, 2006 95% confidence interval No. of deaths % of all gynaecological cancer deaths % of all cancer deaths % of all deaths Lung (C33–C34) 2,683 .. 15.7 4.1 22.7 21.8–23.6 Breast (C50) 2,618 .. 15.3 4.0 22.1 21.3–23.0 Unknown primary site (C26, C39, C76–C80) 1,917 .. 11.2 2.9 15.1 14.5–15.8 Bowel (C18–C20) 1,675 .. 9.8 2.6 13.6 12.9–14.2 Pancreas (C25) 1,029 .. 6.0 1.6 8.4 7.9–8.9 Ovary (C56) 795 54.7 4.6 1.2 6.7 6.2–7.2 All lymphomas (C81–C85,C96) 669 .. 3.9 1.0 5.4 5.0–5.8 All leukaemias (C91–C95) 609 .. 3.6 0.9 5.0 4.6–5.4 Melanoma (C43) 452 .. 2.6 0.7 3.8 3.5–4.2 Stomach (C16) 448 .. 2.6 0.7 3.6 3.3–4.0 17,123 .. 100.0 26.3 141.0 138.9–143.2 Cancer type (ICD-10 codes) (b) All cancers ASR (a) (a) The age-standardised rates were standardised to the Australian population as at 30 June 2001 and are expressed per 100,000 females. (b) Includes cancers coded in the ICD-10 as C00–C97, D45, D46, D47.1 and D47.3. Source: National Mortality Database, AIHW. 25 common cause of cancer death among women. Mortality from ovarian cancer accounted for 5% of all female cancer deaths and 1% of all female deaths. Furthermore, ovarian cancer was the most common cause of gynaecological cancer death in 2006, representing over half (55%) of such deaths. This means that more women died from ovarian cancer than from all of the other gynaecological cancers combined. The age-standardised mortality rate of ovarian cancer in 2006 was 6.7 deaths per 100,000 females. The corresponding rates for lung cancer and breast cancer were 22.7 and 22.1 (deaths per 100,000 females), respectively. Differences by age at death In 2006, 1% of deaths due to ovarian cancer occurred among women aged under 40 years, just over one-fifth (22%) occurred among those aged 40 to 59 years, while the over three in four deaths (77%) occurred among women aged 60 years and over (Appendix Table D3.1). Figure 3.1 presents mortality rates of ovarian cancer according to age at death for 2006. As a point of comparison, incidence rates by age at diagnosis are also shown. Similar to the incidence rates, the likelihood of women dying from ovarian cancer increased with age. The mortality rates were less than 2 deaths per 100,000 females for those aged up to and including 40 to 44 years. From that age group onwards, there was an increase in the mortality rates between most age groups (although in most cases the difference from one age group to the next was not statistically significant). The highest mortality rate of 48.7 deaths per 100,000 females was observed for the oldest age group (i.e. those aged 85 years and over), with this rate significantly higher than the rates for all age groups up to and including 70 to 74 years. 50 New cases/deaths per 100,000 females 45 40 35 30 Incidence 25 20 15 10 Mortality 5 Age group (years) Notes 1. The rates shown are age-specific rates. 2. The data for this figure are shown in Appendix Tables D2.1 and D3.1. Source: Australian Cancer Database, AIHW & National Mortality Database, AIHW. Figure 3.1: Ovarian cancer incidence and mortality by age group, 2006 26 85+ 80–84 75–79 70–74 65–69 60–64 55–59 50–54 45–49 40–44 35–39 30–34 25–29 20–24 <20 0 Trends The first year for which national mortality data for ovarian cancer are available is 1968. In Figure 3.2, the number of deaths due to ovarian cancer and the corresponding agestandardised mortality rates are shown for 1968 to 2006. For comparison purposes, agestandardised incidence rates are also shown. Despite some year-to-year fluctuations, the number of deaths from ovarian cancer increased over time. In 1968, 451 women died from ovarian cancer; in 1990, this number had risen to 705 women, while 795 women had died from ovarian cancer in 2006. Between 1968 and 2006, the number of deaths from ovarian cancer increased by 76%. When the age-standardised rates are considered, some year-to-year fluctuations are again seen. However, overall, the mortality rate decreased significantly by 26% between 1968 (9.1 deaths per 100,000 females) and 2006 (6.7 per 100,000). In addition, the age-standardised mortality rate for 2006 was the lowest rate for any year to date (although it was not significantly lower than the rates observed for three of the preceding years). 14 New cases per 100,000 12 Number of deaths 1,000 10 Deaths per 100,000 800 8 600 6 400 4 Number of deaths 200 2 2006 2004 2002 2000 1998 1996 1994 1992 1990 1988 1986 1984 1982 1980 1978 1976 1974 1972 1970 0 1968 0 New cases/deaths per 100,000 females 1,200 Notes 1. The rates were age-standardised to the Australian population as at 30 June 2001. The 1968 to 1996 mortality data were adjusted from earlier ICD standards to ICD-10 standards using a factor of 0.98. 2. The data for this figure are shown in Appendix Tables D2.2 and D3.2. Incidence data are available from 1982 onwards. Source: Australian Cancer Database, AIHW & National Mortality Database, AIHW. Figure 3.2: Ovarian cancer incidence and mortality, 1968 to 2006 Possible explanations for the decline in the mortality rate from ovarian cancer over time include the following: • a decrease in the incidence rate of ovarian cancer (as discussed in Chapter 2) • improvements in access to and quality of treatments, including greater sub-specialisation in gynaecological oncology, more aggressive surgery, the availability of more effective types of chemotherapy, and better multidisciplinary care (Kjaerbye-Thygesen et al. 2005; Oriel et al. 1999; Tracey et al. 2008) • change over time in the histological types of ovarian cancers occurring among women (as discussed in Chapter 4, the prognosis is better for some types of ovarian cancers than others). 27 Trends by age at death Trends in ovarian cancer morality rates by age for the 25-year period from 1982 to 2006 are shown in Figure 3.3. Between 1982 and 2006, the mortality rate due to ovarian cancer decreased slightly but significantly for those aged less than 50 years at death, from 1.7 per 100,000 females in 1982 to 0.8 per 100,000 females in 2006. The rate also fell significantly for women aged 50 to 69 years at death, with a decline of 39% (20.7 deaths per 100,000 females in 1982 to 12.7 per 100,000 in 2006). In contrast, for women aged 70 years and over at death, numerous year-to-year fluctuations in the mortality rate are observed, with an overall statistically significant increase in the ovarian cancer mortality rate of 9% from 1982 to 2006 (36.6 and 40.3 deaths per 100,000 females, respectively). Thus, the trend in the mortality rates for women aged 70 years and over was in the opposite direction to the trend for those aged less than 70 years. 50 70+ years 45 Deaths per 100,000 females 40 35 30 25 50–69 years 20 15 All ages 10 5 <50 years 0 1982 1984 1986 1988 1990 1992 1994 1996 1998 2000 2002 2004 2006 Notes 1. The rates were age-standardised to the Australian population as at 30 June 2001. The 1982 to 1996 rates were adjusted from ICD-9 to ICD-10 standards using a factor of 0.98. 2. The data for this figure are shown in Appendix Table D3.3. Source: National Mortality Database, AIHW. Figure 3.3: Mortality from ovarian cancer by age at death, 1982 to 2006 While the trend of increasing ovarian cancer mortality rates for older women has also been observed elsewhere (e.g. in data from the USA reported by Oriel et al. 1999), the reasons for this increase are not clear. Part of the explanation may be that, unlike those aged 50 to 69 years, the ovarian cancer incidence rate did not fall for those aged 70 years and over (see Chapter 2). Second, it is possible that the benefits of improvements in treatment (such as the improved treatment of germ cell cancers) have been relatively smaller for older women than younger women (Bray et al. 2005; Cancer Council Victoria 2007; Oriel et al. 1999). Third, change over time in the relative proportion of older women (compared with other women) who are diagnosed with types of ovarian cancer that have a poorer prognosis may also help explain this trend. Note that while it is well established that older women tend to be diagnosed at a later stage than younger women (see Chapter 2) and that older women are, in general, given less aggressive treatment than their younger counterparts (Maas et al. 2005; Petignat et al. 2004; WHC & NCRI 2006), these differences by age do not help explain the rise in mortality rates 28 among older women unless those trends have worsened over time (Oriel et al. 1999). In conclusion, the reasons for increasing ovarian cancer mortality rates for older women are not clearly understood and further investigation on this topic could be warranted. Risk of death from ovarian cancer and average age at death Based on 2006 data, the risk of a woman in the general population dying from ovarian cancer before the age of 75 years was 1 in 206; the corresponding risk for the age of 85 was 1 in 108 (Table 3.2). Although these risk levels have fluctuated over the years, the general pattern has been one of a decrease in the risk of a woman dying from ovarian cancer. For example, based on 1982 data, the risk of dying from ovarian cancer by the age of 85 years was 1 in 89 compared with the risk of 1 in 108 calculated from the 2006 data. The average age at death due to ovarian cancer has increased over time. The mean age of death of women who died from ovarian cancer increased from 65 years in 1982 to 70 years in 2006, while the median age increased from 65 years to 72 years over the same period. Table 3.2: Risk of death from ovarian cancer and average age at death, 1982 to 2006 Year Risk to age 75 years Risk to age 85 years Mean age at death Median age at death 1982 1 in 145 1 in 89 64.9 65.0 1983 1 in 146 1 in 95 64.6 64.0 1984 1 in 140 1 in 90 65.0 66.0 1985 1 in 155 1 in 101 65.9 66.0 1986 1 in 144 1 in 94 65.1 66.0 1987 1 in 156 1 in 99 65.3 65.0 1988 1 in 166 1 in 100 65.4 66.0 1989 1 in 156 1 in 100 66.3 67.0 1990 1 in 142 1 in 88 66.5 68.0 1991 1 in 148 1 in 92 67.0 68.0 1992 1 in 161 1 in 101 66.6 68.0 1993 1 in 155 1 in 94 68.1 69.0 1994 1 in 159 1 in 92 66.2 68.0 1995 1 in 169 1 in 97 67.7 69.0 1996 1 in 162 1 in 90 67.8 70.0 1997 1 in 178 1 in 95 68.8 71.0 1998 1 in 176 1 in 95 69.0 71.0 1999 1 in 194 1 in 102 69.4 72.0 2000 1 in 178 1 in 100 69.2 71.0 2001 1 in 179 1 in 94 70.0 72.0 2002 1 in 173 1 in 93 69.2 71.0 2003 1 in 199 1 in 104 69.0 71.0 2004 1 in 173 1 in 94 69.6 71.0 2005 1 in 193 1 in 97 70.6 73.0 2006 1 in 206 1 in 108 70.3 72.0 Note: The 1982 to 1996 data were adjusted from ICD-9 to ICD-10 standards using a factor of 0.98. Source: National Mortality Database, AIHW. 29 Differences across groups In this section of the report, differences in mortality of women from ovarian cancer are presented according to geographical area, socioeconomic status, Indigenous status and country of birth. Any observed differences among the groups compared may be due to a number of reasons, including differences in incidence rates of ovarian cancer, the characteristics of the ovarian cancers diagnosed (e.g. stage at diagnosis and type of tumour), and access to and quality of treatment. Similar to what was done to examine differences in incidence across groups, age-standardised rates for the 5-year period from 2002 to 2006 are compared. Differences by geographical area The average number of ovarian cancer deaths per year over the period from 2002 to 2006 ranged from 283 in New South Wales to 2 in the Northern Territory (Table 3.3). When the age-standardised rates are considered, the Northern Territory had the lowest rate (3.2 deaths per 100,000 females), with this rate significantly lower than the rates for Victoria (8.1 per 100,000 females), Western Australia (7.6 per 100,000) and New South Wales (7.3 per 100,000). The highest age-standardised rates were observed for the Australian Capital Territory (8.3 per 100,000) and Victoria (8.1 per 100,000). While the rate for the Australian Capital Territory did not differ significantly from that of other states and territories, the rate for Victoria was significantly higher than that observed for Queensland (6.8 per 100,000), South Australia (6.5 per 100,000) and the Northern Territory (3.2 per 100,000). Table 3.3: Mortality from ovarian cancer by state and territory, 2002–2006 State or territory Average annual number of deaths Total number of cases Age-standardised (b) rate 95% confidence interval New South Wales 283 1,414 7.3 6.9–7.7 Victoria 234 1,168 8.1 7.7–8.6 Queensland 139 693 6.8 6.3–7.3 Western Australia 77 385 7.6 6.8–8.4 South Australia 64 322 6.5 5.8–7.3 Tasmania 21 106 7.2 5.9–8.7 Australian Capital Territory 12 60 8.3 6.3–10.8 Northern Territory 2 10 3.2 1.2–6.3 832 4,158 7.3 7.1–7.6 (a) Total (a) These data may not be comparable with data published in state and territory cancer reports since the data shown in this report relate to the place of residence at the time of death, not the place of residence at the time of diagnosis as is often shown in state and territory reports. Furthermore, the states and territory cancer registries tend to use a different methodology from that used by the AIHW to determine the cause of death (see Appendix B). (b) The age-standardised rates were standardised to the Australian population as at 30 June 2001 and are expressed per 100,000 females. The rates are based on the total number of cases over the 5-year period from 2002–2006. Source: National Mortality Database, AIHW. In Figure 3.4, the ovarian cancer mortality rates for women living in different remoteness areas are presented. The mortality data are based on the remoteness of the usual place of residence of the women at time of death. During the 2002 to 2006 period, women living in Remote and very remote areas had the highest mortality rate (9.6 deaths per 100,000 females), 30 with this rate being significantly higher than the rate for those living in Major cities (7.2 per 100,000). This difference may be related to a number of factors including access to diagnostic and other health services in remote areas. 14 Deaths per 100,000 females 12 10 8 6 4 2 0 Major cities Inner regional Outer regional Remote and very remote Total Remoteness area Notes 1. Remoteness was classified according to the Australian Standard Geographical Classification (ASGC) Remoteness Areas (see Appendix A). 2. The rates were age-standardised to the Australian population as at 30 June 2001 and are based on the total number of cases over the 5-year period from 2002–2006. 3. The ‘Total’ column includes cases for which information on remoteness area was not available. 4. The data for this figure are shown in Appendix Table D3.4. Source: National Mortality Database, AIHW. Figure 3.4: Mortality from ovarian cancer by remoteness area, 2002–2006 Differences by socioeconomic status The socioeconomic status measure used in this report pertains to the characteristics of people in the area in which the women lived, rather than to the characteristics of the individual (see Appendix A). From 2002 to 2006, women living in areas with the highest socioeconomic status had the highest ovarian cancer mortality rate (7.8 deaths per 100,000 females) but this rate was not significantly higher than the rates for women living in other areas (Figure 3.5). Differences by Aboriginal and Torres Strait Islander status Information in the National Mortality Database (NMD) on Indigenous status for 2002 to 2006 is considered to be of sufficient quality for use for five jurisdictions: New South Wales, Queensland, Western Australia, South Australia and the Northern Territory. Almost nine in ten (89%) Indigenous women live in these five jurisdictions (ABS 2009f). In the NMD, the Indigenous status of 1% of the women who had died from ovarian cancer was not known (Table 3.4). Between 2002 and 2006, there was an annual average of 6 ovarian cancer deaths recorded for Indigenous women in the five jurisdictions. Due to the relatively small number of Indigenous women who died from ovarian cancer, caution should be taken when considering differences in mortality rates by Indigenous status. 31 10 9 Deaths per 100,000 females 8 7 6 5 4 3 2 1 0 1 (Lowest) 2 3 4 5 (Highest) Total Socioeconomic status Notes 1. Socioeconomic status was classified using the ABS Index of Relative Socio-economic Disadvantage (see Appendix A). 2. The rates were age-standardised to the Australian population as at 30 June 2001 and are based on the total number of cases over the 5-year period from 2002–2006. 3. The ‘Total’ column includes cases for which information on socioeconomic status was not available. 4. The data for this figure are shown in Appendix Table D3.5. Source: National Mortality Database, AIHW. Figure 3.5: Mortality from ovarian cancer by socioeconomic status, 2002–2006 There was no statistically significant difference in the age-standardised mortality rates from ovarian cancer for Indigenous women compared with non-Indigenous women (8.4 deaths per 100,000 females among Indigenous women and 7.9 per 100,000 among non-Indigenous women). This finding of a lack of significant difference by Indigenous status mirrors those of a number of other studies, including research using data from the Northern Territory (Condon 2004; Zhang et al. 2008), New South Wales (Supramaniam et al. 2006) and New Zealand (NZ Ministry of Health 2009a,b). In contrast, data from the United States of America indicated that American Indian and Alaska native women had a significantly lower agestandardised mortality rate from ovarian cancer than white American women (5 and 9 deaths per 100,000 females, respectively) (USCSWG 2009). Table 3.4: Mortality from ovarian cancer by Indigenous status, New South Wales, Queensland, Western Australia, South Australia and the Northern Territory, 2002–2006 Indigenous status (a) Total number of cases 6 30 8.4 553 2,764 7.9 6 30 .. 565 2,824 8.0 Average annual number of deaths Indigenous Non-Indigenous Not stated Total Age-standardised rate (b,c) (a) Numbers may not sum to the total due to rounding. (b) Indirectly age-standardised to the 2002–2006 non-Indigenous population for the five jurisdictions (see Appendix B) and are based on the total number of cases over the 5-year period from 2002–2006. (c) The 95% confidence interval around the age-standardised rate for Indigenous women is 5.7–12.0. Source: National Mortality Database, AIHW. 32 Differences by country of birth From 2002 to 2006, women living in Australia who were born in Sub-Saharan Africa had the highest age-standardised mortality rate (10.6 deaths per 100,000 females), with this rate significantly higher than the rate for women born in Australia (7.2 per 100,000) (Figure 3.6). The lowest mortality rates were observed for women born in the Americas (5.9 per 100,000), South-East Asia (6.0 per 100,000) and North-East Asia (6.0 per 100,000); these rates were not significantly higher than the rate for those born in Australia. Sub-Saharan Africa North-West Europe North Africa and the Middle East Southern and Central Asia Southern and Eastern Europe Australia Oceania and Antarctica, excl. Australia North-East Asia South-East Asia Americas 0 3 6 9 12 15 Deaths per 100,000 females Notes 1. Country of birth was classified according to the Standard Australian Classification of Countries, second edition (see Appendix A). 2. The rates were indirectly age-standardised to the 2002–2006 Australian-born population and are based on the total number of cases over the 5-year period from 2002–2006 (see Appendix B). 3. The data for this figure are shown in Appendix Table D3.6. Source: National Mortality Database, AIHW. Figure 3.6: Mortality from ovarian cancer by country/region of birth, 2002–2006 International comparisons As discussed in Chapter 1, caution must be taken when comparing international data on cancer mortality since observed differences may be due to a range of factors, not just differences in the underlying mortality rates. Data on ovarian cancer deaths from the GLOBOCAN database (Ferlay et al. 2004) are shown in Figure 3.7. The confidence intervals indicate the variation that would be expected by chance, assuming that the estimated mortality rates are accurate. Note that the GLOBOCAN data pertain to both ‘ovarian and related cancers’ (specifically, the ICD-10 codes of C56 and C57.0–C57.4) rather than to just ‘ovarian cancer’. In addition, the data are estimates for 2002 and are based on information from around 3 to 5 years earlier. Further information about these data is provided in Appendix C. The age-standardised mortality rate from ovarian and related cancers for Australia (4.9 deaths per 100,000 females) was significantly lower than that for a number of other 33 Northern Europe New Zealand Western Europe Northern America Central and Eastern Europe Australia Southern Europe Polynesia Eastern Africa South-Eastern Asia World Melanesia South-Central Asia South America Central America Micronesia Western Asia Western Africa Southern Africa Caribbean Middle Africa Northern Africa Eastern Asia 0 1 2 3 4 5 6 7 8 Estimated deaths per 100,000 females Notes 1. The data were estimated by IARC for 2002 and are based on data from approximately 3 to 5 years earlier. 2. The data pertain to cancers coded in ICD-10 as C56 and C57.0–C57.4. 3. The rates were age-standardised by the IARC using the Doll et al. (1966) World Standard Population. The confidence intervals (as shown by the error bars) are approximations and were calculated by the AIHW (see Appendix B). 4. The data for this figure are shown in Appendix Table D3.7. Source: Ferlay et al. 2004. Figure 3.7: International comparison of estimated mortality from ovarian and related cancers, 2002 Westernised countries and regions including Northern Europe (7.9 per 100,000), New Zealand (6.4 per 100,000), Western Europe (6.3 per 100,000) and Northern America (6.1 per 100,000). Meanwhile, Australia’s mortality rate from ovarian and related cancers was estimated to be significantly higher than the rate for each of the African and Asian regions (which ranged from 1.8 to 4.1 deaths per 100,000 females). Ovarian cancer as an associated cause of death The data presented thus far in this chapter apply to deaths of women for which the underlying cause of death was ovarian cancer. In addition to an underlying cause of death, associated causes of death can be listed on a death certificate. An associated cause of death is 34 any other condition or event that was not the underlying cause of death, but was considered to contribute to the individual’s death. In this section, data are presented on deaths of women for which ovarian cancer was the associated (but not underlying) cause of death. An annual average of 59 women who died between 2002 and 2006 had ovarian cancer recorded as an associated cause of death (Table 3.5). For most of these deaths (23 deaths or 38% of the relevant deaths), a circulatory system disease was the underlying cause of death. The second most common underlying cause of death for those deaths for which ovarian cancer was an associated cause of death was a cancer other than ovarian cancer (average of 15 deaths per year and 25% of the relevant deaths). The most common type of these ‘other’ cancers was ‘cancer of independent (primary) multiple sites’ (ICD-10 code of C97), followed by breast cancer (ICD-10 code of C50), with the corresponding average number of deaths being 4 and 2 per year, respectively. Table 3.5: Underlying cause of death where ovarian cancer was an associated cause, annual average for 2002–2006 Average annual number (a) of deaths % of deaths Underlying cause of death ICD-10 codes Circulatory system disease I00–I99 23 38.4 Cancer (other than ovarian cancer) C00–C55, C57–C97, D45–D46, D47.1, D47.3 15 24.9 Respiratory system disease J00–J99 4 7.1 Nervous system disease G00–G99 1 2.4 Endocrine, nutritional and metabolic disease E00–E89 3 4.4 Digestive system disease K00–K93 7 12.1 Mental and behavioural disorder F00–F99 1 1.3 Other all other ICD-10 codes (except for C56) 6 9.4 59 100.0 Total (a) Numbers may not sum to the total due to rounding. Source: National Mortality Database, AIHW During 2002 to 2006, the majority (75%) of women who died with ovarian cancer as an associated cause of death were aged 70 years or older at death, while 24% were 50 to 69 years and 2% were less than 50 years (Table 3.6). Table 3.6: Women who died with ovarian cancer as an associated cause by age at death, annual average for 2002–2006 (a) Per cent of deaths 1 1.7 50–69 years 14 23.7 70+ years 44 74.6 Total 59 100.0 Age at death Average annual number of deaths <50 years (a) Numbers may not sum to the total due to rounding. Source: National Mortality Database, AIHW. 35 4 Survival after a diagnosis of ovarian cancer Information on the survival of those who are diagnosed with ovarian cancer provides an indication of the effect of cancer and the success of cancer control programs and treatments. Survival estimates provide information on the probability that a person will still be alive at a specified point in time (such as 1 or 5 years) after the diagnosis of cancer. Survival is influenced by a range of factors including the characteristics of those diagnosed with cancer (e.g. age, sex, additional illnesses and lifestyle), the nature of the tumours (e.g. stage at diagnosis and histology type), and the health-care system (e.g. screening, diagnostic and treatment facilities, and follow-up services) (Black et al. 1998; WCRF & AICR 2007). Two different measures of survival from cancer can be presented, namely, crude survival and relative survival. Crude survival indicates the proportion of people alive at a specified point in time subsequent to diagnosis of cancer; it does not take into account the fact that some people diagnosed with cancer—for example, older persons—may have a relatively shorter lifespan than the rest of the population (regardless of their diagnosis of cancer) due to other illnesses. Relative survival takes this issue into account and it is thus a more meaningful measure of outcomes from cancer. Relative survival involves the comparison of the survival of people diagnosed with cancer (i.e. observed survival) with that experienced by a population of equivalent age, sex and calendar year in the general population (i.e. expected survival). The ratio of observed to expected survival is used to estimate the proportion of people who would have survived their cancer. As detailed more fully in Appendix B, relative survival can be calculated in a number of different ways; the ‘cohort method’ was used for this report. Relative survival is generally presented as a proportion, with a value less than 100% suggesting that those with ovarian cancer had a lower chance of survival than the general population. For example, 5-year relative survival of 40% for females diagnosed with ovarian cancer means that these females had a 40% chance of surviving 5 years after diagnosis relative to comparable women in the general population. Since relative survival estimates are based on the outcomes of a group of people with a diverse mix of ovarian cancer and other characteristics, they provide an indication of the average survival experience. They do not reflect an individual’s chance of surviving since this is affected by specific characteristics of the individual and the cancer they have. In this chapter, 1-year survival is shown, along with longer-term survival proportions such as 5- and 10-year survival, following a diagnosis of invasive ovarian cancer. One-year survival proportions might indicate the net short-term effectiveness of treatment and the stage at which the cancer was detected. In contrast, longer-term survival estimates might indicate: • the effectiveness of treatment • whether long-term side effects of cancer treatment are associated with additional mortality • the number of people needing ongoing monitoring rather than cancer treatment • milestones when there has been an arrest in the disease process or a slower progression. In this chapter, change over time in relative survival estimates for those diagnosed with ovarian cancer are described, as are differences by age at diagnosis and by histological type 36 of ovarian cancer. In addition, selected findings on survival by stage at diagnosis are presented from the published literature. Relative survival proportions cannot be calculated according to Indigenous status and country of birth due to data limitations and the lack of necessary life tables. However, crude survival estimates can be calculated according to Indigenous status for women in four jurisdictions and the results from these calculations are shown in this chapter. In addition, international data on survival are provided. The survival estimates shown in this chapter are based on the analysis of records of ovarian cancer cases diagnosed between 1982 and 2006 as held in the Australian Cancer Database. Data from the National Death Index on deaths (from any cause) that occurred up to 31 December 2008 were used to determine which women with ovarian cancer had died and when this occurred. Survival of those diagnosed between 2000 and 2006 For women who were diagnosed with ovarian cancer between 2000 and 2006, 1-year relative survival was 74% (Table 4.1). The corresponding 5-year relative survival estimate was considerably lower at 40%. In other words, those women who were diagnosed with ovarian cancer between 2000 and 2006 were 40% as likely as comparable women in the general population to live 5 years after diagnosis. Table 4.1: Relative survival, ovarian and breast cancer, females, 2000–2006 1-year relative survival 5-year relative survival RS (%) 95% CI RS (%) 95% CI Ovarian cancer 73.7 72.7–74.7 40.0 38.8–41.2 Breast cancer 97.4 97.2–97.5 88.3 88.0–88.6 Source: Australian Cancer Database, AIHW; AIHW & NBOCC 2009. Survival from ovarian cancer compared with other cancers To put the survival estimates for ovarian cancer into context, it is useful to compare these estimates with those of other cancers. Survival estimates for the period of 2000 to 2006 are currently available for one other type of cancer—breast cancer. As shown in Table 4.1, the prognosis for women diagnosed with breast cancer was better than that for those diagnosed with ovarian cancer for both the 1-year and the 5-year survival estimates. Specifically, the 1-year relative survival estimates were 74% for ovarian cancer and 97% for breast cancer (AIHW & NBOCC 2009). For the 5-year relative survival estimates, the estimate for breast cancer (88%) was more than double the estimate for ovarian cancer (40%). In order to compare survival from ovarian cancer with a broader range of cancers, Figure 4.1 presents 1- and 5-year relative survival estimates (as sourced from a 2008 report by AIHW, CA and AACR) for the 10 most frequently diagnosed cancers among women (excluding nonmelanoma skin cancer). The data pertain to women diagnosed with cancer between 1998 and 2004. For the 1-year relative survival estimates, the estimate for ovarian cancer (73%) is significantly lower than the estimate for all cancers combined (79%), and it ranked seventh lowest of the ten relative survival estimates shown. In regard to the 5-year relative survival estimates, the difference between the estimate for ovarian cancer (40%) and the estimate for all cancers combined is much more stark (64%), and ovarian cancer ranked eighth lowest of the ten cancers shown. These data indicate that the prognosis prospects for women 37 diagnosed with ovarian cancer are often poorer than those for women diagnosed with other frequently diagnosed cancers. The reasons for the poor survival outcomes for ovarian cancer include the relatively high proportion of diagnoses at an advanced stage (see Chapter 2) which may be affected by the non-specific nature of the symptoms of this type of cancer. Breast Bowel Melanoma of skin Lung Uterus, body Non-Hodgkin lymphoma 1-year relative survival Unknown primary site 5-year relative survival Ovary Thyroid Leukaemia All cancers 0 10 20 30 40 50 60 70 80 90 100 Relative survival (%) Notes 1. The most commonly diagnosed cancers, excluding non-melanoma skin cancer (C44), were determined using data for 2004; the cancers have been listed in order of how common they were. 2. ‘All cancers’ includes cancers coded in ICD-10 as C00–C97 (except for C44), D45, D46, D47.1 and D47.3. 3. The data for this figure are shown in Appendix Table D4.1. Source: AIHW, CA & AACR 2008; Australian Cancer Database, AIHW. Figure 4.1: Relative survival, 10 most commonly diagnosed cancers, females, 1998–2004 Differences by age at diagnosis Figure 4.2 presents 1- and 5-year relative survival estimates by age at diagnosis for women diagnosed with ovarian cancer during 2000 to 2006. For 1-year relative survival, those in the youngest age group (those less than 30 years) had the highest survival estimate (96%). However, this estimate is not significantly higher than the estimates for women aged 30 to 39 years (91%) and those aged 40 to 49 years (92%). In contrast, for all of the age groups from 50 to 59 years onwards, there is a statistically significantly decrease in the relative survival estimates from one group to the next, with those aged 80 years and over having the lowest 1-year relative survival estimate (36%). The 5-year relative survival estimates decreased steadily by age at diagnosis, with statistically significant differences observed between all of the age groups. The estimates ranged from 86% for those aged less than 30 years to 15% for those aged 80 years and over. 38 A large body of other research has also found that survival of women diagnosed with ovarian cancer at an older age is much poorer than it is for those diagnosed at a younger age; examples include studies using data from the USA (Horner et al. 2009), the United Kingdom (Cancer Research UK 2006) and Ireland (WHC & NCRI 2006). This difference by age in survival may be due to a number of different reasons, including differences in the histological type and stage at diagnosis of the tumours, a greater likelihood of co-morbidities and frailty among those diagnosed at an older age, and differences by age in treatments received and the inclusion in clinical trials (Chan et al. 2006; Maas et al. 2005; McMurdo et al. 2005; Petignat et al. 2004; South Australia Cancer Registry 2000; Tracey et al. 2009; Uyar et al. 2005; WHC & NCRI 2006). 100 90 Relative survival (%) 80 70 60 50 40 1-year relative survival 30 5-year relative survival 20 10 0 <30 30–39 40–49 50–59 60–69 70–79 80+ Age at diagnosis (years) Note: The data for this figure are shown in Appendix Table D4.2. Source: Australian Cancer Database, AIHW. Figure 4.2: Relative survival by age at diagnosis, ovarian cancer, 2000–2006 Trends Survival curves for ovarian cancer are presented in Figure 4.3 for four time periods from 1982–1987 to 2000–2006. For each of the four time periods, the relative survival estimates fell most sharply during the first five to six years following diagnosis, indicating that the relative risk of dying from ovarian cancer was highest during the initial years following diagnosis. In contrast, from about nine years following diagnosis onwards, the relative survival estimates were virtually stable. This suggests that the relative risk of dying from ovarian cancer was small for those women who survived for nine years or more following their ovarian cancer diagnosis. A question of key interest is whether or not survival has improved over the years. The data indicate that improvement is evident when the entire time period from 1982–1987 to 2000– 2006 is considered. For instance, between the first and the last of the four time periods considered, 1-year relative survival increased significantly from 63% to 74%, while 5-year relative survival increased significantly from 33% to 40% (Figure 4.3 and Appendix Table D4.3). However, much of the improvement in survival occurred during the earlier of the four time periods, rather than in the most recent ones. Specifically, no significant change in the 139 year relative survival estimates was seen between 1994–1999 and 2000–2006 (72% and 74%, respectively); likewise, there was also no significant change in the 5-year estimates between the most recent two periods (39% and 40%, respectively). Relative survival (%) 80 70 2000–2006 60 1994–1999 50 1988–1993 40 1982–1987 30 20 10 0 1 3 5 7 9 11 13 15 17 19 21 23 25 27 Year after diagnosis Note: The data for this figure are shown in Appendix Table D4.3. Source: Australian Cancer Database, AIHW. Figure 4.3: Relative survival by period of diagnosis, ovarian cancer, 1982–1987 to 2000–2006 Note that the method used to calculate the relative survival estimates shown in this chapter does not take into account differing age structures in the population over time. Since the average age of those diagnosed with ovarian cancer has increased somewhat over the years considered (see Table 2.2), the improvement over time in relative survival estimates may actually be somewhat greater than is indicated. However, determining whether this is the case is beyond the scope of this report. See Appendix B for further discussion on the age standardisation of relative survival estimates. Possible reasons for the overall improvement in survival from ovarian cancer over time include the following (AIHW, CA & AACR 2008; ACN & NBCC 2004; Tracey et al. 2009): • more accurate and effective investigation, diagnosis and staging of disease • improvements in the speed and appropriateness of referral • increasing subspecialisation in gynaecological oncology and the establishment of multidisciplinary teams • advances in the effectiveness of treatment, including surgery and chemotherapy • more widespread availability of treatment • availability of evidence-based guidelines for the management of ovarian cancer. Trends by age at diagnosis Figure 4.4 illustrates 5-year relative survival curves by age at diagnosis for 1982–1987 to 2000–2006. These data indicate that the improvements in survival over time in Australia were centred on a subset of women—those in the middle age groups. While there was some improvement over the four time periods in the relative survival estimates for the two youngest age groups (i.e. from 81% to 86% for those under 30 years of age and 66% to 71% 40 for those 30 to 39 years at diagnosis), the difference was not statistically significant. Likewise, for the oldest age group, namely those aged 80 years and over, there was no statistically significant change between any of the four time periods, with estimates of 15% in both 1982– 1987 and 2000–2006. In contrast, there was a significant increase in the 5-year relative survival estimates for women in the ‘middle’ age groups—women aged 40 to 79 years—over the periods considered. That is, the 5-year relative survival for those aged 40 to 49 years increased significantly from 45% in 1982–1987 to 61% in 2000–2006. The corresponding improvement for those aged 50 to 59 years was 36% to 50%, and for those aged 60 to 69 years, 27% to 41%. Meanwhile, although statistically significant, the improvement was not as marked for those aged 70 to 79 years, with the relative survival estimates increasing from 18% to 24% over the four time periods. 90 5-year relative survival (%) 80 70 60 50 40 2000–2006 30 1994–1999 20 1988–1993 10 1982–1987 0 <30 30–39 40–49 50–59 60–69 70–79 80+ Age at diagnosis (years) Note: The data for this figure are shown in Appendix Table D4.4. Source: Australian Cancer Database, AIHW. Figure 4.4: Five-year relative survival by age at diagnosis, ovarian cancer, 1982–1987 to 2000–2006 Survival by type of ovarian cancer Five-year relative survival by histology types are shown for the period 2000 to 2006 in Figure 4.5 and Table 4.2. These data illustrate that ovarian cancer is a heterogeneous disease with widely varying clinical outcomes, depending on the type of ovarian cancer. Women diagnosed with germ cell tumours (group 3) had the highest 5-year relative survival (91%), followed by those diagnosed with sex cord-stromal tumours (group 2) (84%). As shown in Chapter 2, younger women are more likely than older women to be diagnosed with these two types of ovarian cancers, especially germ cell tumours. (Also see Appendix Table D4.5 where 5-year relative survival is shown by age group for each of the histology groups for 1982 to 2006). Women diagnosed with an unspecified malignant neoplasm (group 5) had the lowest 5-year relative survival (13%), with this estimate significantly lower than those calculated for each of the other major histology groupings. It has been suggested that women diagnosed with 41 this ‘type’ of ovarian cancer have poor survival prospects because they usually present with advanced disease or other factors that make them unsuitable for surgical treatment (Cancer Council Victoria 2007). 1: Carcinoma (epithelial tumours) 1.1: Serous carcinoma 1.2: Mucinous carcinoma 1.3: Endometrioid carcinoma 1.4: Clear cell carcinoma 1.5: Adenocarcinoma NOS 1.6: Other specified carcinoma 1.7: Unspecified carcinoma 2: Sex cord-stromal tumours 3: Germ cell tumours 4: Other specified malignant neoplasm 5: Unspecified malignant neoplasm Total 0 20 40 60 80 100 5-year relative survival (%) Notes 1. All cases were coded as primary site, invasive ovarian cancers. 2. Appendix Table D2.5 provides a list of the histology types included in each group. 3. The data for this figure are shown in Table 4.2. Source: Australian Cancer Database, AIHW. Figure 4.5: Five-year relative survival by type of ovarian cancer, 2000–2006 The 5-year relative survival for women diagnosed with carcinoma (group 1) was estimated to be 40%. However, this overall estimate masks the variation in relative survival estimates for the different subtypes of carcinomas, with the 5-year relative survival ranging from 77% for those diagnosed with endometrioid carcinoma (group 1.3) to 14% for those diagnosed with unspecified carcinoma (group 1.7). Five-year relative survival was also very low (15%) for those diagnosed with adenocarcinoma not otherwise specified (group 1.5). A significant improvement in 5-year relative survival between 1982–1987 and 2000–2006 was found for some of the histology groups but not others (Table 4.2). Furthermore, the timing of the improvement varied. For women diagnosed with sex cord-stromal tumours (group 2), the 5-year relative survival estimates increased significantly from 62% in 1982–1987 to 84% in 1988–1993, with the estimates for the following two periods remaining in the low 80s. There was a significant increase over the four time periods in survival for those diagnosed with germ cell tumours (group 3) (80% to 91%, respectively), with the majority of change occurring between 1982–1987 and 1988–1993. Although less marked, there was also a significant increase in survival for those diagnosed with carcinoma (group 1), with these estimates increasing from 32% in the first period to 40% in the last period. 42 (a) 217 1,306 1.4: Clear cell carcinoma 1.5: Adenocarcinoma NOS 205 5: Unspecified malignant neoplasm 31.6–34.3 14.8–25.4 12.8–26.8 72.2–85.3 50.5–71.1 19.6–29.2 17.9–45.6 15.3–19.6 37.9–51.6 41.8–50.9 47.9–56.4 28.0–32.8 30.2–33.0 95% CI 5,964 193 190 188 88 347 68 1,156 307 559 673 2,195 5,305 No. of cases 36.8 14.5 27.2 89.1 83.5 20.4 26.4 17.6 51.4 59.2 53.3 32.7 35.2 RS (%) 95% CI 35.5–38.1 10.3–19.5 20.6–34.2 83.6–93.0 72.7–91.3 16.4–24.8 16.4–37.8 15.4–19.9 45.4–57.2 54.7–63.5 49.2–57.2 30.7–34.8 33.8–36.5 1988–1993 6,465 262 203 180 87 361 64 1,067 329 557 627 2,728 5,733 No. of cases Source: Australian Cancer Database, AIHW. 43 38.8 10.5 26.4 87.4 82.0 16.7 45.9 13.1 62.2 70.1 60.2 35.6 38.1 RS (%) 1994–1999 All cases were coded as primary site, invasive ovarian cancers. Appendix Table D2.5 provides a list of the histology types included in each group. 33.0 19.8 19.2 79.6 61.5 24.2 31.0 17.4 44.8 46.4 52.2 30.4 31.6 RS (%) Note: The number of cases equals the total number of diagnosed cases in the period considered. (a) 5,114 119 4: Other specified malignant neoplasm Total 155 98 317 3: Germ cell tumours 2: Sex cord-stromal tumours 1.7: Unspecified carcinoma 45 522 1.3: Endometrioid carcinoma 1.6: Other specified carcinoma 597 1,533 4,537 No. of cases 1.2: Mucinous carcinoma 1.1: Serous carcinoma 1: Carcinoma (epithelial tumours) Type of ovarian cancer 1982–1987 Table 4.2: Incidence and 5-year relative survival by type of ovarian cancer, 1982–1987 to 2000–2006 37.5–40.0 7.6–14.0 20.3–33.0 81.4–91.6 71.0–90.0 13.1–20.7 32.6–58.5 11.2–15.3 56.3–67.5 65.8–74.1 56.0–64.1 33.7–37.4 36.8–39.4 95% CI 8,215 467 293 270 77 506 178 1,167 437 679 586 3,555 7,108 No. of cases 40.0 12.7 31.4 90.8 84.4 13.9 46.4 15.2 67.5 77.2 57.4 36.7 39.5 RS (%) 2000–2006 38.8–41.2 9.9–15.9 25.6–37.4 86.1–94.2 71.6–92.8 10.9–17.3 37.8–54.6 13.0–17.5 62.3–72.2 73.2–80.9 52.8–61.8 34.9–38.6 38.2–40.8 95% CI However, improvements over time within this group of carcinomas did not apply evenly. The most sizeable change was found for those diagnosed with endometrioid carcinoma (group 1.3), with 5-year relative survival estimates increasing from 46% in 1982–1987 to 77% in 2000–2006. The increase in the 5-year relative survival estimates for clear cell carcinoma (group 1.4) was also relatively large, with the estimates increasing from 45% to 68% between the first and the last of the four periods. In contrast, there was no significant improvement in survival for those diagnosed with some of the other types of carcinomas, such as mucinous carcinoma (group 1.2) and adenocarcinoma not otherwise specified (group 1.5). Survival by stage at diagnosis Existing research has consistently shown that stage at diagnosis of ovarian cancer is closely related to survival prospects, with advanced stage associated with poorer survival (e.g. Averette et al. 1995; Chan et al. 2006; Heintz et al. 2006; Laurvick et al. 2003; South Australia Cancer Registry 2000; Yang et al. 2008). Since no national data are available on stage at diagnosis in Australia, national relative survival estimates for ovarian cancer by stage at diagnosis cannot be calculated. However, to illustrate the trends, data from NSW and from the USA in which ovarian cancer was defined in the same way as in this report (i.e. ICD-10 code of C56) are shown. For information on the various staging systems used to classify ovarian cancers, see Appendix E. As noted in Chapter 2, data on stage at diagnosis for ovarian cancer, based on the SEER summary stage system, are available for NSW (Tracey et al. 2009). According to those data, 5-year relative survival estimates for tumours that were diagnosed at the localised stage between 1980 and 2003 was 78% (Table 4.3). In contrast, the corresponding estimates for regional and distant tumours were significantly lower, at 34% and 18% respectively. Table 4.3: Five-year relative survival by stage at diagnosis, ovarian cancer, New South Wales, 1980–2003 (b) Per cent of staged cases Relative (c) survival (%) 95% confidence interval Localised 1,763 25.4 78.0 76.0–80.0 Regional 1,522 21.9 34.3 31.8–36.8 Distant 3,649 52.6 17.5 16.1–18.9 n.a. .. n.a. n.a. 6,934 100.0 36.7 35.7–37.7 Stage at (a) diagnosis Unknown Total (a) Number of cases Based on the SEER summary stage system. ‘Localised’ tumours were confined to one or both ovaries, ‘regional’ tumours had spread to surrounding tissue or nearby lymph nodes and ‘distant’ tumours had spread to distant organs or other parts of the body and had begun to grow at the new location (see Appendix E). (b) Includes ovarian cancers coded in ICD-10 as C56; borderline ovarian tumours are not included. (c) The cause-specific method of calculating survival was used. Source: Tracey et al. 2009. Data for 1999 to 2005 from the USA are shown in Table 4.4. As was seen with the NSW data, there is a clear gradient in the survival estimates in the USA data according to stage at diagnosis with a 5-year relative survival estimate of 94% for those diagnosed with localised tumours and an estimate of 28% for those diagnosed with distant tumours (Table 4.4). In addition, the USA data provide an estimate of survival for those with an unknown tumour stage at diagnosis; according to these data, the 5-year relative survival for this group was 27%, which is similar to the estimate for those who were diagnosed with a distant tumour. 44 Table 4.4: Five-year relative survival by stage at diagnosis and age group, ovarian cancer, United States of America, 1999–2005 Stage at (a) diagnosis <65 years (b) % of cases 65+ years (c) RS (%) (b) % of cases All ages (c) RS (%) % of cases (b) (c) RS (%) Localised 21 93.9 7 93.5 15 93.8 Regional 20 79.7 13 56.7 17 72.8 Distant 55 34.9 69 20.0 62 28.2 4 48.9 10 13.0 7 27.3 100 56.5 100 29.8 100 45.9 Unknown Total (a) Based on the SEER summary stage system. ‘Localised’ tumours were confined to one or both ovaries, ‘regional’ tumours had spread to surrounding tissue or nearby lymph nodes and ‘distant’ tumours had spread to distant organs or other parts of the body and had begun to grow at the new location (see Appendix E). (b) The numbers of cases were as follows: 16,000 cases of women less than 65 years old; 13,168 cases of women 65 years and over; and a total of 29,168 cases. (c) The cohort method of calculating relative survival was used. Note: Data are from the SEER 17 areas which cover approximately a quarter of the USA (see Table 21.7 in Horner et al. 2009). Source: Horner et al. 2009. The USA data also provide information on differences by age group in survival by stage at diagnosis. Overall, the survival prospects of women aged less than 65 years were much better than for older women (those aged 65 years and over), with 5-year relative survival estimates of 57% and 30%, respectively. This differential by age applied for all of the stages at diagnosis, with one exception. This exception pertains to women diagnosed with localised tumour—for women diagnosed with these ‘early-stage’ tumours, regardless of the age group, 5-year relative survival was 94%. In contrast, for example, for distant tumours, 5-year relative survival was 35% for those aged less than 65 years at diagnosis, while it was 20% for those aged 65 years and over at diagnosis. The differential by age was particularly marked for those diagnosed with an unknown stage at diagnosis—the 5-year relative survival estimate for those aged less than 65 years was 49% compared with 13% for those aged 65 years and over. Differences by Aboriginal and Torres Strait Islander status Relative survival estimates cannot be calculated for Indigenous women because of data issues and the lack of necessary life tables. However, 5-year crude survival estimates can be derived based on data from Queensland, Western Australia, South Australia and the Northern Territory. As discussed earlier in this chapter, crude survival estimates do not take into account the cause of death, nor do they compare observed survival with expected survival. Past research has shown that the life expectancy of Indigenous women is shorter than that of non-Indigenous women (ABS 2004, 2009e). At the same time, the mean age at which women were diagnosed with ovarian cancer differs by Indigenous status, with the Indigenous women being younger at diagnosis (mean of 53 years) than the non-Indigenous women (63 years) (Table 4.5). It is not known how these underlying differences may have affected the crude survival estimates presented. Given the small number of ovarian cancer cases reported among Indigenous women, a 10-year time period from 1997 to 2006 is considered in these analyses. Despite this, the 45 number of cases of ovarian cancer among Indigenous women was still relatively small (68 cases) and this should be considered when making use of these data. The crude 5-year survival estimate for ovarian cancer for Indigenous women was somewhat lower than for non-Indigenous women—35% and 38%, respectively—in the four jurisdictions; however, this difference was not statistically significant. Table 4.5: Five-year crude survival by Indigenous status, ovarian cancer, Queensland, Western Australia, South Australia & Northern Territory, 1997–2006 Indigenous Non-Indigenous (a) 68 3,891 Crude survival (%) 35.1 38.1 23.1–47.4 36.5–39.8 53.2 63.2 Number of cases 95% confidence interval Mean age at diagnosis (a) Equals the total number of diagnosed cases in the period considered. Source: Australian Cancer Database, AIHW. International comparisons In addition to the methodological challenges associated with comparing cancer statistics from different countries (as discussed in Chapter 1), additional uncertainties arise when comparing relative survival estimates. In particular, there tends to be wide variation across countries in: the years to which the relative survival estimates apply; the length of the follow-up period considered (e.g. 1-, 5-, 10-year and so forth); and the methods and age groups used to calculate the relative survival estimates. For these reasons, relative survival estimates for different countries are not compared in this report. Although more rudimentary than relative survival estimates, the mortality-to-incidence ratio (MIR) is used in this report to make international comparisons. This ratio describes how many deaths there were in a particular year due to a particular disease, relative to the number of new cases diagnosed that year (using age-standardised data). For example, an MIR of 0.60 for ovarian cancer would indicate that there were 60 deaths for every 100 new cases of ovarian cancer diagnosed in that year (though the deaths need not relate to the same people as the cases). If survival tends to be lower in a particular country relative to others, then the MIR for that country generally would be expected to be higher (i.e. closer to 1.00). In contrast, if survival is higher, the ratio generally would be closer to zero. Appendix B provides further information about interpreting MIRs. For this report, mortality-to-incidence ovarian cancer ratios were calculated using data from GLOBOCAN (Ferlay et al. 2004). The fact that the GLOBOCAN data were estimates for 2002 should be taken into account when interpreting the results shown in Figure 4.6. Note also that these data pertain to ‘ovarian and related cancers’ (i.e. the ICD-10 codes of C56 and C57.0–C57.4) rather than just ‘ovarian cancer’ (ICD-10 code of C56). The GLOBOCAN data suggest that the MIRs for ovarian and related cancers varied markedly between different countries and regions, with survival from ovarian and related cancers poorest among women in South-Central Asia (MIR of 0.72), and best for women in Southern Europe (MIR of 0.46). The MIR for women in Australia was relatively low (0.55). This suggests that, in 2002, Australian women who were diagnosed with ovarian and related cancers had better survival prospects than their counterparts in many other countries and regions. 46 South-Central Asia Eastern Africa Middle Africa Western Africa Northern Africa Western Asia Southern Africa World Caribbean Northern Europe Melanesia Central and Eastern Europe Micronesia Polynesia Northern America South-Eastern Asia Western Europe Australia New Zealand Central America Eastern Asia South America Southern Europe 0 0.1 0.2 0.3 0.4 0.5 0.6 0.7 0.8 Mortality-to-incidence ratio Notes 1. The ratios are based on estimated incidence and mortality data for 2002; those estimates were based on data from approximately 3 to 5 years earlier. 2. The mortality-to-incidence ratio equals the age-standardised mortality rate divided by the age-standardised incidence rate. 3. The data pertain to cancers coded in ICD-10 as C56 and C57.0–C57.4 (see Appendix B for further details). 4. The data for this figure are shown in Appendix Table D4.6. Source: Ferlay et al. 2004. Figure 4.6: International comparison of mortality-to-incidence ratios for ovarian and related cancers, 2002 47 5 Prevalence of ovarian cancer Prevalence, or complete prevalence as it is sometimes called, is the number of people alive at a specified point in time who have ever been diagnosed with ovarian cancer regardless of how long ago. These people may or may not be undergoing treatment or be considered ‘cured’. In contrast, ‘limited-duration prevalence’ provides information on the number of people alive who were diagnosed with ovarian cancer within a specified time period, such as the previous 1 or 5 years. One-year prevalence data, for example, would indicate the number of people alive on 31 December of a particular year who were diagnosed with ovarian cancer during that same year, while 5-year prevalence data would indicate the number of people alive on 31 December of a specified year who were diagnosed with ovarian cancer within the previous five years. The prevalence of a disease in a given population is influenced by the incidence of the disease, survival from the disease and the age at which people are diagnosed (i.e. older people are more likely to die sooner due to age-related morbidity and frailty). Along with information on incidence, mortality and survival, prevalence is another indicator of the impact of ovarian cancer in our society both at the personal/familial level and societal level, particularly in terms of health care services. While the exact nature of health care needs can vary widely from one person to the next over the years following diagnosis, overall, different types and intensities of health care services may be required by those who were diagnosed with ovarian cancer recently (e.g. in the past year) compared with those diagnosed many years previously. In Australia, as elsewhere, complete prevalence data are not available through cancer registry data collections since these collections do not hold data for a long-enough period. The only source of complete prevalence data in Australia is surveys, such as the National Health Survey, where prevalence estimates are based on self-reported information of a sample of Australians (ABS 2009c). However, since the National Health Survey excludes people in hospitals, hospices, and nursing and convalescent homes, those data are incomplete. An additional deficiency of those data may be the erroneous self reporting of benign or borderline ovarian tumours as invasive ovarian cancer. In this report, limited-duration prevalence is presented using data from the Australian Cancer Database, with information on deaths (from any cause) sourced from the National Death Index. Since national incidence data on ovarian cancer are available from 1982 onwards, limited-duration prevalence data can be presented for a maximum of 25 years (from 1 January 1982 to 31 December 2006). In addition, information is provided in this chapter on differences in prevalence by age, geographical area and country of birth. In this chapter, no international comparisons are made. Making such comparisons is difficult since prevalence data from other countries often differ from Australian data in the years to which they apply, the number of years considered (e.g. 5, 10, 25 years) and the analytical methods employed to calculate prevalence. Unlike the incidence data, which pertain to the number of cases of ovarian cancer, the prevalence data presented in this report pertain to the number of females who have been diagnosed with ovarian cancer and are still alive. However, as mentioned in Chapter 2, since it is rare that any one woman would be diagnosed with more than one primary ovarian cancer during a 1-year period, the number of new cases of ovarian cancer in a particular year would be very similar to the number of females diagnosed with ovarian cancer in that year. 48 Prevalence in 2006 Of all females alive at the end of 2006, over 8,200 had been diagnosed with ovarian cancer in the previous 25 years (Table 5.1). This equates to 8 out of 10,000 females. At the same time, the 20-year prevalence for ovarian cancer was 7,500 women, the 10-year prevalence was 5,179 women and the 1-year prevalence was 1,016 women. The 1-year prevalence compares with an incidence of 1,226 cases for 2006 (Table 2.1). Note that those women who were both diagnosed with ovarian cancer and died in 2006 (approximately 210 women) may or may not have died as a result of ovarian cancer. Table 5.1: Limited-duration prevalence of ovarian cancer, end of 2006 Time period Number (a) (b) Per 10,000 population 1-year prevalence 1,016 1.0 5-year prevalence 3,445 3.3 10-year prevalence 5,179 4.9 15-year prevalence 6,506 6.2 20-year prevalence 7,500 7.1 25-year prevalence 8,216 7.8 (a) Refers to the number of females, not cases. (b) Based on the number of females in the Australian population at 31 December 2006. Source: Australian Cancer Database, AIHW. In order to compare prevalence across commonly diagnosed cancers in females, Table 5.2 presents data from the AIHW’s 2008 publication on cancer survival and prevalence (AIHW, CA & AACR 2008). Those data pertain to the prevalence at the end of 2004 and thus 23 years of cancer incidence data were available. Table 5.2: Limited-duration prevalence of the 10 most commonly diagnosed cancers(a), females, end of 2004 1-year prevalence 5-year prevalence 10-year prevalence 23-year prevalence 11,764 53,051 89,777 129,438 Bowel (C18–C20) 4,969 18,940 29,929 43,286 Melanoma of skin (C43) 4,151 18,697 33,303 56,235 Lung (C33–C34) 1,978 4,413 5,657 6,817 Uterus, body (C54) 1,630 6,665 11,244 17,720 Non-Hodgkin lymphoma (C82–C85, C96) 1,423 5,632 8,837 11,845 632 1,511 1,943 2,690 Ovary (C56) 1,024 3,288 4,997 7,637 Thyroid (C73) 1,092 4,502 7,529 11,248 777 3,007 4,663 6,513 36,331 141,553 230,245 338,692 Cancer type (ICD-10 codes) Breast (C50) Unknown primary site (C26, C39, C76, C80) Leukaemia (C91–C95) All cancers (b) (a) Determined by the most commonly diagnosed cancers in 2004 and ordered accordingly; excludes non-melanoma skin cancer (C44). (b) Includes cancers coded in ICD-10 as C00–C97 (except for C44), D45, D46, D47.1 and D47.3. Note: Data refer to the number of females, not cases. Source: AIHW, CA & AACR 2008. 49 When 23-year prevalence is considered, ovarian cancer was the seventh most prevalent type of cancer in women (excluding non-melanoma skin cancer) among the ten most commonly reported cancers. It was also the second most prevalent type of gynaecological cancer (after ‘uterus, body’ cancer). Of all females alive at the end of 2004, over 7,600 females had been diagnosed with ovarian cancer in the previous 23 years. In comparison, the 23-year prevalence for breast cancer was 129,438 women and for ‘uterus, body’ cancer, it was 17,720 women. For each of the other three prevalence durations considered, ovarian cancer was the eighth most prevalent type of cancer among women (excluding non-melanoma skin cancer). Differences by age Table 5.3 presents 25-year prevalence of ovarian cancer by age group. At the end of 2006, there were 2,051 women in the 60 to 69 year age group still alive who had been diagnosed with ovarian cancer in the previous 25 years, while there were a further 1,841 women aged 50 to 59 years who had been diagnosed with this type of cancer. When the number of females diagnosed with ovarian cancer is compared with the number in the respective age group, the data indicate that the highest proportion exists among those aged 70 to 79 years, with a prevalence of 26 per 10,000 females. Table 5.3: Twenty-five-year prevalence of ovarian cancer by age group, end of 2006 Age group (years) Number (a) (b) Per 10,000 population 0–19 56 0.2 20–29 172 1.2 30–39 474 3.1 40–49 937 6.1 50–59 1,841 13.9 60–69 2,051 22.4 70–79 1,634 25.9 80+ 1,051 22.6 Total 8,216 7.8 (a) Refers to the number of females, not cases. (b) Based on the number of females in the Australian population at 31 December 2006. Source: Australian Cancer Database, AIHW. Differences across groups As noted earlier in this chapter, the prevalence of ovarian cancer is influenced by the incidence of the disease, survival rates and the average age at diagnosis. Since these factors can differ across sub-groups, prevalence may also differ. In this section of the report, prevalence data by state and territory, and by country of birth are presented. Differences by geographical area Table 5.4 presents prevalence data for the end of 2006 according to the state and territory in which the woman lived at the time of diagnosis. Since it is unknown whether the women lived in the same state and territory in 2006 as they did at the time of diagnosis, these data should be used with caution. During 1982 to 2006, just over 2,700 women had been diagnosed with ovarian cancer in New South Wales and were still alive at the end of 2006. 50 This compares with 25-year prevalence for ovarian cancer of 2,127 women for Victoria and 1,638 women for Queensland. Table 5.4: Limited-duration prevalence of ovarian cancer by state and territory of diagnosis, end of 2006 State or territory 1-year prevalence 5-year prevalence 10-year prevalence 25-year prevalence New South Wales 315 1,154 1,731 2,707 Victoria 276 881 1,330 2,127 Queensland 196 636 1,009 1,638 Western Australia 114 382 507 759 South Australia 69 238 366 603 Tasmania 26 69 119 203 Australian Capital Territory 16 59 85 132 4 26 32 47 1,016 3,445 5,179 8,216 Northern Territory Total Note: Data refer to the number of females, not cases. Source: Australian Cancer Database, AIHW. Differences by country of birth The prevalence of ovarian cancer according to country or region of birth is shown in Table 5.5. The 25-year prevalence, as a proportion of the respective female population, was highest among women born in the European regions (13 per 10,000 females for both North-West Europe, and Southern and Eastern Europe). This compares with a figure of 6 per 10,000 for those born in Australia. The data also indicate that there was a relatively low proportion of females alive who had been diagnosed with ovarian cancer in the 25-year period among women born in North-East Asia and Sub-Sahara Africa (both 5 per 10,000 females). 51 (a) 14 24 38 North Africa and the Middle East Oceania and Antarctica, excl. Australia South-East Asia 5,179 4.9 .. 3.7 4.3 4.5 4.0 4.7 4.5 4.8 6.3 8.1 (b) 8,216 713 128 57 91 5,029 240 194 98 102 566 998 Number Source: Australian Cancer Database, AIHW. 52 7.8 .. 5.0 5.2 6.3 6.4 6.7 6.9 7.1 9.5 13.4 13.4 Per 10,000 (c) population Refers to the number of females, not cases. 3.3 414 96 47 65 3,155 170 128 67 68 345 8.4 Per 10,000 (c) population Based on the number of females in the Australian population born in each country/region as at 30 June 2006, except for the ‘Total’ which is based on the number of females in the Australian population at 31 December 2006. 3,445 .. 2.4 2.9 3.0 2.7 3.2 3.2 3.7 4.7 5.3 (b) 624 Number (c) 1.0 259 61 32 43 2,102 114 89 52 50 225 5.6 Per 10,000 (c) population 25-year (b) 1,016 .. 0.8 0.5 1.3 (b) 418 Number 10-year Classified according to the Standard Australian Classification of Countries, second edition (see Appendix A). Countries/regions of birth are ordered in descending order according to the 25-year prevalence proportions. Total 106 21 6 18 0.8 1.1 0.9 1.0 1.7 1.6 1.3 Per 10,000 (c) population 5-year (a) (b) Not stated North-East Asia Sub-Saharan Africa Southern and Central Asia 603 18 Americas Australia 69 Southern and Eastern Europe (b) 99 Number North-West Europe Country/region of birth 1-year Table 5.5: Limited-duration prevalence of ovarian cancer by country/region of birth, end of 2006 6 Burden of disease due to ovarian cancer The effect of ovarian cancer on the health of the population can be summarised by using a number of different measures that combine information on both fatal and non-fatal health outcomes into a single number. Such measures can be used for a range of purposes including: • comparing the burden associated with different diseases • comparing the effect of a particular disease on different population groups or over time • setting priorities for health planning, public health programs, as well as research and development (Murray et al. 1999). Of the available summary measures, one of the most commonly used is the ‘disabilityadjusted life year’ (DALY), also commonly referred to as ‘burden of disease’. The DALY combines information on the extent of: • premature death—which is measured by the years of life lost (YLL) due to disease or injury and • non-fatal health outcomes—which is measured by years of ‘healthy’ life lost (YLD) due to disease, disability or injury. In order to combine these two health measures into a summary measure, the DALY uses time as a common ‘currency’. Hence, the DALY is a measure of the years of life lost due to premature death (YLL) and years of healthy life lost due to disease, disability or injury (YLD), or a combination of the two. The more DALYs associated with a particular disease, the greater the burden. Further information about DALYs can be found in the AIHW report on the burden of disease and injury (Begg et al. 2007a). In the report by Begg and associates, ovarian cancer was defined to include the ICD-10 codes of ‘C56 and C57.0–C57.4’, which we refer to as ‘ovarian and related cancers’ in this report. In this chapter, the burden of disease in Australia due to ovarian and related cancers is presented along with comparisons with other diseases that are also major contributors to the overall burden. The most recent burden of disease estimates for Australia are for 2003. These estimates, and the method by which they were derived, are detailed in an AIHW report by Begg and associates (2007a,b). Burden of disease in 2003 The total burden of disease for females in Australia in 2003 was estimated to be more than 1.2 million DALYs and the burden due to cancer was 235,034 DALYs, which is 19% of the total burden. Table 6.1 presents the leading causes of disease burden for females, along with the five leading causes of cancer burden. Ovarian and related cancers ranked 25th in terms of the leading causes of burden of disease for women, and accounted for 1% of all female burden of disease. In terms of leading causes of burden due to cancer, ovarian and related cancers ranked fourth, with nearly 12,000 DALYs attributed to this disease. Ovarian and related cancers accounted for 5% of the female burden of disease due to all cancers and was the leading cause of burden from all gynaecological cancers. 53 Table 6.1: Leading causes of burden of disease, including leading cancers, females, 2003 Disabilityadjusted life years (DALYs) Per cent of total DALYs Rank Cause ICD-10 codes Anxiety and depression F30, 32–39, 40.0, 40.1, 41.0– 41.2, 42, 43.1, 93.0 126,464 10.0 1 Ischaemic heart disease I20–25 112,390 8.9 2 Stroke G45; I60–69 65,166 5.1 3 Type 2 diabetes E11–13 61,763 4.9 4 Dementia F00–01, 02.0–02.1, 02.3, 03; G30, 31.0–31.1, 31.8–31.9 60,747 4.8 5 235,034 18.5 .. Cancer C00–96 Breast cancer C50 60,520 4.8 6 Lung cancer C33–34 33,876 2.7 8 Bowel cancer C18–21 28,962 2.3 10 Ovarian and related cancers C56, 57.0–57.4 11,994 0.9 25 Pancreas cancer C25 11,246 0.9 27 Other cancers All other ‘C’ codes 88,436 7.0 .. Chronic obstructive pulmonary disease I27.0, 27.8–27.9; J40–44 37,550 3.0 7 Asthma J45–46 33,828 2.7 9 1,268,156 100.0 .. Total for all causes Source: Begg et al. 2007a. Table 6.2 and Figure 6.1 show the extent of the cancer burden associated with the leading causes of cancer burden for females which were due to both premature death (YLL) and disease, disability or injury (YLD). For cancer, causes of years of healthy life lost to disability include side effects during and after treatment (e.g. during and after radiotherapy or chemotherapy) and the psychosocial affects of having gone through treatment. Due to the relatively poor prognosis from many cancers compared with the majority of other diseases, most cancers contribute more years of life lost (YLL) than years of healthy life lost to disability (YLD). This is the case for ovarian and related cancers. In 2003, this disease resulted in 10,946 years of life lost due to premature mortality, which equates to 91% of the total estimated DALYs for this disease. This compares with an average of 82% for all cancers combined. While ovarian and related cancers ranked 25th in terms of the causes of burden of disease for females when DALYs were considered, it ranked 11th in terms of the leading causes of mortality burden, and 75th in terms of causes of disability burden. Considering just the burden due to cancers, ovarian and related cancers accounted for 6% of all years of life lost from cancer and 2% of years lost due to disability. 54 48,548 11,751 16,009 Stroke Type 2 diabetes Dementia 23,735 10,946 10,984 74,498 21,025 Bowel cancer Ovarian and related cancers Pancreas cancer Other cancers Chronic obstructive pulmonary disease Source: Begg et al. 2007a. Total for all causes 569,181 2,423 31,551 Lung cancer Asthma 40,080 Breast cancer 191,794 89,152 Ischaemic heart disease Cancer 221 Anxiety and depression Cause Years of life lost (YLL) 100.0 0.4 3.7 13.1 1.9 1.9 4.2 5.5 7.0 33.7 2.8 2.1 8.5 15.7 0.0 Per cent of total YLL Fatal component .. 44 6 .. 10 11 5 4 3 .. 7 9 2 1 98 Rank 55 698,975 31,405 16,525 13,938 262 1,048 5,227 2,325 20,440 43,240 44,738 50,012 16,619 23,238 126,244 Years of healthy life lost (YLD) 100.0 4.5 2.4 2.0 0.0 0.1 0.7 0.3 2.9 6.2 6.4 7.2 2.4 3.3 18.1 Per cent of total YLD Non-fatal component .. 4 10 .. 120 75 31 51 7 .. 3 2 9 5 1 Rank 1,268,156 33,828 37,550 88,436 11,246 11,994 28,962 33,876 60,520 235,034 60,747 61,763 65,166 112,390 126,464 Disability-adjusted life years (DALYs) Total 44.9 7.2 56.0 84.2 97.7 91.3 82.0 93.1 55.1 92.8 44.0 15.8 2.3 8.7 18.0 6.9 33.8 18.4 81.6 66.2 73.6 81.0 25.5 20.7 99.8 % of DALYs due to YLD 26.4 19.0 74.5 79.3 0.2 % of DALYs due to YLL Table 6.2: Leading causes of burden of disease, including leading cancers, by fatal (YLL) and non-fatal (YLD) components, females, 2003 Anxiety and depression Ischaemic heart disease Stroke Type 2 diabetes Dementia Breast cancer Chronic obstructive pulmonary disease Lung cancer Asthma Years of life lost (YLL) Bowel cancer Years of healthy life lost (YLD) Ovarian and related cancers Pancreas 0 20 40 60 80 100 120 140 Disability-adjusted life years (DALYs) ('000) Note: The data for this figure are shown in Table 6.2. Source: Begg et al. 2007a. Figure 6.1: Leading causes of burden of disease, including leading cancers, by fatal and non-fatal components, females, 2003 Differences by age The leading causes of cancer burden for women by age are shown in Figure 6.2. In 2003, the distribution of the burden of ovarian and related cancers was flatter than that of a number of the other types of cancer shown, such as breast cancer and lung cancer. Disability-adjusted life years (DALYs) 10,000 9,000 Breast cancer 8,000 Lung cancer 7,000 Colorectal cancer 6,000 4,000 Ovarian and related cancers 3,000 Pancreas cancer 5,000 2,000 1,000 Age group (years) Note: The data for this figure are shown in Appendix Table D6.1. Source: Begg et al. 2007b. Figure 6.2: Leading cancer causes of burden of disease by age group, females, 2003 56 100+ 95–99 90–94 85–89 80–84 75–79 70–74 65–69 60–64 55–59 50–54 45–49 40–44 35–39 30–34 25–29 20–24 15–19 10–14 5–9 1–4 <1 0 The proportion of all DALYs from cancer that were due to ovarian and related cancers varied according to the age group considered, with the highest proportion found for those aged 15 to 19 years and those aged 20 to 24 years (9% and 8% of DALYs from cancer were due to ovarian and related cancers, respectively) (Appendix Table D6.1). Trends and projections Table 6.3 presents information on the burden of disease from ovarian and related cancers for 1993 and 2003, as well as the projected burden for 2013 and 2023. In 1993, the agestandardised burden of ovarian and related cancers was 123 DALYs per 100,000 females; it had decreased to 120 DALYs per 100,000 females by 2003. Projected trends to the year 2023 suggest that the age-standardised burden of ovarian and related cancers will decrease somewhat over time to 116 DALYs per 100,000 females in 2023. This indicates an overall estimated decrease of 3% from 2003 to 2023. In contrast, the total number of DALYs due to ovarian and related cancers is expected to continue to increase over the years from 11,994 in 2003 to 14,225 in 2023. This projected increase in the number of DALYs is due to a population that is both ageing and growing in size. Table 6.3: Trends and projected burden of ovarian and related cancers, 1993 to 2023 Year Disability adjusted life years (DALYs) Age-standardised rate 1993 10,918 123.1 2003 11,994 119.8 2013 (a) 13,331 119.2 2023 (a) 14,225 115.6 (a) See Begg et al. 2007a for information on how the projections were derived. Source: AIHW unpublished data. 57 7 Hospitalisations for ovarian cancer Women with ovarian cancer may require hospitalisation as an admitted patient for a variety of reasons including diagnostic procedures and treatments (e.g. surgery, chemotherapy and the management of associated conditions). The number of such hospitalisations for ovarian cancer in any one year is related to a range of factors, including the number of women with ovarian cancer and the number of these requiring health services as an admitted patient in a hospital. Other factors include the availability of alternative health-care services, relative accessibility of hospital care, admission criteria and administrative policies. In this chapter, details are provided on the number and characteristics of admitted patient hospitalisations that are related to the care and/or treatment of persons with invasive ovarian cancer, with the term ‘hospitalisations’ used interchangeably with ‘separations’. Due to the method in which the principal diagnosis for hospitalisations of cancer patients is coded (particularly in relation to same-day chemotherapy treatments), identifying those hospitalisations that are due specifically to ovarian cancer is not straightforward. As discussed in more detail in Appendix F, ‘ovarian cancer–related hospitalisations’ are defined in this report as those admitted patient hospitalisations in which: • the principal diagnosis was ovarian cancer (i.e. ICD-10-AM code of C56) or • ovarian cancer (i.e. ICD-10-AM code of C56) was recorded as an additional diagnosis and the principal diagnosis code related specifically to the treatment or care of a cancer patient. The data source for this chapter was the National Hospital Morbidity Database (NHMD) which contains data on admitted patient separations. The most recent data available pertain to the 2007–08 financial year. Note that the data from the NHMD refer to hospitalisations and not individuals. Any one person may have multiple hospitalisations during the course of a year but data on the number of people hospitalised for a particular disease are not available. Further information about this data source can be found in Appendix C. Over the course of the past decade, a number of hospitals (mainly in the public sector) in New South Wales, South Australia and the Australian Capital Territory changed their admissions practices so that not all patients who receive same-day chemotherapy services are admitted to hospital. Instead, these hospitals provide chemotherapy treatment on an outpatient (i.e. non-admitted patient) basis. This change in process, which is discussed in more detail in Appendix F, must be taken into account when examining change over time in the number of hospitalisations due to ovarian cancer. Because the change applies largely to same-day hospitalisations (and not to overnight ones), separate information is provided in this chapter on the number and rate of same-day and overnight hospitalisations. Ideally, data on the number of chemotherapy services provided to ovarian cancer patients on an outpatient basis would be included in this chapter, but such data are not available. In this chapter, rates of hospitalisations are presented per 1,000 females. Hospitalisations in 2007–08 In the 2007–08 financial year, there were 14,277 hospitalisations due to ovarian cancer (Table 7.1); these accounted for 0.3% of all hospitalisations of women. The age-standardised rate of ovarian cancer–related hospitalisations was 1.2 (per 1,000 females). 58 Table 7.1: Hospitalisations for ovarian cancer and all reasons, females, 2007–08 Number Per cent of all hospitalisations Age-standardised (a) rate 95% confidence interval 14,277 0.3 1.2 1.20–1.24 4,149,381 100.0 370.0 369.60–370.31 Ovarian cancer All hospitalisations (a) The age-standardised rates were standardised to the Australian population as at 30 June 2001 and are expressed per 1,000 females. Source: National Hospital Morbidity Database, AIHW. Of the total number of hospitalisations for ovarian cancer, nearly eight out of ten (79%) were same-day hospitalisations (11,296), while the remainder (21%) were overnight hospitalisations (2,981). Differences by age Of all hospitalisations for ovarian cancer-related care in 2007–08, over half (61%) were of women aged 60 years and over, 34% were for those aged 40 to 59 years, while 5% were for those under the age of 40 years (Appendix Table D7.1). Differences in the hospitalisation rate for ovarian cancer–related care according to age are shown in Figure 7.1. The rate of hospitalisation was less than 1 (per 1,000 females) for those under the age of 45 years, but rose to a high of 5 (per 1,000 females) for those aged 65 to 69 years and for those aged 70 to 74 years. Hospitalisations per 1,000 females 6 5 4 3 2 1 85+ 80–84 75–79 70–74 65–69 60–64 55–59 50–54 45–49 40–44 35–39 30–34 25–29 20–24 <20 0 Age group (years) Note: The rates shown are age-specific rates. The data for this figure are shown in Appendix Table D7.1. Source: National Hospital Morbidity Database, AIHW. Figure 7.1: Hospitalisations for ovarian cancer by age group, 2007–08 Average length of stay Data on the total number of days that patients stayed in hospital are collected in the NHMD, with a length of stay of 1 day allocated to all same-day hospitalisations. By using those data, as well as information on the number of hospitalisations, the average length of stay (ALOS) 59 can be derived. In 2007–08, the average length of stay for ovarian cancer–related hospitalisations was 2.4 days (Table 7.2). When only those hospitalisations that included an overnight stay are considered, the average length of stay was 7.6 days. Considering only those hospitalisations that involved an overnight stay, the average length of stay increased by age. For those aged less than 30 years, the average length of an overnight stay was 5.3 days, compared with 11.7 days for those aged 80 years and over. Table 7.2: Average length of stay (ALOS) for ovarian cancer–related hospitalisations by age group, 2007–08 Age group (years) ALOS of overnight hospitalisations (days) (a) Total ALOS (days) <30 5.3 2.3 30–39 6.8 2.3 40–49 6.6 2.3 50–59 6.3 2.0 60–69 7.3 2.1 70–79 8.3 2.6 11.7 4.1 7.6 2.4 80+ Total (a) Includes both overnight and same-day hospitalisations (with the latter, by definition, equal to1 day per hospitalisation). Source: National Hospital Morbidity Database, AIHW. Trends The total number of hospitalisations for ovarian cancer increased by 35% between 1999–00 (10,604 hospitalisations) and 2007–08 (14,277 hospitalisations) (Table 7.3). While there was an overall decrease of 6% in the number of overnight hospitalisations over the period considered, the majority of change pertained to the number of same-day hospitalisations which increased by 52%. This is despite the fact that, as noted earlier, changes occurred in hospital admission procedures during the period considered such that by 2007–08, some Table 7.3: Hospitalisations for ovarian cancer by same-day and overnight status, 1999–00 to 2007–08 Number of same-day hospitalisations Number of overnight hospitalisations Total number of hospitalisations 1999–00 7,434 3,170 10,604 2000–01 7,913 3,063 10,976 2001–02 9,095 2,978 12,073 2002–03 8,794 2,646 11,440 2003–04 9,407 2,710 12,117 2004–05 9,955 2,631 12,586 2005–06 10,317 2,942 13,259 2006–07 10,940 3,132 14,072 2007–08 11,296 2,981 14,277 Year Source: National Hospital Morbidity Database, AIHW. 60 Cancer patients in three jurisdictions who received same-day chemotherapy were not classified as admitted patients and thus not included in the data (whereas in earlier years, they would have been included). In Figure 7.2, trends in the age-standardised rate of ovarian cancer–related hospitalisations are shown. For all ovarian cancer–related hospitalisations, the rate increased slightly, but significantly, from 1.1 hospitalisations per 1,000 females in 1999–00 to 1.2 hospitalisations per 1,000 females in 2007–08. As shown, the overall increase over time was driven by changes in the number of same-day hospitalisations, while the rate of overnight hospitalisations decreased slightly but significantly between 1999–00 and 2007–08 (from 0.32 to 0.25 hospitalisations per 1,000 females, respectively). 1.4 Total hospitalisations Hospitalisations per 1,000 females 1.2 1.0 Same-day hospitalisations 0.8 0.6 0.4 Overnight hospitalisations 0.2 0.0 1999–00 2000–01 2001–02 2002–03 2003–04 2004–05 2005–06 2006–07 2007–08 Notes 1. The rates were age-standardised to the Australian population as at 30 June 2001 and are expressed per 1,000 females. 2. The data for this figure are shown in Appendix Table D7.2. Source: National Hospital Morbidity Database, AIHW. Figure 7.2: Hospitalisations for ovarian cancer by same-day and overnight status, 1999–00 to 2007–08 Trends in the rate of hospitalisations for ovarian cancer by age group are shown in Figure 7.3. For the age group of those less than 50 years, the rates remained unchanged at 0.3 per 1,000 females over the period considered. For the other two age groups, the rates fluctuated somewhat over the years, but the general direction was one of an increase. Specifically, between 1999–00 and 2007–08, there was a 13% increase in the number of hospitalisations for ovarian cancer for those aged 50 to 69 years, and a corresponding increase of 22% increase for those aged 70 years and over. Trends in average length of stay Trends in the average length of stay of women who were hospitalised for ovarian cancer in 2007–08 are shown in Figure 7.4. For those hospitalisations that involved an overnight stay, the average length of stay for ovarian cancer–related hospitalisations was 7.3 days in 1999–00; it increased to 8.8 days in 2004–05 and then decreased to 7.6 days in 2007–08. 61 4.0 70+ years Hospitalisations per 1,000 females 3.5 3.0 50–69 years 2.5 2.0 1.5 All ages 1.0 0.5 <50 years 0.0 1999–00 2000–01 2001–02 2002–03 2003–04 2004–05 2005–06 2006–07 2007–08 Notes 1. The rates were age-standardised to the Australian population as at 30 June 2001 and are expressed per 1,000 females. 2. The data for this figure are shown in Appendix Table D7.3. Source: National Hospital Morbidity Database, AIHW. Figure 7.3: Hospitalisations for ovarian cancer by age group, 1999–00 to 2007–08 10 Overnight hospitalisations Average length of stay (days) 9 8 7 6 5 4 3 Total hospitalisations 2 Same-day hospitalisations 1 0 1999–00 2000–01 2001–02 2002–03 2003–04 2004–05 2005–06 2006–07 2007–08 Note: The data for this figure are shown in Appendix Table D7.4. Source: National Hospital Morbidity Database, AIHW. Figure 7.4: Average length of stay for ovarian cancer–related hospitalisations by same-day and overnight status, 1999–00 to 2007–08 In contrast, the average length of stay for all ovarian cancer-related hospitalisations in 2007–08 was shorter than that in 1999–00 (2.4 and 2.9 days, respectively). The reduction of the overall average length of stay can be attributed to the increase of the number of same-day hospitalisations which, by definition, are shorter than those hospitalisations that involved an overnight stay. 62 Procedures undertaken during hospitalisations Procedures undertaken in hospitals include surgical procedures, non-surgical procedures for investigative and therapeutic purposes (such as chemotherapy) and client support interventions (e.g. anaesthesia). One or more procedures can be reported for each hospitalisation, but procedures are not undertaken during all hospitalisations; thus, only some hospitalisations include data on procedures. The classification system that was used to code the 2007–08 data on procedures was the fifth edition of the Australian Classification of Health Interventions (ACHI) (see Appendix A). Table 7.4 indicates the number of hospitalisations in which the indicated procedure was undertaken at least once during 2007–08. The majority of these hospitalisations included the ‘administration of pharmacotherapy’ (i.e. chemotherapy); this procedure was undertaken in almost two-thirds (62%) of ovarian cancer–related hospitalisations. In addition, 12% of the hospitalisations involved ‘generalised allied health professions’ and a further 11% included the ‘loading of a drug delivery device’. Table 7.4: Hospitalisations for ovarian cancer by most common procedures, 2007–08 Procedure description (ACHI (a) (b,c) block number) Count of hospitalisations (c) Per cent Administration of pharmacotherapy (1920) 8,793 61.6 Generalised allied health professions (1916) 1,691 11.8 Loading of drug delivery device (1921) 1,631 11.4 Transfusion of blood and gamma globulin (1893) 1,274 8.9 Cerebral anaesthesia (1910) 1,269 8.9 Vascular infusion device and pump (766) 839 5.9 Abdominal hysterectomy (1268) 551 3.9 Other procedures on female genital organs (1299) 423 3.0 Therapeutic interventions on cardiovascular system (1890) 422 3.0 Postprocedural analgesia (1912) 414 2.9 Immunisation (1884) 390 2.7 Division of abdomen adhesions (986) 330 2.3 Other excision procedures on abdomen, peritoneum or omentum (989) 269 1.9 Application, insertion or removal procedures on abdomen (983) 253 1.8 Salpingo-oophorectomy (1252) 251 1.8 Conduction anaesthesia (1909) 235 1.6 Appendicectomy (926) 191 1.3 Computerised tomography of abdomen and pelvis (1963) 183 1.3 Venous catheterisation (738) 180 1.3 Laparoscopy (985) 170 1.2 14,277 .. Total ovarian cancer-related hospitalisations (a) Classified according to the Australian Classification of Health Interventions, fifth edition (see Appendix A). (b) Indicates the number of hospitalisations in which the indicated procedure was undertaken. (c) The sum of the count of hospitalisations does not equal the total number of hospitalisations since no procedure, or multiple procedures, may be undertaken during each hospitalisation. For the same reason, the sum of the percentages does not equal 100. Source: National Hospital Morbidity Database, AIHW. 63 8 Expenditure on ovarian cancer Another measure of the impact of ovarian cancer is the health care costs incurred. Generally, when expenditure for various types of cancers is considered, estimates are provided on recurrent, direct health care costs—that is, expenditure on health goods and services spent by all levels of government, private health insurers, companies, households and individuals to diagnose and treat that type of cancer. This was the approach used in the recent report on breast cancer (AIHW and NBOCC 2009). For ovarian cancer, however, only one component of such expenditure was considered to be of sufficient quality for publication—namely, hospital admitted patient services expenditure. This type of expenditure pertains to services provided to admitted patients, including private admitted patients, in hospitals. In contrast, estimates of out-of-hospital medical expenses and prescription pharmaceuticals for ovarian cancer patients were considered to be of insufficient quality to report due to insufficient numbers in the surveys on which the expenditure estimates are based. The latest expenditure estimates that are available on hospital admitted patient services for ovarian cancer are for the 2004–05 financial year, with comparable data available for 2000–01. The data were sourced from the Disease Expenditure Database which is maintained by the AIHW. In this database, ovarian cancer was defined to include the ICD-10 codes of ‘C56 and C57.0–C57.4’, which we refer to as ‘ovarian and related cancers’. This definition of ovarian cancer differs from the definition used in the majority of other chapters in this report (i.e. the ICD-10 code of ‘C56’). In the Disease Expenditure Database (and unlike the approach taken in Chapter 7 of this report), the data on hospital expenditure for ovarian and related cancers pertain only to those hospitalisations for which the principal diagnosis was ‘ovarian and related cancers’. Thus, expenditure related to same-day hospitalisations for the administration of chemotherapy, with ovarian and related cancer patients coded as an additional, rather than a principal, diagnosis is not included. As a result, the data shown are a minimum estimate of total hospital admitted patient services expenditure on ovarian and related cancer patients. Further information about the Disease Expenditure Database and how the expenditure estimates were derived can be found in health expenditure reports produced by the AIHW (AIHW 2005, 2008b). Expenditure in 2004–05 Expenditure on hospital admitted patient services for ovarian and related cancers was estimated to be $25 million in the 2004–05 financial year (Table 8.1). The corresponding value for expenditure for all cancers for females was $884 million and, for all diseases, it was $12,688 million. Overall, ovarian and related cancers comprised 3% of all cancer-related hospital admitted patient services expenditure for females and 0.2% of such expenditure for all diseases. 64 Table 8.1: Hospital admitted patient services expenditure(a) by disease, females, 2004–05 Ovarian and related cancers All cancers $ (million) Per cent of expenditure on (b) all cancers Per cent of expenditure on all diseases 25 2.9 0.2 884 100.0 7.0 12,688 .. 100.0 (c) (b) All diseases (a) Pertains to those hospitalisations for which the principal diagnosis was ovarian and related cancers. Does not pertain to hospitalisations for which ovarian and related cancers was an additional diagnosis, with the principal diagnosis relating specifically to the type of cancer treatment or care received. (b) Includes cancers coded in ICD-10 as C00–C97. Does not include cancers coded as D45, D46, D47.1 and D47.3. (c) Includes cancers coded in ICD-10 as C56 and C57.0–C57.4. Source: Disease Expenditure Database, AIHW. Differences by age Differences by age in ovarian and related cancers expenditure for hospital admitted patient services is shown in Figure 8.1. Almost one quarter (23%) of the $25 million was spent on women aged 54 to 64 years ($6 million). As well, 23% was spent on women aged 65 to 74 years ($6 million), while 21% ($5 million) was spent on women aged 75 to 84 years and 16% (4 million) on those aged 45 to 54 years. 7 10,000 Expenditure ($ million) 6 5 8,000 Expenditure per hospitalisation ($) 6,000 4 3 4,000 2 Expenditure ($ million) 2,000 1 0 0 <35 35–44 45–54 54–64 65–74 75–84 85+ Age group (years) Notes 1. Pertains to those hospitalisations for which the principal diagnosis was ovarian and related cancers (i.e. codes of C56 and C57.0–C57.4 in ICD-10). Does not pertain to hospitalisations for which ovarian and related cancers was an additional diagnosis, with the principal diagnosis relating specifically to the type of cancer treatment or care received. 2. The data for this figure are shown in Appendix Table D8.1. Source: Disease Expenditure Database, AIHW. Figure 8.1: Hospital admitted patient services expenditure on ovarian and related cancers by age group, 2004–05 65 Expenditure per hospitalisation ($) 12,000 8 Average expenditure per hospitalisation for ovarian and related cancers was highest for women in the older age groups. In particular, average expenditure for those aged 85 years and over was $10,379 per hospitalisation and, for those aged 75 to 84 years, it was $8,945 per hospitalisation. In contrast, the lowest average expenditure per hospitalisation of $6,790 was for those aged 54 to 65 years, followed by expenditure of $6,860 for those aged less than 35 years. Trends Change over time in admitted patient expenditure on ovarian and related cancers is shown in Table 8.2. After prices were adjusted for inflation (with all prices shown in 2004–05 dollars), the data indicate that admitted patient expenditure on ovarian and related cancers grew by 15% from $22 million in 2000–01 to $25 million in 2004–05. Further investigation of the data indicated that this increase was largely due to increased expenditure on specialists. Table 8.2 also indicates that the overall increase in estimated expenditure on ovarian and related cancers (15%) is somewhat lower than the estimated increase of 19% for all cancers and 18% for all diseases. Table 8.2: Hospital admitted patient services expenditure(a) by disease, constant prices(b), females, 2000–01 and 2004–05 (b) Sector 2000–01 $ (million) Ovarian and related cancers All cancers (d) (e) All diseases (a) 2004–05 $ (million) Change (%) (c) 22 25 15.0 745 884 18.6 10,739 12,688 18.1 Pertains to those hospitalisations for which the principal diagnosis was ovarian and related cancers (i.e. codes of C56 and C57.0–C57.4 in ICD-10). Does not pertain to hospitalisations for which ovarian and related cancers was an additional diagnosis, with the principal diagnosis relating specifically to the type of cancer treatment or care received. (b) Constant price health expenditure for 2000–01 is shown in terms of 2004–05 dollars. (c) These calculations were based on exact dollars. (d) Includes cancers coded in the ICD-10 as C56 and C57.0–C57.4. (e) Includes cancers coded in ICD-10 as C00–C97. Does not include cancers coded as D45, D46, D47.1 and D47.3. Source: Disease Expenditure Database, AIHW. 66 Appendix A: Classifications International Statistical Classification of Diseases and Related Health Problems The International Statistical Classification of Diseases and Related Health Problems (ICD) is used to classify diseases and other health problems (including symptoms and injuries) in clinical and administrative records. The use of a standard classification system enables the storage and retrieval of diagnostic information for clinical and epidemiological purposes that is comparable between different service providers, across countries and over time. In 1903, Australia adopted the ICD to classify causes of death and it was fully phased in by 1906. Since 1906, the ICD has been revised nine times in response to the recognition of new diseases (e.g. acquired immunodeficiency syndrome (AIDS)), increased knowledge of diseases and changing terminology in the description of diseases. Comparability factors are sometimes required between revisions to make comparisons valid if a disease definition changed between the revisions. For ovarian cancer, a comparability factor of 0.98 applies to convert ICD-9 mortality data to ICD-10 data (ABS 2007), while a comparability factor of ‘1’ applies to convert such data from ICD-8 to ICD-9 standards (ABS 1981). The version currently in use, ICD-10 (WHO 1992), was endorsed by the 43rd World Health Assembly in May 1990 and officially came into use in World Health Organization (WHO) member states from 1994. International Statistical Classification of Diseases and Related Health Problems, Australian modification The Australian modification of ICD-10, which is referred to as the ICD-10-AM (NCCH 2008b), is based on ICD-10. ICD-10 was modified for the Australian setting by the National Centre for Classification in Health (NCCH) with assistance from clinicians and clinical coders. Compatibility with ICD-10 at the higher levels (i.e. up to 4 character codes) of the classification has been maintained. ICD-10-AM has been used for classifying diagnoses in hospital records in all states and territories since 1999–00 (AIHW 2000). Australian Classification of Health Interventions The current version of the ICD does not incorporate a classification system for coding health interventions (i.e. procedures). In Australia, a health intervention classification system was designed to be implemented at the same time as the ICD-10-AM in July 1998. The system was based on the Medicare Benefits Schedule (MBS) coding system and was originally called MBS-Extended. The name was changed to the Australian Classification of Health Interventions (ACHI) with the release of the third revision of the ICD-10-AM in July 2002 (NCCH 2008c). ACHI and ICD-10-AM are used together for classifying morbidity, surgical procedures and other health interventions in Australian hospital records. 67 International Classification of Diseases for Oncology Cancers were originally classified solely under the ICD classification system, based on topographic site and behaviour. However, during the creation of the ninth revision of ICD in the late 1960s, working parties suggested the creation of a separate classification for cancers that included improved morphological information. The first edition of the International Classification of Diseases for Oncology (ICD-O) was subsequently released in 1976 and, in this classification, cancers were coded by both morphology (histology type and behaviour) and topography (site). Since the first edition of the ICD-O, a number of revisions have been made, mainly in the area of lymphomas and leukaemias. The current (third) edition was released in 2000 (Fritz et al. 2000) and is currently used by most state and territory cancer registries in Australia, as well as by the AIHW in regard to the Australian Cancer Database. Australian Standard Geographical Classification Remoteness Areas The Australian Standard Geographical Classification (ASGC) Remoteness Areas was used to assign areas across Australia to a remoteness category (ABS 2001). This classification divides all areas of Australia into five categories—namely, Major cities, Inner regional, Outer regional, Remote and Very remote (AIHW 2004). For the purposes of this report, the categories of Remote and Very remote were collapsed due to the small number of cases in these two subgroups. Index of Relative Socio-economic Disadvantage The Index of Relative Socio-economic Disadvantage (IRSD) is one of four Socio-Economic Indexes for Areas (SEIFAs) developed by the Australian Bureau of Statistics (ABS 2008a). This index is based on factors such as average household income, education levels and unemployment rates. Rather than being a person-based measure, the IRSD is an area-based measure of socioeconomic status in which small areas of Australia are classified on a continuum from disadvantaged to affluent. This information is used as a proxy for the socioeconomic status of people living in those areas and may not be correct for each person living in that area. In this report, the first socioeconomic status group (labelled ‘1’) corresponds to geographical areas containing the 20% of the population with the lowest socioeconomic status according to the IRSD and the fifth group corresponds to the 20% of the population with the highest socioeconomic status. Standard Australian Classification of Countries The Standard Australian Classification of Countries (SACC) is the Australian statistical standard for statistics classified by country (ABS 2008c). It is a classification of countries which is essentially based on the concept of geographic proximity. In its structure, it groups neighbouring countries into progressively broader geographical areas on the basis of their similarity in terms of social, cultural, economic and political characteristics. The first edition of the SACC was published in 1998, while the second edition—the one used in this report— was released by the ABS in 2008. 68 Appendix B: Statistical methods and technical notes Age-specific rates Age-specific rates provide information on the incidence of a particular event in an age group relative to the total number of people at risk of that event in the same age group. It is calculated by dividing the number of events occurring in each specified age group by the corresponding ‘at risk’ population in the same age group and them multiplying the result by a constant (e.g. 100,000) to derive the rate. Age-specific rates are often expressed per 100,000 population. Age-standardised rates A crude rate provides information on the number of, for example, new cases of cancer or deaths from cancer relative to the number of people in the population at risk in a specified period. No age adjustments are made when calculating a crude rate. Since the risk of cancer is heavily dependent on age, crude rates are not suitable for looking at trends or making comparisons across groups in cancer incidence and mortality. More meaningful comparisons can be made by the use of age-standardised rates, with such rates adjusted for age in order to facilitate comparisons between populations that have different age structures (e.g. between Indigenous and other Australians). This standardisation process effectively removes the influence of age structure on the summary rate. There are two methods commonly used to adjust for age: direct and indirect standardisation. In this report, the direct standardisation approach presented by Jensen and colleagues (1991) is used with two exceptions. The exceptions are the calculation of incidence and mortality rates by Indigenous status and by country/region of birth. There are relatively small numbers of cases of, and deaths from, ovarian cancer among Indigenous women and among Australian women born in some overseas regions; indirect age-standardisation is commonly used in such circumstances. To age-standardise using either the direct or the indirect method, the first step is to calculate population numbers and numbers of cases (or deaths) in age ranges—typically 5-year age ranges. If direct standardisation is used, a key step is to multiply the age-specific population numbers for the reference population (e.g. the Australian population as at 30 June 2001 or the WHO 2000 World Standard Population) by the age-specific incidence rates (or death rates) for the population of interest (such as those in a certain socioeconomic status group or those who lived in Major cities). This is then used to derive a standardised incidence rate (or death rate) for the population of interest. When indirect standardisation is used, a key step is to estimate an ‘expected’ incidence rate (or death rate) for the population of interest (such as Indigenous women) from the agespecific rates in the reference population (e.g. non-Indigenous women) and the age-specific population numbers for the population of interest. Details of the age-standardisation method used and the reference population for each of the relevant incidence and mortality analyses are summarised in Table B.1 (and noted in the footnotes to the relevant tables and graphs). 69 Table B.1: Age-standardisation method and reference population for analyses of differences in incidence and mortality rates by group Variable Age-standardisation method used Reference population State and territory Direct Australian population as at 30 June 2001 Remoteness area Direct Australian population as at 30 June 2001 Socioeconomic status Direct Australian population as at 30 June 2001 Indigenous status Indirect Non-Indigenous population Country of birth Indirect Australian-born population Confidence intervals An observed value of a rate may vary due to chance, even where there is no variation in the underlying value of the rate. A confidence interval provides a range of values that has a specified probability of containing the true rate or trend. The 95% (p-value = 0.05) confidence interval is used in this report; thus, there is a 95% likelihood that the true value of the rate is somewhere within the stated range. Confidence intervals can be used as a guide to whether or not differences are consistent with chance variation. In cases where no values within the confidence intervals overlap, the difference between rates is greater than that which could be explained by chance and is regarded as statistically significant. Note, however, that overlapping confidence intervals do not necessarily mean that the difference between two rates is definitely due to chance. Instead, an overlapping confidence interval represents a difference in rates which is too small to allow differentiation between a real difference and one which is due to chance variation. It can, therefore, only be stated that no statistically significant differences were found, and not that no differences exist. The approximate comparisons presented might understate the statistical significance of some differences, but they are sufficiently accurate for the purposes of this report. As with all statistical comparisons, care should be exercised in interpreting the results of the comparison of rates. If two rates are statistically significantly different from each other, this means that the difference is unlikely to have arisen by chance. Judgement should, however, be exercised in deciding whether or not the difference is of any practical significance. With one exception, the confidence intervals presented in this report were calculated using a method developed by Dobson and associates (1991). This method calculates approximate confidence intervals for a weighted sum of Poisson parameters. The one exception applies to the confidence intervals that were calculated for the international comparisons of incidence and mortality using GLOBOCAN data. For those data, the lack of the required data meant that the Dobson method could not be used and the AIHW approximated the confidence intervals using the following formula: 95% CI approximation = AS rate ± 1.96 x AS rate Number of cases 70 Since the GLOBOCAN data are based on the estimates of the number of new cases and deaths from ovarian cancer, the associated confidence intervals indicate the range of random variation that might be expected, should those estimates be 100% accurate. Note that statistical independence of observations is assumed in the calculations of the confidence intervals for this report. This assumption may not always be valid for episodebased data (such as data from the National Hospital Morbidity Database). Definition of ovarian cancer Definitions of ovarian cancer differ considerably in the literature, with the following two factors varying between definitions: what ICD codes are included in the definition; and whether or not borderline tumours are included. These two factors are discussed below. What ICD codes are included in the definition In the 9th revision of the ICD, ovarian cancers were grouped with cancers of ‘other uterine adnexa’ and coded as ‘183’. Examples of ‘other uterine adnexa’ cancers are cancers of the fallopian tube and of the parametrium. While the actual ICD-9 name for code ‘183’ is ‘Malignant neoplasm of ovary and other uterine adnexa’, this grouping of cancers is often simply referred to as ‘ovarian cancer’ in the literature. In the 10th revision of the ICD, ovarian cancers were coded separately and assigned the code of ‘C56’, with the remaining cancers from the ICD-9 code of ‘183’ grouped with a number of other cancers in ‘C57’. The code of ‘C57’ is labelled ‘malignant neoplasm of other and unspecified female genital organs’ (see Table B.2). Table B.2: Codes for ovarian and associated cancers in the International Statistical Classification of Diseases and Related Health Problems, tenth revision (ICD-10) ICD-10 codes Type of cancer C56 Malignant neoplasm of ovary C57 Malignant neoplasm of other and unspecified female genital organs C57.0 Fallopian tube (oviduct, uterine tube) C57.1 Broad ligament C57.2 Round ligament C57.3 Parametrium (uterine ligament NOS) C57.4 Uterine adnexa, unspecified C57.7 Other specified female genital organs (Wolffian body or duct) C57.8 Overlapping lesion of female genital organs (malignant neoplasm of female genital organs whose point of origin cannot be classified to any one of the categories C51–C57.7, C58) (tubo-ovarian, utero-ovarian) C57.9 Female genital organ, unspecified (female genitourinary tract NOS) Source: WHO 1992. Cancers coded as ‘C56’ in ICD-10 are included for the analyses of ovarian cancer shown in this report that utilise the Australian Cancer Database (Chapters 2, 4 and 5), the National Mortality Database (Chapter 3) and the National Hospital Morbidity Database (Chapter 7). This is the same definition as has been used for ovarian cancer by the cancer registries in Victoria (Thursfield et al. 2009), Queensland (Queensland Cancer Registry & Cancer Council 71 Queensland 2008) and Tasmania (Dalton et al. 2008). However, different definitions for ovarian cancer have been used by other state and territory registries. For example, New South Wales and the Australian Capital Territory include the ICD-10 codes of ‘C56 and C57.0–C57.7’ (ACT Health 2007; Tracey et al. 2006, 2008), Western Australia includes the ICD-10 codes of ‘C56 and C57.0–C57.9’ (Threllfall et al. 2005) and South Australia includes the ICD-9 code of ‘183’ (South Australia Cancer Registry 2008). For the analyses shown in this report that are based on GLOBOCAN data (in Chapters 2, 3 and 4), the burden of disease report (Chapter 6), and the Disease Expenditure Database (Chapter 8), ovarian cancer was defined as the ICD-10 codes of C56 and C57.0–C57.4 (see Table B.2). This grouping of cancers is referred to as ‘ovarian and related cancers’ in this report. Whether or not borderline tumours are included In the second edition of the ICD-O, ovarian tumours of borderline malignancy were considered malignant. However, in the third edition of the ICD-O, they are considered to be of uncertain behaviour and are no longer considered malignant. Thus the number of cases that are considered to be ovarian cancer will be less when ICD-O-3 coding rules are used rather than ICD-O-2 rules. The third edition of ICD-O was released in 2000, and has been implemented in cancer registries from the early 2000s onwards. Furthermore, each of the cancer registries has recoded their cancer data holdings for all years based on the ICD-O-3 coding rules. Thus the Australian data shown in this report for all years are comparable over time and exclude borderline cases of ovarian cancer. For the earlier edition of this report (AIHW & NBCC 2006), tumours were classified according to ICD-O-2 and thus the data presented in that report are not strictly comparable to the results shown in this report. As shown in the earlier report, 6% of the ovarian cancer cases diagnosed in 2002 were borderline tumours. Due to the varying approaches used to define ovarian cancer in the literature, comparisons of data from different sources must be done with care. Incidence projections To calculate the incidence projections shown in Chapter 2, ovarian cancer incidence data for females for the 10-year period from 1997 to 2006 were divided into 18 series—one for each 5-year age group. The incidence numbers were divided by the age-specific mid-year populations to obtain the age-specific incidence rates. Least squares linear regression was used to find the straight line of best fit through the 1997 to 2006 rates and to compute the various quantities needed for the 95% prediction intervals. The projected incidence rates were then multiplied by the estimated resident population to obtain the projected incidence numbers. The populations used were the ABS projected populations from Series 29(B) (ABS 2008b). 72 Mortality data differences The state and territory data on mortality due to ovarian cancer that are shown in this report may not be comparable with data published by individual state and territory cancer registries for a number of reasons, including the following (Cancer Council Queensland 2009; Tracy et al. 2008): • The state and territory mortality data presented in this report refer to the place of a person’s residence at the time of death. In contrast, the state and territory cancer registries generally present mortality information based on a person’s place of residence at the time of diagnosis. In these latter data, the deaths may or may not have occurred in the state or territory indicated. • Different approaches were used to assign cause of death. In this report, data on mortality for each jurisdiction were derived from the National Mortality Database (see Appendix C). Information on cause of death in the NMD is sourced from the ABS which makes use of death certificate information to assign cause of death. In contrast, the state and territory cancer registries tend to make use of information from a number of different sources, including pathology reports and other notifications, to assign a cause of death. Mortality-to-incidence ratio Both mortality-to-incidence ratios (MIRs) and relative survival ratios can be used to estimate survival from a particular disease, such as ovarian cancer, for a population. Although MIRs are the cruder of the two ratios, MIRs do not have the same comparability and interpretation problems associated with them when attempting to make international comparisons (see Chapter 4). Thus, the MIR is considered to be a better measure when comparing survival between countries. The MIR is defined as the age-standardised mortality rate divided by the age-standardised incidence rate. For example, an MIR of 0.42 in a given year for all types of cancers means that for every 100 new cancer cases diagnosed that year, there were 42 deaths due to cancer in the same year (though the deaths need not be of the same people as the cases). If people tend to die relatively soon after diagnosis from a particular cancer (that is, the death rate is nearly as high as the incidence rate for that cancer), then the MIR will be close to 1.00. In contrast, if people tend to survive a long time after being diagnosed, then the MIR will be close to zero. The MIR only gives a valid measure of the survival experience in a population if: • cancer registration and death registration are complete or nearly so, and • the incidence rate, mortality rate and survival proportion are not undergoing rapid change. The incidence and mortality data used to calculate the MIRs in Chapter 4 were extracted from the 2002 GLOBOCAN database (Ferlay et al. 2004). 73 Relative survival analysis Relative survival estimates compare the survival of persons diagnosed with ovarian cancer (i.e. the observed survival) with the survival of the entire Australian population of the same sex and age in the same calendar year as the cancer cohort (i.e. the expected survival). Note that the actual cause of death (whether it is from ovarian cancer or another cause) is not of importance in these analyses. Thus, relative survival is defined as follows: relative survival = observed survival for cancer cohort expected survival for ‘matched’ population The resulting value is usually given as a proportion. For example, if the observed 5-year survival of a particular cohort diagnosed with ovarian cancer was 0.60 (that is, 60% of them were still alive 5 years after diagnosis) and their expected survival, based on Australian lifetables, was 0.90 (that is, 90% of people with the same age- and sex-profile as the cohort would be expected to be alive 5 years later), then the 5-year relative survival would be 0.6/0.9 = 0.67 or 67%. One way to interpret this figure is that the ‘average’ person in the cancer cohort has a 67% chance of being alive 5 years after diagnosis relative to others of the same sex and age. In order for the relative survival estimate to be a valid approximation of the probability that a person will not die of their diagnosed cancer within the given time interval, the presence of the cancer is assumed to be the only factor that distinguishes the cancer cohort from the general population (Ries et al. 2008). The degree to which this is true is not known. Relative survival proportions have traditionally been calculated using the ‘cohort method’, and NBOCC preferred the use of that method for this report. In the cohort method, a cohort of people diagnosed with cancer is followed over time to estimate the proportion surviving for a selected time frame (e.g. 1, 5 or 10 years). An alternative approach to calculating relative survival is the period method, which was developed by Brenner and Gefeller (1996). This method examines the survival experience of people who were alive at the beginning of a particular recent calendar period and who were diagnosed with cancer before this period. Therefore, the period method might provide more up-to-date estimates of survival, especially in the presence of temporal trends affected by improvements in cancer detection and treatment. However, the cohort method is thought to provide more precise estimates (i.e. estimates with narrower confidence intervals). An alternative to the calculation of relative survival proportions is to use the ‘cause-specific model’ to derive survival estimates. This model calculates survival based on deaths due to cancer-related causes alone. There are various advantages and disadvantages to using the cause-specific model (Le Teuff et al. 2005). Because the 2006 version of the Australian Cancer Database that was utilised for this report included a limited amount of cause of death information, this approach could not be used to calculate survival estimates. Data from the ACD on the incidence of ovarian cancer were used to calculate observed survival proportions. These incidence data were linked to the National Death Index in order to obtain information on those people with ovarian cancer who died and the date on which this occurred (see Appendix C for more information on the data sets). In order to calculate the expected survival belonging to the age-, sex- and calendar-year matched population, ABS life tables for the population under study were used (ABS 2009b). When comparing relative (or crude) survival estimates over time and/or between population subgroups it would seem appropriate to age-standardise the figures in order to 74 remove potential confounding by different age-structures. However, there are some undesirable features of doing so, as well as some difficulties in interpreting directly agestandardised survival estimates (Brenner et al. 2004; Brenner & Hakulinen 2003). For example, when numbers are small the age-specific survival for a certain age group and population subgroup may be undefined; hence the age-standardisation procedure breaks down. Also, the calculation of age-standardised survival can produce a figure that differs substantially from the unadjusted survival, even if it is adjusted to the original age distribution of the study population. In light of these and related shortcomings in the procedure, it was decided not to age-standardise the survival estimates produced for this report. The software used to calculate the relative survival proportions was written by Dickman (2004). It uses the Ederer II method of calculating the interval-specific expected survivals. Further details on the approach used to calculate the relative survival estimates, including rules which were applied during data preparation, can be found in the 2008 report prepared by the AIHW on cancer survival and prevalence (AIHW, CA & AACR 2008). Risk to age 75 and 85 years The calculations of risk shown in this report are measures that approximate the risk of developing (or dying from) ovarian cancer before a given age, assuming that the risks at the time of estimation remained throughout life. It is based on a mathematical relationship with the cumulative rate. Note that in these risk factors, no account is taken of specific ovarian cancer risk factors. Further details on how the risks were calculated can be found in the 2008 Cancer in Australia report (AIHW & AACR 2008). 75 Appendix C: Data sources To provide a comprehensive picture of national ovarian cancer statistics in this report, a range of data sources were used, including AIHW and external data sources. These data sources are described in this appendix. Australian Cancer Database The Australian Cancer Database (ACD) is a database that holds information about 1.8 million cancer cases of Australian residents who were diagnosed with cancer (other than basal call and squamous cell carcinomas of the skin) between 1982 and 2006. Data from this source are used in Chapters 2, 4 and 5. The AIHW compiles and maintains the ACD, in partnership with the Australasian Association of Cancer Registries (AACR), whose member registries provide data to the AIHW on an annual basis. Each Australian state and territory has legislation that makes the reporting of all cancers (excluding basal call and squamous cell carcinomas of the skin) mandatory. Pathology laboratories and Registrars of Births, Deaths and Marriages across Australia must report on cancer cases, as do hospitals, radiation oncology units and nursing homes in some (but not all) jurisdictions. The data provided to the AIHW by the state and territory cancer registries include, at a minimum, an agreed set of items that provide information about the individual with the cancer, and the characteristics of the cancer (see Table C.1). In addition to the agreed set of items, registries often provide other data which are also included in the ACD. For example, data on ductal carcinoma in situ (DCIS) are not part of the agreed ACD data set but are regularly provided by the state and territory registries. Once the data are received from the state and territory cancer registries, the AIHW assembles the data into the ACD. Internal linking checks are undertaken to identify those who had tumours diagnosed in more than one state or territory; this process reduces the degree of duplication within the ACD to a negligible rate. The ACD is also linked with information on deaths (from the National Death Index) in order to add information on which people with cancer have died (from any cause). Any conflicting information and other issues with the cancer data are resolved through consultation with the relevant state or territory cancer registry. The registration of cases of cancer is a dynamic process such that records in the state and territory cancer registries may be modified if new information is received. Thus, records in the cancer registries are always open and they are updated as required. In order for these changes to be incorporated into the ACD, a new complete file for all years of cancer data is provided by each of the jurisdictions annually. As a result, the number of cancer cases reported by the AIHW for any particular year may change slightly over time and, in addition, data published by a cancer registry at a certain point in time may differ to some extent from what is published by the AIHW. 76 Table C.1: Agreed set of items to be provided by the states and territories to the AIHW for inclusion in the Australian Cancer Database Person-level attributes Tumour-level attributes Person identification number (assigned by the state/territory) Tumour identification number (assigned by the state/territory) Surname Date of diagnosis First given name Date of diagnosis flag Second given name Age at diagnosis Third given name ICD-O-3 (a) topography code ICD-O-3 (a) morphology code Sex (b) disease code Date of birth ICD-10 Date of birth flag Most valid basis of diagnosis Indigenous status Statistical local area at diagnosis Country of birth Postcode at diagnosis Date of death Melanoma thickness Age at death Cause of death (a) International Classification of Diseases for Oncology, 3rd edition (see Appendix A). (b) International Statistical Classification of Diseases and Related Health Problems, 10th revision (see Appendix A). Source: AIHW 2009b. Non-melanoma skin cancers Data on all types of cancer, other than two types of non-melanoma skin cancer (NMSC), are reportable and collected by the state and territory registries. The two most common types of NMSC—namely, basal cell carcinoma (BCC) and squamous cell carcinoma (SCC)—are not reportable and are thus not generally recorded in cancer registries in Australia. These two types of skin cancers are by far the most frequently diagnosed cancers in Australia for both males and females (AIHW & CA 2008). A number of other, rarer types of cancer also fall within the NMSC category (e.g. Merkel cell lesions, Kaposi sarcoma and cutaneous lymphoma) and these are reportable cancers. In the past, the agreed approach was to exclude all NMSC cases from the cancer incidence data produced by the AIHW. However, for the first time this year, a new approach was used whereby all cases that pertained to reportable forms of NMSC were included in the incidence data; as previously, no data on BCC and SCC were included. To implement this change, the state and territory registries were asked to supply, along with the usual data, information on all NMSC cases other than BCC and SCC for 2006 and for all previous years, where possible. All of the registries were able to provide such data for 2001 to 2006, with only some being able to provide such data for earlier years. Thus the data on non-melanoma skin cancers other than BCC and SCC may be incomplete before 2001. 77 Burden of disease data Information on the burden of disease from ovarian cancer is shown in Chapter 6 of this report. The first study that provided a comprehensive overview of disease and injury burden in Australia was published in 1999 (AIHW: Mathers et al. 1999). The second and most recent such study was published in 2007, and it provides burden of disease information in relation to 2003 (Begg et al. 2007a,b). The summary measure used in that study is the disabilityadjusted life year or DALY, with this term used interchangeably with ‘burden of disease’. The DALY quantifies the gap between a population’s actual health status and some ‘ideal’ or reference status, with time (either lived in health states or lost through premature death and illness) being the unifying ‘currency’ for combining the impact of mortality and non-fatal health outcomes. A DALY for a disease or health condition is calculated as the sum of the years of life lost due to premature mortality (YLL) in the population and the equivalent ‘healthy’ years lost due to disability (YLD) for incident cases of the health condition such that: DALY = YLL + YLD where YLL = number of deaths x standard life expectancy at age of death and YLD = incidence x duration x severity weight. Further information about how the DALY was derived, as well as further information on interpretation of burden of disease data, can be found in Begg and associates (2007a). In the burden of disease study, ovarian cancer was defined to include the ICD-10 codes of ‘C56 and C57.0–C57.4’; this set of codes is referred to as ‘ovarian and related cancers’ in this report (see Appendix B). Disease Expenditure Database Expenditure data are used in Chapter 8 of this report to describe health expenditure on ovarian cancer. These data were obtained from the Disease Expenditure Database which is maintained by the AIHW. Since 1984, the AIHW has had responsibility for developing estimates of national health expenditure. Data for this purpose are obtained from a wide variety of sources in the public and private sectors, with most of the data being provided by the ABS, the Australian Government Department of Health and Ageing, and state and territory health authorities. Other major sources are the Department of Veterans’ Affairs, the Private Health Insurance Administration Council, Comcare, and the major workers compensation and compulsory third-party motor vehicle insurers in each state and territory. The definition of ovarian cancer used in this database is the ICD-10 codes of ‘C56 and C57.0–C57.4’, which we refer to as ‘ovarian and related cancers’ (see Appendix B). Expenditure data for just the ICD-10 code of ‘C56’ were not available. In the Disease Expenditure Database (and unlike the approach taken in Chapter 7 of this report), ovarian and related cancer hospitalisations are defined as those hospitalisations for which the principal diagnosis was ovarian and related cancer. Therefore, hospitalisations that involved same-day chemotherapy administration for ovarian and related cancer patients (with ovarian cancer coded as an additional diagnosis rather than a principal diagnosis) are not 78 included. In turn, any spending related to these latter hospitalisations is not included in the expenditure data for hospital admitted patient services for ovarian and related cancers. Thus, the data shown are a minimum estimate of total admitted patient services expenditure on ovarian and related cancer patients. Note that in future expenditure analysis work done by the AIHW, further work to identify the costs of chemotherapy that are due to specific types of cancers may be undertaken. The definition of ‘all cancers’ used in Chapter 8 is somewhat different from that used in earlier chapters, as it only includes the ICD-10 ‘C’ codes and excludes those malignant cancers with the ICD-10 ‘D’ codes (such as polycythaemia vera). Separate expenditure data were not readily available for the required subset of ICD-10 ‘D’ cancers. Since the forms of malignant cancers covered by the ICD-10 ‘D’ codes are not common (see AIHW & AACR 2008), their exclusion is not expected to have a large effect on the health expenditure estimates shown in this report. Further information about the Disease Expenditure Database can be found in the annual health expenditure reports published by the AIHW (AIHW 2008b). GLOBOCAN One of the main sources of internationally comparable data on cancer is the GLOBOCAN database which is prepared by the International Agency for Research on Cancer (IARC) (Ferlay et al. 2004). The IARC collates cancer incidence and mortality data from cancer registries around the world and uses those data to produce estimates for a ‘common year’. The most recent GLOBOCAN estimates for which data could be obtained are for 2002, with these estimates based on cancer incidence rates from approximately 3 to 5 years earlier. GLOBOCAN data are shown in Chapters 2, 3 and 4 of this report. For the GLOBOCAN data, ovarian cancer was defined as those cancers that were coded as ‘C56 and C57.0–C57.4’ in ICD-10. Thus the definition used in those data is broader than that used in most other sections of this report. While not clearly stated, we presume that borderline ovarian tumours have not been included since IARC indicates that the third edition of ICD-O was used. As noted in Chapter 1, in the third edition of ICD-O (and unlike the previous edition), borderline ovarian tumours were not considered to be malignant tumours. In the GLOBOCAN database, age-standardised incidence and mortality rates are provided, with the data standardised to the Doll et al. (1966) World Standard Population. However, the database does not include confidence intervals. In order to provide some guidance in terms of whether the differences were statistically significant, the AIHW calculated approximate confidence intervals (with the methodology for doing so explained in Appendix B). National Death Index Cancer incidence data were linked to the National Death Index (NDI) in order to provide survival and prevalence information (Chapters 4 and 5). The NDI is a database that is maintained by the AIHW; it contains information on all deaths that have occurred in Australia since 1980. The NDI database comprises the following variables for each deceased person: name; alternative names (including maiden names); date of birth (or estimated year of birth); age at death; sex; date of death; marital status; Indigenous status; state or territory of death 79 registration; and death registration number. Cause of death information in a coded form is also available. For records to 1996, only the code for the underlying cause of death is available. For records from 1997, the codes for the underlying cause of death and all other causes of death mentioned on the death certificate are available. This database exists solely for research linkage purposes, such as gaining epidemiological mortality information on individuals in a particular cohort, or with a known disease state. Ethics approval is required for the NDI to be utilised for any particular research project. National Hospital Morbidity Database Data from the National Hospital Morbidity Database (NHMD) are used in Chapter 7 to examine the number of ovarian cancer–related hospitalisations. The NHMD contains demographic, diagnostic, procedural and duration of stay information on episodes of care for patients admitted to hospital. This annual collection is compiled and maintained by the AIHW, using data supplied by state and territory health authorities. Information from almost all hospitals in Australia is included in the database: public acute and public psychiatric hospitals; private acute and psychiatric hospitals; and private free-standing day hospital facilities. The database is episode-based and it is not possible to count patients individually. Data are held in the NHMD for the years from 1993–94 to 2007–08. However, around 1998–99, hospitals across Australia began to implement a change in the classification system used to code the diagnosis for hospitalisations (i.e. from ICD-9-AM to ICD-10-AM). The first full year for which national data are available using ICD-10-AM is 1999–00. Hence, in Chapter 7, data from 1999–00 onwards are presented. The hospitalisations data presented in this report exclude those hospitalisations for which the care type was reported as newborn, hospital boarder or posthumous organ procurement. Thus, it includes all other admitted care hospitalisations including those with a care type of acute care, rehabilitation care and palliative care. Comprehensive hospital statistics from the NHMD are released by the AIHW on an annual basis (AIHW 2009a). Further information about this data source is available in those reports. National Mortality Database Data from the National Mortality Database are used in Chapter 3 to provide statistical information on mortality in Australia due to ovarian cancer. The registration of deaths has been compulsory since the mid-1850s and this information is registered with the relevant state and territory Registrar of Births, Deaths and Marriages. Since 1906, the Commonwealth Statistician has compiled the information collected by the Registrars and published national death information. The National Mortality Database, which is maintained by the AIHW, currently contains information for all deaths in Australia registered from 1964 to 2006. The information on deaths from the Registrars is coded nationally by the ABS according to rules set forward in various versions of the ICD. Deaths are coded to reflect the underlying cause of death. As well, since 1997, multiple causes of death have been added to the mortality data. Over time, changes have been made to the coding and processing of mortality data and these have affected the comparability of the data. For instance, data holdings on cause of death for 80 1987 to 1996 were manually coded using the ninth revision of the ICD, while the corresponding data for 1997 onwards were coded using ICD-10, using an automated system with slightly different coding rules. The change to the coding and processing of mortality data introduced a break in the time series. Where possible, the ABS has developed comparability factors so that a time series may still be derived (ABS 2009d). As noted in Appendix A, for ovarian cancer, the comparability factor for ICD-9 to ICD-10 is 0.98. Note, though, that due to changes in classifications over time and the way in which diseases were grouped in these classifications, data on deaths due to ovarian cancer are only available from 1968 onwards. Before 1968, the data on deaths due to ovarian cancer were grouped together with deaths due to cancers of ‘other uterine adnexa’ (which are coded separately from C56 in ICD-10). In the National Mortality Database, information on the dates of death is provided in two different ways: one is based on the year in which people died and the other is based on the year in which the deaths were registered. For the purposes of this report, mortality data are shown based on the year of death, except for the most recent year (namely, 2006) where the number of people whose death was registered in that year is used. Previous investigation has shown that the year of death and year of registration, for the most part, coincide. However, in some instances, deaths at the end of each calendar year may be held over until the following year, as are deaths whose cause requires further examination by a coroner (e.g. possible suicides). Thus, year of death information for the latest available year generally underestimates the true number of deaths, with the number of deaths registered in that year being closer to the true value. Population data Throughout this report, population data were used to derive rates of, for example, cancer incidence and mortality. The population data were sourced from the ABS Demography section using the most up-to-date estimates available at the time of analysis. To derive estimates of the resident populations, the ABS uses the 5-yearly Census of Population and Housing data as follows: • all respondents to the Census are coded in relation to their state or territory, statistical local area and postcode of usual residence; overseas visitors are excluded • an adjustment is made for persons missed in the Census (approximately 2%) • Australians temporarily overseas on Census night are added to the usual residence Census count. Estimated resident populations are then updated each year from the census data using indicators of population change, such as births, deaths and net migration. More information is available from the ABS website <www.abs.gov.au>. For the Indigenous comparisons presented in this report (Chapters 2, 3 and 4), the most recently released Indigenous experimental estimated resident populations, as released by the ABS, were used (ABS 2009f). Those estimates were based on the 2006 Census. 81 Appendix D: Additional tables Additional tables for Chapter 2: Incidence of ovarian cancer Table D2.1: Incidence of ovarian cancer by age at diagnosis, 2006 Age group (years) Number of cases Age-specific rate (a) 95% confidence interval <20 13 0.5 0.3–0.8 20–24 10 1.4 0.7–2.5 25–29 13 1.9 1.0–3.2 30–34 16 2.1 1.2–3.5 35–39 33 4.3 3.0–6.0 40–44 45 5.8 4.3–7.8 45–49 99 13.1 10.7–16.0 50–54 128 18.7 15.6–22.2 55–59 137 21.5 18.1–25.5 60–64 119 24.1 20.0–28.9 65–69 162 41.0 34.9–47.8 70–74 120 36.7 30.4–43.8 75–79 119 39.7 32.9–47.5 80–84 115 48.0 39.6–57.6 97 44.5 36.1–54.3 1,226 10.7 10.1–11.4 85+ Total(b) (a) Number of cases per 100,000 females. (b) The rate shown in this row was age-standardised to the Australian population as at 30 June 2001 and is expressed per 100,000 females. Source: Australian Cancer Database, AIHW. 82 Table D2.2: Incidence of ovarian cancer, 1982 to 2006 95% confidence interval 95% confidence interval Per cent of gynaecological (c) cancer cases Per cent of female cancer (d) cases Year Number of cases 1982 833 12.4 11.6–13.3 9.9 9.2–10.6 28.3 3.8 1983 857 12.4 11.6–13.3 9.8 9.1–10.5 28.6 3.8 1984 875 12.5 11.7–13.4 9.8 9.2–10.5 27.9 3.7 1985 881 12.3 11.5–13.2 9.7 9.0–10.4 27.7 3.6 1986 873 11.9 11.1–12.7 9.4 8.7–10.0 27.2 3.5 1987 905 12.1 11.3–12.9 9.5 8.9–10.2 27.3 3.4 1988 895 11.7 10.9–12.5 9.2 8.6–9.9 27.5 3.3 1989 1,015 12.8 12.0–13.6 10.0 9.4–10.7 30.2 3.6 1990 1,006 12.6 11.8–13.4 9.8 9.2–10.4 29.6 3.5 1991 1,013 12.4 11.7–13.2 9.6 9.0–10.3 28.3 3.3 1992 1,036 12.5 11.8–13.3 9.9 9.3–10.5 29.0 3.3 1993 1,077 12.6 11.9–13.4 9.9 9.3–10.5 29.8 3.3 1994 1,064 12.3 11.6–13.1 9.6 9.1–10.3 27.5 3.1 1995 1,079 12.2 11.5–13.0 9.4 8.9–10.0 29.2 3.0 1996 1,076 11.9 11.2–12.6 9.1 8.5–9.7 29.6 3.0 1997 1,057 11.4 10.7–12.1 8.7 8.2–9.3 29.4 2.9 1998 1,123 11.8 11.1–12.5 9.1 8.6–9.7 30.2 3.0 1999 1,135 11.6 11.0–12.3 9.0 8.4–9.5 30.6 3.0 2000 1,137 11.3 10.7–12.0 8.6 8.1–9.2 29.8 2.8 2001 1,125 10.9 10.3–11.6 8.3 7.8–8.8 29.8 2.7 2002 1,228 11.7 11.0–12.3 8.9 8.4–9.4 31.2 2.9 2003 1,128 10.6 9.9–11.2 8.2 7.7–8.7 28.8 2.7 2004 1,267 11.5 10.9–12.2 8.8 8.3–9.4 30.3 2.9 2005 1,219 10.9 10.2–11.5 8.3 7.8–8.8 28.9 2.7 2006 1,226 10.7 10.1–11.4 8.3 7.8–8.8 28.9 2.7 (a) (a) ASR (A) ASR (W) (b) The age-standardised rates were standardised to the Australian population as at 30 June 2001 and are expressed per 100,000 females. (d) The age-standardised rates were standardised using the WHO 2000 World Standard Population and are expressed per 100,000 females. (c) Includes cancers coded in ICD-10 as C51–C58. (b) Includes cancers coded in ICD-10 as C00–C97, D45, D46, D47.1 and D47.3 with the exception of those C44 codes which indicate a basal or squamous cell carcinoma of the skin. Due to changes over time in which cancers were reportable, the data on cancers that begin with an ICD-10 code of ‘D’ may be incomplete before 2003 and data on C44 codes other than basal or squamous cell carcinomas may be incomplete before 2001. Source: Australian Cancer Database, AIHW. 83 Table D2.3: Incidence of ovarian cancer by age at diagnosis, 1982 to 2006 <50 years (a) 95% CI 1982 3.9 1983 50–69 years (a) 95% CI 3.3–4.5 32.7 3.7 3.2–4.3 1984 3.8 1985 70+ years (a) 95% CI 29.7–35.9 35.8 30.7 27.9–33.8 3.3–4.5 30.6 4.1 3.5–4.7 1986 4.0 1987 All ages (a) 95% CI 31.1–41.0 12.4 11.6–13.3 41.3 36.3–46.7 12.4 11.6–13.3 27.7–33.6 41.6 36.7–46.9 12.5 11.7–13.4 28.6 25.8–31.5 42.2 37.3–47.5 12.3 11.5–13.2 3.5–4.6 27.9 25.3–30.8 39.2 34.6–44.2 11.9 11.1–12.7 3.5 3.0–4.0 30.7 27.9–33.7 39.6 35.1–44.6 12.1 11.3–12.9 1988 3.8 3.3–4.3 28.0 25.4–30.9 38.8 34.4–43.7 11.7 10.9–12.5 1989 3.6 3.1–4.1 31.9 29.1–34.9 44.2 39.4–49.3 12.8 12.0–13.6 1990 3.9 3.4–4.5 28.1 25.5–30.9 46.7 41.9–51.9 12.6 11.8–13.4 1991 3.6 3.1–4.1 29.8 27.1–32.7 44.9 40.2–49.9 12.4 11.7–13.2 1992 4.1 3.6–4.6 29.7 27.1–32.6 41.9 37.5–46.6 12.5 11.8–13.3 1993 4.0 3.5–4.5 28.8 26.2–31.6 45.3 40.8–50.2 12.6 11.9–13.4 1994 3.5 3.1–4.0 30.5 27.8–33.3 42.5 38.2–47.2 12.3 11.6–13.1 1995 3.5 3.1–4.0 28.1 25.5–30.8 46.5 42.1–51.3 12.2 11.5–13.0 1996 3.2 2.8–3.7 26.4 24.0–29.1 48.4 43.9–53.2 11.9 11.2–12.6 1997 3.1 2.7–3.6 25.9 23.6–28.5 44.7 40.5–49.3 11.4 10.7–12.1 1998 3.1 2.7–3.5 27.6 25.2–30.2 45.8 41.6–50.4 11.8 11.1–12.5 1999 3.1 2.7–3.6 27.1 24.8–29.7 45.1 41.0–49.5 11.6 11.0–12.3 2000 3.0 2.6–3.4 25.5 23.2–27.9 46.6 42.4–51.0 11.3 10.7–12.0 2001 2.7 2.4–3.2 24.7 22.5–27.0 45.4 41.4–49.7 10.9 10.3–11.6 2002 3.2 2.8–3.7 25.4 23.2–27.8 48.4 44.2–52.8 11.7 11.0–12.3 2003 2.9 2.5–3.3 24.5 22.4–26.8 40.6 36.8–44.7 10.6 9.9–11.2 2004 3.2 2.8–3.7 25.3 23.2–27.6 47.0 43.0–51.4 11.5 10.9–12.2 2005 2.9 2.5–3.3 24.1 22.1–26.3 44.9 40.9–49.1 10.9 10.2–11.5 2006 3.1 2.7–3.5 24.6 22.6–26.8 40.9 37.1–44.9 10.7 10.1–11.4 Year (a) ASR ASR ASR ASR The age-standardised rates were standardised to the Australian population as at 30 June 2001 and are expressed per 100,000 females. Source: Australian Cancer Database, AIHW. 84 Table D2.4: Projected ovarian cancer incidence, 2007 to 2015 Year Projected number of (a) cases 95% prediction interval Agestandardised (b) rate (A) 95% prediction interval Agestandardised (c) rate (W) 95% prediction interval 2007 1,265 1,166–1,363 10.8 10.0–11.6 8.2 7.6–8.9 2008 1,284 1,177–1,390 10.7 9.8–11.5 8.2 7.5–8.8 2009 1,304 1,189–1,419 10.6 9.7–11.5 8.1 7.4–8.8 2010 1,324 1,200–1,449 10.5 9.6–11.4 8.0 7.3–8.7 2011 1,345 1,210–1,480 10.4 9.5–11.4 8.0 7.2–8.7 2012 1,368 1,223–1,514 10.3 9.3–11.4 7.9 7.1–8.7 2013 1,390 1,233–1,548 10.3 9.2–11.3 7.8 7.0–8.7 2014 1,412 1,243–1,581 10.2 9.0–11.3 7.8 6.9–8.6 2015 1,434 1,252–1,616 10.1 8.9–11.3 7.7 6.8–8.6 (a) The projections were based on ovarian cancer incidence data for 1997 to 2006. (b) The age-standardised rates were standardised to the Australian population as at 30 June 2001 and are expressed per 100,000 females. (c) The age-standardised rates were standardised using the WHO 2000 World Standard Population and are expressed per 100,000 females. Source: Australian Cancer Database, AIHW. Table D2.5: Grouping of ovarian cancer histology types Type of ovarian cancer (a) 1: Carcinoma (epithelial tumours) Corresponding ICD-O-3 histology codes All codes included in groups 1.1 to 1.7 1.1: Serous carcinoma 8441, 8442, 8450, 8460–8463, 9014 1.2: Mucinous carcinoma 8470–8490, 9015 1.3: Endometrioid carcinoma 8380–8383, 8560, 8570 1.4: Clear cell carcinoma 8310–8313, 9110 1.5: Adenocarcinoma not otherwise specified 8140–8147, 8170–8190, 8211–8231, 8260, 8384, 8440, 8576 1.6: Other specified carcinoma Includes 8041, 8050, 8070, 8120, 8323, 9000 and all other specified carcinomas 1.7: Unspecified carcinoma 8010–8035 2: Sex cord-stromal tumours 8590–8671, 8810 3: Germ cell tumours 8240–8246, 8340, 9060–9102, 9473, 9501 4: Other specified malignant neoplasm Includes 8800, 8890, 8930, 8935, 8950, 8951, 8980 and all other specified tumours 5: Unspecified malignant neoplasm 8000–8005 (a) For the purposes of this study, the grouping of ovarian cancer histology types was based primarily on those recommended by the International Agency for Research on Cancer (Curado et al. 2007) with additional input from National Breast and Ovarian Cancer Centre. All cases included in each of the groups were coded by state and territory cancer registries as primary site, invasive ovarian cancers. 85 1,329 13 20 172 30 42 17 143 82 149 207 454 1,094 1988–1993 1,290 18 22 161 27 32 15 94 92 163 222 444 1,062 1994–1999 Number of cases 1,499 29 34 216 31 34 47 91 120 202 173 522 1,189 2000–2006 86 100.0 2.8 1.5 11.9 2.9 4.4 1.0 16.7 3.9 11.1 14.2 29.6 81.0 1982–1987 All cases were coded as primary site, invasive ovarian cancers. Appendix Table D2.5 provides a list of the histology types included in each group. Source: Australian Cancer Database, AIHW. (a) 1,105 31 5: Unspecified malignant neoplasm Total 16 131 4: Other specified malignant neoplasm 3: Germ cell tumours 32 49 1.7: Unspecified carcinoma 2: Sex cord-stromal tumours 11 1.6: Other specified carcinoma 185 1.5: Adenocarcinoma NOS 123 1.3: Endometrioid carcinoma 43 157 1.2: Mucinous carcinoma 1.4: Clear cell carcinoma 327 895 1982–1987 1.1: Serous carcinoma 1: Carcinoma (epithelial tumours) Type of ovarian cancer (a) Per cent 100.0 1.0 1.5 12.9 2.3 3.2 1.3 10.8 6.2 11.2 15.6 34.2 82.3 1988–1993 Table D2.6: Incidence by type of ovarian cancer, women aged less than 50 years at diagnosis, 1982–1987 to 2000–2006 100.0 1.4 1.7 12.5 2.1 2.5 1.2 7.3 7.1 12.6 17.2 34.4 82.3 1994–1999 100.0 1.9 2.3 14.4 2.1 2.3 3.1 6.1 8.0 13.5 11.5 34.8 79.3 2000–2006 289 141 692 1.3: Endometrioid carcinoma 1.4: Clear cell carcinoma 1.5: Adenocarcinoma NOS 60 72 4: Other specified malignant neoplasm 5: Unspecified malignant neoplasm 2,737 42 99 12 39 124 23 528 164 287 300 1,119 2,545 1988–1993 2,782 57 83 11 37 90 28 382 182 252 238 1,422 2,594 1994–1999 Number of cases 3,534 67 129 35 35 101 91 387 234 343 240 1,872 3,268 2000–2006 87 100.0 2.8 2.3 0.6 1.9 5.5 0.6 26.7 5.4 11.2 11.2 31.9 92.5 1982–1987 All cases were coded as primary site, invasive ovarian cancers. Appendix Table D2.5 provides a list of the histology types included in each group. Source: Australian Cancer Database, AIHW. (a) 2,591 15 3: Germ cell tumours Total 48 143 2: Sex cord-stromal tumours 1.7: Unspecified carcinoma 16 289 1.2: Mucinous carcinoma 1.6: Other specified carcinoma 826 2,396 1982–1987 1.1: Serous carcinoma 1: Carcinoma (epithelial tumours) Type of ovarian cancer (a) Table D2.7: Incidence by type of ovarian cancer, women aged 50 to 69 years at diagnosis, 1982–1987 to 2000–2006 100.0 1.5 3.6 0.4 1.4 4.5 0.8 19.3 6.0 10.5 11.0 40.9 93.0 1988–1993 Per cent 100.0 2.1 3.0 0.4 1.3 3.2 1.0 13.7 6.5 9.1 8.6 51.1 93.2 1994–1999 100.0 1.9 3.7 1.0 1.0 2.9 2.6 11.0 6.6 9.7 6.8 53.0 92.5 2000–2006 1,528 162 43 9 18 166 18 1,976 166 71 4 19 226 28 490 61 123 166 622 1,716 1988–1993 2,462 223 98 8 23 272 21 591 55 142 167 862 2,110 1994–1999 Number of cases 3,297 454 130 19 11 400 40 692 83 134 173 1,161 2,683 2000–2006 88 100.0 10.6 2.8 0.6 1.2 10.9 1.2 28.3 2.2 7.2 9.9 25.3 84.8 1982–1987 All cases were coded as primary site, invasive ovarian cancers. Appendix Table D2.5 provides a list of the histology types included in each group. Source: Australian Cancer Database, AIHW. (a) Total 5: Unspecified malignant neoplasm 4: Other specified malignant neoplasm 3: Germ cell tumours 2: Sex cord-stromal tumours 1.7: Unspecified carcinoma 1.6: Other specified carcinoma 432 1.5: Adenocarcinoma NOS 110 1.3: Endometrioid carcinoma 33 151 1.2: Mucinous carcinoma 1.4: Clear cell carcinoma 386 1,296 1982–1987 1.1: Serous carcinoma 1: Carcinoma (epithelial tumours) Type of ovarian cancer (a) Per cent 100.0 8.4 3.6 0.2 1.0 11.4 1.4 24.8 3.1 6.2 8.4 31.5 86.8 1988–1993 Table D2.8: Incidence by type of ovarian cancer, women aged 70 years and over at diagnosis, 1982–1987 to 2000–2006 100.0 8.4 3.6 0.2 1.0 11.4 1.4 24.8 3.1 6.2 8.4 31.5 86.8 1994–1999 100.0 13.8 3.9 0.6 0.3 12.1 1.2 21.0 2.5 4.1 5.3 35.2 81.4 2000–2006 Table D2.9: Incidence of ovarian cancer by remoteness area, 2002–2006 Annual average (b) number of cases Total number of cases Age-standardised (c) rate 95% confidence interval Major cities 842 4,211 11.4 11.0–11.7 Inner regional 244 1,218 10.4 9.8–11.0 Outer regional 105 527 10.3 9.4–11.2 22 109 12.2 9.9–14.7 1 4 .. .. 1,214 6,068 11.1 10.8–11.3 Remoteness area (a) Remote and very remote Not stated Total (a) Classified according to the Australian Standard Geographical Classification (ASGC) Remoteness Areas (see Appendix A). (b) Numbers may not sum to the total due to rounding. (c) The age-standardised rates were standardised to the Australian population as at 30 June 2001 and are expressed per 100,000 females. The rates are based on the total number of cases over the 5-year period from 2002–2006. Source: Australian Cancer Database, AIHW. Table D2.10: Incidence of ovarian cancer by socioeconomic status, 2002–2006 Annual average (b) number of cases Total number of cases Age-standardised (c) rate 95% confidence interval 1 (lowest) 254 1,269 11.6 10.9–12.2 2 241 1,204 10.5 9.9–11.1 3 238 1,189 11.2 10.5–11.8 4 226 1,128 10.8 10.2–11.4 5 (highest) 253 1,266 11.3 10.7–11.9 Not stated 2 12 .. .. 1,214 6,068 11.1 10.8–11.3 (a) Socioeconomic status Total (a) Classified using the ABS Index of Relative Socio-economic Disadvantage (see Appendix A). (b) Numbers may not sum to the total due to rounding. (c) The age-standardised rates were standardised to the Australian population as at 30 June 2001 and are expressed per 100,000 females. The rates are based on the total number of cases over the 5-year period from 2002–2006. Source: Australian Cancer Database, AIHW. 89 Table D2.11: Incidence of ovarian cancer by country/region of birth, 2002–2006 Annual average (b) number of cases Total number of cases Age-standardised (c,d) rate 95% confidence (c) interval Americas 14 70 13.7 10.7–17.3 Sub-Saharan Africa 11 55 12.1 9.1–15.8 Southern and Central Asia 15 74 11.8 9.2–14.8 163 814 11.2 10.4–12.0 Oceania and Antarctica, excl. Australia 26 130 10.7 8.9–12.7 South-East Asia 32 161 10.6 9.1–12.4 North Africa and the Middle East 15 75 10.3 8.1–12.9 767 3,833 9.9 .. Southern and Eastern Europe 92 461 9.6 8.7–10.5 North-East Asia 18 92 9.3 7.5–11.4 Not stated 61 303 .. .. 1,214 6,068 10.7 .. (a) Country/region of birth North-West Europe Australia Total (a) Classified according to the Standard Australian Classification of Countries, second edition (see Appendix A). (b) Numbers may not sum to the total due to rounding. (c) Indirectly age-standardised to the 2002–2006 Australian-born population (see Appendix B). (d) The rates are expressed per 100,000 females and based on the total number of cases over the 5-year period from 2002–2006. Countries/regions of birth are ordered in descending order according to the age-standardised rate. Source: Australian Cancer Database, AIHW. 90 Table D2.12: International comparison of estimated incidence of ovarian and related cancers(a), 2002(b) Estimated number of cases Age-standardised (c) rate 95% confidence (d) interval 10,531 13.3 13.0–13.6 320 12.4 11.0–13.8 Western Europe 17,650 11.3 11.1–11.5 Northern America 25,162 10.7 10.6–10.8 Central and Eastern Europe 23,637 10.2 10.1–10.3 Southern Europe 11,649 9.7 9.5–9.9 1,235 8.9 8.4–9.4 12,794 7.7 7.6–7.8 18 7.7 4.1–11.3 4,009 7.2 7.0–7.4 16,880 7.2 7.1–7.3 204,499 6.6 6.6–6.6 Melanesia 153 6.6 5.6–7.6 Micronesia 12 6.0 2.6–9.4 Eastern Africa 4,706 5.8 5.6–6.0 Western Asia 4,058 5.3 5.1–5.5 32,559 5.3 5.2–5.4 Southern Africa 1,003 5.2 4.9–5.5 Western Africa 3,601 4.6 4.4–4.8 838 4.3 4.0–4.6 Eastern Asia 30,617 3.7 3.7–3.7 Middle Africa 1,182 3.3 3.1–3.5 Northern Africa 1,892 2.6 2.5–2.7 Country or region Northern Europe New Zealand Australia South America Polynesia Central America South-Eastern Asia World South-Central Asia Caribbean (a) The data pertain to cancers coded in ICD-10 as C56 and C57.0–C57.4. (b) The data were estimated for 2002 by the International Agency for Research on Cancer (IARC) and are based on data from approximately 3 to 5 years earlier. (c) The age-standardised rates were standardised by the IARC using the Doll et al. (1966) World Standard Population and are expressed per 100,000 females. Countries or regions are ordered in descending order according to the age-standardised rate. (d) The confidence intervals are approximations and were calculated by the AIHW (see Appendix B). Source: Ferlay et al. 2004. 91 Additional tables for Chapter 3: Mortality from ovarian cancer Table D3.1: Mortality from ovarian cancer by age at death, 2006 Age group Number of deaths Age-specific rate (a) 95% confidence interval <20 1 0.0 0.0–0.2 20–24 1 0.1 0.0–0.8 25–29 1 0.1 0.0–0.8 30–34 2 0.3 0.0–1.0 35–39 6 0.8 0.3–1.7 40–44 14 1.8 1.0–3.0 45–49 35 4.6 3.2–6.5 50–54 39 5.7 4.0–7.8 55–59 83 13.1 10.4–16.2 60–64 69 14.0 10.9–17.7 65–69 95 24.0 19.4–29.4 70–74 107 32.7 26.8–39.5 75–79 124 41.4 34.4–49.3 80–84 112 46.7 38.5–56.3 85+ 106 48.7 39.9–58.9 795 6.7 6.2–7.2 (b) Total (a) Number of deaths per 100,000 females. (b) The rate shown in this row was age-standardised to the Australian population as at 30 June 2001 and is expressed per 100,000 females. Source: National Mortality Database, AIHW. Table D3.2: Mortality from ovarian cancer, 1968 to 2006 Number of Age-standardised 95% confidence (a) interval 451 9.1 1969 434 1970 Age-standardised 95% confidence (b) interval 8.2–10.0 7.1 6.4–7.8 8.6 7.8–9.4 6.6 6.0–7.3 433 8.3 7.6–9.2 6.5 5.9–7.2 1971 436 8.1 7.3–8.9 6.2 5.6–6.8 1972 484 8.8 8.0–9.6 6.8 6.2–7.4 1973 501 8.9 8.1–9.7 6.8 6.2–7.4 1974 493 8.6 7.9–9.4 6.7 6.1–7.3 1975 497 8.5 7.7–9.3 6.5 6.0–7.2 Year deaths 1968 rate (A) rate (W) (continued) 92 Table D3.2 (continued): Mortality from ovarian cancer, 1968 to 2006 Number of Age-standardised 95% confidence (a) interval Age-standardised 95% confidence (b) interval 513 8.7 7.9–9.5 6.6 6.0–7.2 1977 545 9.0 8.2–9.8 6.9 6.3–7.5 1978 533 8.7 7.9–9.4 6.4 5.9–7.0 1979 527 8.4 7.7–9.1 6.4 5.8–6.9 1980 559 8.8 8.0–9.5 6.5 6.0–7.1 1981 549 8.4 7.7–9.1 6.4 5.8–6.9 1982 575 8.6 7.9–9.3 6.4 5.9–7.0 1983 583 8.5 7.8–9.2 6.4 5.9–6.9 1984 624 8.8 8.1–9.6 6.6 6.1–7.2 1985 549 7.6 7.0–8.3 5.7 5.2–6.2 1986 623 8.5 7.8–9.2 6.3 5.8–6.9 1987 612 8.2 7.5–8.8 6.1 5.6–6.6 1988 590 7.6 7.0–8.3 5.7 5.3–6.2 1989 624 7.9 7.3–8.5 5.8 5.4–6.3 1990 705 8.8 8.1–9.5 6.5 6.0–7.0 1991 696 8.4 7.8–9.0 6.2 5.7–6.7 1992 650 7.7 7.1–8.3 5.7 5.2–6.2 1993 690 7.9 7.3–8.5 5.7 5.3–6.2 1994 715 8.2 7.6–8.9 6.1 5.6–6.6 1995 702 7.8 7.2–8.4 5.6 5.2–6.1 1996 768 8.3 7.8–9.0 6.0 5.6–6.5 1997 729 7.7 7.1–8.3 5.5 5.1–5.9 1998 750 7.7 7.2–8.3 5.5 5.1–5.9 1999 731 7.3 6.8–7.8 5.2 4.8–5.6 2000 780 7.6 7.1–8.1 5.4 5.0–5.8 2001 837 7.9 7.4–8.4 5.6 5.2–6.0 2002 842 7.8 7.3–8.4 5.6 5.2–6.0 2003 781 7.1 6.6–7.6 5.1 4.7–5.5 2004 852 7.6 7.1–8.1 5.4 5.1–5.8 2005 888 7.6 7.1–8.1 5.3 5.0–5.7 2006 795 6.7 6.2–7.2 4.7 4.4–5.1 Year deaths 1976 rate (A) rate (W) (a) The age-standardised rates were standardised to the Australian population as at 30 June 2001 and are expressed per 100,000 females. (b) The age-standardised rates were standardised using the WHO 2000 World Standard Population and are expressed per 100,000 females. Note: The 1968 to 1996 data were adjusted from earlier ICD standards to ICD-10 standards using a factor of 0.98. Source: National Mortality Database, AIHW. 93 Table D3.3: Mortality from ovarian cancer by age at death, 1982 to 2006 <50 years (a) 95% CI 1982 1.7 1983 50–69 years 70+ years (a) 95% CI (a) 95% CI 1.3–2.2 20.7 18.4–23.2 36.6 1.2 0.9–1.6 22.3 19.9–25.0 1984 1.4 1.1–1.8 21.6 1985 0.9 0.6–1.2 1986 1.7 1987 All ages (a) 95% CI 31.8–41.9 8.6 7.9–9.3 36.3 31.6–41.5 8.5 7.8–9.2 19.2–24.1 39.4 34.6–44.6 8.8 8.1–9.6 20.1 17.8–22.5 33.5 29.2–38.3 7.6 7.0–8.3 1.3–2.1 18.8 16.6–21.2 39.7 35.0–44.8 8.5 7.8–9.2 1.5 1.2–1.9 20.3 18.0–22.7 34.2 29.9–38.9 8.2 7.5–8.8 1988 1.4 1.1–1.7 18.2 16.1–20.5 34.2 30.0–38.8 7.6 7.0–8.3 1989 1.2 0.9–1.6 18.6 16.5–20.9 37.2 32.9–42.0 7.9 7.3–8.5 1990 1.5 1.2–1.8 19.5 17.3–21.8 43.4 38.7–48.4 8.8 8.1–9.5 1991 1.3 1.0–1.7 18.9 16.8–21.2 41.0 36.6–45.8 8.4 7.8–9.0 1992 1.2 0.9–1.5 18.1 16.1–20.4 36.2 32.1–40.6 7.7 7.1–8.3 1993 1.0 0.7–1.2 17.5 15.6–19.7 41.3 37.0–46.0 7.9 7.3–8.5 1994 1.3 1.0–1.6 19.1 17.0–21.4 39.1 35.0–43.6 8.2 7.6–8.9 1995 1.2 0.9–1.5 16.8 14.8–18.8 40.4 36.3–44.9 7.8 7.2–8.4 1996 1.2 0.9–1.4 17.7 15.7–19.9 44.7 40.4–49.4 8.3 7.8–9.0 1997 1.0 0.8–1.3 15.6 13.8–17.6 42.9 38.8–47.4 7.7 7.1–8.3 1998 0.8 0.6–1.0 16.8 15.0–18.9 42.4 38.4–46.8 7.7 7.2–8.3 1999 0.9 0.7–1.2 14.6 12.9–16.5 41.5 37.6–45.8 7.3 6.8–7.8 2000 0.9 0.7–1.2 15.7 14.0–17.6 42.5 38.5–46.7 7.6 7.1–8.1 2001 0.9 0.7–1.2 15.5 13.8–17.4 46.5 42.4–50.9 7.9 7.4–8.4 2002 0.9 0.7–1.1 16.8 15.0–18.7 43.1 39.2–47.3 7.8 7.3–8.4 2003 1.0 0.8–1.3 14.4 12.8–16.1 39.0 35.3–42.9 7.1 6.6–7.6 2004 0.8 0.6–1.0 16.0 14.3–17.8 43.0 39.1–47.1 7.6 7.1–8.1 2005 0.9 0.7–1.1 14.6 13.1–16.3 45.2 41.3–49.4 7.6 7.1–8.1 2006 0.8 0.6–1.0 12.7 11.3–14.3 40.3 36.6–44.3 6.7 6.2–7.2 Year (a) ASR ASR ASR ASR The age-standardised rates were standardised to the Australian population as at 30 June 2001 and are expressed per 100,000 females. The 1982 to 1996 data were adjusted from ICD-9 to ICD-10 standards using a factor of 0.98. Source: National Mortality Database, AIHW. 94 Table D3.4: Mortality from ovarian cancer by remoteness area, 2002–2006 Average annual (b) number of deaths Total number of cases Age-standardised (c) rate 95% confidence interval Major cities 549 2,744 7.2 6.9–7.4 Inner regional 185 926 7.6 7.1–8.1 Outer regional 82 408 7.8 7.1–8.6 Remote and very remote 15 76 9.6 7.5–12.0 1 4 .. .. 832 4,158 7.3 7.1–7.6 Remoteness area (a) Not stated Total (a) Classified using the ABS Australian Standard Geographical Classification (ASGC) Remoteness Areas (see Appendix A). (b) Numbers may not sum to the total due to rounding. (c) The age-standardised rates were standardised to the Australian population as at 30 June 2001 and are expressed per 100,000 females. The rates are based on the total number of cases over the 5-year period from 2002–2006. Source: National Mortality Database, AIHW. Table D3.5: Mortality from ovarian cancer by socioeconomic status, 2002–2006 Average annual number of (b) deaths Total number of cases 1 (Lowest) 164 2 Age-standardised (c) rate 95% confidence interval 819 7.2 6.7–7.7 185 926 7.7 7.2–8.2 3 156 779 7.1 6.6–7.6 4 143 716 6.8 6.3–7.3 5 (Highest) 180 899 7.8 7.3–8.3 4 19 .. .. 832 4,158 7.3 7.1–7.6 (a) Socioeconomic status Not stated Total (a) Classified using the ABS Index of Socio-economic Disadvantage (see Appendix A). (b) Numbers may not sum to the total due to rounding. (c) The age-standardised rates were standardised to the Australian population as at 30 June 2001 and are expressed per 100,000 females. The rates are based on the total number of cases over the 5-year period from 2002–2006. Source: National Mortality Database, AIHW. 95 Table D3.6: Mortality from ovarian cancer by country/region of birth, 2002–2006 Annual average number of (b) deaths Total number of cases Agestandardised (c,d) rate 95% confidence (c) interval Sub-Saharan Africa 8 42 10.6 7.6–14.3 North-West Europe 128 640 8.4 7.7–9.0 10 50 7.4 5.5–9.8 9 43 7.4 5.3–9.9 75 377 7.3 6.6–8.1 553 2,767 7.2 .. Oceania and Antarctica, excl. Australia 15 74 7.2 5.7–9.0 North-East Asia 10 52 6.0 4.5–7.8 South-East Asia 15 74 6.0 4.7–7.5 Americas 5 26 5.9 3.8–8.6 Inadequately described, not stated or unknown 3 13 .. .. 832 4,158 7.3 .. (a) Country/region of birth North Africa and the Middle East Southern and Central Asia Southern and Eastern Europe Australia Total (a) Classified according to the Standard Australian Classification of Countries, second edition (see Appendix A). (b) Numbers may not sum to the total due to rounding. (c) Indirectly age-standardised to the 2002–2006 Australian-born population (see Appendix B). (d) The rates are expressed per 100,000 females and based on the total number of cases over the 5-year period from 2002–2006. Countries/regions of birth are ordered in descending order according to the age-standardised rate. Source: National Mortality Database, AIHW. 96 Table D3.7: International comparison of estimated mortality from ovarian and related cancers(a), 2002(b) Estimated number of deaths Age-standardised (c) rate 95% confidence (d) interval 7,188 7.9 7.7–8.1 184 6.4 5.5–7.3 Western Europe 12,162 6.3 6.2–6.4 Northern America 16,005 6.1 6.0–6.2 Central and Eastern Europe 15,243 6.0 5.9–6.1 772 4.9 4.6–5.2 6,431 4.5 4.4–4.6 11 4.4 1.8–7.0 Eastern Africa 3,340 4.1 4.0–4.2 South-Eastern Asia 9,262 4.1 4.0–4.2 124,860 4.0 4.0–4.0 87 3.9 3.1–4.7 22,813 3.8 3.8–3.8 South America 6,108 3.7 3.6–3.8 Central America 1,901 3.6 3.4–3.8 6 3.5 0.7–6.3 Western Asia 2,484 3.4 3.3–3.5 Western Africa 2,551 3.2 3.1–3.3 Southern Africa 612 3.2 2.9–3.5 Caribbean 496 2.6 2.4–2.8 Middle Africa 841 2.3 2.1–2.5 1,343 1.8 1.7–1.9 15,019 1.8 1.8–1.8 Region or country Northern Europe New Zealand Australia Southern Europe Polynesia World Melanesia South-Central Asia Micronesia Northern Africa Eastern Asia (a) The data pertain to cancers coded in ICD-10 as C56 and C57.0–C57.4. (b) The data were estimated for 2002 by the International Agency for Research on Cancer (IARC) and are based on data from approximately 3 to 5 years earlier (c) The age-standardised rates were standardised by the IARC using the Doll et al. (1966) World Standard Population and are expressed per 100,000 females. Countries or regions are ordered in descending order according to the age-standardised rate. (d) The confidence intervals are approximations and were calculated by the AIHW (see Appendix B). Source: Ferlay et al. 2004. 97 Additional tables for Chapter 4: Survival after a diagnosis of ovarian cancer Table D4.1: Relative survival, 10 most commonly diagnosed cancers(a), females, 1998–2004 1-year relative survival Cancer type (ICD-10 codes) 5-year relative survival RS (%) 95% CI RS (%) 95% CI Breast (C50) 97.2 97.1–97.4 87.8 87.5–88.1 Bowel (C18–C20) 80.0 79.5–80.4 62.4 61.8–63.1 Melanoma of skin (C4) 98.4 98.2–98.6 94.1 93.6 –94.6 Lung (C33–C34) 38.8 38.1–39.4 14.0 13.4 –14.5 Uterus, body (C54) 92.6 92.1–93.2 82.1 81.1–83.0 Non-Hodgkin lymphoma (C82–C85, C96) 77.5 76.7–78.3 62.6 61.5–63.6 Unknown primary site (C26, C39, C76, C80) 15.8 15.2–16.4 7.6 7.1–8.0 Ovary (C56) 73.2 72.2–74.2 39.8 38.6–41.0 Thyroid (C73) 96.9 96.4–97.3 95.3 94.5–96.0 Leukaemia (C91–C95) 65.7 64.6–66.8 47.3 46.0–48.6 78.7 78.5–78.8 64.1 63.9–64.3 All cancers (b) (a) Determined by most commonly diagnosed cancers in 2004 and ordered accordingly. Excludes non-melanoma skin cancer (C44). (b) Includes cancers coded in ICD-10 as C00–C97 (except for C44), D45, D46, D47.1 and D47.3. Source: AIHW, CA & AACR 2008; Australian Cancer Database, AIHW. Table D4.2: Relative survival by age at diagnosis, ovarian cancer, 2000–2006 Age at diagnosis (years) 1-year relative survival Number of cases (a) 5-year relative survival RS (%) 95% CI RS (%) 95% CI <30 240 95.9 92.4–97.8 86.4 81.0–90.3 30–39 321 91.1 87.4–93.7 70.6 64.8–75.6 40–49 938 91.5 89.5–93.1 61.0 57.5–64.4 50–59 1,712 88.7 87.1–90.2 49.8 47.1–52.4 60–69 1,812 81.4 79.5–83.1 41.1 38.5–43.6 70–79 1,842 60.4 58.2–62.6 23.5 21.3–25.7 80+ 1,350 35.8 33.4–38.2 14.8 12.5–17.3 All ages 8,215 73.7 72.7–74.7 40.0 38.8–41.2 (a) Equals the total number of cases diagnosed in the period considered. Source: Australian Cancer Database, AIHW. 98 Table D4.3: Relative survival by period of diagnosis, ovarian cancer, 1982–1987 to 2000–2006 Years after diagnosis 1982–1987 1988–1993 1994–1999 2000–2006 RS (%) 95% CI RS (%) 95% CI RS (%) 95% CI RS (%) 95% CI 1 63.1 61.8–64.4 67.4 66.2–68.6 72.0 70.9–73.1 73.7 72.7–74.7 2 46.1 44.7–47.5 51.9 50.6–53.2 57.4 56.1–58.6 60.0 58.9–61.0 3 38.6 37.2–40.0 43.8 42.5–45.1 47.9 46.6–49.1 51.0 49.8–52.1 4 34.8 33.5–36.2 39.5 38.2–40.8 42.0 40.8–43.3 44.3 43.1–45.4 5 33.0 31.6–34.3 36.8 35.5–38.1 38.8 37.5–40.0 40.0 38.8–41.2 6 31.5 30.1–32.8 34.6 33.3–35.9 36.3 35.1–37.6 37.0 35.7–38.2 7 30.1 28.8–31.5 33.5 32.2–34.7 34.7 33.4–35.9 34.8 33.5–36.2 8 29.3 28.0–30.7 32.4 31.1–33.7 33.3 32.1–34.5 32.8 31.3–34.3 9 28.6 27.2–29.9 31.5 30.3–32.8 32.3 31.1–33.6 31.2 29.3–33.1 10 28.2 26.9–29.6 30.6 29.3–31.9 31.6 30.4–32.9 .. .. 11 27.9 26.5–29.2 30.2 28.9–31.5 31.1 29.9–32.4 .. .. 12 27.2 25.9–28.6 29.8 28.5–31.1 30.5 29.2–31.8 .. .. 13 27.2 25.8–28.6 29.3 28.0–30.6 30.3 29.0–31.7 .. .. 14 26.9 25.5–28.3 29.0 27.7–30.4 29.8 28.4–31.2 .. .. 15 26.5 25.2–28.0 28.6 27.3–29.9 29.1 27.4–30.8 .. .. 16 26.5 25.1–27.9 28.2 26.9–29.6 .. .. .. .. 17 26.2 24.8–27.7 27.9 26.6–29.3 .. .. .. .. 18 25.8 24.4–27.3 27.7 26.3–29.1 .. .. .. .. 19 25.9 24.4–27.4 27.6 26.1–29.0 .. .. .. .. 20 26.0 24.5–27.5 27.1 25.5–28.6 .. .. .. .. 21 25.7 24.2–27.2 26.7 24.8–28.7 .. .. .. .. 22 25.7 24.2–27.3 .. .. .. .. .. .. 23 25.8 24.2–27.4 .. .. .. .. .. .. 24 25.9 24.3–27.6 .. .. .. .. .. .. 25 26.0 24.4–27.8 .. .. .. .. .. .. 26 26.1 24.3–28.0 .. .. .. .. .. .. 27 26.2 24.1–28.4 .. .. .. .. .. .. Source: Australian Cancer Database, AIHW. 99 627 1,185 1,383 1,027 40–49 50–59 60–69 70–79 33.0 31.6–34.3 10.8–19.3 15.9–21.0 24.6–29.4 32.9–38.4 40.8–48.6 60.3–71.5 75.1–86.2 95% confidence interval 5,964 609 1,307 1,602 1,120 771 329 226 Number of (a) cases Equals the total number of diagnosed cases in the period considered. 5,114 14.7 18.4 27.0 35.6 44.7 66.2 81.4 Relative survival (%) Source: Australian Cancer Database, AIHW. (a) All ages 419 281 30–39 80+ 192 Number of (a) cases <30 Age at diagnosis (years) 1982–1987 36.8 13.4 22.7 29.2 44.2 51.3 71.0 85.6 Relative survival (%) 1988–1993 100 35.5–38.1 10.4–16.9 20.3–25.2 26.9–31.5 41.2–47.1 47.6–54.8 65.7–75.6 80.3–89.6 95% confidence interval 6,465 863 1,542 1,434 1,338 770 298 220 Number of (a) cases 38.8 11.1 24.2 37.1 45.5 59.0 70.3 85.6 Relative survival (%) 1994–1999 Table D4.4: Five-year relative survival by age at diagnosis, ovarian cancer, 1982–1987 to 2000–2006 37.5–40.0 8.8–13.7 22.0–26.6 34.5–39.7 42.8–48.2 55.4–62.4 64.8–75.2 80.2–89.6 95% confidence interval 8,215 1,350 1,842 1,812 1,712 938 321 240 Number of (a) cases 40.0 14.8 23.5 41.1 49.8 61.0 70.6 86.4 Relative survival (%) 2000–2006 38.8–41.2 12.5–17.3 21.3–25.7 38.5–43.6 47.1–52.4 57.5–64.4 64.8–75.6 81.0–90.3 95% confidence interval (a) 337 512 1.4: Clear cell carcinoma 1.5: Adenocarcinoma NOS 39.0 35.5 30.5 76.4 75.7 27.9 44.5 19.9 58.8 63.9 53.1 34.5 38.5 RS (%) 38.0–39.9 29.2–42.0 25.7–35.5 64.0–85.4 67.5–82.3 23.7–32.2 36.0–52.7 18.2–21.8 54.9–62.5 60.9–66.8 49.9–56.1 33.2–35.9 37.5–39.5 95% CI 8,959 837 342 40 71 940 107 2,197 232 509 657 3,027 7,669 Source: Australian Cancer Database, AIHW. 101 19.5 4.0 18.5 40.7 67.0 8.2 26.1 7.3 49.6 51.5 36.9 24.0 20.8 RS (%) 70+ years Number of (b) cases All cases were coded as primary site, invasive ovarian cancers. Appendix Table D2.5 provides a list of the histology types included in each group. 11,586 205 371 73 159 437 158 1,987 721 1,171 1,067 5,237 10,778 Number of (b) cases Equals the total number of diagnosed cases in the period considered. 62.1–64.8 61.8–81.2 36.8–57.3 88.6–93.1 76.2–89.9 46.7–62.4 38.8–60.1 33.0–41.4 57.2–67.8 70.3–77.4 71.0–77.4 50.1–54.9 57.1–60.2 95% CI (b) 63.5 72.8 47.4 91.1 84.3 54.9 49.9 37.2 62.7 74.0 74.4 52.5 58.7 RS (%) 50–69 years (a) 5,213 85 5: Unspecified malignant neoplasm Total 92 680 3: Germ cell tumours 4: Other specified malignant neoplasm 120 154 2: Sex cord-stromal tumours 1.7: Unspecified carcinoma 90 637 1.3: Endometrioid carcinoma 1.6: Other specified carcinoma 759 1,747 4,236 Number of (b) cases 1.2: Mucinous carcinoma 1.1: Serous carcinoma 1: Carcinoma (epithelial tumours) Type of ovarian cancer <50 years Table D4.5: Five-year relative survival by type of ovarian cancer and age at diagnosis, 1982–2006 18.6–20.5 2.9–5.4 14.1–23.5 23.3–59.4 51.6–80.7 6.5–10.1 17.1–36.6 6.2–8.5 41.7–57.4 46.0–56.9 32.6–41.2 22.3–25.8 19.8–21.9 95% CI 25,758 1,127 805 793 350 1,531 355 4,696 1,290 2,317 2,483 10,011 22,683 Number of (b) cases 37.7 13.8 27.5 87.5 77.0 18.4 40.6 16.0 58.3 64.2 55.8 34.8 36.7 RS (%) All ages 37.1–38.3 12.0–15.8 24.3–30.8 84.9–89.8 71.6–81.7 16.5–20.4 35.0–46.2 14.9–17.1 55.3–61.1 62.0–66.3 53.7–57.9 33.8–35.8 36.1–37.4 95% CI Table D4.6: International comparison of mortality-to-incidence ratios for ovarian and related cancers, 2002 Region or country Mortality: ASR Incidence: ASR Mortality-to-incidence ratio South-Central Asia 3.8 5.3 0.72 Eastern Africa 4.1 5.8 0.71 Middle Africa 2.3 3.3 0.70 Western Africa 3.2 4.6 0.70 Northern Africa 1.8 2.6 0.69 Western Asia 3.4 5.3 0.64 Southern Africa 3.2 5.2 0.62 World 4.0 6.6 0.61 Caribbean 2.6 4.3 0.60 Northern Europe 7.9 13.3 0.59 Melanesia 3.9 6.6 0.59 Central and Eastern Europe 6.0 10.2 0.59 Micronesia 3.5 6.0 0.58 Polynesia 4.4 7.7 0.57 Northern America 6.1 10.7 0.57 South-Eastern Asia 4.1 7.2 0.57 Western Europe 6.3 11.3 0.56 Australia 4.9 8.9 0.55 New Zealand 6.4 12.4 0.52 Central America 3.6 7.2 0.50 Eastern Asia 1.8 3.7 0.49 South America 3.7 7.7 0.48 Southern Europe 4.5 9.7 0.46 Notes 1. The data pertain to cancers coded in ICD-10 as C56 and C57.0–C57.4 (see Appendix B for more details). 2. The mortality and incidence rates were derived from estimates of the number of new ovarian and related cancer cases and deaths for 2002; those estimates were based on data from approximately 3 to 5 years earlier. 3. The age-standardised rates were standardised by the IARC using the Doll et al. (1966) World Standard Population and are expressed per 100,000 females. 4. The mortality-to-incidence ratio equals the age-standardised mortality rate divided by the age-standardised incidence rate. Source: Ferlay et al. 2004. 102 Additional table for Chapter 6: Burden of disease due to ovarian cancer Table D6.1: Leading cancer causes of burden of disease by age group, females, 2003 Age group (years) Breast cancer Lung cancer Bowel cancer Pancreas cancer Ovarian and related cancers Total from all cancers Number (Disability-adjusted life years (DALYs)) Ovarian and related cancers as a % of all cancers <1 0 0 0 1 0 99 0.0 1–4 0 0 0 0 0 417 0.0 5–9 0 0 1 0 2 605 0.3 10–14 0 1 1 0 8 456 1.8 15–19 0 0 11 0 70 804 8.7 20–24 25 30 41 0 94 1,122 8.4 25–29 260 33 78 2 101 2,116 4.8 30–34 1,132 90 370 3 278 3,855 7.2 35–39 2,680 208 473 35 308 6,459 4.8 40–44 4,971 1,042 963 422 465 11,651 4.0 45–49 6,878 1,553 1,671 426 898 16,642 5.4 50–54 8,382 3,031 2,240 659 1,089 22,157 4.9 55–59 9,135 3,926 2,533 1,186 1,619 26,676 6.1 60–64 7,618 4,965 3,364 1,439 1,672 28,003 6.0 65–69 5,835 4,813 3,599 1,711 1,395 27,127 5.1 70–74 4,610 5,125 3,913 1,312 1,236 26,702 4.6 75–79 4,102 4,890 4,028 1,821 1,492 26,951 5.5 80–84 2,686 2,735 3,112 1,267 801 18,896 4.2 85–89 1,524 1,121 1,779 728 338 10,140 3.3 90–94 554 271 654 200 108 3,445 3.1 95–99 115 36 124 33 19 653 2.9 14 5 7 1 0 58 0.0 60,520 33,876 28,962 11,246 11,994 235,034 5.1 100+ (a) All ages (a) Values may not sum to the total due to rounding. Source: Begg et al. 2007b. 103 Additional tables for Chapter 7: Hospitalisations for ovarian cancer Table D7.1: Hospitalisations for ovarian cancer by age group, 2007–08 Age group (years) Number of hospitalisations (a) 95% confidence interval Age-specific rate <20 120 0.04 0.04–0.05 20–24 139 0.19 0.16–0.22 25–29 37 0.05 0.04–0.07 30–34 180 0.24 0.21–0.28 35–39 229 0.29 0.25–0.33 40–44 449 0.59 0.53–0.64 45–49 806 1.04 0.97–1.11 50–54 1,441 2.04 1.94–2.15 55–59 2,177 3.39 3.25–3.54 60–64 2,384 4.35 4.18–4.53 65–69 2,208 5.33 5.11–5.56 70–74 1,635 4.82 4.59–5.06 75–79 1,266 4.26 4.02–4.50 80–84 846 3.47 3.24–3.71 85+ 360 1.53 1.38–1.70 14,277 1.22 1.20–1.24 (b) Total (a) (b) Number of cases per 1,000 females. The rate shown in this row was age-standardised to the Australian population as at 30 June 2001; it is expressed per 1,000 females. Source: National Hospital Morbidity Database, AIHW. Table D7.2: Hospitalisations for ovarian cancer by same-day and overnight status, 1999–00 to 2007–08 Same-day hospitalisations Year Number Overnight hospitalisations (a) 95% CI Number ASR ASR Total hospitalisations (a) 95% CI Number (a) 95% CI ASR 1999–00 7,434 0.77 0.76–0.79 3,170 0.32 0.31–0.34 10,604 1.10 1.08–1.12 2000–01 7,913 0.80 0.78–0.82 3,063 0.31 0.30–0.32 10,976 1.11 1.09–1.13 2001–02 9,095 0.90 0.88–0.92 2,978 0.29 0.28–0.30 12,073 1.19 1.17–1.21 2002–03 8,794 0.85 0.84–0.87 2,646 0.25 0.24–0.26 11,440 1.11 1.09–1.13 2003–04 9,407 0.89 0.87–0.91 2,710 0.25 0.24–0.26 12,117 1.14 1.12–1.16 2004–05 9,955 0.92 0.90–0.94 2,631 0.24 0.23–0.25 12,586 1.16 1.14–1.18 2005–06 10,317 0.93 0.91–0.95 2,942 0.26 0.25–0.27 13,259 1.19 1.17–1.22 2006–07 10,940 0.96 0.94–0.98 3,132 0.27 0.26–0.28 14,072 1.23 1.21–1.26 2007–08 11,296 0.97 0.95–0.99 2,981 0.25 0.25–0.26 14,277 1.22 1.20–1.24 (a) The age-standardised rates were standardised to the Australian population as at 30 June 2001 and are expressed per 1,000 females. Source: National Hospital Morbidity Database, AIHW. 104 Table D7.3: Hospitalisations for ovarian cancer by age group, 1999–00 to 2007–08 <50 years 50–69 years (a) 95% CI 1999–00 0.28 2000–01 70+ years (a) (a) 95% CI 95% CI 0.27–0.29 3.10 3.02–3.19 3.19 0.28 0.27–0.29 2.97 2.89–3.05 2001–02 0.26 0.25–0.27 3.51 2002–03 0.26 0.25–0.27 2003–04 0.26 2004–05 All ages (a) 95% CI 3.08–3.31 1.10 1.08–1.12 3.59 3.48–3.72 1.11 1.09–1.13 3.43–3.60 3.52 3.40–3.64 1.19 1.17–1.21 3.21 3.13–3.29 3.20 3.09–3.31 1.11 1.09–1.13 0.25–0.28 3.26 3.18–3.34 3.50 3.38–3.62 1.14 1.12–1.16 0.30 0.28–0.31 3.23 3.15–3.31 3.51 3.39–3.63 1.16 1.14–1.18 2005–06 0.29 0.28–0.30 3.34 3.26–3.42 3.67 3.55–3.79 1.19 1.17–1.22 2006–07 0.27 0.26–0.29 3.55 3.47–3.63 3.79 3.67–3.91 1.23 1.21–1.26 2007–08 0.26 0.25–0.27 3.49 3.41–3.56 3.90 3.78–4.02 1.22 1.20–1.24 Year (a) ASR ASR ASR ASR The age-standardised rates were standardised to the Australian population as at 30 June 2001 and are expressed per 1,000 females. Source: National Hospital Morbidity Database, AIHW. Table D7.4: Average length of stay (ALOS) for ovarian cancer-related hospitalisations by same-day and overnight status, 1999–00 to 2007–08 ALOS of same-day hospitalisations (days) ALOS of overnight hospitalisations (days) Total ALOS (days) 1999–00 1.0 7.3 2.9 2000–01 1.0 7.5 2.8 2001–02 1.0 8.2 2.8 2002–03 1.0 8.3 2.7 2003–04 1.0 8.7 2.7 2004–05 1.0 8.8 2.6 2005–06 1.0 7.8 2.5 2006–07 1.0 7.7 2.5 2007–08 1.0 7.6 2.4 Year Source: National Hospital Morbidity Database, AIHW. 105 Additional table for Chapter 8: Expenditure on ovarian cancer Table D8.1: Hospital admitted patient services expenditure and number of hospitalisations for ovarian and related cancers by age group, 2004–05 Age group (years) Hospital admitted patient expenditure ($ million) Per cent Number of admitted patient hospitalisations Expenditure per hospitalisation ($) <35 1 3.6 131 6,860 35–44 2 6.0 210 7,237 45–54 4 16.2 546 7,506 54–64 6 23.4 872 6,790 65–74 6 23.4 841 7,029 75–84 5 20.8 588 8,945 85+ 2 6.5 159 10,379 25 100.0 3,347 7,547 Total Note: Data pertain to those hospitalisations for which the principal diagnosis was ovarian and related cancers (i.e. codes of C56 and C57.0–C57.4 in ICD-10). Does not pertain to hospitalisations for which ovarian and related cancers was an additional diagnosis, with the principal diagnosis relating specifically to the type of cancer treatment or care received. Source: Disease Expenditure Database, AIHW. 106 Appendix E: Stage at diagnosis A number of staging systems are used to classify ovarian cancers. These systems are described in this appendix. FIGO staging system The International Federation of Gynecology and Obstetrics (FIGO) system is the conventional measure used to stage ovarian cancer, as well as other types of gynaecological cancers, with staging decisions mainly based on findings from surgical exploration. Ovarian tumours are given a value from I to IV, with each of the first three stages divided further into three sub-stages (Odicino et al. 2008; Pecorelli et al. 2000). Table E.1 provides a description of each of these stages and sub-stages. Table E.1: Carcinoma of the ovary: FIGO nomenclature (Rio de Janeiro 1998) Stage Description Stage I Growth limited to the ovaries Ia Growth limited to one ovary: no ascites present containing malignant cells. No tumour on the external surface; capsule intact Ib Growth limited to both ovaries: no ascites present containing malignant cells. No tumour on the external surfaces; capsules intact Ic (a) Stage II Growth involving one or both ovaries with pelvic extension IIa Extension and/or metastases to the uterus and/or tubes IIb Extension to other pelvic tissues IIc Tumour either Stage IIa or IIb, but with tumour on surface of one or both ovaries, or with capsule(s) ruptured, or with ascites present containing malignant cells, or with positive peritoneal washings Stage III Tumour involving one or both ovaries with histologically-confirmed peritoneal implants outside the pelvis and/or positive retroperitoneal or inguinal nodes. Superficial liver metastases equals Stage III. Tumour is limited to the true pelvis, but with histologically-proven malignant extension to small bowel or omentum IIIa Tumour grossly limited to the true pelvis, with negative nodes, but with histologically-confirmed microscopic seeding of abdominal peritoneal surfaces, or histologic proven extension to small bowel or mesentery IIIb Tumour of one or both ovaries with histologically confirmed implants, peritoneal metastasis of abdominal peritoneal surfaces, none exceeding 2 cm in diameter: nodes are negative IIIc Peritoneal metastasis beyond the pelvis N2 cm in diameter and/or positive retroperitoneal or inguinal nodes Stage IV (a) Tumour either Stage Ia or Ib, but with tumour on surface of one or both ovaries, or with capsule ruptured, or with ascites present containing malignant cells, or with positive peritoneal washings Growth involving one or both ovaries with distant metastases. If pleural effusion is present, there must be positive cytology to allot a case to Stage IV. Parenchymal liver metastasis equals Stage IV In order to evaluate the impact on prognosis of the different criteria for allotting cases to Stage Ic or IIc, it would be of value to know if rupture of the capsule was spontaneous or caused by the surgeon, and if the source of malignant cells detected was peritoneal washings or ascites. Source: Heintz et al. 2006. 107 TNM staging system Ovarian cancers can also be staged according to the TNM system which was initially developed by the International Union Against Cancer (UICC). This staging system describes the size of the primary tumour (T), the absence or presence of metastasis to nearby lymph nodes (N) and the absence or presence of distant metastasis (M). The TNM system is considered to be virtually identical to the FIGO system (ACS 2009; Pecorelli et al. 2000). Further information about the TNM staging system can be found on the UICC website (UICC 2009). Summary staging system The Surveillance Epidemiology End Results (SEER) Summary staging system (or ‘summary staging system’ for short) is a simpler method to stage ovarian cancers. According to Tracey and associates (2009), this summary measure is preferred by a number of cancer registries overseas and in Australia (such as the New South Wales registry) since the required information can be sourced more readily from the pathology and clinical reports to which the registries have access. In this staging system, tumours are allocated to one of three categories, as well as an ‘unknown’ category, as shown in Table E.2. Table E.2: Summary staging system—extent of disease at diagnosis Stage Description Localised A malignancy limited to the organ of origin; it has spread no farther than the organ in which it started. There is infiltration past the basement membrane of the epithelium into the functional part of the organ, but there is no spread beyond the boundaries of the organ Regional There is tumour extension beyond the limits of the organ of origin. There is invasion through the entire wall of the organ into surrounding organs and/or adjacent issues or by direct extension or contiguous spread to nearby lymph nodes Distant metastases Tumour cells that have broken away from the primary tumour, have travelled to other parts of the body and have begun to grow at the new location. Distant stage is also called remote, diffuse, disseminated, metastatic or secondary disease. In most cases there is no continuous trail of tumour cells between the primary site and the distant site Unknown There are cases for which sufficient evidence is not available to adequately assign a stage. Examples include occasions when the patient dies before workup is completed, when a patient refuses a diagnostic or treatment procedure, and when there is limited workup due to the patient’s age or a simultaneous contraindicating condition. If there is insufficient information the case cannot be assigned a stage Source: Tracey et al. 2006. 108 Appendix F: Definition of ovarian cancer– related hospitalisations Due to the method in which the principal diagnosis for hospitalisations of cancer patients is coded, it is insufficient to simply select those hospitalisations for which ovarian cancer was the principal diagnosis. Most importantly, when a patient receives same-day chemotherapy as a treatment for cancer, the Australian Coding Standards (NCCH 2008a) indicate that the principal diagnosis is to be coded to reflect the fact that the patient received chemotherapy, with the type of cancer listed as an additional diagnosis. The same coding practice is used for a number of other same-day cancer-related interventions—such as the implanting of chemotherapy ports. Hence, the number of hospitalisations would be greatly underestimated if only those for which the principal diagnosis was listed as ovarian cancer (i.e. ICD-10-AM code of C56) were included. Thus, for the purposes of examining the number of admitted patient separations that arose specifically due to invasive ovarian cancer and were directly related to treatment/care for ovarian cancer, ‘ovarian cancer–related hospitalisations’ were identified in this report as follows: • either a principal diagnosis of ovarian cancer (ICD-10-AM code of C56) • or an additional diagnosis of ovarian cancer (ICD-10-AM code of C56) and a principal diagnosis of one of the following ICD-10-AM ‘Z’ codes (with these Z codes falling within ICD-10-AM Chapter 21 ‘Factors influencing health status and contact with health services’): – follow-up examination after treatment for malignant neoplasms (Z08) – prophylactic immunotherapy (Z29.1) – other prophylactic immunotherapy (Z29.2) – prophylactic surgery for risk-factors related to malignant neoplasm—ovary (Z40.01) – adjustment and management of drug delivery or implanted device (Z45.1) – adjustment and management of vascular access device (Z45.2) – radiotherapy session (Z51.0) – pharmacotherapy session for neoplasm (Z51.1) – convalescence following radiotherapy (Z54.1) – convalescence following chemotherapy (Z54.2). Using data from the National Hospital Morbidity Database (NHMD) for 2007–08, Table F.1 shows the number of hospitalisations for each of the relevant Z code principal diagnoses, as well as for those hospitalisations in which ovarian cancer was the principal diagnosis. The number of hospitalisations that pertain to each of the inclusions in the definition of ovarian cancer–related hospitalisations is shown in Table F.1. The principal diagnosis was ‘ovarian cancer’ for one in four (26%) of all ovarian cancer–related hospitalisations. Thus, if one were to define ovarian cancer hospitalisations based solely on this disease being classified as the principal diagnosis, 74% of hospitalisations due to this disease would be missed. For almost two in three (65%) ovarian cancer–related hospitalisations, the principal diagnosis was ‘pharmacotherapy session for neoplasm’ (e.g. chemotherapy) with ovarian cancer listed as an additional diagnosis. 109 Source: National Hospital Morbidity Database, AIHW. 110 11,296 2 Convalescence following chemotherapy (Z54.2) Total ovarian cancer-related hospitalisations 2 9,314 3 Convalescence following radiotherapy (Z54.1) Pharmacotherapy session for neoplasm (Z51.1) Radiotherapy session (Z51.0) 499 0 Prophylactic surgery for risk-factors related to malignant neoplasm—ovary (Z40.01) Adjustment and management of vascular access device (Z45.2) 0 Other prophylactic immunotherapy (Z29.2) 640 0 Prophylactic immunotherapy (Z29.1) Adjustment and management of implantable infusion device or pump (Z45.1) 0 836 Number Follow-up examination after treatment for malignant neoplasms (Z08) Ovarian cancer as additional diagnosis (C56) AND principal diagnosis of: Ovarian cancer as principal diagnosis (C56) Diagnosis (ICD-10-AM code) 100.0 0.0 0.0 82.5 0.0 4.4 5.7 0.0 0.0 0.0 0.0 7.4 Per cent Same-day hospitalisations Table F.1: Hospitalisations for ovarian cancer by same-day and overnight status, 2007–08 2,981 8 0 14 0 6 15 0 0 0 0 2,938 Number 100.0 0.3 0.0 0.5 0.0 0.2 0.5 0.0 0.0 0.0 0.0 98.6 Per cent Overnight hospitalisations 14,277 10 2 9,328 3 505 655 0 0 0 0 3,774 Number 100.0 0.1 0.0 65.3 0.0 3.5 4.6 0.0 0.0 0.0 0.0 26.4 Per cent Total hospitalisations As noted in Chapter 7, not all hospitals in all states and territories formally admit patients for same-day chemotherapy services. Instead, in three states and territories, some patients are provided same-day chemotherapy on an outpatient (or non-admitted patient) basis. Such services are not captured in the NHMD. In particular, during the 1990s, hospitals in New South Wales began to apply this change in admission processes. In addition, hospitalisations data for the Australian Capital Territory from approximately 2003–04 reflect changed admission practices, as do data for South Australia from 2007–08. Thus, the recorded data on this type of admitted patient service is not comparable over time. To illustrate the effect on the data of this change in admission processes, data on the number of hospitalisations for same-day chemotherapy sessions (referred to as ‘pharmacotherapy sessions for neoplasms’ in ICD-10-AM) for ovarian cancer are shown for each state and territory over time in Table F.2. While the number of such sessions increased by more than 50% between 1999–00 and 2007–08 in some of the jurisdictions—including Tasmania (186%), the Northern Territory (667%), 95% in Victoria (95%) and Western Australia (76%)—the number of chemotherapy sessions decreased by 8% in New South Wales over the period considered. Furthermore, the drop in the number of such sessions in the Australian Capital Territory is evident from 2004 –05 onwards, as is the more recent drop in South Australia between 2006–07 and 2007–08. Table F.2: Number of ovarian cancer–related hospitalisations for same-day ‘Pharmacotherapy sessions for neoplasm’(a) by state and territory, 1999–00 to 2007–08 Year NSW Vic Qld WA SA Tas ACT NT Total 1999–00 1,227 1,861 1,867 843 653 63 110 6 6,630 2000–01 1,210 1,878 2,217 779 767 15 197 26 7,089 2001–02 877 2,168 2,594 1,166 789 114 160 84 7,952 2002–03 760 2,701 2,083 1,138 738 124 157 105 7,806 2003–04 938 3,341 2,044 1,010 593 131 211 59 8,327 2004–05 917 3,782 1,943 1,193 737 81 97 60 8,810 2005–06 940 3,582 2,098 1,212 704 250 86 88 8,960 2006–07 980 3,526 2,208 1,256 855 265 101 68 9,259 2007–08 1,133 3,624 2,284 1,486 441 180 120 46 9,314 (a) ICD-10-AM code of Z51.1. Source: National Hospital Morbidity Database, AIHW. 111 Glossary This section provides a general description of the terms used in this report. The terms have been defined in the context of this report; some terms may have other meanings in other contexts. Additional diagnosis: a condition or complaint either coexisting with the principal diagnosis or arising during the episode of care. Administrative databases: observations about events that are routinely recorded or required by law to be recorded. Such events include births, deaths, hospital separations and cancer incidence. Administrative databases include the Australian Cancer Database, the National Mortality Database and the National Hospital Morbidity Database. Admitted patient: a person who undergoes a hospital’s formal admission process to receive treatment and/or care. Such treatment or care can occur in hospital and/or in the person’s home (as a ‘hospital-in-home’ patient). Age-specific rate: a rate for a specific age group. The numerator and denominator relate to the same age group. Age-standardisation: a method of removing the influence of age when comparing populations with different age structures. This is usually necessary because the rates of many diseases vary strongly (usually increasing) with age. The age structures of the different populations are converted to the same ‘standard’ structure. The disease rates that would have occurred with that structure are then calculated and compared. Associated cause of death: any other condition or event that was not related to the underlying cause of death but was still considered to contribute to the individual’s death. Average length of stay: the average (mean) number of patient days for admitted patient episodes. Patients admitted and separated on the same date are allocated a length of stay of 1 day. Benign: non-cancerous tumours that may grow larger but do not spread to other parts of the body. Cancer (malignant neoplasm): a large range of diseases in which some of the body’s cells become defective, begin to multiply out of control, can invade and damage the area around them, and can also spread to other parts of the body to cause further damage. Carcinoma: a cancer that begins in the lining layer (epithelial cells) of organs such as the ovary. Confidence interval: a statistical term describing a range (interval) of values within which we can be ‘confident’ that the true value lies, usually because it has a 95% or higher chance of doing so. Crude rate: the number of events in a given period divided by the size of the population at risk in a specified time period. Crude survival: the proportion of people alive at a specified point in time subsequent to the diagnosis of ovarian cancer. 112 DALYs (disability-adjusted life years): the sum of years of life lost due to premature mortality (YLL) in the population and the equivalent years of ‘healthy’ life lost due to disability (YLD). Death due to cancer: see Mortality due to cancer. Heath expenditure: includes expenditure on health goods and services (e.g. medications, aids and appliances, medical treatment, public health, research) which collectively are termed ‘current expenditure’ and on health-related investment which is often referred to as ‘capital expenditure’. Hospitalisation: see Separation. Incidence: the number of new cases (of an illness or event, and so on) occurring during a given period. International Statistical Classification of Diseases and Related Health Problems: the World Health Organization’s internationally accepted classification of death and disease. The tenth revision (ICD-10) is currently in use. ICD-10-AM is the Australian modification of ICD-10; it is used for diagnoses and procedures recorded for patients admitted to hospitals (see Appendix A). Invasive: see Malignant. Length of stay: duration of hospital stay, calculated by subtracting the date the patient was admitted from the day of separation. All leave days, including the day the patient went on leave, are excluded. A same-day patient is allocated a length of stay of 1 day. Limited-duration prevalence: the number of people alive at a specific time who have been diagnosed with ovarian cancer over a specified period (such as the previous 5 or 25 years). Malignant: a tumour with the capacity to spread to surrounding tissue or to other sites in the body. Metastasis: see Secondary cancer. Mortality due to cancer: the number of deaths which occurred during a specified period (usually a year) for which the underlying cause of death was recorded as cancer. Mortality-to-incidence ratio: the ratio of the age-standardised mortality rate for ovarian cancer to the age-standardised incidence rate for ovarian cancer. New cancer case: see Incidence. Neoplasm: an abnormal (‘neo’, new) growth of tissue. Can be ‘benign’ (not a cancer) or ‘malignant’ (a cancer). Also known as a tumour. Overnight patient: an admitted patient who receives hospital treatment for a minimum of 1 night (that is, is admitted to, and separates from, hospital on different dates). Patient days: the total number of days for admitted patients who separated during a specified reference period. A same-day patient is allocated a length of stay of 1 day. Population estimates: official population numbers compiled by the Australian Bureau of Statistics at both state and territory, and statistical local area levels by age and sex, as at 30 June each year. These estimates allow comparisons to be made between geographical areas of differing population sizes and age structures (see Appendix C). Prevalence (or complete prevalence): the total number of people alive at a specific date who have ever been diagnosed with a particular disease such as ovarian cancer. Primary cancer: a tumour that is at the site where it first formed (also see Secondary cancer). Principal diagnosis: the diagnosis established after study to be chiefly responsible for occasioning an episode of admitted patient care. 113 Procedure: a clinical intervention that is surgical in nature, carries a procedural risk, carries an anaesthetic risk, requires specialised training and/or requires special facilities or equipment available only in the acute care setting. Relative survival: the ratio of observed survival of a group of persons diagnosed with ovarian cancer to expected survival of those in the corresponding general population after a specified interval following diagnosis (such as 5 or 10 years). Risk factor: any factor that represents a greater risk of a health disorder or other unwanted condition or event. Some risk factors are regarded as causes of disease, others are not necessarily so. Along with their opposites, namely protective factors, risk factors are known as ‘determinants’. Same-day patient: a patient who is admitted to, and separates from, hospital on the same date. Secondary cancer: a tumour that originated from a cancer elsewhere in the body. Also referred to as a metastasis. Separation: An episode of care for an admitted patient which may include a total hospital stay (from admission to discharge, transfer or death) or a portion of a hospital stay that begins or ends in a change of type of care (e.g. from acute to rehabilitation). In this report, separations are also referred to as hospitalisations. Statistical significance: an indication from a statistical test that an observed difference or association may be significant or ‘real’ because it is unlikely to be due just to chance. A statistical result is usually said to be ‘significant’ if it would occur by chance only once in twenty times or less often (see Appendix B). Stage: the extent of a cancer in the body. Staging is usually based on the size of the tumour, whether lymph nodes contain cancer, and whether the cancer has spread from the original site to other parts of the body (see Appendix E). Symptom: any indication of a disorder that is apparent to the person affected. Underlying cause of death: the disease or injury that initiated the sequence of events leading directly to death. YLD (years of healthy life lost due to disability): for each new case, YLD equals the average duration of the disease (to remission or death) multiplied by a severity weight for that disease (which depends upon its disabling effect over the disease duration). YLL (years of life lost): for each new case, YLL equals the number of years between premature death and the standard life expectancy for the individual. 114 References ABS (Australian Bureau of Statistics) 1981. Causes of death, Australia, 1979. ABS cat. no. 3303.0. Canberra: ABS. ABS 2001. Information paper: ABS views on remoteness. ABS cat. no. 1244.0. Canberra: ABS. ABS 2004. Experimental estimates and projections, Aboriginal and Torres Strait Islander Australians, 1991 to 2009. ABS cat. no. 3238.0. Canberra: ABS. ABS 2007. Causes of death, Australia, 2005. ABS cat. no. 3303.0. Canberra: ABS. ABS 2008a. Information paper: an introduction to Socio-Economic Indexes for Areas (SEIFA) 2006. ABS cat. no. 2039.0. Canberra: ABS. ABS 2008b. Population projections, Australia 2006 to 2101. ABS cat. no. 3222.0. Canberra: ABS. ABS 2008c. Standard Australian Classification of Countries (SACC), Australia, 2nd edn. ABS cat. no. 1269.0. Canberra: ABS. ABS 2009a. A picture of the nation: the statistician’s report on the 2006 Census. Canberra: ABS. ABS 2009b. Life tables, Australia. ABS cat. no. 3302.0.55.001. Canberra: ABS. Viewed 15 December 2009, <www.abs.gov.au>. ABS 2009c. National Health Survey: summary of results, Australia, 2007–08. ABS cat. no. 4364.0. Canberra: ABS. ABS 2009d. Causes of death, Australia, 2007. ABS cat. no. 3303.0. Canberra: ABS. ABS 2009e. Experimental life tables for Aboriginal and Torres Strait Islander Australians, Australia, 2005–2007. ABS cat. no. 3302.0.55.003. Canberra: ABS. ABS 2009f. Experimental estimates and projections, Aboriginal and Torres Strait Islander Australians, 1986 to 2006. ABS cat. no. 3238.0. Canberra: ABS. ABS 2009g. Births 2008, Australia. ABS cat. no. 3301.0. Canberra: ABS. ABS 2009h. Deaths 2007, Australia. ABS cat. no. 3302.0. Canberra: ABS. ABS & AIHW (Australian Institute of Health and Welfare) 2008. The health and welfare of Australia’s Aboriginal and Torres Strait Islander peoples. ABS cat. no. 4704.0 and AIHW cat. no. IHW 21. Canberra: ABS & AIHW. ACN (Australian Cancer Network) and NBCC (National Breast Cancer Centre) 2004. Clinical practice guidelines for the management of women with epithelial ovarian cancer. Sydney: NBCC. ACS (American Cancer Society) 2008. Cancer facts and figures 2008. Atlanta: ACS. ACS 2009. Detailed guide: ovarian cancer. Atlanta: ACS. Viewed 17 September 2009, <www.documents.cancer.org/114.00/114.00.pdf>. ACT Health 2007. Cancer in the ACT, 1998–2004. Health series no. 42. Canberra: ACT Government. AIHW 2000. Australian hospital statistics 1998–99. Health services series no. 15. Cat. no. HSE 11. Canberra: AIHW. AIHW 2004. Rural, regional and remote health: a guide to remoteness classifications. Cat. no. PHE 53. Canberra: AIHW. 115 AIHW 2005. Health system expenditures on cancer and other neoplasms in Australia, 2000–01. Cat. no. HWE 29. Canberra: AIHW. AIHW 2008a. Australia’s health 2008. Cat. no. AUS 99. Canberra: AIHW. AIHW 2008b. Health expenditure Australia 2006–07. Health and welfare expenditure series no. 35. Cat. no. HWE 42. Canberra: AIHW. AIHW 2009a. Australian hospital statistics 2007–08. Health services series no. 33. Cat. no. HSE 71. Canberra: AIHW. AIHW 2009b. National Cancer Statistics Clearing House protocol 2009. Canberra: AIHW. AIHW & AACR (Australasian Association of Cancer Registries) 2008. Cancer in Australia: an overview, 2008. Cancer series no. 46. Cat. no. CAN 42. Canberra: AIHW. AIHW & CA (Cancer Australia) 2008. Non-melanoma skin cancer: general practice consultations, hospitalisation and mortality. Cancer series no. 43. Cat. no. 39. Canberra: AIHW. AIHW, CA & AACR 2008. Cancer survival and prevalence in Australia: cancers diagnosed from 1982 to 2004. Cancer series no. 42. Cat. no. CAN 38. Canberra: AIHW. AIHW & NBCC 2006. Ovarian cancer in Australia: an overview, 2006. Cancer series no. 35. Cat. no. CAN 30. Canberra: AIHW. AIHW & NBOCC (National Breast and Ovarian Cancer Centre) 2009. Breast cancer in Australia: an overview, 2009. Cancer series no. 50. Cat. no. CAN 46. Canberra: AIHW. AIHW: Mathers C, Vos T & Stevenson C 1999. The burden of disease and injury in Australia. Cat. no. PHE 17. Canberra: AIHW. Averette HE, Janicek MF & Menck HR 1995. The national cancer data base report on ovarian cancer. Cancer 76:1096–103. Baade PD, Fritschi L & Aitken JF 2005. Geographical differentials in cancer incidence and survival in Queensland: 1996 to 2002. Brisbane: Viertel Centre for Research in Cancer Control, Queensland Cancer Fund. Begg S, Vos T, Barker B, Stevenson C, Stanley L & Lopez AD 2007a. The burden of disease and injury in Australia, 2003. Cat. no. PHE 82. Canberra: AIHW. Begg S, Vos T, Barker B, Stevenson C, Stanley L & Lopez AD 2007b. Annex tables for the burden of disease and injury in Australia, 2003. Viewed 4 September 2009, <www.aihw.gov.au/publications/hwe/bodaiia03/bodaiia03-x02.pdf>. Black RJ, Sankaranarayanan R & Parkin DM 1998. Interpretation of population-based cancer survival data. IARC Scientific Publication 145:13–7. Bray F, Loos AH, Tognazzo S & La Vecchia C 2005. Ovarian cancer in Europe: cross-sectional trends in incidence and mortality in 28 countries, 1953–2000. International Journal of Cancer 113:977–90. Brenner H, Arndt V, Gefeller O & Hakulinen T 2004. An alternative approach to age adjustment of cancer survival rates. European Journal of Cancer 40:2317–22. Brenner H & Gefeller O 1996. An alternative approach to monitoring cancer patient survival. Cancer 78(9):2004–10. Brenner H & Hakulinen T 2003. On crude and age-adjusted relative survival rates. Journal of Clinical Epidemiology 56:1185–91. Breslow N & Day N 1987. Statistical methods in cancer research. Volume II: the design and analysis of cohort studies. Lyon: IARC. 116 Cancer Council Queensland 2009. Cancer in Queensland: incidence and mortality 1982 to 2006, statistical tables. Spring Hill: Cancer Council Queensland. Cancer Council SA (South Australia) 2009. Statistics: ovarian cancer. Eastwood: Cancer Council SA. Cancer Council Victoria 2007. Canstat: ovarian cancer. Carlton: Cancer Council Victoria. Cancer Research UK 2006. CancerStats: ovarian cancer survival statistics. London: Cancer Research UK. Viewed 4 September 2009, <www.info.cancerresearchuk.org/cancerstats/types/ovary/survival>. Chan JK, Urban R, Cheung MK, Osann K, Husain A, Teng NN et al. 2006. Ovarian cancer in younger vs older women: a population-based analysis. British Journal of Cancer 95:1314–20. Colombo N, Van Gorp T, Parma G, Amant F, Gatta G, Sessa C et al. 2006. Ovarian cancer. Critical Reviews in Oncology/Hematology 60:159–79. Condon J 2004. Cancer, health services and Indigenous Australians. Aboriginal and Torres Strait Islander Primary Health Care Review. Consultant report no. 5. Canberra: Office for Aboriginal and Torres Strait Islander Health. Coory M, Thompson A & Ganguly I 2000. Cancer among people living in rural and remote Indigenous communities in Queensland. Medical Journal of Australia 173(6):301–4. Curado MP, Edwards B, Sin HR, Storm H, Ferlay J, Heanue M & Boyle P (eds) 2007. Cancer incidence in five continents, vol. IX. IARC Scientific Publications no. 160. Lyon: IARC. Dalton M, Veen A, Albion T, Otahal P & Blizzard L 2008. Cancer in Tasmania: incidence and mortality 2006. Hobart: Menzies Research Institute. Dickman P 2004. Estimating and modelling relative survival using SAS. Stockholm: Karolinska Institutet. Viewed 8 May 2007, <www.pauldickman.com/rsmodel/sas_colon>. Dobson AJ, Kuulasmaa K, Eberle E & Scherer J 1991. Confidence intervals for weighted sums of Poisson parameters. Statistics in Medicine 10:457–62. Doll R, Payne P & Waterhouse J (eds) 1966. Cancer incidence in five continents: a technical report. Berlin: Springer–Verlag (for UICC). Donnelly DW, Garvin AT & Comber H 2009. Cancer in Ireland 1994–2004: a comprehensive report. Ireland: Northern Ireland Cancer Registry/National Cancer Registry. Florida Department of Health 2009. Ovarian cancer in Florida. Tallahassee: Bureau of Epidemiology. Viewed 5 September 2009, <www.doh.state.fl.us/disease_ctrl/epi/cancer/Ovarian_Report.pdf>. Ferlay J, Bray F, Pisani P & Parkin DM 2004. GLOBOCAN 2002: cancer incidence, mortality and prevalence worldwide. IARC CancerBase no. 5 version 2.0. Lyon: IARC Press. Fritz A, Percy C, Jack A, Shanmugaratnam K, Sobin L, Parkin DM et al. 2000. International Classification of Diseases for Oncology, 3rd edn. Geneva: World Health Organization. Grossi M, Quinn MA, Thursfield VJ, Francis PA, Rome RM, Planner RS et al. 2002. Ovarian cancer: patterns of care in Victoria during 1993–1995. Medical Journal of Australia 177(1):11– 16. Heintz APM, Odicino F, Maisonneuve P, Quinn MA, Benedet JL, Creasman WT et al. 2006. Carcinoma of the ovary. International Journal of Gynecology & Obstetrics 95(0):S161–S192. Horner MJ, Ries LAG, Krapcho M, Neyman N, Aminou R, Howlader N et al. (eds) 2009. SEER cancer statistics review, 1975–2006. Bethesda, MD: National Cancer Institute. Viewed 21 September 2009, <www.seer.cancer.gov/csr/1975_2006/index.html>. 117 IARC (International Agency for Research on Cancer) 2004. International rules for multiple primary cancers (ICD-O 3rd edn). Lyon: IARC. Viewed 8 May 2009, <www.iacr.com.fr/MPrules_july2004.pdf>. Jensen OM, Parkin DM, MacLennan R, Muir CS & Skeet RG (eds) 1991. Cancer registration: principles and methods. IARC scientific publications no. 95. Lyon: IARC. Kjaerbye-Thygesen A, Huusom LD, Frederiksen K & Kjaer SK 2005. Trends in the incidence and mortality of ovarian cancer in Denmark 1978–2002: comparison with other Nordic countries. Acta Obstetricia et Gynecologica Scandinavica 84:1006–12. Kliewer EV & Smith KR 1995. Ovarian cancer mortality among immigrants in Australia and Canada. Cancer Epidemiology, Biomarkers and Prevention 4:453–8. Kobel M, Kalloger SE, Boyd N, McKinney S, Mehl E, Palmer C et al. 2008. Ovarian carcinoma subtypes are different diseases: implications for biomarker studies. PLoS Medicine 5(12):1749–59. Kosary CL 2007. Cancer of the ovary. In: Ries LAG, Young JL, Keel GE, Eisner MP, Lin YD & Horner MJ (eds). SEER survival monograph: cancer survival among adults: US SEER Program, 1998–2001, patient and tumour characteristics. NIH pub. no. 07–6215. Bethesda, MD: National Cancer Institute. Kricker A 2002. Ovarian cancer in Australian women. Camperdown, NSW: NBCC. Laurvick CL, Semmens JB, Leung YC & Homan CDJ 2003. Ovarian cancer in Western Australia (1982–1998): trends in surgical intervention and relative survival. Gynecologic Oncology 88:136–40. Le Teuff GL, Abrahamowicz M, Bolard P & Quantin C 2005. Comparison of Cox’s and relative survival models when estimating the effects of prognostic factors on disease-specific mortality: a simulation study under proportional excess hazards. Statistics in Medicine 24:3887–909. Maas HAAM, Kruitwagen RFPM, Lemmens VEPP, Goey SH & Janssen-Heijnen MLG 2005. The influence of age and co-morbidity on treatment and prognosis of ovarian cancer: a population-based study. Gynecologic Oncology 97:104–9. McMurdo ME, Witham MD & Gillespie ND 2005. Including older people in clinical research. British Medical Journal 331:1036–7. Menon U & Jacobs IJ 2001. Ovarian cancer screening in the general population: current status. International Journal of Gynecological Cancer 11(Supplement 1):3–6. Morris CR, Rodriquez AO, Epstein J & Cress RD 2008. Declining trends of epithelial ovarian cancer in California. Gynecologic Oncology 108:207–13. Murray CJL, Salomon JA & Mathers C. 1999. A critical examination of summary measures of population health. Global programme for evidence for health policy discussion paper series no. 2. Geneva: World Health Organization. NBOCC (National Breast and Ovarian Cancer Centre) 2009. Population screening and early detection of ovarian cancer in asymptomatic women: NBOCC position statement. Surry Hills, NSW: NBOCC. Viewed 16 January 2010, <nbocc.org.au/our-organisation/positionstatements/population-screening-and-early-detection>. NCCH (National Centre for Classification in Health) 2006. Australian Classification of Health Interventions, 5th edn. Sydney: University of Sydney. NCCH 2008a. Australian coding standards for ICD-10-AM and ACHI. Sydney: University of Sydney. 118 NCCH 2008b. The International Statistical Classification of Diseases and Related Health Problems, 10th revision, Australian modification (ICD-10-AM): tabular list of diseases. Sydney: University of Sydney. NCCH 2008c. Australian Classification of Health Interventions (ACHI): tabular list of interventions, 6th edn. Sydney: University of Sydney. National Cancer Institute 2009. Anatomy: the cervix and nearby organs, NCI visuals online. Bethesda, MD: National Institutes of Health, United States Department of Health and Human Services. Viewed 21 August 2009, <visualsonline.cancer.gov/details.cfm?imageid=4350>. NZ (New Zealand) Ministry of Health 2009a. Cancer: new registrations and deaths 2005, revised edn. Wellington: Ministry of Health. NZ Ministry of Health 2009b. Personal communication with staff at the NZ Ministry of Health. Odicino F, Pecorelli S, Zigliani L & Creasman WT 2008. History of the FIGO cancer staging system. International Journal of Gynecology and Obstetrics 101:205–10. Oriel KA, Hartenbach EM & Remington PL 1999. Trends in United States ovarian cancer mortality, 1975–1995. Obstetrics & Gynecology 93(1):30–3. Parkin DM & Iscovich J 1997. Risk of cancer in migrants and their descendants in Israel: II. Carcinomas and germ-cell tumours. International Journal of Cancer 70(6):654–60. Pecorelli S, Ngan HY & Hacker NF (eds) 2000. Staging classification and clinical practice guidelines for gynaecological cancers. International Journal of Gynecology & Obstetrics 10(2):207–312. Petignat P, Fioretta G, Verkooijen HM, Vlastos AT, Rapiti E, Bouchardy C et al. 2004. Poorer survival of elderly patients with ovarian cancer: a population-based study. Surgical Oncology 13:181–6. Queensland Cancer Registry & Cancer Council Queensland 2008. Cancer in Queensland. Incidence and mortality 1982 to 2005. Queensland: The Cancer Council Queensland. Ries LAG, Melbert D, Krapcho M, Stinchcomb DG, Howlader N, Horner MJ et al. (eds) 2008. SEER cancer statistics review, 1975–2005. Bethesda, MD: National Cancer Institute. Skirnisdottir I, Garmo H, Wilander E & Holmberg L 2008. Borderline ovarian tumours in Sweden 1960–2005: trends in incidence and age at diagnosis compared to ovarian cancer. International Journal of Cancer 123:1897–1901. South Australia Cancer Registry 2000. Epidemiology of cancer in South Australia. Incidence, mortality and survival 1977 to 1999. Incidence and mortality 1999 analysed by type and geographical location. Twenty-three years of data. Adelaide: South Australia Cancer Registry, Epidemiology Branch, Statewide Division, Department of Human Services. South Australia Cancer Registry 2008. Cancer in South Australia 2006—with projections to 2009. Adelaide: South Australia Department of Health. Supramaniam R, Grindley H & Pulver LJ 2006. Cancer mortality in Aboriginal people in New South Wales, Australia, 1994–2002. Australian and New Zealand Journal of Public Health 30(5):453–6. Threllfall TJ, Thompson JR & Olsen N 2005. Cancer in Western Australia: incidence and mortality 2003 and Mesothelioma 1960–2003. Perth: Department of Health. Thursfield V, Farrugia H & Giles G (eds) 2009. Cancer in Victoria 2006. Carlton: Cancer Epidemiology Centre, Cancer Council Victoria. 119 Tracey EA, Chen S, Baker D, Bishop J & Jelfs P 2006. Cancer in New South Wales: incidence and mortality 2004. Sydney: Cancer Institute New South Wales. Tracey EA, Barraclough H, Chen W, Baker D, Roder D, Jelfs P & Bishop J 2007. Survival from cancer in NSW: 1980 to 2003. Sydney: Cancer Institute New South Wales. Tracey E, Alam N, Chen W & Bishop J 2008. Cancer in New South Wales: incidence and mortality 2006. Sydney: Cancer Institute New South Wales. Tracey EA, Roder D, Francis J, Zorbas HM, Hacker NF & Bishop J 2009. Reasons for improved survival from ovarian cancer in New South Wales, Australia, between 1980 and 2003: implication for cancer control. International Journal of Gynecological Cancer 19(4): 591–9. UICC (International Union against Cancer) 2009. Geneva: UICC. Viewed 30 November 2009, <www.uicc.org/index.php>. USCSWG (United States Cancer Statistics Working Group) 2009. United States cancer statistics: 1999–2005, incidence and mortality web-based report. Atlanta: U.S Department of Health and Human Services, Centre for Disease Control and Prevention, and National Cancer Institute. Viewed 21 September 2009, <www.apps.nccd.cdc.gov/uscs>. Uyar D, Frasure HE, Markman M & Von Gruenigen VE 2005. Treatment patterns by decade of life in elderly women (≥ 70 years of age) with ovarian cancer. Gynecologic Oncology 98:403–8. WCRF (World Cancer Research Fund) & AICR (American Institute for Cancer Research) 2007. Food, nutrition, physical activity and the prevention of cancer: a global perspective. Washington: AIRC. Wiggins CL, Espey DK, Wingo PA, Kaur JS, Wilson RT, Swan J et al. 2008. Cancer among American Indians and Alaska natives in the United States, 1999–2004. Cancer 113(5): 1142– 52. WHC (Women’s Health Council) & NCRI (National Cancer Registry Ireland) 2006. Women and cancer in Ireland 1994–2001. Dublin: The Women’s Health Council. WHO (World Health Organization) 1992. International Statistical Classification of Diseases and Related Health Problems, 10th revision. Volume 1. Geneva: WHO. Yang L, Klint A, Lambe M, Bellocco R, Riman T, Bergfeldt K et al. 2008. Predictors of ovarian cancer survival: a population-based prospective study in Sweden. International Journal of Cancer 123:672–9. Young JR, Roffers SD, Ries LAG, Fritz AG & Hurlbut AA (eds) 2001. SEER summary staging manual—2000: codes and coding instruction. NIH pub. no. 01–4969. Bethesda, MD: National Cancer Institute. Viewed 17 September 2009, <www.seer.cancer.gov/tools/ssm/>. Zhang X, Cordon J, Dempsey K & Garling L 2008. Cancer incidence and mortality, northern Territory 1991–2005. Darwin: Department of Health and Families. 120 List of tables Table 2.1: Incidence of the 10 most commonly diagnosed cancers, females, 2006................................6 Table 2.2: Risk and average age at diagnosis of ovarian cancer, 1982 to 2006....................................... 9 Table 2.3: Incidence of ovarian cancer and average age at diagnosis by type of ovarian cancer, 2006 ................................................................................................................................. 11 Table 2.4: Incidence by type of ovarian cancer and age at diagnosis, 2006 ......................................... 13 Table 2.5: Incidence by type of ovarian cancer, 1982–1987 to 2000–2006 ............................................. 14 Table 2.6: Incidence of ovarian cancer by stage at diagnosis, New South Wales and United States of America........................................................................................................................ 16 Table 2.7: Incidence of ovarian and other female genital organ cancers by stage at diagnosis, New South Wales, 1980–1998 and 1999–2003 ..................................................... 16 Table 2.8: Incidence of ovarian cancer by stage and age at diagnosis, United States of America, 1999–2005................................................................................................................... 17 Table 2.9: Incidence of ovarian cancer by state and territory, 2002–2006............................................. 18 Table 2.10: Incidence of ovarian cancer by Indigenous status, Queensland, Western Australia, South Australia and the Northern Territory, 2002–2006 .................................... 21 Table 3.1: The 10 most common types of cancer deaths, females, 2006................................................ 25 Table 3.2: Risk of death from ovarian cancer and average age at death, 1982 to 2006 ....................... 29 Table 3.3: Mortality from ovarian cancer by state and territory, 2002–2006........................................ 30 Table 3.4: Mortality from ovarian cancer by Indigenous status, New South Wales, Queensland, Western Australia, South Australia and the Northern Territory, 2002–2006..................................................................................................................................... 32 Table 3.5: Underlying cause of death where ovarian cancer was an associated cause, annual average for 2002–2006................................................................................................................ 35 Table 3.6: Women who died with ovarian cancer as an associated cause by age at death, annual average for 2002–2006................................................................................................... 35 Table 4.1: Relative survival, ovarian and breast cancer, females, 2000–2006 ...................................... 37 Table 4.2: Incidence and 5-year relative survival by type of ovarian cancer, 1982–1987 to 2000–2006 ................................................................................................................................ 43 Table 4.3: Five-year relative survival by stage at diagnosis, ovarian cancer, New South Wales, 1980–2003....................................................................................................................... 44 Table 4.4: Five-year relative survival by stage at diagnosis and age group, ovarian cancer, United States of America, 1999–2005....................................................................................... 45 Table 4.5: Five-year crude survival by Indigenous status, ovarian cancer, Queensland, Western Australia, South Australia & Northern Territory, 1997–2006............................... 46 Table 5.1: Limited-duration prevalence of ovarian cancer, end of 2006............................................... 49 Table 5.2: Limited-duration prevalence of the 10 most commonly diagnosed cancers, females, end of 2004.................................................................................................................. 49 Table 5.3: Twenty-five-year prevalence of ovarian cancer by age group, end of 2006....................... 50 Table 5.4: Limited-duration prevalence of ovarian cancer by state and territory of diagnosis, end of 2006............................................................................................................... 51 Table 5.5: Limited-duration prevalence of ovarian cancer by country/region of birth, end of 2006 .......................................................................................................................................... 52 Table 6.1: Leading causes of burden of disease, including leading cancers, females, 2003...............54 121 Table 6.2: Leading causes of burden of disease, including leading cancers, by fatal (YLL) and non-fatal (YLD) components, females, 2003 ................................................................... 55 Table 6.3: Trends and projected burden of ovarian and related cancers, 1993 to 2023 ...................... 57 Table 7.1: Hospitalisations for ovarian cancer and all reasons, females, 2007–08...............................59 Table 7.2: Average length of stay (ALOS) for ovarian cancer–related hospitalisations by age group, 2007–08............................................................................................................................ 60 Table 7.3: Hospitalisations for ovarian cancer by same-day and overnight status, 1999–00 to 2007–08 .................................................................................................................................... 60 Table 7.4: Hospitalisations for ovarian cancer by most common procedures, 2007–08 ..................... 63 Table 8.1: Hospital admitted patient services expenditure by disease, females, 2004–05 ................. 65 Table 8.2: Hospital admitted patient services expenditure by disease, constant prices, females, 2000–01 and 2004–05 ................................................................................................. 66 Table B.1: Age-standardisation method and reference population for analyses of differences in incidence and mortality rates by group.............................................................................. 70 Table B.2: Codes for ovarian and related cancers in the International Statistical Classification of Diseases and Related Health Problems, tenth revision (ICD-10) ...........71 Table C.1: Agreed set of items to be provided by the states and territories to the AIHW for inclusion in the Australian Cancer Database ......................................................................... 77 Table D2.1: Incidence of ovarian cancer by age at diagnosis, 2006 .......................................................... 82 Table D2.2: Incidence of ovarian cancer, 1982 to 2006 ............................................................................... 83 Table D2.3: Incidence of ovarian cancer by age at diagnosis, 1982 to 2006............................................. 84 Table D2.4: Projected ovarian cancer incidence, 2007 to 2015 .................................................................. 85 Table D2.5: Grouping of ovarian cancer histology types .......................................................................... 85 Table D2.6: Incidence by type of ovarian cancer, women aged less than 50 years at diagnosis, 1982–1987 to 2000–2006 ............................................................................................................. 86 Table D2.7: Incidence by type of ovarian cancer, women aged 50 to 69 years at diagnosis, 1982–1987 to 2000–2006 ............................................................................................................. 87 Table D2.8: Incidence by type of ovarian cancer, women aged 70 years and over at diagnosis, 1982–1987 to 2000–2006 ............................................................................................................. 88 Table D2.9: Incidence of ovarian cancer by remoteness area, 2002–2006................................................89 Table D2.10: Incidence of ovarian cancer by socioeconomic status, 2002–2006 ....................................... 89 Table D2.11: Incidence of ovarian cancer by country/region of birth, 2002–2006................................... 90 Table D2.12: International comparison of estimated incidence of ovarian and related cancers, 2002 .............................................................................................................................................. 91 Table D3.1: Mortality from ovarian cancer by age at death, 2006 ............................................................ 92 Table D3.2: Mortality from ovarian cancer, 1968 to 2006 .......................................................................... 92 Table D3.3: Mortality from ovarian cancer by age at death, 1982 to 2006............................................... 94 Table D3.4: Mortality from ovarian cancer by remoteness area, 2002–2006 ........................................... 95 Table D3.5: Mortality from ovarian cancer by socioeconomic status, 2002–2006................................... 95 Table D3.6: Mortality from ovarian cancer by country/region of birth, 2002–2006 .............................. 96 Table D3.7: International comparison of estimated mortality from ovarian and related cancers, 2002 ............................................................................................................................... 97 Table D4.1: Relative survival, 10 most commonly diagnosed cancers, females, 1998–2004................. 98 Table D4.2: Relative survival by age at diagnosis, ovarian cancer, 2000–2006....................................... 98 Table D4.3: Relative survival by period of diagnosis, ovarian cancer, 1982–1987 to 2000–2006..........99 122 Table D4.4: Five-year relative survival by age at diagnosis, ovarian cancer, 1982–1987 to 2000–2006 .............................................................................................................................. 100 Table D4.5: Five-year relative survival by type of ovarian cancer and age at diagnosis, 1982–2006................................................................................................................................... 101 Table D4.6: International comparison of mortality-to-incidence ratios for ovarian and related cancers, 2002 ............................................................................................................................. 102 Table D6.1: Leading cancer causes of burden of disease by age group, females, 2003 ....................... 103 Table D7.1: Hospitalisations for ovarian cancer by age group, 2007–08 ............................................... 104 Table D7.2: Hospitalisations for ovarian cancer by same-day and overnight status, 1999–00 to 2007–08 .................................................................................................................................. 104 Table D7.3: Hospitalisations for ovarian cancer by age group, 1999–00 to 2007–08............................ 105 Table D7.4: Average length of stay (ALOS) for ovarian cancer-related hospitalisations by same-day and overnight status, 1999–00 to 2007–08 ........................................................... 105 Table D8.1: Hospital admitted patient services expenditure and number of hospitalisations for ovarian and related cancers by age group, 2004–05 ...................................................... 106 Table E.1: Carcinoma of the ovary: FIGO nomenclature (Rio de Janeiro 1998)................................. 107 Table E.2: Summary stage—extent of disease at diagnosis .................................................................. 108 Table F.1: Hospitalisations for ovarian cancer by same-day and overnight status, 2007–08........... 110 Table F.2: Number of ovarian cancer–related hospitalisations for same-day ‘Pharmacotherapy sessions for neoplasm’ by state and territory, 1999–00 to 2007–08 .................................................................................................................................. 111 123 List of figures Figure 1.1: The ovaries and nearby organs .................................................................................................. 1 Figure 2.1: Incidence of ovarian cancer by age at diagnosis, 2006 ............................................................ 7 Figure 2.2: Incidence of ovarian cancer, 1982 to 2006 ................................................................................. 7 Figure 2.3: Incidence of ovarian cancer by age at diagnosis, 1982 to 2006............................................... 8 Figure 2.4: Incidence of ovarian cancer, observed for 1997 to 2006 and projected for 2007 to 2015 .......................................................................................................................................... 10 Figure 2.5: Incidence of ovarian cancer by remoteness area, 2002–2006................................................ 19 Figure 2.6: Incidence of ovarian cancer by socioeconomic status, 2002–2006 ....................................... 20 Figure 2.7: Incidence of ovarian cancer by country/region of birth, 2002–2006................................... 22 Figure 2.8: International comparison of estimated incidence of ovarian and related cancers, 2002 .............................................................................................................................................. 23 Figure 3.1: Ovarian cancer incidence and mortality by age group, 2006............................................... 26 Figure 3.2: Ovarian cancer incidence and mortality, 1968 to 2006.......................................................... 27 Figure 3.3: Mortality from ovarian cancer by age at death, 1982 to 2006............................................... 28 Figure 3.4: Mortality from ovarian cancer by remoteness area, 2002–2006 ........................................... 31 Figure 3.5: Mortality from ovarian cancer by socioeconomic status, 2002–2006 .................................. 32 Figure 3.6: Mortality from ovarian cancer by country/region of birth, 2002–2006 .............................. 33 Figure 3.7: International comparison of estimated mortality from ovarian and related cancers, 2002 ............................................................................................................................... 34 Figure 4.1: Relative survival, 10 most commonly diagnosed cancers, females, 1998–2004................. 38 Figure 4.2: Relative survival by age at diagnosis, ovarian cancer, 2000–2006....................................... 39 Figure 4.3: Relative survival by period of diagnosis, ovarian cancer, 1982–1987 to 2000–2006.......... 40 Figure 4.4: Five-year relative survival by age at diagnosis, ovarian cancer, 1982–1987 to 2000–2006 ................................................................................................................................ 41 Figure 4.5: Five-year relative survival by type of ovarian cancer, 2000–2006 ....................................... 42 Figure 4.6: International comparison of mortality-to-incidence ratios for ovarian and related cancers, 2002 ............................................................................................................................... 47 Figure 6.1: Leading causes of burden of disease, including leading cancers, by fatal and non-fatal components, females, 2003....................................................................................... 56 Figure 6.2: Leading cancer causes of burden of disease by age group, females, 2003 ......................... 56 Figure 7.1: Hospitalisations for ovarian cancer by age group, 2007–08 ................................................. 59 Figure 7.2: Hospitalisations for ovarian cancer by same-day and overnight status, 1999–00 to 2007–08 .................................................................................................................................... 61 Figure 7.3: Hospitalisations for ovarian cancer by age group, 1999–00 to 2007–08.............................. 62 Figure 7.4: Average length of stay for ovarian cancer–related hospitalisations by same-day and overnight status, 1999–00 to 2007–08 ............................................................................... 62 Figure 8.1: Hospital admitted patient services expenditure on ovarian and related cancers by age group, 2004–05..................................................................................................................... 65 124


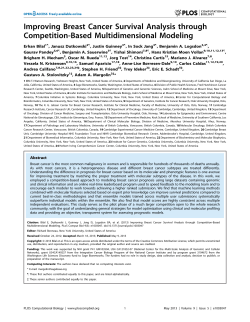


© Copyright 2026