
GROUP OF 100 DISCOUNT RATE
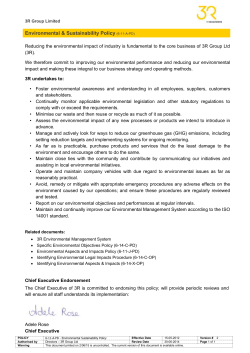
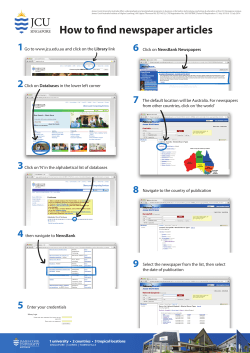
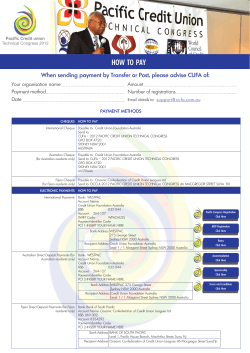
Milliman Report GROUP OF 100 DISCOUNT RATE May 2015 Prepared by: Craig McCulloch, FIAA FFA Victor Huang, FIAA Level 5 32 Walker Street North Sydney NSW 2060 Tel +61 (0)2 8090 9100 au.milliman.com Milliman Report Group of 100 Discount Rate TABLE OF CONTENTS 1 BACKGROUND ..................................................................................................................................... 1 OBJECTIVES AND SCOPE ................................................................................................................................ 1 RELIANCE AND LIMITATIONS ........................................................................................................................... 1 2 METHODOLOGY AND ASSUMPTIONS ............................................................................................. 2 SUMMARY OF THE ASSET CALIBRATION SET .................................................................................................. 2 INTERPOLATION METHODOLOGY .................................................................................................................... 4 EXTRAPOLATION METHODOLOGY ................................................................................................................... 4 3 FITTED YIELD CURVE ......................................................................................................................... 5 4 APPENDIX A: SECURITIES IN THE ASSET CALIBRATION SET .................................................. 9 5 APPENDIX B: G100 DISCOUNT CURVE CHECKLIST .................................................................. 13 May 2015 0 Milliman Report Group of 100 Discount Rate 1 BACKGROUND Objectives and scope The Group of 100 has commissioned Milliman to generate a standardised set of discount rates to be made publicly available for the purpose of discounting employee benefit liabilities under Australian Accounting Standard 119 (AASB 119). The scope of the work is limited to Australian employee benefit schemes, and excludes any schemes of foreign subsidiaries of domestic entities which are denominated in foreign currency. This report provides the Australian corporate bond discount rate curve as at the end of May 2015 produced under the methodology and assumptions described in the ‘Discount Rates for Australian Employee Benefit Liability Valuation’ report. Reliance and limitations In producing this report, we have relied upon the following information: Capital market data as sourced from Bloomberg. Should this data be incorrect, it could materially affect the analysis and conclusions drawn from it. Users of this report should also be aware that it is subject to the following limitations: Current debt market conditions. Issuance of corporate bonds is subject to change over time, which may impact upon whether the accounting standard requirements of a deep market are met. Current capital market conditions, in particular the liquidity and credit ratings of corporate bond markets, which can change rapidly. The asset calibration set could change very rapidly under stressed market conditions. Reassessments of the suitability of the asset calibration set would be needed if the AAA and/or AA corporate bond market thins, which would require a prospective change to the assets selected for AASB 119 calibration purposes. This report was prepared solely to provide assistance to the Group of 100 and the relevant Actuaries Institute of Australia subcommittee. Milliman does not intend to benefit and assumes no duty or liability to other parties who receive this report. Milliman recommends that any recipient of this report be aided by its own actuary or other qualified professional when reviewing the report. Milliman does not certify the information in this report, nor does it guarantee the accuracy, completeness, efficacy, or timeliness of such information. Use of such information is voluntary and should not be relied upon unless an independent review of its accuracy, completeness, efficacy, and timeliness has been performed. Materials may not be reproduced without the express consent of Milliman. May 2015 1 Milliman Report Group of 100 Discount Rate 2 METHODOLOGY AND ASSUMPTIONS Summary of the asset calibration set The set of assets to be used to calibrate the discount rate curve is defined by those securities that meet the following conditions: 1. Individual bonds must have the following characteristics: a. Physical bonds, with no embedded derivatives (e.g., callable, putable, convertible, extendible, variable/floating coupon, index-linked) b. High-quality corporate bonds issued by both domestic and foreign entities c. Payments denominated in Australian dollars (AUD) d. Pay fixed (or zero) coupons, non-inflation-linked e. Maturity terms of greater than one month and less than 10 years f. Minimum amount outstanding on an individual security of $100 million g. Securitised bonds are included 2. A deep market for these bonds must exist, as characterised by the ready availability of observable prices and current trades. What is meant by high quality? Figure 1 defines the credit ratings by each agency that map to each of these broad categories. This forms the basis for the asset calibration set used in this report. Figure 1: Definition of AAA and AA Credit Ratings by Agency Category S&P Fitch Moody’s AAA AAA AAA Aaa AA AA+, AA, AAAA+, AA, AAAa1, Aa2, Aa3 Where there is disagreement between credit rating agencies on particular securities, we use the following conditions: If a security has at least two AAA ratings, then it is classified as a AAA security If a security has at least two AA ratings, then it is classified as a AA security If a security has only been rated by two agencies with different ratings, then the lower rating is used If a security has only been rated by one agency, then that rating becomes the sole reference Hereafter, all references to credit ratings refer to those that meet the above conditions. For the purposes of this paper, we refer to this as the combined credit rating. May 2015 2 Milliman Report Group of 100 Discount Rate Corporate bond universe The table in Figure 2 shows the decomposition of the market by the combined credit rating satisfying all but the ‘high quality’ characteristic. Figure 2: Australian Corporate Bond Market Outstanding Debt by Combined Credit Rating ($ millions) Combined Rating AAA AA A BBB BB Other Total Number of Securities 15 123 184 71 4 6 403 Outstanding ($ Millions) 12,200 33,411 51,632 16,765 1,450 1,246 116,704 % of Total 10.5% 28.6% 44.2% 14.4% 1.2% 1.1% 100.0% Source: Milliman analysis based upon Bloomberg data as at 29 May 2015. The table in Figure 3 shows the universe of AAA and AA bonds used in the asset calibration set broken down into the composition of their respective S&P, Moody’s and Fitch ratings. Figure 3: Australian AAA/AA Corporate Bond Market Outstanding Debt ($ millions) Credit Rating Composition 3 AAA ratings 2 AAA ratings 1 AAA rating Total Combined AAA 3 AA ratings 2 AA ratings 1 AA rating Total Combined AA Number of Outstanding ($ Securities Millions) Combined Credit Rating of AAA 0 0 13 1,000 2 10,625 15 12,200 Combined Credit Rating of AA 42 14,415 69 16,391 12 2,605 123 33,411 % of Total 0.0% 8.2% 87.1% 100.0% 43.1% 49.1% 7.8% 100.0% Source: Milliman analysis based upon Bloomberg data as at 29 May 2015. May 2015 3 Milliman Report Group of 100 Discount Rate Interpolation methodology For fitting the discount curve to the asset calibration set, the Merrill Lynch Exponential Spline (MLES) method with nine exponential basis functions was used calibrated to yield data as at 29 May 2015, weighting each issue by the inverse duration of the issue. The results of the calibrated MLES parameters are shown in Figure 4. Figure 4: MLES-Calibrated Parameters as at 29 May 2015 MLES Parameters Long-Run b0 5.7% Param1 λ1 125.2% Param2 λ2 14.5% Param3 λ3 -71.1% Param4 λ4 36.4% Param5 λ5 39.3% Param6 λ6 -3.0% Param7 λ7 -66.7% Param8 λ8 -15.2% Param9 λ9 40.7% For the calibration of the MLES basis functions, an adjusted R-squared statistical goodness-of-fit measure was applied to the difference between modelled and actual bond prices. An adjusted R-squared statistic value close to 100% indicates a very good fit, whilst lower values (closer to 0%) indicate poor fits. Figure 5 shows the results of the interpolation analysis used. Figure 5: Adjusted R-Squared Statistic as at 29 May 2015 Regression Statistic Adjusted R-Squared 90.6% Extrapolation methodology For rates beyond 10-year maturities, the fitted yield curve has been extrapolated by assuming that 1-year forward rates remain constant for all subsequent maturities. This is based on the 1-year forward rate between 9- and 10year maturities, based on the fitted MLES model. May 2015 4 Milliman Report Group of 100 Discount Rate 3 FITTED YIELD CURVE Figure 6 shows the modelled yield-to-maturity for each bond in the asset calibration set, compared with the actual yield-to-maturity, using the MLES method with inverse duration weightings. Note that these are the same bonds as those discussed and analysed in Section 2 above. Figure 6: Modelled vs. Market Yields to Maturity for Asset Calibration Set Using the MLES Method with Inverse Duration Weightings May 2015 5 Milliman Report Group of 100 Discount Rate Figures 7 and 8 show the resulting spot and forward yield curves of one to 50 years for the calibration set using the MLES method and extrapolated with the constant forward rate extrapolation method. Spot rates shown are quoted as annually compounded rates on zero coupon bonds with maturities of the specified term, forward rates shown are 1-year forward rates ending at the specified term. Figure 7: Spot and Forward Rate Curves for Asset Calibration Set Using an MLES Interpolation and Constant Forward Rate Extrapolation Method May 2015 6 Milliman Report Group of 100 Discount Rate Figure 8: Spot and Forward Rate Curves for Asset Calibration Set Using an MLES Interpolation and Constant Forward Rate Extrapolation Method Term 1 2 3 4 5 6 7 8 9 10 11 12 13 14 15 16 17 18 19 20 21 22 23 24 25 May 2015 Spot Rate 2.49% 2.65% 2.85% 3.07% 3.28% 3.47% 3.64% 3.79% 3.92% 4.04% 4.14% 4.22% 4.29% 4.34% 4.40% 4.44% 4.48% 4.51% 4.55% 4.57% 4.60% 4.62% 4.64% 4.66% 4.68% Discount Factor 0.975705 0.949052 0.919033 0.886086 0.851126 0.815086 0.778744 0.742688 0.707330 0.672942 0.640225 0.609099 0.579487 0.551314 0.524511 0.499011 0.474750 0.451669 0.429711 0.408819 0.388944 0.370035 0.352045 0.334929 0.318646 Term 26 27 28 29 30 31 32 33 34 35 36 37 38 39 40 41 42 43 44 45 46 47 48 49 50 Spot Rate 4.70% 4.71% 4.73% 4.74% 4.75% 4.76% 4.77% 4.78% 4.79% 4.80% 4.81% 4.82% 4.83% 4.83% 4.84% 4.85% 4.85% 4.86% 4.87% 4.87% 4.88% 4.88% 4.89% 4.89% 4.90% Discount Factor 0.303154 0.288416 0.274394 0.261054 0.248362 0.236288 0.224800 0.213871 0.203473 0.193581 0.184170 0.175216 0.166697 0.158593 0.150883 0.143547 0.136568 0.129929 0.123612 0.117603 0.111885 0.106446 0.101270 0.096347 0.091663 7 Milliman Report Group of 100 Discount Rate Figure 9 shows the resulting spot rate curve of one to 30 years relative to the prior period fitted curve. Figure 9: Spot Rate Curves Relative to Prior Period Fitted Curve May 2015 8 Milliman Report Group of 100 Discount Rate 4 APPENDIX A: SECURITIES IN THE ASSET CALIBRATION SET Figure 10 details the list of securities that meet the definition of the asset calibration set: combined domestic and foreign issuer, AA- and AAA-rated fixed coupon AAA-denominated bonds. Figure 10: Securities in the Asset Calibration Set Issuer Name Westpac Banking Corp Cooperatieve Centrale Raiffeisen-Boerenleenbank BA/Australia Commonwealth Bank of Australia Cooperatieve Centrale Raiffeisen-Boerenleenbank BA/Australia Cie de Financement Foncier SA Toronto-Dominion Bank/The Cooperatieve Centrale Raiffeisen-Boerenleenbank BA/Netherlands Cooperatieve Centrale Raiffeisen-Boerenleenbank BA/Australia National Australia Bank Ltd Westpac Banking Corp Total Capital SA Nestle Holdings Inc Cooperatieve Centrale Raiffeisen-Boerenleenbank BA/Netherlands Cooperatieve Centrale Raiffeisen-Boerenleenbank BA/Australia Hypo Real Estate Bank International AG National Australia Bank Ltd Canadian Imperial Bank of Commerce/Canada Australia & New Zealand Banking Group Ltd Australian Rail Track Corp Ltd Australia & New Zealand Banking Group Ltd Westpac Banking Corp BNZ International Funding Ltd/London National Australia Bank Ltd Cooperatieve Centrale Raiffeisen-Boerenleenbank BA/Australia Westpac Banking Corp Suncorp-Metway Ltd Commonwealth Bank of Australia Commonwealth Bank of Australia Total Capital International SA Cie de Financement Foncier SA Australian Postal Corp Westpac Banking Corp Australia & New Zealand Banking Group Ltd National Australia Bank Ltd May 2015 Issue Name WSTP 6 1/2 07/08/15 Combined Credit Rating AA Maturity Date 08/07/2015 Coupon 6.50% RABOBK 4 1/2 07/09/15 CBAAU 6 1/2 07/21/15 AA AA 09/07/2015 21/07/2015 4.50% 6.50% RABOBK 5 5/8 09/14/15 CFF 5 1/2 09/22/15 TD 3 5/8 10/09/15 AA AAA AA 14/09/2015 22/09/2015 09/10/2015 5.63% 5.50% 3.63% RABOBK 5 3/4 10/12/15 AA 12/10/2015 5.75% RABOBK 6 10/29/15 NAB 6 1/2 11/05/15 WSTP 6 1/2 11/09/15 TOTAL 6 1/2 01/20/16 NESNVX 5 1/2 01/28/16 AA AA AA AA AA 29/10/2015 05/11/2015 09/11/2015 20/01/2016 28/01/2016 6.00% 6.50% 6.50% 6.50% 5.50% RABOBK 5 1/2 02/03/16 AA 03/02/2016 5.50% RABOBK 6 1/2 02/25/16 PBBGR 5 3/4 03/07/16 NAB 6 5/8 03/09/16 CM 6 1/4 03/22/16 ANZ 5 1/4 03/23/16 ARTAUS 3 3/4 04/29/16 ANZ 6 3/4 05/09/16 WSTP 6 3/4 05/09/16 BZLNZ 6 1/4 06/14/16 NAB 4 5/8 06/27/16 AA AA AA AAA AAA AA AA AA AAA AA 25/02/2016 07/03/2016 09/03/2016 22/03/2016 23/03/2016 29/04/2016 09/05/2016 09/05/2016 14/06/2016 27/06/2016 6.50% 5.75% 6.63% 6.25% 5.25% 3.75% 6.75% 6.75% 6.25% 4.63% RABOBK 5 07/27/16 WSTP 7 1/4 11/18/16 SUNAU 4 3/4 12/06/16 CBAAU 6 12/15/16 CBAAU 5 3/4 01/25/17 TOTAL 4 7/8 01/25/17 CFF 6 1/4 01/30/17 AUSPOS 5 1/2 02/06/17 WSTP 5 3/4 02/06/17 ANZ 5 7/8 02/13/17 NAB 6 02/15/17 AA AA AAA AA AAA AA AAA AA AAA AA AA 27/07/2016 18/11/2016 06/12/2016 15/12/2016 25/01/2017 25/01/2017 30/01/2017 06/02/2017 06/02/2017 13/02/2017 15/02/2017 5.00% 7.25% 4.75% 6.00% 5.75% 4.88% 6.25% 5.50% 5.75% 5.88% 6.00% 9 Milliman Report Group of 100 Discount Rate Issuer Name Westpac Banking Corp Cooperatieve Centrale Raiffeisen-Boerenleenbank BA/Australia National Australia Bank Ltd Nestle Finance International Ltd Commonwealth Bank of Australia Toyota Finance Australia Ltd Total Capital International SA Toyota Motor Credit Corp Australia & New Zealand Banking Group Ltd National Australia Bank Ltd Metropolitan Life Global Funding I Stadshypotek AB Nestle Holdings Inc Suncorp-Metway Ltd Cooperatieve Centrale Raiffeisen-Boerenleenbank BA/Netherlands Hongkong & Shanghai Banking Corp Ltd/Sydney Total Capital International SA Australian Rail Track Corp Ltd Nestle Holdings Inc Cooperatieve Centrale Raiffeisen-Boerenleenbank BA/Netherlands Canadian Imperial Bank of Commerce/Canada Westpac Banking Corp Commonwealth Bank of Australia Australia & New Zealand Banking Group Ltd Toyota Finance Australia Ltd National Bank of Abu Dhabi PJSC National Australia Bank Ltd Canadian Imperial Bank of Commerce/Canada National Australia Bank Ltd Australia & New Zealand Banking Group Ltd National Australia Bank Ltd Nestle Holdings Inc Westpac Banking Corp Total Capital Canada Ltd Cooperatieve Centrale Raiffeisen-Boerenleenbank BA/Australia National Australia Bank Ltd Metropolitan Life Global Funding I Australia & New Zealand Banking Group Ltd Nestle Holdings Inc May 2015 Issue Name WSTP 6 02/20/17 Combined Credit Rating AA Maturity Date 20/02/2017 Coupon 6.00% RABOBK 6 02/23/17 NAB 6 03/06/17 NESNVX 4 5/8 03/29/17 CBAAU 4.72 05/24/17 TOYOTA 3 5/8 06/19/17 TOTAL 4 1/8 06/26/17 TOYOTA 4 3/8 07/05/17 ANZ 5 07/25/17 NAB 5 08/08/17 MET 4 3/4 09/28/17 SHBASS 4 1/4 10/10/17 NESNVX 4 10/13/17 SUNAU 4 11/09/17 AA AA AA AA AA AA AA AA AA AA AAA AA AAA 23/02/2017 06/03/2017 29/03/2017 24/05/2017 19/06/2017 26/06/2017 05/07/2017 25/07/2017 08/08/2017 28/09/2017 10/10/2017 13/10/2017 09/11/2017 6.00% 6.00% 4.63% 4.72% 3.63% 4.13% 4.38% 5.00% 5.00% 4.75% 4.25% 4.00% 4.00% RABOBK 4 1/8 11/13/17 HSBC 4 1/4 11/16/17 TOTAL 3 7/8 12/05/17 ARTAUS 7 1/4 12/20/17 NESNVX 3 3/4 01/18/18 AA AA AA AA AA 13/11/2017 16/11/2017 05/12/2017 20/12/2017 18/01/2018 4.13% 4.25% 3.88% 7.25% 3.75% RABOBK 4 1/4 01/22/18 CM 4 1/4 01/24/18 WSTP 4 1/4 01/24/18 CBAAU 4 1/4 01/25/18 ANZ 4 1/8 02/07/18 TOYOTA 4 1/4 02/26/18 NBADUH 5 03/07/18 NAB 7 1/4 03/07/18 CM 4 5/8 03/27/18 NAB 4 3/8 04/03/18 ANZ 4 1/4 04/17/18 NAB 4 05/23/18 NESNVX 3 7/8 07/19/18 WSTP 4 1/2 09/04/18 TOTAL 4 09/06/18 AA AA AA AA AA AA AA AA AA AA AA AA AA AA AA 22/01/2018 24/01/2018 24/01/2018 25/01/2018 07/02/2018 26/02/2018 07/03/2018 07/03/2018 27/03/2018 03/04/2018 17/04/2018 23/05/2018 19/07/2018 04/09/2018 06/09/2018 4.25% 4.25% 4.25% 4.25% 4.13% 4.25% 5.00% 7.25% 4.63% 4.38% 4.25% 4.00% 3.88% 4.50% 4.00% RABOBK 4 1/8 09/19/18 NAB 5 09/20/18 MET 4 1/2 10/10/18 ANZ 4 1/2 11/06/18 NESNVX 4 1/8 12/06/18 AA AA AA AA AA 19/09/2018 20/09/2018 10/10/2018 06/11/2018 06/12/2018 4.13% 5.00% 4.50% 4.50% 4.13% 10 Milliman Report Group of 100 Discount Rate Issuer Name National Australia Bank Ltd Westpac Banking Corp Total Capital International SA National Bank of Abu Dhabi PJSC Cooperatieve Centrale Raiffeisen-Boerenleenbank BA/Australia Svenska Handelsbanken AB Westpac Banking Corp Metropolitan Life Global Funding I Commonwealth Bank of Australia Toyota Finance Australia Ltd National Australia Bank Ltd National Australia Bank Ltd Total Capital International SA Cooperatieve Centrale Raiffeisen-Boerenleenbank BA/Netherlands Australia & New Zealand Banking Group Ltd Canadian Imperial Bank of Commerce/Canada Australia & New Zealand Banking Group Ltd National Australia Bank Ltd Total Capital Canada Ltd Commonwealth Bank of Australia Cooperatieve Centrale Raiffeisen-Boerenleenbank BA/Australia Commonwealth Bank of Australia Suncorp-Metway Ltd Westpac Banking Corp Australia & New Zealand Banking Group Ltd National Australia Bank Ltd National Australia Bank Ltd Westpac Banking Corp National Australia Bank Ltd Cooperatieve Centrale Raiffeisen-Boerenleenbank BA/Netherlands Westpac Banking Corp Australia & New Zealand Banking Group Ltd Commonwealth Bank of Australia Royal Bank of Canada/Sydney Westpac Banking Corp Westpac Banking Corp Nestle Holdings Inc Cooperatieve Centrale Raiffeisen-Boerenleenbank BA/Netherlands Commonwealth Bank of Australia May 2015 Issue Name NAB 4 1/2 01/22/19 WSTP 4 1/2 02/25/19 TOTAL 4 1/8 03/04/19 NBADUH 4 3/4 03/19/19 Combined Credit Rating AA AA AA AA Maturity Date 22/01/2019 25/02/2019 04/03/2019 19/03/2019 Coupon 4.50% 4.50% 4.13% 4.75% RABOBK 4 5/8 04/05/19 SHBASS 4 1/2 04/10/19 WSTP 4 3/8 04/16/19 MET 4 1/2 04/16/19 CBAAU 4 1/4 04/24/19 TOYOTA 4 1/4 05/15/19 NAB 4 1/4 05/20/19 NAB 4 1/8 06/06/19 TOTAL 3 3/4 06/26/19 AA AA AA AA AA AA AA AA AA 05/04/2019 10/04/2019 16/04/2019 16/04/2019 24/04/2019 15/05/2019 20/05/2019 06/06/2019 26/06/2019 4.63% 4.50% 4.38% 4.50% 4.25% 4.25% 4.25% 4.13% 3.75% RABOBK 3 07/22/19 ANZ 3 3/4 07/25/19 CM 4 3/4 07/25/19 ANZ 4 3/4 08/06/19 NAB 4 3/4 09/10/19 TOTAL 3 3/4 09/23/19 CBAAU 5 09/24/19 AA AA AA AA AA AA AA 22/07/2019 25/07/2019 25/07/2019 06/08/2019 10/09/2019 23/09/2019 24/09/2019 3.00% 3.75% 4.75% 4.75% 4.75% 3.75% 5.00% RABOBK 5 09/25/19 CBAAU 3 3/4 10/18/19 SUNAU 3 3/4 11/05/19 WSTP 4 11/06/19 ANZ 3 3/4 11/11/19 NAB 4 3/4 11/25/19 NAB 4 11/27/19 WSTP 4 7/8 12/10/19 NAB 5 01/17/20 AA AA AAA AA AA AA AA AA AA 25/09/2019 18/10/2019 05/11/2019 06/11/2019 11/11/2019 25/11/2019 27/11/2019 10/12/2019 17/01/2020 5.00% 3.75% 3.75% 4.00% 3.75% 4.75% 4.00% 4.88% 5.00% RABOBK 4 7/8 01/20/20 WSTP 3 1/4 01/22/20 ANZ 4 3/4 02/03/20 CBAAU 7 1/4 02/05/20 RY 3 1/4 02/10/20 WSTP 7 1/4 02/11/20 WSTP 4 3/4 02/19/20 NESNVX 4 1/4 03/18/20 AA AA AA AA AA AA AA AA 20/01/2020 22/01/2020 03/02/2020 05/02/2020 10/02/2020 11/02/2020 19/02/2020 18/03/2020 4.88% 3.25% 4.75% 7.25% 3.25% 7.25% 4.75% 4.25% RABOBK 4 1/2 04/29/20 CBAAU 4 3/4 06/10/20 AA AA 29/04/2020 10/06/2020 4.50% 4.75% 11 Milliman Report Group of 100 Discount Rate Issuer Name Cooperatieve Centrale Raiffeisen-Boerenleenbank BA/Australia Cooperatieve Centrale Raiffeisen-Boerenleenbank BA/Australia Macquarie University Nestle Holdings Inc Australian Postal Corp Airservices Australia Cooperatieve Centrale Raiffeisen-Boerenleenbank BA/Netherlands Australia & New Zealand Banking Group Ltd Cooperatieve Centrale Raiffeisen-Boerenleenbank BA/Netherlands Westpac Banking Corp Australia & New Zealand Banking Group Ltd University of Sydney National Australia Bank Ltd Cooperatieve Centrale Raiffeisen-Boerenleenbank BA/Netherlands University Of Melbourne Westpac Banking Corp Metropolitan Life Global Funding I Cooperatieve Centrale Raiffeisen-Boerenleenbank BA/Netherlands Total Capital International SA National Australia Bank Ltd Cooperatieve Centrale Raiffeisen-Boerenleenbank BA/Australia Australia & New Zealand Banking Group Ltd Australian Postal Corp Westpac Banking Corp National Australia Bank Ltd Australian Rail Track Corp Ltd May 2015 Issue Name Combined Credit Rating Maturity Date RABOBK 3 3/8 06/29/20 AA 29/06/2020 3.38% RABOBK 3 1/4 08/21/20 MAQUNI 6 3/4 09/09/20 NESNVX 3 5/8 11/03/20 AUSPOS 5 11/13/20 AIRSER 4 3/4 11/19/20 AA AA AA AA AAA 21/08/2020 09/09/2020 03/11/2020 13/11/2020 19/11/2020 3.25% 6.75% 3.63% 5.00% 4.75% RABOBK 4 1/4 11/23/20 ANZ 5 1/4 12/18/20 AA AA 23/11/2020 18/12/2020 4.25% 5.25% RABOBK 5 02/25/21 WSTP 5 03/19/21 ANZ 4 7/8 03/19/21 UNISYD 4 3/4 04/16/21 NAB 5 05/07/21 AA AA AA AA AA 25/02/2021 19/03/2021 19/03/2021 16/04/2021 07/05/2021 5.00% 5.00% 4.88% 4.75% 5.00% RABOBK 4 1/2 05/26/21 UNIMEL 4 1/4 06/30/21 WSTP 4 3/8 08/20/21 MET 4 3/4 09/17/21 AA AA AA AA 26/05/2021 30/06/2021 20/08/2021 17/09/2021 4.50% 4.25% 4.38% 4.75% RABOBK 4 1/4 10/13/21 TOTAL 4 1/4 11/26/21 NAB 4 12/16/21 AA AA AA 13/10/2021 26/11/2021 16/12/2021 4.25% 4.25% 4.00% RABOBK 4 1/4 01/13/22 ANZ 5 08/16/23 AUSPOS 5 1/2 11/13/23 WSTP 5 1/4 11/21/23 NAB 5 03/11/24 ARTAUS 4 1/2 12/11/24 AA AAA AA AAA AAA AA 13/01/2022 16/08/2023 13/11/2023 21/11/2023 11/03/2024 11/12/2024 4.25% 5.00% 5.50% 5.25% 5.00% 4.50% Coupon 12 Milliman Report Group of 100 Discount Rate 5 APPENDIX B: G100 DISCOUNT CURVE CHECKLIST May 2015 13 Milliman is among the world's largest providers of actuarial and related products and services. The firm has consulting practices in healthcare, property & casualty insurance, life insurance and financial services, and employee benefits. Founded in 1947, Milliman is an independent firm with offices in major cities around the globe. For further information, visit milliman.com. Milliman does not certify the information in this update, nor does it guarantee the accuracy and completeness of such information. Use of such information is voluntary and should not be relied upon unless an independent review of its accuracy and completeness has been performed. Materials may not be reproduced without the express consent of Milliman. Copyright © 2015 Milliman, Inc.


© Copyright 2026