
Quarter 3 Practice Test Chapter 8
Quarter 3 Practice Test Chapter 8
1.
Let
= {x : 1 ≤ x < 17, x ∈
P , Q and R are the subsets of
}.
such that
P = {multiples of four};
Q = {factors of 36};
R = {square numbers}.
(a)
List the elements of
(i)
(ii)
(b)
P ∩ Q ∩ R.
(2)
Describe in words the set P ∪ Q.
(1)
(c)
(i)
Draw a Venn diagram to show the relationship between sets P, Q and R.
(2)
(ii)
Write the elements of
in the appropriate places on the Venn diagram.
(3)
2.
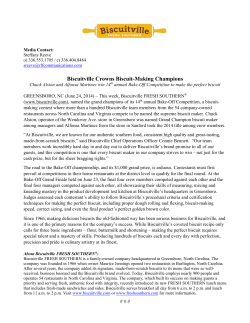
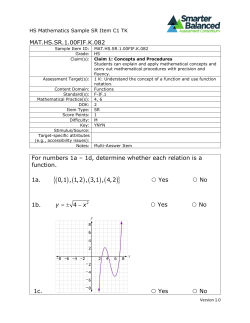
Maria travels to school either by walking or by bicycle. The probability she cycles to school is
0.75.
If she walks, the probability that she is late for school is 0.1.
If she cycles, the probability that she is late for school is 0.05.
(a)
Complete the tree diagram below, showing the appropriate probabilities.
(3)
(b)
Find the probability that Maria is late for school.
(3)
(Total 6 marks)
IB Questionbank Mathematical Studies 3rd edition
2
3.
A poll was taken of the leisure time activities of 90 students.
60 students watch TV (T), 60 students read (R), 70 students go to the cinema (C).
26 students watch TV, read and go to the cinema.
20 students watch TV and go to the cinema only.
18 students read and go to the cinema only.
10 students read and watch TV only.
(a)
Draw a Venn diagram to illustrate the above information.
(b)
Calculate how many students
(i)
only watch TV;
(ii)
only go to the cinema.
(Total 8 marks)
IB Questionbank Mathematical Studies 3rd edition
3
4.
There are two biscuit tins on a shelf. The red tin contains three chocolate biscuits and seven
plain biscuits. The blue tin contains one chocolate biscuit and nine plain biscuits.
(a)
A child reaches into the red tin and randomly selects a biscuit. The child returns that
biscuit to the tin, shakes the tin, and then selects another biscuit.
Find the probability that
(i)
both biscuits chosen are chocolate.
(2)
(ii)
one of the biscuits is plain and the other biscuit is chocolate.
(3)
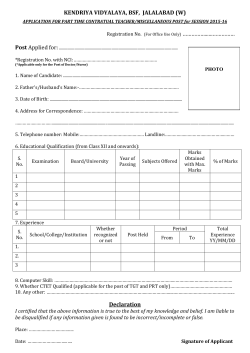
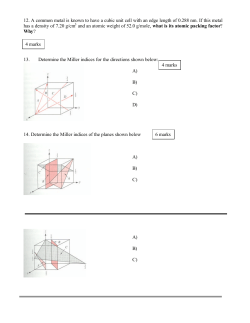
(b)
A second child chooses a biscuit from the blue tin. The child eats the biscuit and chooses
another one from the blue tin. The tree diagram below represents the possible outcomes
for this event.
C
1
10
C
P
C
9
10
P
a
b
(i)
P
Write down the values of a and b.
(2)
(ii)
Find the probability that both biscuits are chocolate.
(1)
(iii)
What is the probability that at least one of the biscuits is chocolate?
(3)
IB Questionbank Mathematical Studies 3rd edition
4
(c)
Suppose that before the two children arrived, their brother randomly selected one of the
biscuit tins and took out one biscuit.
Calculate the probability that this biscuit was chocolate.
(4)
(Total 15 marks)
5.
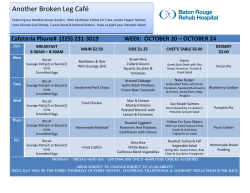
(a)
Shade (A ∪ B) ∩ C′ on the diagram below.
U
B
A
C
(2)
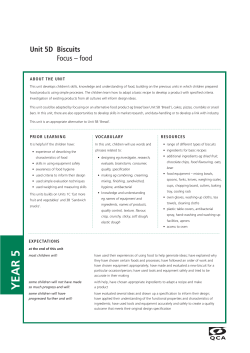
(b)
In the Venn diagram below, the number of elements in each region is given.
Find n ((P ∩ Q) ∪ R).
U
P
2
3
4
6
1
Q
5
9
R
(2)
IB Questionbank Mathematical Studies 3rd edition
5
(c)
6.
(b)
(c)
.
(i)
List the first six elements of the set M.
(ii)
List the first six elements of the set E′ ∩ M.
Consider the universal set U = {x ∈
and B = {4, 6, 12}.
(a)
+
U is the set of positive integers,
E is the set of even numbers.
M is the set of multiples of 3.
(2)
(Total 6 marks)
│3 < x < 13}, and the subsets A = {multiples of 3}
List the elements of the following sets.
(i)
A
(ii)
A ∩ B′
(2)
Write down one element of (A ∪ B)′.
(2)
One of the statements in the table below is false. Indicate with an X which statement is
false. Give a reason for your answer.
n(A ∪ B) = 4
15 ∈ A′
A ⊂ A ∪ B
(2)
(Total 6 marks)
IB Questionbank Mathematical Studies 3rd edition
6
7.
A weighted die has 2 red faces, 3 green faces and 1 black face. When the die is thrown, the
black face is three times as likely to appear on top as one of the other five faces.
The other five faces have equal probability of appearing on top.
The following table gives the probabilities.
(a)
Red 1
Red 2
Green 1
Green 2
Green 3
Black
1
8
1
8
1
8
m
8
1
8
n
8
Find the value of
(i)
m;
(ii)
n.
(2)
The die is thrown once.
(b)
Given that the face on top is not red, find the probability that it is black.
(2)
The die is now thrown twice.
(c)
Calculate the probability that black appears on top both times.
(2)
(Total 6 marks)
IB Questionbank Mathematical Studies 3rd edition
7
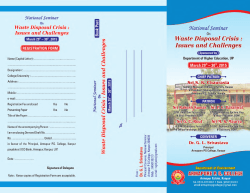
8.
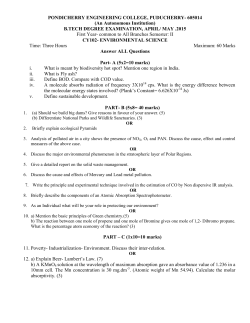
A survey was carried out in a year 12 class. The pupils were asked which pop groups they like
out of the Rockers (R), the Salseros (S), and the Bluers (B).
The results are shown in the following diagram.
(a)
Write down n( R ∩ S ∩ B ).
(1)
(b)
Find n(R′).
(2)
(c)
(d)
Describe which groups the pupils in the set S ∩ B like.
(2)
Use set notation to describe the group of pupils who like the Rockers and the Bluers but
do not like the Salseros.
(2)
There are 33 pupils in the class.
(e)
(i)
Find x.
(ii)
Find the number of pupils who like the Rockers.
(3)
(Total 10 marks)
IB Questionbank Mathematical Studies 3rd edition
8


© Copyright 2026