
The Economic and Fiscal Impact of Low
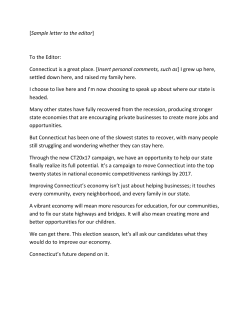
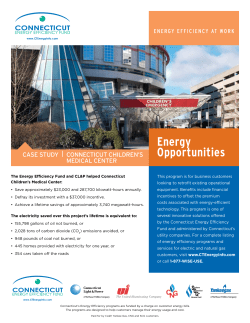
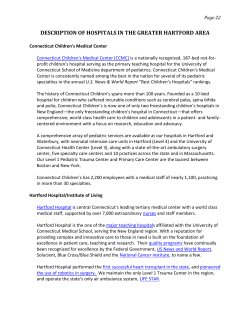
ISSUE BRIEF
April 2015
The Economic and Fiscal Impact
of Low-Wage Work in Connecticut
Daniel Kennedy, Ph.D., Economist
Stan McMillen, Ph.D., Economist, Visiting Assistant Professor,
University of Connecticut, Trinity College, Connecticut College
Louise Simmons, Ph.D., Professor of Social Work,
University of Connecticut
Connecticut’s Families Remain in
Financial Crisis
Connecticut’s population in 2013 was 3.58 million people,
of whom 903,577 individuals lived in families with an average family size of 3.14. Twenty percent of these families are
among the working poor, defined as having a family income
of less than 200% of the federal poverty level (FPL), which
in 2013 was $47,100 for a family of four.1 Many of our working poor families have no high school diploma or GED; in
Connecticut in 2012, 22.4% of such families had no high
school or GED compared with 29.4% in the nation (note
1). Among Connecticut’s low-income families (those with
incomes less than 200% of the FPL), 48.6% had no postsecondary education compared with the national average
of 50.3% (note 1). Over three quarters of the state’s lowincome families are housing cost-burdened, in which housing costs amount to one-third or more of a family’s income
(note 1). Almost two-thirds of low-income families work
(66.1%) compared to the nation’s 71.7% of such families
that work (note 1). Finally, 13.6% of Connecticut’s working families have jobs in occupations paying less than the
federal poverty threshold (note 1).
Introduction
The growth of low-wage work in Connecticut has implications for both those whose earnings are insufficient to meet
their families’ needs and for the economic and fiscal problems facing the state. The state’s taxpayer-supported social
programs have attempted to accommodate the growth in
low-wage work so that such workers can make ends meet.
Employers whose strategies impose costs on society must
recognize the squeeze this puts on government spending that could otherwise support programs favoring broad
economic development. This report presents an overview of
these inter-related issues, noting key facts and trends:
•
•
•
•
•
•
Twenty percent of Connecticut’s families are considered
working poor;
Two-thirds of the state’s low-income families work;
More than half of the jobs that Connecticut has added
to its economy between 2010 and 2014 were in occupations with a median wage at or below the 25th percentile wage for all occupations;
The state’s self-sufficiency wage for a family of one
worker with an infant is $31.86 per hour (without
employer-provided benefits);
Since 2010, hourly earnings in Connecticut have grown
weakly compared to neighboring states and the U.S.
average; and
Working families accessing Medicaid/CHIP and TANF
programs cost the state $486 million annually, or 54%
of the total costs of those programs.
In 2010, there were 720,000 Connecticut citizens (21%)
living at or near the poverty level.2 Over the 20-year period
examined in the report “Meeting the Challenge, The
Dynamics of Poverty in Connecticut,” 131 of Connecticut’s
169 towns witnessed an increase in poverty. Clearly, these
facts have economic and fiscal consequences we describe
below in detail. Despite working, families can still slip into
poverty from a combination of insufficient hourly wages,
hours worked per week and weeks worked per year. Such
conditions may result from business strategies in which
there is an abundance of low-skill labor, as well as from barriers to greater participation in full-time work.
Why Has Low-Wage Work Grown in
Connecticut?
Incentivizing companies to raise their wages to close to
a living or self-sufficiency wage would reduce workers’
dependency on public services and help mitigate actual or
pending public deficits.
There are several factors that have contributed to the growing ranks of families that work and are living in poverty.
The Great Recession exacerbated a trend underway for
the past 30 years.3 Unions have been weakened. Executive compensation has rewarded shareholder value rather
1
than worker productivity or loyalty. Corporate managers
are quicker to reduce employment and/or hours and hire
contract worker replacements more than they have been
in the middle decades of the 20th century.4 Job growth in
Connecticut over the past decade or so has been primarily
in low-wage occupations such as those found in the leisure
and hospitality, food and drink, and retail sectors of the
economy (see note 5 for a historical account and the section
below on Connecticut’s low-wage growth).5 In addition, as
the minimum wage has increased in several states, various strategies for holding costs down have emerged. One
is to replace human labor with machines and computers;6
another is to replace low-skill workers earning poverty-level
wages with higher-skill workers earning higher wages and
producing more output per unit time consistent with their
increased productivity.7
productivity, create the environment for economic growth
and enhance the quality of life in a region. To the extent
these goods and services are underfunded, society is worse off.
If we imagine that states and countries compete for resources
and talent, those areas that invest relatively more in the
public goods mentioned would likely be more competitive
in attracting and retaining workers and other productive
resources and have a relatively higher quality of life.
On the other hand, we need a set of social protections that
catches individuals and families who for many reasons cannot work, or cannot work full time and require services they
cannot otherwise afford. People who cannot find work utilize social programs when their savings and other resources
are depleted. In 2013, the number of people in the nation
looking for work was almost three times the number of
jobs available.9 In Connecticut in 2014, there were 4.17
job seekers for every job opening.10 This suggests that publicly-funded support for unemployed workers and their families has increased since the Great Recession and may persist
for some time, as long-term unemployment has perhaps
become the new norm.11 Governments at all levels face declining tax revenues on the one hand and increasing social
programs expenses on the other. Policymakers face options
of raising taxes and/or cutting spending, neither of which
may be a desirable response. Revising the tax system by closing loopholes, reducing subsidies and tax breaks to firms that
do not need them and making the system more progressive
to account for the immense wage disparity in Connecticut
would help close the gap between revenues and expenditures. Incentivizing companies to raise their wages to close
to a living or self-sufficiency wage would reduce workers’
dependency on public services and help mitigate actual or
pending public deficits. To address Connecticut’s precarious
fiscal position, Governor Malloy convened a tax study panel
in 2012 to recommend changes to state tax laws and the
legislature more recently formed a state tax panel to review
the state tax code and recommend changes.12 Such changes
could include enhancing the Earned Income Tax Credit,
reducing the sales tax, increasing the highest marginal rates
on household income and providing tax relief to companies
that raise their wages to self-sufficiency levels.13
Another trend is to outsource and offshore jobs to lowercost regions and countries to reduce costs and improve
flexibility in the provision of such services. Companies
have outsourced information technology services, security
services, building maintenance services, accounting services,
cafeteria services, and customer service, among others.
This trend is one reason manufacturing employment has
declined. In Connecticut, for example, Pratt & Whitney
had hundreds of workers in the aforementioned occupations
in the 1960s and 1970s, and over time shed these jobs and
outsourced the services they required. Further, as companies
face uncertain business cycles, they have found they can
reduce their payroll employment and hire labor services as
above but also utilize individual contractors in engineering,
drafting, graphical design, technical writing among other
professional services. Such occupations are not necessarily
low wage. However, total earnings for independent contractors may be less than the earnings of similar workers on
payroll because contractor employment terms may be short
term and do not provide fringe benefits.
While it is difficult for many low-wage workers to afford
adequate housing, energy (heating and cooling), food, health
insurance, and other forms of subsistence, some companies
have used the existence of social programs supported by
taxpayers to supplement their workers’ incomes, while others
have provided close to ‘living wages’ and affordable health
insurance so the public costs of their workers is reduced.8 The
economic and fiscal consequences of workers in low-wage
occupations drawing support from publicly-provided health
insurance, housing and energy assistance, food assistance and
cash assistance diverts taxpayer funds from other uses such
as public education, public transportation and transportation infrastructure, public safety, and subsidies to the arts and
research. These are public goods and services that enhance
What is Economic Self-Sufficiency in
Connecticut?
A self-sufficiency wage is the (annualized) wage an individual or family would need to earn in order to avoid reliance on
public programs. In 1999, Connecticut created its Self-Sufficiency Standard pursuant to Public Act 98-169, “An Act
Establishing a Self-Sufficiency Measurement and Expand2
The assumptions for satisfying basic economic security
incomes cited above include full-time employment and the
ability and competency to perform the job. As noted above,
many low-wage workers do not have either the education,
skills, or the ability to work full time due to health, child
care responsibilities or other issues. In addition, companies
may avoid paying benefits for part-time work or reduce such
costs by paying wages low enough that workers seek assistance from public programs.
Connecticut Has Seen Wages Lag and
Low-Wage Employment Grow
The following describes Connecticut’s historical employ3
Graph 1 shows a decline in the share of national income
that goes towards workers’ compensation from 1970 to the
present. After peaking twice, at 51.5% in 1953 and 1970,
labor compensation (wage and salary accruals paid to Persons), as a share of Gross Domestic Income (GDI) began a
secular decline and fell to 41.9% by 2013.
GRAPH 1: Compensation as a Share of U.S. GDI
60.0
51.5%
1970
51.5%
1953
55.0
50.0
49.2%
1948
45.0
40.0
41.9%
2013
35.0
2013
2008
2003
1998
1993
1988
1983
1978
1973
1968
1963
1958
1953
30.0
1948
Much has changed since 2005, and the 2012 BEST report
updates the findings of earlier research and accounts for differences by Connecticut’s five demographic regions, its urban
towns, and for the impact of employer-provided benefits. If
one assumes the income required for basic economic security
is the same as the self-sufficiency income, it is possible to
determine the costs to the public sector for each family type
in each region, and for those with and without employer
benefits. For example, in Appendix D on page 30, the BEST
report shows an individual worker with employer benefits
needs $37,188 annually ($17.88 per hour at 2,080 hours per
year) to satisfy basic economic security (the statewide average), while one without employer benefits requires $43,920
($21.12 per hour at 2,080 hours per year). The difference
ostensibly would be made up by public programs. For a family of one worker with employer benefits and an infant, the
requirement for basic economic security rises to $57,420
($27.61 per hour), while for this family working without
employer benefits, the BEST requirement is $66,276 ($31.86
per hour). In the latter cases and for larger families with preschool and school age children, child care costs become a
significant expense relative to childless families.
ment record and how it compares to New York, Massachusetts and the nation. The important result developed
below is that Connecticut is unique in its status of relatively
low job creation, low-compensation growth specifically
for hourly-wage earners, and the jobs created have been
disproportionately in low-wage sectors. Thus, the potential
for working families to utilize public programs is greater
in Connecticut than in New York, Massachusetts and the
nation. To the extent this conclusion is actually realized,
Connecticut’s budget woes will worsen.
Share of U.S. GDI
ing Job Training Opportunities.” In 2002, the Connecticut
General Assembly enacted a statute (Public Act 02-54)
requiring the Self-Sufficiency Standard to be updated by the
state every three years. The 2005 study tabulated the income
requirements for families of various sizes in the state’s eight
counties and noted the reductions in reliance on public programs as the hourly wage increased.14 There was a brief 2008
update to the 2005 study and none following that report as
required by the legislation. In 2012, Wider Opportunities for
Women in cooperation with Connecticut’s Permanent Commission on the Status of Women issued the Basic Economic
Security Tables™ (BEST) index for the state and its five
relatively distinct demographic regions.15
Source: Federal Reserve Economic Data (FRED)-Federal Reserve Bank St. Louis
There have been several explanations that attempt to
account for labor’s declining share of national income.
Market-driven explanations center on skill-biased technological change; institution-driven explanations focus on
de-regulation of markets and financialization, as well as policies toward unions. Outsourcing as an explanation focuses
on corporations’ splitting off their earlier-stage production
processes and purchasing these inputs, including labor
services from outside firms.16 In addition, the lackluster job
growth recoveries, known as “jobless-recoveries,” have not
only been attributed to the decline of the defense-spending
after the Cold War, which was a significant driver of Connecticut’s 1980’s boom, but also to the growth in managerial power and income inequality, in what Robert Gordon
(2010) has called the Disposable Worker Hypothesis.17
The result of these and other trends in the U.S. economy
over the last 30 years, has been a growth in the working
poor. The term “working poor” flies in the face of the notion
that a job is necessarily the route out of poverty. As Schiller
(2008) notes in his textbook, The Economics of Poverty and
Discrimination:
97.46% of its 2003 level, down 2.54% and lower than the
Massachusetts’ 2010 employment level, which was 1.73%
lower than its 2003 level. The U.S. 2010 employment level
was down slightly, but essentially flat compared to its 2003
level.
We know, for example, that many poor people whom we
do think of as unemployed do work a great deal. A salient characteristic of the subemployed poor is that they
are repeatedly engaged in part-time or part-year work.
Hence, we can reject the naive assumption that employment automatically lifts a person out of poverty.18
When looking at job growth over the current recovery,
depicted in Graph 2, Connecticut lags behind New York,
Massachusetts and the United States. Between 2010 and
2014, Connecticut’s job growth was less than 3%. Massachusetts and U.S. job growth exceeded 6%, while New York
payroll employment grew 5.60%. Clearly, Connecticut’s job
growth, compared to two neighboring states and the United
States, has been weak between 2000 and 2014. However,
though Connecticut is creating fewer jobs, are they higher
paying than those created in Massachusetts, New York, and
the United States as a whole?
The next section reviews the extent and nature of job
growth in Connecticut since 2000 and compares that
growth to neighboring states New York and Massachusetts
and the United States, and then reviews the first four years
of the current recovery.
Graph 2 shows the percent change in occupational employment for Connecticut, the United States, Massachusetts and
New York over the first complete employment cycle since
2000. Measured trough-to-trough, the cycle begins with the
turnaround in jobs after the end of the 2001 Recession occurring in 2003. In 2003, employment began growing again
for Connecticut, Massachusetts, New York, and the nation.
The end-point trough would be when employment turned
around after the end of the 2007-2009 Great Recession.
For the United States and Connecticut that turnaround
was 2010, for Massachusetts and New York, it was 2009.19
Because Connecticut and U.S. employment turned around
in 2010, it will be used as the terminal point of the 20032010 employment cycle. Graph 2 shows the percent change
in jobs over the first four years of the current recovery.
Connecticut’s job growth has been largely concentrated in
the bottom quartile (the first 25th percentile). Graph 3
presents the growth rate of the major Standard Occupational
Codes for occupations in which the median wage was equal
to, or less than, the 25th percentile wage for all occupations
over the current recovery. At first glance, it appears that
Connecticut’s growth rate in occupations with a median
wage in the lowest quartile, at 13.88%, is only slightly higher
than that for Massachusetts and the U.S., and certainly below New York’s 15.75% growth rate. However, recall that, as
depicted in Graph 2, Connecticut’s job growth over the current recovery lagged behind that of Massachusetts, New York,
and the United States. Thus, the 13.88% growth in Connecticut’s jobs in the bottom quartile (the lowest-wage quartile) translates into a much larger share of total employment
growth. And, as illustrated in Graph 4, more than half of
the jobs that Connecticut has added to its economy between
2010 and 2014 were in occupations with a median wage at or
New York fared best over the 21st century’s first complete
employment cycle. By 2010, New York’s employment was at
101.02% of its 2003 level. Graph 2 shows Connecticut fared
the worst. In 2010, Connecticut’s employment level was
GRAPH 3: % Change in Employment of
Occupations With Wages in the 25th Percentile
GRAPH 2: Percent Change in Total Employment
8.00
6.52
6.00
4.00
20.00
18.00
16.00
14.00
12.00
10.00
8.00
6.00
4.00
2.00
0.00
6.32
5.60
2.99
2.00
1.02
0.00
0.37
-2.00
-4.00
2.54
1.73
CT
-6.00
-8.00
2003-10
MA
NY
US
2010-14
SOURCE: U.S. BLS and authors’ calculations
15.75
13.88
13.67
CT
MA
SOURCE: U.S. BLS-OES and authors’ calculations
4
13.58
NY
US
The Impact of the State’s Low-Wage
Employment on Public Assistance
GRAPH 4: Share of Job Growth for Occupations
With Wages in the 25th Percentile
75.00
50.00
The weak growth of Connecticut’s hourly earnings, shown
in Graph 5, is clearly driven by the fact that one-half of the
jobs added to Connecticut’s economy, over the current recovery are in occupations in which the median wage is at or
below the 25th percentile for all occupations, as illustrated
in Graph 4. Thus, the potential for working families to need
to rely on public programs is greater in Connecticut than in
New York, Massachusetts and the nation. To the extent this
conclusion is actually realized, Connecticut’s budget woes
will worsen.
50.78
31.11
25.13
23.14
25.00
0.00
CT
MA
NY
US
SOURCE: U.S. BLS-OES and authors’ calculations
The forthcoming report, “The High Public Cost of Low
Wages: Poverty-Level Wages Cost U.S. Taxpayers $152.8
Billion Each Year in Public Support for Working Families,”
shows that more than half of state and federal spending on
safety net programs now goes to working families (families
with a member who at least 27 weeks per year and at least
10 hours per week).20 The report estimates that the cost to
the State of Connecticut for the reliance of working families
on Medicaid/CHIP and TANF is $486 million, representing
54% of the total costs of those programs to the state.
below the 25th percentile wage for all occupations. This, in
turn, has led to the result depicted in Graph 5.
Graph 5 tracks an index of total private average hourly
earnings for Connecticut, Massachusetts, New York, and
the United States. The first year of the current recovery in
employment, 2010, is the base year and equal to 100. Graph
5 shows the growth in Connecticut’s total private average
hourly earnings (not adjusted for inflation), has significantly
lagged that of the United States, which itself has had weak
growth relative to past recoveries, as well as lagging behind
Massachusetts and New York.
Higher wages and increases in employer-provided health
insurance would result in significant Medicaid savings that
states and the federal government could apply to other programs and priorities. Higher wages would also significantly
reduce federal expenditures on the EITC and SNAP. Overall, higher wages and employer-provided health care would
lower both state and federal safety net costs, and allow all
levels of government to better target how their tax dollars
are used as we describe above.
After growing weakly in 2011, Connecticut’s hourly earnings then declined, and were 1.04% below their 2010 level
by 2013. Hourly earnings recovered somewhat in 2014, but
were still slightly below their 2011 level. While in 2014
total private hourly earnings for Massachusetts were 9.62%
above their 2010 level, and for New York and the U.S. over
8% above their 2010 levels, Connecticut’s hourly earnings
were just 1.11% above their 2010 level.
Conclusion
In conclusion, the State of Connecticut is challenged to
devise strategies to raise the wages of low-income workers
to reduce their reliance on public programs and thereby to
reduce tax costs, as well as to increase their participation
in the economy. Such strategies would both contribute to a
more robust economy and increase tax revenues as a result
of increased consumption and participation by lower-wage
workers. Policymakers have several options to consider that
can help achieve these goals.
Ave Hrly Earn Index (2010 = 100)
GRAPH 5: Index of Total Private Hourly Earnings
112.00
MA=109.62
110.00
NY=108.00
108.00
106.00
U.S.=108.06
104.00
102.00 100.00
100.00
CT=101.11
CT=101.61
CT=98.96
98.00
2010
2011
2012
2013
2014
SOURCE: U.S. BLS-CES and authors’ calculations
5
About the Authors
7
Daniel Kennedy, Ph.D., was Senior Economist in the
Office of Research, Connecticut Department of Labor, from
1993 to 2015. In addition, he was Contributing Editor and
Forecast Manager for The Connecticut Economy from 2006
to 2013. He currently serves as a consulting economist and
contributor to the Hartford Business Journal’s Annual
Economic Outlook.
8
For example, see http://www.bloomberg.com/bw/articles/2014-02-13/
making-the-economic-case-for-more-than-the-minimum-wage#p2.
As one example, Starbucks pays many of its workers significantly
more than the local minimum wage and offers company stock as an
additional form of compensation. See http://www.forbes.com/sites/
samanthasharf/2015/03/18/why-starbucks-pays-its-baristas-with-stocka-beginners-guide-to-company-stock.
9
See http://www.epi.org/publication/ratio-job-seekers-job-openingsholds-steady.
10
See “Low Wage Nation, The Job Gap, Connecticut,” Alliance for a
Just Society, www.thejobgap.org.
Stan McMillen, Ph.D., retired in 2012 from the Connecticut
Department of Economic and Community Development
where he was Managing Economist for six years. He previously worked in the aerospace, CAD/CAM and medical
device industries before obtaining his doctorate in economics at UCONN in 2005. He is now a Visiting Professor of
Economics at UCONN, Trinity College and Connecticut
College.
11
“The U.S. economy to 2022: settling into a new normal,” The
Monthly Labor Review, December 2013, http://www.bls.gov/opub/
mlr/2013/article/the-u-s-economy-to-2022-settling-into-a-new-normal.
htm.
12
See http://www.cga.ct.gov/fin/taskforce.asp?TF=20140929_State%20
Tax%20Panel and http://www.ctnewsjunkie.com/archives/entry/tax_
review_panel_convenes_monday/ for specifics and a summary.
Louise Simmons, Ph.D., serves as a Professor of Social
Work at the University of Connecticut. She teaches and
does research on social policy, economic justice issues, urban
issues and community organization. She lives and is involved
with many issues in the City of Hartford.
13
Phelps, Edmund S. (1994). “Low-wage Employment Subsidies versus
the Welfare State,” American Economic Association Papers and
Proceedings, vol. 2, no. 84, Raising the Employment and Pay of the
Working Poor, May 1994.
14
See http://selfsufficiencystandard.org/docs/Connecticut%202005.pdf.
This was the third report in the series. The first two were published in
1999 and 2002.
This issue brief was funded by Jobs With Justice Education Fund.
15
See https://ctpcsw.files.wordpress.com/2012/04/basic-economicsecurity-tables-index-for-connecticut-2012-2.pdf. It is not clear that
the 2012 report satisfies the requirement of P.A. 02-54.
Endnotes
1
16
See Kennedy, Daniel W., Income, Inequality, Poverty, and Labor Markets (February 2015) THE CONNECTICUT ECONOMIC DIGEST,
Connecticut Department of Labor and Connecticut Department of
Economic and Community Development, p. 3.
See http://www.workingpoorfamilies.org.
2
“Meeting the Challenge, The Dynamics of Poverty in Connecticut,”
http://www.cafca.org/files/CT Poverty Report.pdf.
3
17
Gordon, Robert. “The Demise of Okun’s Law and of Procyclical Fluctuations in Conventional and Unconventional Measures of Productivity,”
(July 21, 2010) National Bureau of Economic Research: Cambridge.
See http://aspe.hhs.gov/hsp/lwlm99/overview.htm.
4
Gordon, Robert J. (2011), “The case of the US jobless recovery: Assertive management meets the double hangover,” http://www.voxeu.
org/article/case-us-jobless-recovery-assertive-management-meetsdouble-hangover.
18
Schiller, Bradley C., The Economics Of Poverty And Discrimination (10th Ed.), (2008) Pearson Prentice-Hall: Upper Saddle River,
NJ Chapter 6-The Working Poor, p. 103,
19
5
For an excellent historical overview, see “Good Jobs Strong Communities, Creating a High-Wage Future for Connecticut,” December
2001, http://www.ctneweconomy.org/wp-content/uploads/goodjobs.pdf.
Employment series turning points are based on seasonally adjusted,
Non-Farm Employment data for Connecticut, Massachusetts, New
York, and the U.S. from the U.S. Bureau of Labor Statistics (BLS).
6
20
Ken Jacobs, Ian Perry and Jenifer MacGilvary. 2015. “Low Wages
Cost the Federal Government $127.9 Billion and States $25 Billion
a Year in Public Safety Net Programs for Working Families,” forthcoming report from the UC Berkeley Center for Labor Research and
Education.
See “As Fast Food Workers Go on Strike in 100 Cities, Applebees
Introduces the ‘Waiter Terminator’,” http://investingchannel.com/
article/276476/As-Fast-Food-Workers-Go-On-Strike-In-100-CitiesApplebees-Unveils-The-Waiter-Terminator#.VRmfFcm1RLY.
6


© Copyright 2026