
Historical Marriage Trends from 1890-2010: A Focus on Race Differences Authors:
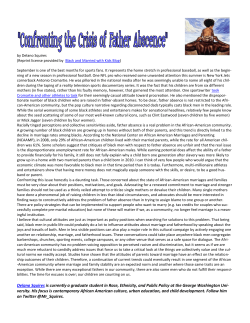
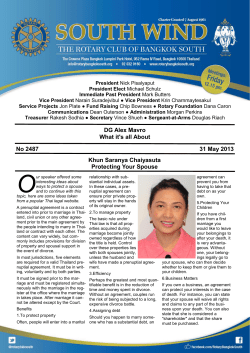
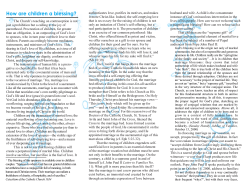
Historical Marriage Trends from 1890-2010: A Focus on Race Differences
SEHSD Working Paper Number 2012-12
Authors:
Diana B. Elliott1,
Kristy Krivickas,
Matthew W. Brault, U.S. Census Bureau
Rose M. Kreider, U.S. Census Bureau (corresponding author)
Phone:
301-763-6059
Fax:
301-457-3500
Email:
[email protected]
Conference:
Annual meeting of the Population Association of America,
San Francisco, CA
Form:
Paper submission
Abstract:
Public rhetoric often decries a societal retreat from marriage – that it is an increasingly
obsolete institution (Time Magazine/Pew Research Center 2010). The 1950s have been
described as the “golden age” of marriage in the United States and marriage has declined since
the 1960s (Coontz 2000/1992; Cherlin 2009/2004). In this paper, we take a longer view of the
history of marriage by sex and race, describing trends among those never married at age 35 and
age 45 and older, and historical median ages at first marriage using Decennial Census data. We
find that the 1950s and 1960s were an anomaly for men and women given the high proportions
married at young ages. Race differences are particularly interesting, as black women were more
often married than white women prior to World War II, yet since the 1980s, have been
increasingly less likely to be married.
Keywords: marriage, race, historical time series
1
Diana Elliott, Ph.D. is the Research Manager for Pew’s Economic Mobility Project. The research
included in this paper was conducted while she was a family demographer at the US Census
Bureau.
This report is released to inform interested parties of ongoing research and to encourage
discussion of work in progress. The views expressed on statistical or methodological issues are
those of the authors and not necessarily those of the U.S. Census Bureau.
1
Recently, the media has reported that marriage is a failing institution. In fact, a study
issued by a collaborative effort between Time Magazine and the Pew Research Center (2010)
found that 39 percent of Americans say that marriage is becoming obsolete compared to only 28
percent of Americans in 1978. However, over 90 percent of American women will marry by age
45 (Goldstein & Kenney 2001). While an increasing number of individuals may decide not to
marry now compared with the “golden age” of marriage in the 1950s, a broader historical context
may provide further insight. Coontz (2000/1992) argues that the ideal American family of the
1950s was an image that accrued by combining multiple pictures of the family throughout the
decades.
Is the recent decline in the proportion of individuals that have ever married different than
the years prior to the “golden age of marriage”? The current paper highlights the importance of
context and the chosen historical reference point when examining marriage patterns in the United
States. Specifically, this paper looks at two historical trends in family studies and explicitly
details sex and race differences using data from Decennial Censuses and the American
Community Survey (ACS). First, we examine how the median age at first marriage has changed
from 1890-2010 by sex and race. While the trend in age at first marriage has been examined
previously by sex (U.S. Census Bureau 2010, National Center for Family & Marriage Research
2010, Norton & Moorman 1987), less research has examined these trends by both sex and race
(Fitch & Ruggles 2000; Rodgers and Thornton 1985). Additionally, we present analyses on the
proportion of the population age 15 and over who have never been married at ages 35 and 45
broken down by both sex and race from 1890 to 2010.
We contribute to the marriage literature by providing a current, extensive historical trend
analysis of never married men and women. Relatively little research has taken an historical
2
approach to analyzing race differences in marriage. To date, the historical literature includes
Rodgers and Thornton’s (1985) and Fitch and Ruggles (2000) analyses on the proportion evermarried and the median age at first marriage by sex and race. We extend their work by
providing more current statistics and by placing race differences in a larger, societal context.
While present-day research shows that the decline in marriage among blacks has been
more precipitous than has been the case for other groups (Cherlin 2009), this paper seeks to
address whether blacks have historically been less likely to marry than whites and the point at
which trends in marriage diverged for blacks and whites. Critically, we go further than only
documenting the median ages and proportions of ever-married. Instead, we couch our analysis
in theoretical race terms: the structure versus culture debate in race differences in family
organization. Foreshadowing our results, we find that black men and women were married in
greater proportions than white men and women until 1960 for men and 1970 for women.
Therefore, we make the argument that structural components are more influential than cultural
components in determining race differences among never married individuals.
Background
Entry into First Marriage
Since the 1940s and 1950s, the composition of American families has changed, with
marriage rates declining substantially. Cherlin (2004) discusses the deinstitutionalization of
marriage. Society has become more accepting of different forms of marriage and alternatives to
marriage. Since the 1960s, marriage has moved from being a companionate type of relationship,
which focuses on the satisfaction and pleasure that comes from playing the role of spouse, to a
more individualized type of relationship, which focuses on developing an individual’s own sense
of self (Cherlin 2004, 2009). Despite cultural rhetoric about “preserving marriage,” modern-day
3
romantic unions are characterized by an ever-increasing diversity of forms, and marriage - as an
institution - has been disassociated from the pragmatic daily functions it once served (Cherlin
2009). Such cultural shifts in the latter half of the twentieth century have contributed to a decline
in marriage rates.
Importantly, while marriage rates have declined, research has found that marriage is most
often delayed rather than foregone (Goldstein & Kenney 2001). We see this delay in the fact that
the age at first marriage has risen steadily since 1974 and is currently at an historical high point
for both men and women in the last 100 years2. The June 2010 Current Population Survey
indicates that the median age at first marriage for women is 26.1 and 28.2 for men2. Increases in
the age at first marriage are associated with continuing education and stabilization of
employment opportunities (Martin 2004). However, more than 90 percent of women will
eventually marry; with women with higher educational attainment being more likely to
eventually marry than women with less than a college degree (Goldstein & Kenney 2001).
Looking at race, numerous studies have found that blacks are less likely to marry than
whites are (Carlson, McLanahan & England 2004; Harknett & McLanahan 2004; Western &
McLanahan 2000). More recently, black women are often in an increasingly precarious position
when it comes to marriage. Data from the 1990 Integrated Public Use Microdata Series
(IPUMS), show that an increase in black men’s interracial marriage rates is associated with
declining rates of black women’s marriage rates (Crowder & Tolnay 2000). While research has
shown that black men and women are currently less likely to be married, has this been the case
2
See U.S. Census Bureau’s America’s Families and Living Arrangements historical series Table MS-2
http://www.census.gov/population/socdemo/hh-fam/ms2.xls.
4
historically? We now look at two potential explanations as to why the proportion who marry
may differ historically for blacks and whites: cultural and structural.
Theoretical Framework – Cultural versus Structural Components of Marriage
Two divides persist in academic research on the organization of black families, splitting
researchers between cultural factors and structural and economic factors (Sarkisian & Gerstel
2004; Wilson 2009). Importantly, cultural and structural factors are not fully independent of
each other. Wilson’s (2009) research suggests that cultural and structural factors interact
together to create black men’s social and economic position. We provide examples of cultural
factors such as family structure and distrust, and structural factors such as mass incarceration and
drug policies that might be associated with differential family formation patterns. We do not
use either the structural or cultural factors as variables in this study; rather, we present these
explanatory examples as a means of providing a contextual framework for the historical trends.
With respect to family structure, researchers argue that black families are more likely to
place a higher value on extended kin ties than white families (Staples 1981; Sudarkasa 1996).
For example, living and visiting with extended family is more likely to occur among black men
than white men (Sarkisian 2007). Morgan and colleagues (1993) analyzed 1910 Census data
and found that black households were more likely to be composed of extended family members,
and more likely to be female headed families than white households were. Consequently, there
were fewer nuclear couple-headed black households containing only parents and their own
children than was the case among white households in 1910. Additionally, researchers have
found that black families are typically more accepting of non-marital births than white families
5
are (Pagnini & Morgan 1996). Such research suggests a greater acceptance of extended ties and
non-traditional family formation among blacks.
Another potential cultural point of difference is the distrust in relationships that may
affect low-income couples disproportionately. Poor black neighborhoods are often affected by a
lack of informal job networks. For example, black individuals in poor neighborhoods may not
refer family and friends to jobs because of a lack of trust and fear that their friends may not
perform quality work and could possibly jeopardize their own employment (Smith 2007). Lack
of referrals within informal job networks may place poor black men at further disadvantage to
being gainfully employed. Their lower levels of employment may then lower their chances of
marriage. Distrust may also overshadow romantic relationships3. Wilson (2009) argues that
marital and non-marital black relationships are often characterized by distrust and antagonism, as
he found that black women express suspicions of the romantic interests of black men. This kind
of distrust in relationships may discourage couples from marrying.
Structural factors in society, such as mass incarceration and drug policies have also been
linked to family formation patterns in black families and may explain variations in marriage
across the last century. Punitive policies toward drug control and policies implementing harsh
sentences have led to the United States having the highest incarceration rates of any Western
country (Western & Wildeman 2009; Western & Petit 2010). A critical component of the prison
boom that began in 1980 is the rise in social inequality in mass incarceration. (Western & Pettit
2010). Western and Wildeman (2009, pg. 228) state that black men are eight times more likely
3
Low-income couples are also plagued by sex mistrust and issues of fidelity (Edin 2000; Edin, England & Linneberg
2003).
6
to be incarcerated than Whites across all age groups and education levels. Social inequality in
imprisonment is becoming so extensive that incarceration is becoming a normative life course
stage among low-educated, black men (Pettit and Western 2004). Additionally, black fathers
have higher rates of incarceration than white fathers (Wildeman 2009). The absence of young,
black men in the household population as a consequence of such policies might be observable in
differential marriage patterns by race over the last century.
Given the changes over the last century in values about marriage and increasing
inequality among black and white families, we might expect to see differential outcomes with
respect to marriage. Such outcomes are evident in the work of Rodgers and Thornton (1985) and
Fitch and Ruggles (2000) who each examined historical differences in age at first marriage by
sex and race. When Rodgers and Thornton were writing about marriage patterns by sex and race
in 1985, they were seeing the beginning of trends we are quite familiar with today. Using
historical data through the early 1980s, they wrote of the increased propensity among all men
and women to delay marriage and the greater decline in first marriage probabilities among blacks
relative to whites. They witnessed the beginning of this trend and questioned whether it would
continue. Fitch and Ruggles (2000) presented the next research snapshot into this trend, finding
that through 1998, the delays in first marriage had continued and that the race differences were
even more striking. Historically, age at first marriage among black men and women had been
earlier or on par with white men and women, yet by 1960, such trends reversed. They found that
from 1970 to 1990, the marriage age rose “substantially faster for blacks than for whites,” (Fitch
& Ruggles 2000, p. 65). Their prime explanation for such change was tied to worsening
economic prospects for black men in the postwar period, absent of other structural explanations.
7
Certainly, following the “golden age” of marriage in the 1950s (Coontz 2000/1992) and
the increasing shifts away from marriage that have happened since the 1960s (Cherlin 2009;
Rodgers and Thornton 1985; Fitch and Ruggles 2000), we might expect to see continuing
changes for all individuals with respect to delayed and forgone marriage from the 1960s through
the present. However, we might also expect to see the shifts away from marriage continue to be
more pronounced among black men and women than among their white counterparts, due to
societal inequalities affecting black families in the latter half of the twentieth century and
beginning of the 21st century. Certainly, when placed in a longer historical context, we expect to
see that marital patterns differ from a century ago, even if the societal explanations for such
changes remain unclear as we move into the 21st century.
Data and Methods
The analyses in this paper draw upon historical data on marital status derived from both
the Decennial Census and the American Community Survey (ACS). Decennial Census data are
collected every ten years in the United States, as mandated by the constitution. Decennial data
are collected from every individual in the country and a question about individual’s marital status
has been asked in some manner since the late 1800s through the year 2000. Marital status was
not asked on the 2010 Decennial Census, preventing us from solely using decennial data in our
analyses. After 2000, we use data from the ACS which has been fully implemented since 2005
and is the largest nationally representative survey conducted annually by the Census Bureau.
Marital status has been asked of respondents since the inception of the ACS, allowing continuous
analysis of annual and nationally representative marriage data.
8
The majority of the data used in these figures were selected from Decennial Census data
for the period 1890 to 2000. Decennial numbers were extracted from published tables that
categorized men and women according to age, race and marital status. The numbers were then
used to calculate the percent never married by sex and race for different age groups.
There are two notable exceptions to the use of published Decennial data in this paper.
First, as previously mentioned, the 2010 Decennial Census did not include marital status.
Because marital status is asked on the ACS and it is a large and nationally representative sample,
ACS data were used in analyses after the year 2000. Second, published tables on marital status
between the years 1940 and 1960 reflected race in terms of “white” and “nonwhite.” There is a
trade-off in our data: we have the completeness of data that the published Decennial Census
tables provide, yet lack important specificity for black men and women during key decades in the
middle of the twentieth century. Most of the non-white population during these decades was
black. The black population consisted of 95.6 percent of the total “nonwhite” population in
1940, 95.5 percent in 1950, and 92.1 percent in 1960.4
In this paper, we examine the proportion of men and women never married by certain age
cut-points (35 and older; 45 and older) by race. Additional analyses examine the median ages at
first marriage for men and women by race using a model based on the work of Shryock and
4
Data for 1940 and 1950 are from Table 97 on page 1-172, “Census of Population: 1950, Volume II: Characteristics
of the Population, Part 1, United States Summary” published by the Bureau of the Census in 1953. Data for 1960
are from “Race of the Population of the United States, by States: 1960, PC(81)-10,” published by the Bureau of
the Census on September 7, 1961.
9
Siegel.5 The Shryock and Siegel model calculates the median age at first marriage based on the
proportions of never married men and women in 5-year age categories from age 15 through age
49. The model assumes that half of all who are never married between the ages of 45 to 54 will
marry by the end of their lives. In this paper, we recreate the Shryock and Siegel model for each
year of Decennial Census data from 1890 through 2010 (using ACS data for the 2010 estimate),
by sex and by race. We had to adapt the Shyrock and Siegel model to use 10-year age
groupings, rather than 5-year age groupings, because of the lack of data for 5-year age groupings
for all historical data points.6 One limitation to this study is that the estimations for median ages
at first marriage are less refined than would otherwise be attained using the Shyrock and Siegel
method. But we feel this limitation is offset by using national data from published Decennial
Census tables (rather than the 5 percent PUMS sample) and by having median age estimations by
sex and race for each decade from 1890 through the present.
Findings
Proportion Never-Married
The goal of this paper is to examine the longer historical context of marriage in the
United States, with a particular eye toward race. By taking a long historical view, we hope to
gain insight into the long-term trends and possible future directions of marriage in this country.
5
Shryock, Henry S. and Jacob S. Siegel. 1971. The Methods and Materials of Demography. U.S. Bureau of the
Census, Washington, DC.
6
Appendix Figures 1 and 2 demonstrate the differences in estimated median ages using 10-year age groups rather
than 5-year age groups in the Shyrock and Siegel models. The authors would like to acknowledge Matthew Brault
at the U.S. Census Bureau for programming the Shyrock and Siegel model in SAS and adapting it for the 10-year
age group analysis.
10
Looking at the data for the median age at first marriage, as well as the proportions never married
at age 35 and 45 and older, we see that, in fact, the 1950s and 1960s were historical anomalies
for marriage.
Figure 1 shows median age at first marriage by sex for each decade between 1890 and
2010, as calculated using the Shyrock and Siegel method. Age at first marriage among men and
women was much higher in 1890 than in the 1950s. Median age at first marriage in 1890 was
26.5 years for men and 23.6 years for women compared with 24.0 for men and 20.5 for women
in 1950.7 It was not until 1990 that the median age at first marriage for men and women was at or
above its 1890 value. Despite the perceived delay among men and women in the age at first
marriage, when looking at the longer historical trend, we have only relatively recently surpassed
the age at first marriage at the end of the 19th century. In historical context, the 1950s are an
anomaly given the young ages at which individuals were first marrying.
The differences by sex are also worth noting. For men, the median age in 2010 was only
1.9 years higher than 1890 and 2.1 years higher than 1900. This is contrasted with the difference
for women: the median age at first marriage for women in 2010 was 3.2 years higher than in
1890 and 3.4 years higher than in 1900. This likely reflects the change in women’s status in
society – as women are pursuing education and careers before marriage in greater numbers in
U.S. society, they are increasingly delaying the age at which they marry (Martin 2004). This
7
The estimates in this paper are in some cases based on responses from a sample of the population. As with all
surveys, estimates may vary from the actual values because of sampling variation and other factors. All
comparisons made in this report with survey data have undergone statistical testing and are significant at the 90percent confidence level unless otherwise noted.
11
could explain the greater difference in ages at first marriage for women relative to men over the
last century.
Considering the delay in the age at first marriage in the latter half of the twentieth century
and its parallels to the latter half of the nineteenth century, we might expect to see the same
trends in the proportion never married at later and later ages. Interestingly, the proportion never
married at ages 35 and older and at ages 45 and older does not reach its low point in the 1950s as
was the case with the age at first marriage, but rather reaches its low point around 1980. The low
proportion of never married at older ages seen in the 1980s reflects the early entry into marriage
in the 1950s when people were 20 to 30 years younger. Looking at Figure 2, in 1890, 11 percent
of men and 8 percent of women age 35 and older had never been married. These proportions
rose to 13 percent of men and 10 percent of women age 35 and older having never been married
in 1920. Gradually, over the next sixty years, the proportion of men and women who had never
been married by age 35 dropped to 6 percent of men and women in 1980. By 2010, the
proportion of men and women 35 and older who had never been married had surpassed 1920
levels (14 percent of men and 11 percent of women overall).
Looking at the proportion of never married women and men ages 45 and older, the story
is similar. Never married men and women age 45 and over were more common around the
beginning of World War II than is the case in the 21st century. Figure 3 shows that in 1940, 11
percent of all men and 9 percent of all women age 45 and older were never married. By 1990,
only 6 percent of men and 5 percent of women age 45 and older had never been married. By
2010, 10 percent of men and 8 percent of women age 45 and older had never been married. The
proportions of never married men and women age 45 and older today have still not reached the
12
proportions in 1940. The figures illustrate that delays in the age at first marriage have reached
historic highs as of 2010, but the proportion of people who are not married by age 45 remain
lower in 2010 than in 1940. The data up to 2010 show delays to entering the institution of
marriage, but not a commensurate abandonment of marriage.
Figures 4, 5, and 6 describe differences by race in the median ages at first marriage and
proportions never married for those ages 35 and older, and 45 and older. Figure 4 examines
differences in the median ages at first marriage by sex and race using decennial data from 1890
to 2000 and ACS data from 2010 using the modified Shyrock and Siegel technique. In 1890, the
median age at first marriage for black women was 22.3 years, compared with white women with
a median age at first marriage of 23.7 years. This pattern continued with the median age at
marriage lower for black women than for white women for 60 years until 1950 when white and
black women had substantively equivalent median ages at first marriage (20.5 for white women
and 20.3 for black women, which do differ statistically). After 1950, the median age at first
marriage for black women was higher than for white women. By 2010, the median age at first
marriage for black women was 30.0 years in contrast with 26.4 years for white women.
Similarly, Figure 4 shows historical evidence that until 1960, black men entered into first
marriages at younger ages than white men. In 1890, the median age at first marriage for black
men was 25.2 years, while it was 26.6 years for white men. In 1950, the median age at first
marriage for black men was still lower at 22.8 years compared to 24.0 years for white men. By
1960, the trend changed and black men began entering into first marriages at later ages than
white men. This trend has continued to the present, such that by 2010, the median age at first
marriage for black men was 30.7 years, compared with 27.8 years for white men.
13
Figures 5 and 6 show greater proportions of never married white men and women over
the ages of 35 and 45 than black men and women in the early part of the 20th century (1900 to
1930). Historically, black women were more likely to have been married by age 35 than their
white counterparts until 1970, and by age 45 until 1980. By 1980, 8 percent of black women
over 35 were never married compared to 5 percent of white women age 35 and older who were
never married (Figure 5). Looking at Figure 6, in 1980, 7 percent of black women were never
married by age 45 compared with 5 percent of white women. Since 1980, the proportion never
married by age 45 among black women has continued to go up notably in contrast to white
women. By 1990, 9 percent of black women over the age of 45 were never married compared
with 5 percent of white women. In 2000, the increase continued for black women over the age of
45; 12 percent of black women over the age of 45 were never married compared with 5 percent
of white women. By 2010, differences by race were even more distinct; 20 percent of black
women aged 45 and older were never married compared with 7 percent of white women aged 45
and older. Furthermore, 20 percent of black men aged 45 and older in 2010 had never been
married compared with 9 percent of white men aged 45 and older. So, the race differences are
notable among men, too. Historically, marriage patterns look quite different by race after 1980
than they did earlier in the last century.
Conclusions and Discussion
Two main findings are evident from this paper. First, the frame of reference from which
marriage rate comparisons are drawn needs to be extended. We provide additional support to
Coontz’s (2000/1992) argument that the “golden era” of marriage of the 1950s is an anomaly.
Although the median age at first marriage in 2010 is the highest on record, the historical
14
Decennial Census data show that the median age at first marriage was higher in decades before
World War II than during 1950 to 1970. The proportions of never married men and women were
also higher prior to 1950 than has been the case until only very recently. Our findings provide a
justification for using a more extensive time frame to study marriage.
The second key finding centers on race differences in historical marriage trends. Looking
from an extended historical frame of reference, we find that black men and women before World
War II entered into first marriages at younger ages and were less likely to be never married than
their white counterparts. Black men were less often never married compared with white men
until 1960, whereas black women were less likely to be never married than white women up until
1970. The turning point comes in 1980, when both black men and women begin a sharp increase
in the proportion never married by age 35 and age 45.
We discussed two theoretical explanations for the divergence in marriage rates over time
by race: structural and cultural. Although our data cannot specifically address which of these is
supported, or to what extent, our results present a baseline for future hypothesis testing between
these two theories. We suggest that researchers examine the coincidence of structural factors of
the 1980s and early 1990s such as drug and welfare policies and punitive prison sentences, and
the steady increase in the proportion of never married black men and women from 1980 to 2000.
Of particular importance for future studies is the examination of the association between the
dramatic increase in black men’s incarceration rates (Pettit & Western 2004) and the rise in the
proportions of black individuals delaying and deferring marriage.
References
Carlson, M., McLanahan, S., & England, P. (2004). Union formation in fragile families. Demography, 41(2): 237261.
15
Cherlin, A. (2004). The deinstitutionalization of American marriage. Journal of Marriage and Family, 66(Nov):
848-861.
Cherlin, A. (2009). The marriage-go-round: The state of marriage and the family in America today. New York:
Alfred A. Knopf.
Coontz, S. (2000). The way we never were: American families and the nostalgia trap. New York, NY: Basic Books.
(Original work published in 1992).
Crowder, K.D. & Tolnay, S.E. (2000). A new marriage squeeze for black women: The role of racial intermarriage
by black men. Journal of Marriage and Family, 62(3): 792-807.
Fitch, C., & Ruggles, S. (2000). Historical trends in marriage formation. In L. Waite, C. Bachrach, M. Hindin, E.
Thomson, & A. Thornton (Eds.), Ties that bind: Perspectives on Marriage and Cohabitation, (pp. 59-88).
Hawthorne, NY: Aldine de Gruyter.
Goldstein, J.R., & Kenney, C.T. (2001). Marriage delayed or marriage forgone? New cohort forecasts of first
marriage for U.S. women. American Sociological Review, 66(4): 506-519.
Harknett, K., & McLanahan, S.S. (2004). Racial and ethnic differences in marriage after the birth of a child.
American Sociological Review, 69(6):790-811.
Martin, S. (2004). Women’s education and family timing: Outcomes and trends associated with age at marriage and
first birth. In K. Neckerman (Eds.), Social inequality, New York, NY: Russell Sage Foundation.
Morgan, S.P., McDaniel, A., Miller, A.T., & Preston, S.H. (1993). Racial differences in household and family
structure at the turn of the century. American Journal of Sociology, 98(4): 798-828.
National Center for Marriage and Family Research. (2010). Family profile on median age at first marriage in the
U.S., 2008. Retrieved from Bowling Green State University, National Center for Marriage and Family Research
Web site: http://ncfmr.bgsu.edu/pdf/family_profiles/file78895.pdf
Norton, A.J., & Moorman, J.E. (1987). Current trends in marriage and divorce among American women. Journal of
Marriage and the Family, 49(Feb): 3-14.
Pagnini, D., & Morgan, S.P. (1996). Racial differences in marriage and childbearing: Oral history evidence from the
South in the early twentieth century. American Journal of Sociology, 101: 1694-1718.
Pettit, B., & Western, B. (2004). Mass imprisonment and the life course: Race and class inequality in U.S.
incarceration. American Sociological Review, 69(2): 151-169.
Pew Research Center. (2010). The decline of marriage and rise of new families. Retrieved December 3, 2010, from
http://pewsocialtrends.org/files/2010/11/pew-social-trends-2010-families.pdf
Rodgers, W.L., & Thornton, A. (1985). Changing patterns of first marriage in the United States. Demography,
22(2): 265-279.
Sarkisian, N. (2007). Street men, family men: Race and men’s extended family integration. Social Forces, 86(2):
763-794.
Sarkisian, N., & Gerstel, N. (2004). Kin support among blacks and whites: Race and family organization. American
Sociological Review, 69(Dec): 812-837.
16
Shryock, H.S., & Siegel, J.S. (1971). The methods and materials of demography. U.S. Bureau of the Census,
Washington, DC.
Smith. S.S. (2007). Lone pursuit: Distrust and defense individualism among the black poor. New York: Russell
Sage Foundation.
Staples, R. (1981). The myth of the black matriarchy. In F. Chioma Steady (Ed.) The black Women Cross-Cultural.
Cambridge, MA: Schenkmann.
Sudarkasa, N. (1996). The strength of our mothers: African & African-American women & families: Essays and
speeches. Trenton, NJ: Asmara Africa World Press.
United States Census Bureau. (2010). America’s Families and Living Arrangements, Current Population Survey
(CPS) Reports – Historical Time Series Marital Status Table MS-2. Retrieved December 2, 2010, from
http://www.census.gov/population/www/socdemo/hh-fam.html
Western, B., & McLanahan, S. (2000). Fathers behind bars: The impact of incarceration on family formation. In
G.L. Fox & M. L. Benson (Eds.), Contemporary Perspectives in Family Research: Families, Crime and Criminal
Justice, (pp. 309-324). New York: JAI.
Western, B., & Pettit, B. (2010). Incarceration and social inequality. Daedalus, 139(3): 8-19.
Western, B., & Wildeman, C. (2009). The Black family and mass incarceration. The ANNALS of the American
Academy of Political and Social Science, 621: 221-242.
Wildeman, C. (2009). Parental imprisonment, the prison boom, and the concentration of childhood disadvantage.
Demography, 46(2): 265-280.
Wilson, W.J. (2009). More than just race: Being black and poor in the inner city. New York, NY: Norton &
Company.
17
Appendix Figure 1. Comparison of Median Ages at First Marriage for Men:
10-year and 5-year Shyrock and Siegel Method of Estimation for Selected
Census Years and Vital Statistics Data
27
26
25
24
10-year
5-year
23
Vital Statistics
22
21
20
1930
1940
1950
1960
1970
1980
1990
2000
Source: U.S. Decennial Census (1930-2000); National Center for Health Statistics, “Advance Report of Final Marriage
Statistics, 1989 and 1990.” Monthly Vital Statistics Report, Volume 43, No. 12. Supplement, 1995, Table 9.
Appendix Figure 2. Comparison of Median Ages at First Marriage for
Women: 10-year and 5-year Shyrock and Siegel Method of Estimation for
Selected Census Years and Vital Statistics Data
26
25
24
10-year
23
5-year
Vital Statistics
22
21
20
1930
1940
1950
1960
1970
1980
1990
2000
Source: U.S. Decennial Census (1930-2000); National Center for Health Statistics, “Advance Report of Final Marriage
Statistics, 1989 and 1990.” Monthly Vital Statistics Report, Volume 43, No. 12. Supplement, 1995, Table 9.


© Copyright 2026