
N-doped graphene nanoribbons as efficient metal
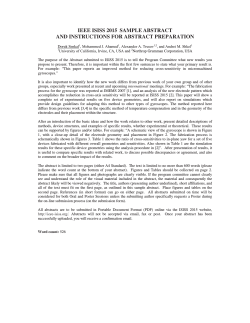
Published on 08 January 2015. Downloaded by CASE WESTERN RESERVE UNIVERSITY on 18/04/2015 18:59:48.
Nanoscale
View Article Online
PAPER
Cite this: Nanoscale, 2015, 7, 7078
View Journal | View Issue
N-doped graphene nanoribbons as efficient
metal-free counter electrodes for disulfide/thiolate
redox mediated DSSCs†
Yuhua Xue,a,b Janice M. Baek,‡b Hao Chen,*a Jia Qu*a and Liming Dai*a,b
Nitrogen-doped graphene nanoribbons (N-GNRs) were prepared by thermal treatment of the as-zipped
graphene oxide nanoribbons in NH3 gas. X-ray photoelectron spectroscopy (XPS) measurements revealed
a high nitrogen content up to 6.5 atom% for the as-prepared N-GNRs. This, together with the high
Brunauer–Emmett–Teller (BET) surface area of about 751 cm2 g−1, prompted us to use the N-GNR as the
first low-cost, metal-free counter electrode for disulfide/thiolate redox mediated dye-sensitized solar
Received 25th November 2014,
Accepted 20th December 2014
cells (DSSCs). Compared with the widely-used platinum electrode, the newly-developed N-GNR counter
electrode showed a dramatically improved power conversion efficiency for DSSCs based on the thiolate/
DOI: 10.1039/c4nr06969b
disulfide redox shuttle. The observed superior cell performance was attributed to the enhanced charge
www.rsc.org/nanoscale
transfer capability and electrocatalytic activity induced by N-doping of the graphene nanoribbon.
Introduction
Dye-sensitized solar cells (DSSCs) have attracted a great deal of
interest due to their high energy conversion efficiency and
simple, inexpensive device fabrication.1–5 A typical DSSC
device consists of a photoanode, counter electrode, and electrolyte. The electrolyte, which transfers the electrons from the
counter electrode to the photoanode electrode within the cell,
plays an important role in regulating the device performance
of DSSCs. The most commonly used electrolyte in the DSSCs is
the triiodide/iodide (I3−/I−) redox couple.1,4,5 Although the
triiodide/iodide couple is efficient for high-performance
DSSCs, it suffers from corrosion of the silver-based current collector and partial absorption of visible light around 430 nm.
Therefore, iodide-free DSSCs have been developed as an
alternative choice.1,6 Interestingly, Gratzel and co-workers have
developed a new electrolyte based on the disulfide/thiolate
(T2/T−) redox couple of negligible optical absorption in the
visible region, and hence with potential applications in trans-
a
Institute of Advanced Materials for Nano-Bio Applications, School of Ophthalmology
& Optometry, Wenzhou Medical College, 270 Xueyuan Xi Road, Wenzhou, Zhejiang
325027, China. E-mail: [email protected], [email protected]
b
Center of Advanced Science and Engineering for Carbon (Case4Carbon),
Department of Macromolecular Science and Engineering, Case Western Reserve
University, 10900 Euclid Avenue, Cleveland, Ohio 44106, USA.
E-mail: [email protected]
† Electronic supplementary information (ESI) available. See DOI: 10.1039/
c4nr06969b
‡ On leave of absence from La Lumiece School, 6801 N. Wilhelm Rd, LaPorte, IN
46250, USA.
7078 | Nanoscale, 2015, 7, 7078–7083
parent DSSCs.7 However, DSSCs with the disulfide/thiolate
(T2/T−) redox couple electrolyte often show a relatively low fill
factor when platinum (Pt) is used as a counter electrode.
Besides, Pt is expensive and has a limited reserve in nature. In
this study, we used nitrogen-doped graphene nanoribbons
(N-GNRs) as metal-free electrocatalysts to replace Pt in DSSCs
based on the T2/T− electrolyte.
Graphene nanoribbons (GNRs) are elongated strips of graphene with straight edges, which have attracted considerable
attention due to their unique structure and bandgap
properties.8–12 Various methods, including lithographic engineering,13,14 chemical vapour deposition (CVD),15 and unzipping of carbon nanotubes,8,10,11 have been devised to prepare
graphene nanoribbons. In the present study, we prepared
N-GNRs by unzipping carbon nanotubes,8 followed by thermal
annealing under an ammonia–argon gas mixture. Compared
with pure carbon nanomaterials, the incorporation of nitrogen
into carbon nanomaterials has been shown to be an effective
way to controllably alter their electronic and surface characteristics.16,17 As a result, nitrogen-doped carbon nanomaterials
have been demonstrated to show an excellent electrocatalytic
performance for the oxygen reduction reaction (ORR) in fuel
cells and triiodide reduction in DSSCs.18–20 While nitrogendoped carbon nanotubes and nitrogen-doped graphene have
been extensively studied, nitrogen-doped graphene nanoribbons have been scarcely reported.21
In this paper we report the preparation of nitrogen-doped
graphene nanoribbons (N-GNRs) by unzipping carbon nanotubes,8 followed by thermal annealing under an ammonia–
argon gas mixture. The resulting N-GNRs showed a high nitro-
This journal is © The Royal Society of Chemistry 2015
View Article Online
Published on 08 January 2015. Downloaded by CASE WESTERN RESERVE UNIVERSITY on 18/04/2015 18:59:48.
Nanoscale
gen content up to 6.5 atom% and a large Brunauer–Emmett–
Teller (BET) surface area of 751 cm2 g−1. The use of our
N-GNRs as a metal-free counter electrode to replace Pt in
DSSCs with a T2/T− electrolyte led to an energy conversion
efficiency even higher than their counterparts with the Pt
counter electrode. The observed superior cell performance was
attributed to an enhanced charge transfer capability and the
electrocatalytic activity induced by N-doping of the graphene
nanoribbon.
Results and discussion
Scheme 1a schematically shows the route to N-GNRs by unzipping carbon nanotubes according to the reported procedure,8
followed by N-doping via thermal annealing under an
ammonia–argon gas mixture (see the Experimental section for
details). The resulting N-GNR was then used as a counter electrode in DSSCs with the T2/T− redox couple electrolyte
(Scheme 1b).
Fig. 1a and b show scanning electron microscopy (SEM)
images of the resulting N-GNRs under different magnifications. As can be seen, most of the carbon nanotubes have
been unzipped into strip-like graphene. Fig. 1c shows the
Paper
corresponding AFM image, confirming the nanoribbon
structure.
The nitrogen content of N-GNRs was measured by X-ray
photoelectron spectroscopy (XPS). Fig. 2a shows an XPS survey
spectrum, from which the carbon, nitrogen and oxygen contents were estimated to be 90.4 atom%, 6.5 atom%, and 3.1
atom%, respectively. The high resolution XPS N1s spectrum in
Fig. 2b shows two component peaks at 398 and 401 eV corresponding to the pyridinic nitrogen and the graphitic nitrogen,
respectively.
The Raman spectrum of the N-GNR is given in Fig. 2c,
which shows a higher D band than the G band with a ratio of
ID/IG = 1.07. The observed higher D band than the G band is
attributable to the large number of edge and nitrogen-doping
induced defects intrinsically associated with the N-GNR, providing an advantage for electrocatalysis. The XRD profile of
N-GNR given in Fig. 2d shows a peak at about 2θ = 26° equivalent to the lattice spacing of 0.34 nm corresponding to the
(002) facet of the graphitic carbon. Nitrogen-doping caused a
lattice expansion as evidenced by the appearance of another
relatively weak band at 2θ = 19°, corresponding to an interlayer
distance of 0.47 nm. The surface area was determined by BET
measurements (Fig. S1†) to be as high as 751 cm2 g−1 for
the N-GNR, which is higher than that of a nitrogen-doped
Scheme 1 Schematic representation of (a) the route to N-doped graphene nanoribbons (i.e., N-GNRs) and (b) disulfide/thiolate redox DSSC with
the N-GNR as a counter electrode.
Fig. 1
(a, b) SEM images of N-GNRs under different magnifications. (c) A typical AFM image of N-GNRs (scale bar: 0.2 μm).
This journal is © The Royal Society of Chemistry 2015
Nanoscale, 2015, 7, 7078–7083 | 7079
View Article Online
Published on 08 January 2015. Downloaded by CASE WESTERN RESERVE UNIVERSITY on 18/04/2015 18:59:48.
Paper
Fig. 2
Nanoscale
(a) XPS survey spectrum of N-GNR. (b) High-resolution XPS N1s spectrum of N-GNR. (c) Raman and (d) XRD spectra of N-GNR.
Fig. 3 (a) Photograph of the N-GNR counter electrode. (b, c) Side-view SEM images and (d, e) top-view SEM images of the N-GNR counter
electrode.
7080 | Nanoscale, 2015, 7, 7078–7083
This journal is © The Royal Society of Chemistry 2015
View Article Online
Published on 08 January 2015. Downloaded by CASE WESTERN RESERVE UNIVERSITY on 18/04/2015 18:59:48.
Nanoscale
Paper
Fig. 4 (a) Photocurrent density–voltage ( J–V) curves for DSSCs using T2/T− as the electrolyte redox couple and platinum or N-GNR as the counter
electrode. (b) The incident photon to charge carrier efficiency (IPCE) of DSSCs with Pt and N-GNR as the counter electrodes. (c, d) Nyquist plots of
asymmetric dummy cells with Pt and N-GNR counter electrodes with different scales.
graphene20 or nitrogen-doped carbon nanotubes. The large
surface is an additional advantage for electrocatalysis at the
counter electrode of a DSSC.
To use the N-GNR as a counter electrode in DSSCs, we
transferred it onto a piece of FTO glass. Fig. 3a shows a photograph of the N-GNR counter electrode, which is rather uniform
and flat. Fig. 3b and c reproduce a side view of the N-GNR
counter electrode under different magnifications, showing a
foam-like structure. The thickness of the N-GNR counter electrode can be controlled by regulating the conditions for blade
coating. Fig. 3d and e show the top-view SEM images of the
N-GNR counter electrode under different magnifications.
The N-GNR counter electrode thus prepared was then tested
in DSSCs with the T2/T− electrolyte. T− (i.e., 5-mercapto1-methyltetrazole ion) and T2 (i.e., the dimer of T−) were synthesized following the published method and confirmed by
NMR (Fig. S2†).1 Using the T2/T− redox couple electrolyte, we
have prepared several DSSCs with either Pt or N-GNR as the
counter electrode. Three N-GNR counter electrodes with the
N-GNR foam thickness of 7, 13, and 19 μm (designated as:
N-GNRs-1, N-GNRs-2, and N-GNRs-3, respectively) were tested.
Fig. 4a shows the obtained photocurrent density–voltage ( J–V)
curves. The corresponding numerical data, including the short
circuit current ( Jsc), open circuit voltage (Voc), fill factor (FF),
and power conversion efficiency (PCE), are listed in Table 1. As
can be seen in Table 1, the PCE for DSSCs with the N-GNR
counter electrodes is much higher than that of the DSSC with
Pt as a counter electrode. The FF for the DSSC with Pt as a
This journal is © The Royal Society of Chemistry 2015
Table 1 Jsc, Voc, FF and PCE for DSSCs with the N-GNRs, and Pt as the
counter electrodes, respectively
Counter electrode
Jsc [mA cm−2]
Voc [V]
FF
PCE [%]
Pt
N-GNRs-1 (7 μm)
N-GNRs-2 (13 μm)
N-GNRs-3 (19 μm)
13.20
10.82
12.47
13.43
0.65
0.62
0.63
0.64
0.36
0.57
0.59
0.59
3.09
3.82
4.64
5.07
counter electrode is only 0.36, which is much lower than those
of DSSCs with the N-GNRs as counter electrodes. Furthermore,
the short circuit current for DSSCs based on the N-GNR
counter electrode increased with increasing the N-GNR thickness, leading to an increased power transfer efficiency
(Table 1). The incident photon to charge carrier efficiency
(IPCE) for DSSCs with the N-GNRs-3 and Pt counter electrodes,
respectively, is given in Fig. 4b, which, as expected, shows a
relatively high IPCE for the DSSC with the N-GNR counter electrode. This is consistent with the electrochemical impedance
spectroscopy (EIS) measurements on the asymmetric dummy
cells with Pt and N-GNRs as the counter electrodes, respectively. As seen in Fig. 4c, the semicircles of the Nyquist plots for
the two N-GNR electrodes are both smaller than that of the Pt
electrode, indicating smaller charge transfer resistances for
the N-GNR electrodes. The charge transfer resistances calculated from the EIS spectra are 12.7, 74.1, and 559.6 Ω for the
N-GNRs-3, N-GNRs-1, and Pt electrodes, respectively, showing
a strong dependence on the electrode thickness. The series
Nanoscale, 2015, 7, 7078–7083 | 7081
View Article Online
Published on 08 January 2015. Downloaded by CASE WESTERN RESERVE UNIVERSITY on 18/04/2015 18:59:48.
Paper
Nanoscale
Fig. 5 (a) Photocurrent density–voltage ( J–V) curves for DSSCs using T2/T− as the electrolyte redox couple and platinum, rGORs and N-GNRs-3,
respectively, as the counter electrodes. (b) Nyquist plots of asymmetric dummy cells with the Pt, rGOR and N-GNR counter electrodes, respectively.
Table 2 Jsc, Voc, FF and PCE for DSSCs with the Pt, rGOR, and N-GNR
as the counter electrodes, respectively
Counter electrode
Jsc [mA cm−2]
Voc [V]
Fill factor
Efficiency [%]
Pt
rGORs
N-GNRs-3
13.20
13.88
13.43
0.65
0.61
0.64
0.36
0.46
0.59
3.09
3.89
5.07
resistances of the N-GNR counter electrodes are also smaller
than that of the Pt counter electrode (Fig. 4d).
In order to investigate the role of nitrogen-doping to the
DSSC performance, we also compared the N-GNR counter electrodes with the reduced graphene oxide nanoribbon (rGOR)
counter electrode without nitrogen-doping. The photocurrent
density–voltage ( J–V) curves for DSSCs with the Pt, rGOR, and
N-GNR counter electrodes (i.e., N-GNRs-3), respectively, are
shown in Fig. 5a while the corresponding numerical data of
the Jsc, Voc, FF and PCE are presented in Table 2. As can be
seen in Table 2, the PEC of the DSSC with the N-GNRs-3
counter electrode is much higher than that of the DSSC with
rGORs as a counter electrode. Furthermore, the resistances of
the N-GNR, rGOR and Pt electrodes were also calculated from
the EIS measurements on asymmetric dummy cells. The
obtained Nyquist plots were given in Fig. 5b, which shows a
lower charge-transfer resistance and series resistance for the
N-GNR counter electrode with respect to the rGOR counter
electrode.
Experimental section
Preparation of nitrogen-doped graphene nanoribbons
Graphene oxide nanoribbons were synthesized by chemical
unzipping of carbon nanotubes according to the published
procedure.8 The as-prepared graphene oxide nanoribbons in
water solution were freeze dried for 3 days to obtain the graphene oxide nanoribbon foam.
Nitrogen-doped graphene nanoribbons were then prepared
by annealing the freeze-dried graphene oxide nanoribbon
foams in a quartz tube furnace under an ammonia–argon gas
mixture. Typically, the graphene oxide nanoribbon foam was
firstly placed in a horizontal quartz tube and an ammonia–
argon gas mixture (NH3 : Ar = 400 s.c.c.m. : 400 s.c.c.m.) was
introduced into the tube. Then, the furnace was heated up
from room temperature to 800 °C within 1 hour, and kept at
800 °C for another hour. Thereafter, the quartz tube was aircooled from the outside to room temperature while keeping
the ammonia–argon mixture gas flow rate inside of the quartz
tube unchanged. Finally, ammonia was turned off and the
sample was taken out from the quartz tube.
Fabrication of DSSCs
The N-GNR counter electrode was prepared by mixing the
N-GNR with 5% (wt) PEO solution, which was then coated on
the FTO glass and heat treated at 400 °C under air for 3 hours.
The Pt counter electrode was prepared by coating the Pt catalyst (Pt-Catalyst T/SP, Solaronix) on a FTO glass and calcination
at 400 °C for 30 min.
Conclusions
Preparation of the TiO2 photoanode
In summary, we have synthesized nitrogen-doped graphene
nanoribbons with a high nitrogen content up to 6.5 atom%.
The resulting N-GNR was demonstrated to be efficient counter
electrode material, better than the platinum, for DSSCs with the
disulfide/thiolate (T2/T−) redox couple electrolyte. Compared
with a Pt counter electrode, the N-GNR counter electrodes
possess very low charge transfer resistances. This, together with
the large surface area and large number of the edge/dopinginduced defects, makes N-GNRs very efficient counter electrodes
for high-performance DSSCs of practical significance.
The FTO glass was cleaned by ultrasonication in the scouring
agent, isopropanol and ethanol for 10 min, respectively. After
drying, FTO was further cleaned by the UV-O3 system at room
temperature for 18 min. DSSC was prepared by blade coating
of the TiO2 paste (Ti-Nanoxide T, Solaronix) on the freshly
cleaned FTO glass substrate using the 3M Scotch Magic tape to
control the thickness. The TiO2 paste was then calcinated at
450 °C for 1 h. The resulting electrode was immersed in a
solvent mixture of acetonitrile and isobutanol (v/v = 1/1) containing 0.5 mM N719 dye (Solaronix) for 24 h to form the
7082 | Nanoscale, 2015, 7, 7078–7083
This journal is © The Royal Society of Chemistry 2015
View Article Online
Nanoscale
Published on 08 January 2015. Downloaded by CASE WESTERN RESERVE UNIVERSITY on 18/04/2015 18:59:48.
sensitized photoanode. Finally, the DSSC cell was fabricated
by packaging the photoanode and the counter electrode, and
sealed by 60 µm think sealant film (SX1170-60, Solaronix Co)
after an electrolyte (Iodolyte AN-50 from Solaronix) was added.
Characterization
X-ray photoelectron spectroscopy (XPS) measurements were
carried out on a VG Microtech ESCA 2000 using a monochromic Al X-ray source (97.9 W, 93.9 eV). The Raman spectra were
recorded using a Raman spectrometer (Renishaw) with a
514 nm laser. The thermogravimetric analysis was performed
on a TA instrument with a heating rate of 10 °C. X-ray diffraction (XRD) was measured using a Miniflex II Desktop X-ray
diffractometer. Scanning electron microscopy (SEM) images
were taken on a JEOL JSM-6510LV SEM.
Acknowledgements
This work was supported financially by the AFOSR (FA-955012-1-0069),
DOD-Army
(W911NF-11-1-0209),
NSF
(CMMI-1400274, IIP-1343270), NSFC-NSF (DMR-1106160),
CWRU-WMU (CON115346), NSFC (51202167), and the “Thousand Talents Program” of China.
References
1 S. Yanagida, Y. H. Yu and K. Manseki, Acc. Chem. Res.,
2009, 42, 1827, and references cited therein.
2 H. J. Snaith and L. Schmidt-Mende, Adv. Mater., 2007, 19,
3187.
3 T. W. Hamann, R. A. Jensen, A. B. F. Martinson, H. Van
Ryswyk and J. T. Hupp, Energy Environ. Sci., 2008, 1, 66.
4 M. K. Nazeeruddin, E. Baranoff and M. Gratzel, Sol. Energy,
2011, 85, 1172.
5 B. Oregan and M. Gratzel, Nature, 1991, 353, 737.
6 J. Y. Cong, X. C. Yang, L. Kloo and L. C. Sun, Energy
Environ. Sci., 2012, 5, 9180.
This journal is © The Royal Society of Chemistry 2015
Paper
7 M. K. Wang, N. Chamberland, L. Breau, J. E. Moser,
R. Humphry-Baker, B. Marsan, S. M. Zakeeruddin and
M. Gratzel, Nat. Chem., 2010, 2, 385.
8 D. V. Kosynkin, A. L. Higginbotham, A. Sinitskii,
J. R. Lomeda, A. Dimiev, B. K. Price and J. M. Tour, Nature,
2009, 458, 872.
9 X. L. Li, X. R. Wang, L. Zhang, S. W. Lee and H. J. Dai,
Science, 2008, 319, 1229.
10 D. B. Shinde, J. Debgupta, A. Kushwaha, M. Aslam and
V. K. Pillai, J. Am. Chem. Soc., 2011, 133, 4168.
11 L. Y. Jiao, X. R. Wang, G. Diankov, H. L. Wang and
H. J. Dai, Nat. Nanotechnol., 2010, 5, 321.
12 H. L. Zhang, C. Y. Zhang and D. D. Shi, Adv. Mater. Res.,
2011, 148, 1737.
13 M. Y. Han, B. Ozyilmaz, Y. B. Zhang and P. Kim, Phys. Rev.
Lett., 2007, 98, 206805.
14 L. Tapaszto, G. Dobrik, P. Lambin and L. P. Biro, Nat. Nanotechnol., 2008, 3, 397.
15 J. Campos-Delgado, J. M. Romo-Herrera, X. T. Jia,
D. A. Cullen, H. Muramatsu, Y. A. Kim, T. Hayashi,
Z. F. Ren, D. J. Smith, Y. Okuno, T. Ohba, H. Kanoh,
K. Kaneko, M. Endo, H. Terrones, M. S. Dresselhaus and
M. Terrones, Nano Lett., 2008, 8, 2773.
16 H. B. Wang, T. Maiyalagan and X. Wang, ACS Catal., 2012,
2, 781.
17 Y. C. Ma, A. S. Foster, A. V. Krasheninnikov and
R. M. Nieminen, Phys. Rev. B: Condens. Matter, 2005, 72,
205416.
18 K. P. Gong, F. Du, Z. H. Xia, M. Durstock and L. M. Dai,
Science, 2009, 323, 760.
19 L. T. Qu, Y. Liu, J. B. Baek and L. M. Dai, ACS Nano, 2010,
4, 1321.
20 Y. H. Xue, J. Liu, H. Chen, R. G. Wang, D. Q. Li, J. Qu and
L. M. Dai, Angew. Chem., Int. Ed., 2012, 51, 12124.
21 R. Cruz-Silva, A. Morelos-Gomez, S. Vega-Diaz, F. TristanLopez, A. L. Elias, N. Perea-Lopez, H. Muramatsu,
T. Hayashi, K. Fujisawa, Y. A. Kim, M. Endo and
M. Terrones, ACS Nano, 2013, 7, 2192.
Nanoscale, 2015, 7, 7078–7083 | 7083


© Copyright 2026