
Pattern Formation by Interacting Chemical Fronts Science
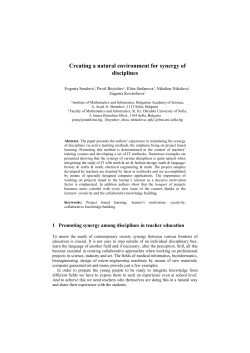
Pattern Formation by Interacting Chemical Fronts
Kyoung J. Lee; W. D. McCormick; Qi Ouyang; Harry L. Swinney
Science, New Series, Vol. 261, No. 5118. (Jul. 9, 1993), pp. 192-194.
Stable URL:
http://links.jstor.org/sici?sici=0036-8075%2819930709%293%3A261%3A5118%3C192%3APFBICF%3E2.0.CO%3B2-Y
Science is currently published by American Association for the Advancement of Science.
Your use of the JSTOR archive indicates your acceptance of JSTOR's Terms and Conditions of Use, available at
http://www.jstor.org/about/terms.html. JSTOR's Terms and Conditions of Use provides, in part, that unless you have obtained
prior permission, you may not download an entire issue of a journal or multiple copies of articles, and you may use content in
the JSTOR archive only for your personal, non-commercial use.
Please contact the publisher regarding any further use of this work. Publisher contact information may be obtained at
http://www.jstor.org/journals/aaas.html.
Each copy of any part of a JSTOR transmission must contain the same copyright notice that appears on the screen or printed
page of such transmission.
JSTOR is an independent not-for-profit organization dedicated to and preserving a digital archive of scholarly journals. For
more information regarding JSTOR, please contact [email protected].
http://www.jstor.org
Mon Apr 2 08:27:00 2007
formation cannot occur in systems in which
all diffusion coefficients are eaual. [For a
comprehensive discussion of these issues, see
Pearson and co-workers (10, 1 1); for a discussion of Turing instabilities in the model
at hand, see Vastano et al. (12) .] The only
Turing patterns that can occur bifurcate off
the nontrivial steady uniform state (the blue
state). Most of the patterns discussed in this
report occur for parameter values such that
the nontrivial steady state does not exist.
With the ratio of diffusion coefficients used
here, Turing patterns occur only in a narrow
parameter region in the vicinity of F = k =
0.0625, where the line of saddle-node bifurcations coalesces with the line of Hopf bifurcations. In the vicinity of this point, the
branch of small-amplitude Turing patterns is
unstable (12).
With eaual diffusion coefficients.. no oatterns formed in which small asymmetries in
the initial conditions were amplified by the
dynamics. This observation can probably be
understood in terms of the following fact:
Nonlinear plane waves in two dimensions
cannot be destabilized by diffusion in the
case that all diffusion coefficients are equal
(13). During the initial stages of the evolution, the comers of the square perturbation
are rounded off. The perturbation then
evolves as a radial wave, either inward or
outward depending on the parameter values.
Such a wave cannot undergo spontaneous
symmetry breaking unless the diffusion coefficients are unequal. However, I found symmetry breaking over a wide range of parameter values for a ratio of diffusion coefficients
of 2. Such a ratio is physically reasonable
even for small molecules in aaueous solution. Given this diffusion ratio and the wide
range of parameters over which the replicating spot patterns exist, it is likely that they
will soon be observed experimentally.
Recently Hasslacher et al. have demonstrated the plausibility of subcellular chemical patterns through lattice-gas simulations
of the Selkov model (14). The patterns
discussed in the Dresent article can also be
found in lattice-gas simulations of the
Selkov model and in simulations carried out
in three space dimensions. Perhaps they are
related to dynamical processes in the cell
such as centrosome replication.
&
REFERENCESANDNOTES
1 G. Nicolis and I. Prigogine, Self-Organization in
Non-Equil~briumSystems (Wiley, New York, 1977)
2 E. E. Selkov, Eur. J. Biochem. 4, 79 (1968).
3. P Gray and S K. Scott, Chem Eng. Sci. 38, 29
(1983) ibid 39, 1087 (1984), J. Phys. Chem 89,
22 (1985)
4 J. A. Vastano, J. E. Pearson, W. Horsthemke, H. L.
Swinney Phys. Lett. A 124, 6 (1987). ibid., p. 7;
ibid., p. 320.
5 K. J. Lee, W. D. McCormick Q. Ouyang, H. L.
Swinney, Science 261, 192 (1993)
6 P Hohenberg and M. Cross, Rev. Mod. Phys. 65,
3 (1993).
7. J Guckenhemer and P. Holmes, Nonlinear Oscillations, Dynamical Systems, a n d Bifurcations of Vector Fields (Springer-Verlag, Berlin, 1983), chap 3,
8 Y Kuramoto, Chemical Oscillations, Waves, and
Turbulence (Springer-Verlag Berlln, 1984)
9. A. Kawczynsk~,W . Comstock, R. Field, Physica D
54, 220 (1992); A. Hagberg and E Meron, University of Arizona preprint.
10. J. E. Pearson and W. Horsthemke, J. Chem. Phys.
90, 1588 (1989).
11. J. E. Pearson and W. J. Bruno, Chaos 2 4 (1992),
ibid. p 513.
12. J. A. Vastano, J. E. Pearson, W. Horsthemke, H L
Swnney, J Chem. Phys 88, 6175 (1988)
13 J. E. Pearson, Los Alamos Pub/. LAUR 93-7758
(Los Alamos National Laboratory, Los Alamos,
NM. 19931.
14. B. assl lac her, R. Kapral, A. Lawniczak, Chaos 3,
1 (1993)
15. 1 am happy to acknowledge useful conversations
wlth S. Ponce-Dawson W. Horsthemke, K Lee, L
Segel, H Swinney, B Reynolds, and J. Theler I
also thank the Los Alamos Advanced Computing
Laboratory for the use of the Connection Machine
and A. Chapman, C. Hansen, and P. Hlnker for
their ever-cheerful assistance with the figures.
7 April 1993; accepted 13 May 1993
Pattern Formation by Interacting Chemical Fronts
Kyoung J. Lee, W. D. McCormick, Qi Ouyang, Harry L. Swinney*
Experiments on a bistable chemical reaction in a continuously fed thin gel layer reveal a
new type of spatiotemporal pattern, one in which fronts propagateat a constant speed until
they reach a critical separation (typically 0.4 millimeter) and stop. The resulting asymptotic
state is a highly irregular stationary pattern that contrasts with the regular patterns such
as hexagons, squares, and stripes that have been observed in many nonequilibrium
systems. The observed patterns are initiated by a finite amplitude perturbation rather than
through spontaneous symmetry breaking.
I n recent years, pattern formation has become a very active area of research, motivated in part by the realization that there
are many common aspects of patterns
formed by diverse physical, chemical, and
biological systems and by cellular automata
and differential equation models. In experiments on a chemical system, we have
discovered a new type of pattern that differs
qualitatively from the previously studied
chemical waves [rotating spirals (I)], stationary "Turing" patterns (2-4), and chaotic patterns (5). These new patterns form
only in response to large-amplitude perturbations-small-amplitude perturbations decay. A large perturbation evolves into an
irregular pattern that is stationary (timeindependent) (Fig. 1). The patterns have a
length scale determined by the interaction
of the chemical fronts, which propagate
toward one another at constant speed until
they reach a critical distance and stop, as
Fig. 2 illustrates. The growth of these front
patterns is markedly different from Turing
patterns: The front patterns develop locally
and spread to fill space, as in crystal growth,
whereas Turing patterns emerge spontaneously everywhere when the critical value of
a control oarameter is exceeded.
The front patterns are highly irregular,
in contrast with Turing patterns, which
emerge as a regular array of stripes or hexagons (in two-dimensional systems) at the
Center for Nonlinear Dynamlcs and the Department of
Physlcs University of Texas at Austin, Austin, TX
78712.
*To whom ~ 0 r r e s ~ o n d e n Cshould
e
be addressed
SCIENCE
VOL. 261
9 JULY 1993
transition from a uniform state (4). The
interaction of fronts illustrated in Fig. 2 also
contrasts with the behavior in excitable
chemical media, where colliding fronts annihilate one another ( I ) , and with solitons,
where nonlinear waves pass through one
another (6).
Our experiments have been conducted
using an iodate-ferrocyanide-sulfite reaction, which is known to exhibit bistability
and large oscillations in pH in stirred flow
reactors (7). The other reactions that yield
stationary chemical patterns are the wellstudied chlorite-iodide-malonic acid reaction (3-5) and a variant reaction (8) that
uses chlorine dioxide instead of chlorite.
We chose the iodate-ferrocyanide-sulfite reaction as a new candidate for studies of
pattern formation because a pH indicator
could be used to visualize patterns that
might form.
The following experiments illustrate the
differences between our patterns and those
previously observed in reaction-diffusion
systems. A diagram of the gel disc reactor is
shown in Fig. 3. Gel-filled reactors were
developed several years ago (9) to study
reaction-diffusion systems maintained in
well-defined states far from equilibrium.
These reactors are now widely used for
studying sustained patterns that arise solely
from the interplay of diffusion and chemical
kinetics-the gel prevents convective motion. A thin polyacrylamide gel layer (0.2
mm thick, 22 mm in diameter) is fed
diffusively by a continuously refreshed reservoir of chemicals (10). There are two
thin membranes between the polyacrylam-
ide gel and the stirred reservoir, one (an
Anopore disk, 0.06 mm thick with 0.2-pmdiameter pores) that provides structural rigidity for the thin gel layer and another (a
nitrocellulose membrane, 0.14 mm thick
with 0.45-pm-diameter pores) that provides a white backing for visualization of
the patterns. The chemicals are premixed
(in a 0.5-ml cell) before entering the reactor reservoir (2.5 ml), and the reservoir is
vigorously stirred to ensure homogeneity.
The concentrations of the feed chemicals
are held fixed at the values given in the
caption for Fig. 3; only the flow rate is
varied. The reagent concentrations in the
reservoir are time-inde~endentat each flow
rate throughout the range studied. In the
flow rate range in which patterns are observed, the reservoir pH increases only
slightly, from 7.24 to 7.32; the fluctuations
in pH are less than 0.01 at each flow rate.
Patterns are observed in reflected light with
a video camera connected to a digitizing.
board in a microcomputer.
The same type of patterns form both
with and without a pH indicator: Fig. 4A
was obtained with bromothymol blue indicator (which changes from yellow to blue as
pH increases from 6.0 to 7.6), and Fig. 4B
was obtained without an indicator (11).
We examined patterns without an indicatbr
after observing that the reaction in a stirred
flow reactor exhibits large oscillations in
the optical absorption band from 410 to 430
nm, where ferrocyanide absorbs strongly.
The patterns observed without an indicator
(with illumination at 420
20 nm) have
higher contrast than the patterns observed
with bromothymol blue indicator (with illumination at 620 5 10 nm), as can be seen
by comparing Figs. 4A and 4B.
The structure of a pattern is clearer
when plotted in a binary form with intensities above an arbitrary threshold in white
and intensities below the threshold in
-
*
-
black, as can be seen by comparing the
binary image in Fig. 4C with the original
gray-scale data in Fig. 4B. (For clarity, the
other figures in this report are shown in
binary form.)
The bifurcation diagram in Fig. 5A
shows the ranges of flow rate F for stable.
uniform states-at low and high pH and the
patterned state. No patterns form in the
absence of a perturbation. If the system is
initially in the uniform low pH state and F
is slowly increased, the system remains in
the low pH state until F = FLH,where there
is a spontaneous transition to the uniform
high pH state. (Subscripts L, H, and P
correspond to low, high, and pattern.) Similarly, if F is slowly decreased from a large
value, the system remains in the high pH
state until F = FHL, where there is a
spontaneous transition to the uniform low
DH state.
Light can be used to perturb the system
because the chemistw, is ~hotosensitive.
.
Patterns can be initiated by illuminating
the system with ultraviolet light when F is
between FLPand FPH.If the low pH state is
illuminated with intense ultraviolet light
(for example, for 5 min with 254-nm radiation from a 100-W Hg lamp), the illuminated region becomes dark, corresponding
to the high pH state. If th; illumination is
uniform, the system makes a transition from
the low pH state to the high pH state and
remains in the high pH state after the
perturbation is removed. If the illumination
is local and F is in the interval (FLP,FPH),
then removal of the perturbation results in
growth of the dark spot (after an initial
decay) and evolution into an irregular pattern, as Fig. 1 illustrates. This asymptotic
state is independent of both the duration
and the intensity of the illumination as long
as a threshold is exceeded. Pattern "
erowth
usually initiates near an edge of the disc but
sometimes occurs in the middle. Patterns
can be initiated with a large-amplitude
ultraviolet light perturbation for flow rates
up to FpH;for F > FpHthe system spontaneously makes a transition from a pattern to
the uniform high DH state. Patterns sometimes form even without perturbation if the
system is abruptly changed to be in the
region FLP < F < FPH. In this case, the
medium initially appears to be excitable,
but the wave interaction illustrated in Fig.
2 results in asymptotic irregular patterns.
The disappearance of the patterns after
an increase of F above a critical value FpHis
quite striking, as Fig. 6 illustrates. Rather
-.
0 mln
5 mln
Fig. 2. Time evolution of two approaching
chemical fronts. The fronts stop when the separation is -0.4 mm. This figure is a close-up
view of a small region in Fig. 1 (flow rate, 131
mllhour).
Q
Camera
Polyacrylamide gel
v
Anopore
membrane
Fig. 1. Time evolution of a
pattern initiated by a perturbation with intense ultraviolet light at the left boundary.
The pattern achieved 3
hours (3 h) after the localized perturbation is removed was essentially stationary. (A subsequent slow
evolution, perhaps due to a
slow drift in feed conditions,
occurs on the time scale of
days.) The pattern was visualized with bromothymol
blue pH indicator; white regions correspond to low pH
and black regions to high
pH. Chemical concentrations are aiven in the caDtion for ~ i <3; reservoir fldw
rate, 130 mlhour.
'Chemical
inputs
\
pH electrode
Fig. 3. Schematic diagram of the gel reactor
and optical system. The reactor is drawn to
scale except that the thicknesses of the gel,
filter membrane, and Anopore membrane are
four times larger than scale size. Input chemical
concentrations: [NalO,] = 75.0 mM; [N+SO,]
= 89.0 mM; [K4Fe(CN),3H20] = 25.0 mM;
[H2S04]= 4.5 mM; [NaOH] = 0.25 mM; and (in
ex~erimentsin which a DH indicator was used)
[b~omothymolblue] = '0.15 mM. The reactor
temperature was 30.0' + 0.l0C.
SCIENCE
VOL. 261
9 JULY 1993
193
Fig. 4. Time asymptotic patterns obtained (A) with a pH indicator (flow rate, 127 mlhour) and (B)
without a pH indicator (flow rate, 130 mlhour). Dark regions correspond to low ferrocyanide
concentration and light regions to high ferrocyanide concentration.The patterns in (A) and (B) are
shown with 256 levels of gray scale. The pattern in (B) is rendered in (C) in black and white with an
arbitrarily chosen threshold. The domain shown is 10 mm by 13 mm.
-
than shrinkine in width. the white lines
slowly shrink to zero length.
The ~atternedstate is stable for F down
to F,,. The hysteresis in the range FpL< F
< FLp can be seen in Fig. 5A (12). The
transition sequence in Fig. 5A was observed
by using the bromothymol blue indicator,
but the same sequence was observed without the indicator (13). The same type of
behavior was also observed with an agar
rather than a pol~acrylamidegel, but agar
was not used for detailed measurements
because the "
eel demades in a few hours.
The patterns have a characteristic
length scale corresponding to the width of
the low pH regions and a larger length scale
corresponding to the width of the high pH
regions (see Fig. 1). The characteristic
width of the low pH regions, obtained by
dividing the total area of these regions by
u
-
-c 1.0
A
'
'Unifor'm high'pH
1""'""'
t:
'
the length of the perimeter around the
regions, is comparable to the width of a
front. This length decreases with increasing
flow rate, as Fig. 5B illustrates, whereas the
length scale of the high pH regions increases slowly with flow rate. The pattern
readjusts after each change in flow rate. No
hysteresis in the length scales was observed
in measurements made with increasing and
decreasing F. Although the patterns have
two well-defined characteristic length
scales, they are always irregular, in contrast
to Turing patterns which form regular arrays of hexagons or stripes (3, 4).
A numerical analysis of a one-dimensional model system with Gray-Scott kinetics has demonstrated that stationary
patterns can form in response to a finite
amplitude perturbation in a system with
equal diffusion coefficients (14), whereas
Turing patterns form only with an appropriate inequality of diffusion coefficients
(15). We do not know if inequality of
0.4
p 0.2
-1
0.0
100
110
120 130 140 150
Flow rate (rnVhwr)
160
170
Fig. 5. Diagram showing transitions to and from
the ~atternedstate and to and from the uniform
I O W ' ~ Hand high pH states. (A) Fractional size
of the high pH (black)region of the pattern. (B)
A characteristic length scale obtained by dividing the area of the low pH (white) domain by
one-half its perimeter.
194
Fig. 6. Disappearance of a pattern following an
increase of flow rate beyond a critical value,
F,,. At time t = 0, the flow rate was changed
from 144 to 149 mlhour. These experiments
were conducted without a pH indicator.
SCIENCE
VOL. 261
9 JULY 1993
diffusion coefficients plays a significant
role in our patterns, but we note that the
diffusion coefficient for the hydrogen ions
is several times greater than that of the
other species in the reaction.
The front patterns that we have observed originate from the interplay between
reaction and diffusion and have a characteristic length scale determined not by the
geometry but by the diffusion coefficients
and chemical kinetics, just as is the case for
spiral patterns and Turing patterns. However, the interaction of propagating fronts
in our patterns is strikingly different from
that observed in previous studies of reaction-diffusion systems. The necessary conditions for the formation of these front
patterns have not been established, but it
seems likely that such patterns will form in
many bistable systems.
REFERENCES AND NOTES
1. A. N. Zaikin and A. M. Zhabotinskii. Nature 225,
535 (1970); A. T. Winfree. Science 175, 634
(1972);J. Maselko and K. Showalter. Nature339,
22 (19891.
~,
Trans. R. Soc. London Ser. B
2. A. M. ~ u r i nPhilos.
237, 37 (1952).
3. V. Castets, E. Dulos, J. Boissonade, P. De K e p
per, Phys. Rev. Lett. 64, 2953 (1990).
4. Q. Ouyang and H. L. Swinney. Nature 352. 610
(1991).
5. ,
Chaos 1, 4 (1991).
6. P. G. Drazinand R. S. John, Solitons:An Introduction (Cambridge Univ. Press. Cambridge. 1989).
7. E. C. Edblom. M. Orban, I. R. Epstein, J. Am.
Chem. Soc. 108, 2826 (1986);V. GL@r and K.
Showalter, ibid 109,4869 (1987);J. Phys. Chem.
94, 4973 (1 990).
8. 1. R. Epstein, I. Lengyel, S. KAdAr. M. Kagan, M.
Yokoyama. Physica A 188,26 (1992).
9. Z. Noszticzius, W. Horsthemke,W. D. McCormick,
H. L. Swinney, W. Y. Tam, Nature329,619 (1987);
W. Y . Tam, W. Horsthemke. Z. Noszticzius, H. L.
Swinney, J. Chem. Phys. 88, 3395 (1 988).
10. The gel is sufficiently thin so that the patterns can
be considered approximately DNo-dimensional,
but we cannot nrle out some three-dimensional
effects arising from the finite thickness of the gel.
The preparation of the gel is described in K. J.
Lee, W. D. McCormick. Z. Nosczliczius, H. L.
Swinney, J. Chem. Phys. 96, 5 (1992).
11. Black and white are reversed in the pictures
obtained without an indicator so that the low pH
state is white in all figures.
12. It may be possible to have hysteresis at the high
flow rate end as well as the low flow rate end of
the range in which patterns form, but we have
not tested for this hysteresis because we have
not found a perturbation method to create low
pH domains in the high pH state.
13. With an indicator the values for Fp, ,,F
, F,, FpH,
and ,F are 115,125,126,152,and 154 mlhour,
respectively; without an indicator the values shift
upward a few percent except for FpH,
which shifts
downward 5%.
14. J. A. Vastano, J. E. Pearson, W. Horsthemke, H. L.
Swinney, Phys. Lett. A 124, 7 (1987).
15. J. Pearson and W. Horsthemke, J. Chem. Phys.
90, 3 (1989);1. Lengyel and I.R. Epstein, Science
251, 650 (1991); J. E. Pearson and W. Bruno,
Chaos 2, 513 (1992).
16. We thank J. Pearson and D. Vigil for helpful
discussions. This research is supported by the
Department of Energy Office of Basic Energy
Sciences and the Robert A. Welch Foundation.
31 March 1993; accepted 13 May 1993


© Copyright 2026