
Other - cgiar
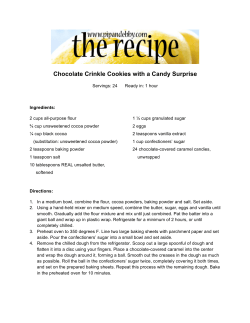
Climate-‐smart intensifica/on of West-‐Africa’s cocoa systems Athors P. van Asten, L. Jassogne, P. Vaast, P. Laderach, G. Schroth, M. Lundy, R. Asare, S. Muilerman, F. Ruf, D. Snoeck, L. Koko, G. Anim-‐Kwapong, W. Rossing, J. Gockwoski, M. Tamo, K. Giller, J. Six, B. Vanlauwe Can supply keep up with demand? Global demand for cocoa is increasing by 2-‐3% annually, par4cularly due to growth in Asia. About 70% of global supply originates from West-‐Africa, where cocoa is produced by smallholder farmers (<5ha). Their yields are low (10-‐30% of poten4al) and highly variable with limited use of external nutrient inputs. Over the past decades, cocoa supply relied largely on the expansion of the crop into ‘fresh’ forest. Consequently, cocoa has been a key driver of deforesta4on. With less than 15% of the original cover in West Africa remaining, the cocoa industry is increasingly concerned about its future supply, par4cularly now that recent studies revealed that climate change further threatens the current produc4on zones (Fig 1). Climate-‐smart intensifica4on is required to ensure both smallholder livelihoods and the industry’s need. Fig 3: Farm Field Schools for par4cipatory knowledge development and sharing – S. Muilerman CSA into certification training Crops Countries Climate exposure gradient Climate data COPE ADJUST Crop models Site specific CSA practices Joint interventions farmer organizations TRANSFORM CSA into impact investments P. van Asten – IITA L. Jassogne – IITA P. Vaast – CIRAD/ICRAF, P. Laderach – CIAT Rainforest Alliance (<2015) G. Schroth – Independent Consultant (current) M. Lundy – CIAT R. Asare – IITA S. Muilerman – IITA F. Ruf – CIRAD D. Snoeck – CIRAD L. Koko – CNRA G. Anim-‐Kwapong – CRIG W. Rossing – WUR J. Gockwoski – IITA M. Tamo -‐ IITA K. Giller – WUR J. Six – ETH B. Vanlauwe -‐ IITA Other certification agencies Farmer associations Extension services Commercial banks National Govts Voluntary certifiers Food industry Donor agencies Financial industry Other impact investors Collaborators Monitoring, evaluation, learning & impact assessment Fig 4: CSA innova4on in R4D feeds into innova4ve approach for private-‐public scaling (Lundy et al, unpublished) Scaling approach Fig 1: Suitability change for cocoa (Laderach et al, 2013) Intensification and fertilizer use 40.0# 2%$ 2%$ 30.0# 6%$ 2%$ 20.0# 6%$ 15%$ COCOA$ FOREST$ 10.0# 6%$ COFFEE$ FALLOW$ 0.0# 7%$ CASSAVA$ Mbam# BANANA$ Meme# PLANTAIN$ COLA$ 54%$ YAM$ field%percentage%(%)% Meme$ field%percentage%(%)% Over the past decades, many of the cocoa actors have promoted full-‐sun intensified systems. Whereas these systems may seem to have the highest produc4on poten4al, they do expose farmers to risks of climate variability and reduced sustainability. 90.0# Fer4lizer use is currently limited to areas where fallow land is no 80.0# longer available (See Fig 2 – example Moungo, Cameroon) and/ 70.0# or where government programs (read subsidies) e60.0#nhance access to external nutrient inputs -‐> fer4lizers to protect 50.0# forests. There is an urgent need for (i) technical recommenda4ons on how to achieve intensified climate-‐smart cocoa systems and (ii) improved channels of communica4ng this knowledge to the smallholders. This challenge may require enhanced networks and novel plahorms in a sector that is tradi4onally characterized by a high degree of fragmenta4on. 90.0# no#shade# 80.0# low#shade# 70.0# moderate#shade# 60.0# high#shade# no#shade# very#high#shade# 50.0# low#shade# 40.0# moderate#shade# Moungo# 30.0# high#shade# 20.0# very#high#shade# 10.0# Moungo& 3%$ 0.0# 13%$ Mbam# Meme# Moungo# COCOA$$ 9%$ 47%$ 2.00% 1.50% P% 1.00% Ca% 16%$ CASSAVA$ 0.50% BANANA$ 0.00% !0.50% !1.00% COFFEE$ FALLOW$ Mg% K% FOREST$ N !1.50% !2.00% Meme Mbam 2.00% 1.50% 1.00% 0.50% K% !0.50% Ca% 1.50% K% 1.00% Mg% !1.00% 12%$ Ca% Mg% P% 0.00% 2.00% Fig 5 (lef): No / low shade systems dominate in intensified smallholder cocoa systems (right): Farmer-‐perceived constraints to shade as CSA technology Source Fig 2 and Fig 5-‐lef: Jassogne et al. unpublished. Source Fig 5-‐right: Manu et al., unpublished N Mbam% 17%# 4%# !1.50% !2.00% 0.50% 0.00% !0.50% !1.00% !1.50% !2.00% Moungo N 9%# COCOA# P% FOREST# SAVANA# 70%# FALLOW# Mbam:Ferralsol / Moungo: Ferralsol, Cambisol/ Meme: Nitosol Fig 2: In Cameroon, fer4lizer is only used (52%) on cocoa in Moungo where land pressure is high and ‘spare’ forest is no longer available – bar graphs depict nutrient imbalances (CND) -‐ pie charts depict land use prior to plan4ng cocoa IITA is a member of the CGIAR Consor4um www.iita.org Contact emails [email protected] www.iita.org


© Copyright 2026