
Does a waiting room video about what to expect during an
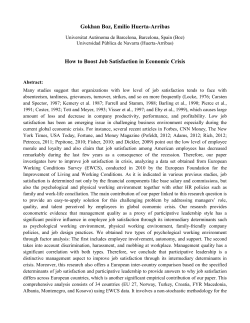
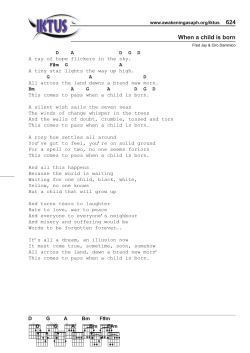
ORIGINAL RESEARCH • RECHERCHE ORIGINALE
EM ADVANCES
Does a waiting room video about what to expect
during an emergency department visit improve
patient satisfaction?
Linda Papa, MDCM, MSc;* David C. Seaberg, MD;† Elizabeth Rees, BSc;‡ Kevin Ferguson, MD;†
Richard Stair, MD;† Bruce Goldfeder, MD;† David Meurer, MD†
ABSTRACT
Objective: We created an instructional waiting room video that explained what patients should
expect during their emergency department (ED) visit and sought to determine whether preparing
patients using this video would 1) improve satisfaction, 2) decrease perceived waiting room times
and 3) increase calls to an outpatient referral line in an ambulatory population.
Methods: This serial cross-sectional study took place over a period of 2 months before (control)
and 2 months after the introduction of an educational waiting room video that described a typical patient visit to our ED. We enrolled a convenience sample of adult patients or parents of pediatric patients who were triaged to the ED waiting room; a research assistant distributed and collected the surveys as patients were being discharged after treatment. Subjects were excluded if
they were admitted. The primary outcome was overall satisfaction measured on a 5-point Likert
scale, and secondary outcomes included perceived waiting room time, and the number of outpatient referral-line calls.
Results: There were 1132 subjects surveyed: 551 prevideo and 581 postvideo. The mean age was
38 years (standard deviation [SD] 18), 61% were female and the mean ED length of stay was 5.9 hours
(SD 3.6). Satisfaction scores were significantly higher postvideo, with 65% of participants ranking
their visit as either “excellent” or “very good,” compared with 58.1% in the prevideo group (p =
0.019); however, perceived waiting room time was not significantly different between the groups
(p = 0.24). Patient calls to our specialty outpatient clinic referral line increased from 1.5 per month
(95% confidence interval [CI] 0.58–2.42) to 4.5 per month (95% CI 1.19–7.18) (p = 0.032). After
adjusting for possible covariates, the most significant determinants of overall satisfaction were
perceived waiting room time (odds ratio [OR] 0.41, 95% CI 0.34–0.48) and having seen the ED
waiting room video (OR 1.41, 95% CI 1.06–1.86).
Conclusion: Preparing patients for their ED experience by describing the ED process of care
through a waiting room video can improve ED patient satisfaction and the knowledge of outpatient clinic resources in an ambulatory population. Future studies should research the implementation of this educational intervention in a randomized fashion.
Keywords: emergency department, emergency medicine, patient satisfaction, patient education,
waiting room, video
From the *Department of Emergency Medicine, Orlando Regional Medical Center, University of Florida, Orlando, Fla., the †Department of
Emergency Medicine, University of Florida, Gainesville, Fla., and the ‡College of Medicine, University of Florida, Gainesville, Fla.
Submitted Dec. 17, 2006; Revised Oct. 2, 2007; Accepted Oct. 22, 2007
This article has been peer reviewed.
CJEM 2008;10(4):347-54
July • juillet 2008; 10 (4)
CJEM • JCMU
347
Papa et al.
RÉSUMÉ
Objectif : Nous avons créé, pour la salle d’attente, une bande vidéo éducative qui explique aux patients à quoi s’attendre lors de leur visite à l’urgence. Nous avons aussi cherché à déterminer si la
préparation des patients par son utilisation aurait les effets suivants : 1) améliorer la satisfaction
des patients; 2) réduire le temps d’attente perçu dans la salle d’attente; 3) augmenter le nombre
d’appels à la ligne d’aiguillage pour services de consultations externes au sein d’une population
ambulatoire.
Méthodes : Cette étude transversale en série s’est déroulée sur une période de deux mois avant
(groupe témoin) et deux mois après l’introduction, dans la salle d’attente, de la bande vidéo éducative décrivant une visite typique à l’urgence. L’étude a été menée auprès d’un échantillon de
commodité de patients adultes ou de parents d’enfants qui ont été dirigés vers la salle d’attente
après le triage. Un adjoint à la recherche a distribué les sondages et les a recueillis lorsque les patients ont obtenu leur congé après avoir été traités. Les sujets qui ont été hospitalisés étaient exclus de l’étude. La principale mesure de résultats était la satisfaction globale mesurée selon
l’échelle de Likert en 5 points, et les mesures de résultats secondaires incluaient le temps d’attente
perçu dans la salle d’urgence et le nombre d’appels à la ligne d’aiguillage pour services de consultations externes.
Résultats : Nous avons sondé 1132 personnes : 551, avant l’introduction de la bande vidéo et 581
après. L’âge moyen des participants était de 38 ans (écart-type [ET] de 18), 61 % étaient des
femmes et la durée de séjour moyenne à l’urgence était de 5,9 heures (ET de 3,6). Les taux de satisfaction étaient nettement plus élevés après le visionnement de la bande vidéo, 65 % des répondants ayant accordé à leur visite la note « excellente » ou « très bonne » par rapport à 58,1 %
pour le groupe qui n’avait pas vu la bande vidéo (p = 0,019). Par ailleurs, nous n’avons pas observé
de différence significative entre les deux groupes concernant le temps d’attente perçu (p = 0,24).
Quant au nombre d’appels de patients à la ligne d’aiguillage pour services de consultations externes, il est passé de 1,5 appel par mois (intervalle de confiance [IC] à 95 %, 0,58 à 2,42) à 4,5 par
mois (IC à 95 %, 1,19 à 7,18) (p = 0,032). Après avoir fait les ajustements pour les covariables possibles, les déterminants les plus significatifs en matière de satisfaction globale étaient les temps
d’attente perçus (rapport de cotes [RC] 0,41, IC à 95 %, 0,34 à 0,48) et le visionnement de la bande
vidéo (RC = 0,41, IC à 95 %, 1,06 à 1,86).
Conclusion : On peut améliorer la satisfaction des patients se présentant à l’urgence et leurs connaissances des ressources de clinique externe à la disposition de la population ambulatoire si on
les prépare à leur expérience à l’urgence en utilisant, dans la salle d’attente, une bande vidéo
décrivant le processus de soins à l’urgence. Il faudrait maintenant envisager la réalisation d’études
randomisées sur la mise en application de cette méthode éducative.
Introduction
Satisfaction with emergency care involves good communication with and the education of patients and their families.
Going to an emergency department (ED) is often an intimidating and confusing experience for patients and families
because they fear the unexpected. Studies have shown that
providing information about ED care is associated with improved perception of the quality of care and overall satisfaction.1–4 An explanation of what they can expect with regard
to care seems to be just as important, if not more so, to patients than information on actual conditions and can help to
alleviate anxiety.4–6 ED visits and waiting times present a
unique opportunity to provide educational and instructional
material to patients. Most studies to date in this area have
used written material about the ED process to instruct and
inform patients on what to expect during their visit.2,3
Patient education videos are a relatively effective yet
348
inexpensive means of describing the ED process and procedures, and they can serve to increase patients’ understanding of and satisfaction with their care, as well as decrease their anxiety. In other medical specialties, videos
have been used to help patients understand what to expect
during their care, which has led to greater use of videos for
patient education.5,7–12
Our study sought to determine if showing an ED process
and patient education DVD would improve patient satisfaction, increase calls to an outpatient clinic referral line
and reduce perceived waiting room times.
Methods
Study design and setting
This was a serial, cross-sectional survey of ED patients at a
tertiary care university teaching hospital, with an annual
census of 41 000. We created an ED-specific professional
CJEM • JCMU
July • juillet 2008; 10 (4)
Waiting room videos and patient satisfaction
video describing the process of care from registration to
discharge. We then took this ED process video and interspersed it with commercially developed patient education
segments and played it in our waiting room for ambulatory
ED patients who were treated and discharged from the ED.
The preintervention (control) group was shown regular cable programming and the postintervention group was
shown the intervention video.
Study subjects
The study enrolled a convenience sample of consecutive
adult patients or parents of pediatric patients who were
triaged to the waiting room and discharged between the
hours of 10 am and 6 pm Monday through Friday and on
alternating weekends. The study was conducted over a
4-month period with 2 months before and 2 months after
the introduction of the instructional waiting room video.
Subjects were at least 18 years of age and were only included if they were discharged from the ED. Patients were
excluded if they were younger than 18 years without an accompanying adult, not triaged to the waiting room, admitted to the hospital or discharged from the ED between
6 pm and 10 am. No patients who were acutely ill or transferred directly to a stretcher from triage were included.
Intervention
We hired a professional video development company to
create a customized instructional waiting room video; our
own ED staff members (physicians, nurses and support
staff) helped develop the script and acted in the video. During the 6-minute video we introduced patients to the
process of care in our ED from registration to discharge
and prepared them for their experience using a typical patient-visit scenario. Basic triage principles were described
in the video to assure viewers that even though the most ill
patients are seen first, all patients are seen as soon as possible. At various points in this segment, we inserted patient
health education information together with the telephone
number for the outpatient referral line, so ED patients
could access the hospital’s specialty clinics. The final
product was a 2-volume DVD set that lasted 4 hours and
was developed at a cost of just under US$4000. The DVD
was played on a continuous loop on the television in our
waiting room, with the ED process segment appearing
every 15 minutes. The television was mounted at the corner of the ED waiting room in full view of all visitors, and
operated continuously. Prior to the intervention, regular cable programming was available on the same television for
patients in the ED waiting room, and channels were
changed when requested by patients.
July • juillet 2008; 10 (4)
Methods of measurement
We used a patient satisfaction survey that included 12
questions about quality of care based on an abbreviated
version of a validated ED patient satisfaction scale13 (Fig.
1). A single research assistant distributed and collected the
surveys from patients or parents of patients who were being discharged between 10 am and 6 pm Monday through
Friday as well as on alternating weekends. On the survey,
subjects were asked if they had viewed the waiting room
video. Subjects completed the surveys in the patient care
area just before discharge. The research assistant approached the patients and family members after they had
received discharge instructions, allowed them to complete
the survey independently and acted as a facilitator for
those having difficulty understanding the survey and to ensure survey completion. The research assistant emphasized
to subjects that their responses were anonymous and for
research purposes only. She did not discuss the content of
the video, nor did she discuss the follow-up referral clinic
number. As part of the postvideo survey, subjects were
asked if they found the portion of the video that explained
their ED care helpful. Our institutional review board
granted the study exempt status as no personal identifying
information was collected.
Emergency room patient survey
1. How satisfied were you with TODAYí S visit?
Excellent
Very good
Good
Fair
Poor
2. How well did we EXPLAIN WHY you had to wait?
Excellent
Very good
Good
Fair
Poor
3. How was the COURTESY of the registration staff?
Excellent
Very good
Good
Fair
Poor
4. How was the COURTESY of the nurses?
Excellent
Very good
Good
Fair
Poor
5. How was the COURTESY of the physicians?
Excellent
Very good
Good
Fair
Poor
6. How QUICKLY the nurse evaluated you?
Excellent
Very good
Good
Fair
Poor
7. How QUICKLY the physicians evaluated you?
Excellent
Very good
Good
Fair
Poor
8. Level of CONFIDENCE you felt in the nurses?
Excellent
Very good
Good
Fair
Poor
9. Level of CONFIDENCE you felt in the physicians?
Excellent
Very good
Good
Fair
Poor
10. How well ORGANIZED was your care?
Excellent
Very good
Good
Fair
Poor
11. How well did staff EXPLAIN your condition?
Excellent
Very good
Good
Fair
Poor
12. How was the LENGTH OF TIME in the waiting room?
Very short
Just right
Long
Very long
Fig. 1. Emergency department satisfaction survey.
CJEM • JCMU
349
Papa et al.
Outcome measures
The primary outcome was patients’ and parents’ overall
satisfaction with their ED visit as measured on a 5-point
Likert scale ranging from poor (poor = 0) to excellent (excellent = 4). Secondary outcomes included 1) changes in
perceived waiting room time (defined as time physically
spent in the waiting room before being brought to a care
area in the ED) as measured with a 4-point Likert scale
from short (short = 0) to too long (too long = 3), and 2)
changes in the number of calls from ED patients to the referral line accessing the hospital’s specialty clinics. Additionally, we graphed satisfaction levels over time to look
for secular trends during the study period. These trends
were assessed over 6 consecutive periods broken down
into 3 sections of days in each of the pre– and post–ED
video phases, that is, with 3 blocks of 20 days in the pre–
and 3 blocks of 20 days in the post–ED video phases.
Data analysis
An a priori sample size requirement was determined to be
510 patients per group for 90% power and a significance
of 0.05 to detect an improvement of 5% between the
groups using means and a parametric sample size calculation. This approach was used for simplicity and this difference was based on the results of a pre- and postintervention study, which looked at improving patient-reported
quality measures.14 Likert scores were treated as ordinal
data. Proportions were compared using χ2 analysis and ordinal data were analyzed using Kendall tau-b. Additionally,
multivariate logistic regression analysis was used to assess
the contribution of possible covariates, including age, sex,
length of stay and perceived waiting room time on the dichotomized outcome of satisfaction (i.e., poor, fair or good
v. very good or excellent). These covariates were selected
because they have all previously been found to be strongly
associated with satisfaction. Significance was assumed
when a p value of ≤ 0.05 was observed. Data were analyzed using SPSS 10.0.5 statistical software (SPSS, Inc.).
identifiers were obtained, we were unable to comment on
individual characteristics.
Likert scores for satisfaction were significantly higher
in the postvideo group, with 65% of subjects rating their
ED visit as either “excellent” or “very good,” compared
with 58.1% in the prevideo group (p = 0.019, Table 2).
ED patient calls to our specialty outpatient clinic referral
line increased from 1.5 per month (95% confidence interval [CI] 0.58–2.42) to 4.5 per month postvideo (95% CI
1.19–7.18) (p = 0.032). Likert scores for perceived time in
the waiting room were not significantly different between
groups, with 67.2% of the prevideo group reporting either
a very short or appropriate wait room time compared with
69.3% in the postvideo group (p = 0.24, Table 2). Results
of multivariate logistic regression analysis with adjusted
odds ratios for variables associated with satisfaction are
shown in Figure 2. After adjusting for age, sex, length of
stay, perceived waiting room time and ED waiting room
video, the most significant determinants of satisfaction
were perceived waiting room time (odds ratio [OR] 0.41,
95% CI 0.34–0.48) and viewing the ED waiting room
video (OR 1.41, 95% CI 1.06–1.86).
No specific external or system factors were altered in the
ED during the study period, such as changes to staffing,
Results
Of the 1132 subjects surveyed, 551 were in the prevideo
group and 581 were in the postvideo group. The mean age
was 38 years (standard deviation [SD] 18), 61% were female and the mean ED length of stay was 5.9 hours (SD
3.6), with no significant differences between the pre- and
postvideo groups. Refusal to answer the survey questions
occurred in less than 2% of cases. Table 1 describes subject characteristics. Table 2 compares the survey responses
in each of the pre- and postvideo groups. Because no personal
350
CJEM • JCMU
Table 1. Subject characteristics in pre- and postvideo
groups
Group, %*
Characteristic
Mean (and SD) age, yr
< 21
21–40
41–60
> 60
Sex
Female
Male
Mean (and SD) length
of stay, h
<2
2–4
4–6
>6
Overall satisfaction
Poor
Fair
Good
Very good
Excellent
Prevideo
(n = 551)
Postvideo
(n = 581)
38 (19)
18
39 (18)
16
43
25
14
44
26
14
61
39
6.1 (4.0)
62
38
5.8 (3.2)
6
6
25
28
41
25
30
39
5.4
8.7
27.8
30.5
27.6
3.6
10
21.3
32
33
SD = standard deviation.
*Unless otherwise indicated.
July • juillet 2008; 10 (4)
Waiting room videos and patient satisfaction
reception, overall visit numbers, patient acuity, admissions
or physical environment. To further examine the possibility
of any secular trends we assessed satisfaction over 6 distinct time periods divided into 20-day blocks: 3 blocks before and 3 blocks after the introduction of the video. Satisfaction levels before the video’s introduction showed
considerable variability and were all lower than in the
postvideo phase. Satisfaction levels in the postvideo phase
showed less variation and trended upward. Multiple comparisons revealed no statistically significant differences
among any of the 6 time periods (p = 0.25, Fig. 3).
All patients reported that they watched the video: 41%
viewed it in its entirety and 59% viewed at least a portion
of it. When we asked patients if they found the video
“helpful,” 80.6% reported that it was either somewhat or
very helpful (Fig. 4).
Table 2. Results of satisfaction survey pre- and postvideo expressed as percentages using a 5-point Likert scale from poor to
excellent
Group, %
Characteristic
Prevideo
(n = 551)
Satisfaction with today’s visit
Excellent
27.6
Very good
30.5
Good
27.8
Fair
8.7
Poor
5.4
Explanation of the wait
Excellent
26.8
Very good
23.6
Good
21.1
Fair
13.8
Poor
14.7
Courtesy of the registration staff
Excellent
41.8
Very good
27.6
Good
20.0
Fair
7.4
Poor
3.1
Courtesy of the nurses
Excellent
52.8
Very good
27.0
Good
16.2
Fair
Poor
Courtesy of the physicians
Excellent
Very good
Good
Fair
Poor
Speed of nurse’s evaluation
Excellent
Very good
Good
Fair
Poor
July • juillet 2008; 10 (4)
Postvideo
(n = 581)
33.0
32.0
21.3
10.0
3.6
28.4
24.0
22.5
14.1
11.0
Group, %
p
value
0.02
0.25
43.9
26.6
19.7
6.0
3.8
0.51
55.4
27.4
14.5
0.25
2.3
1.6
2.0
0.7
56.4
27.1
12.2
2.4
2.0
59.6
26.6
10.5
2.4
0.9
38.7
29.9
21.4
6.2
3.8
42.8
30.0
17.2
6.5
3.4
0.19
0.12
Characteristic
Speed of physician’s evaluation
Excellent
Very good
Good
Fair
Poor
Level of confidence in nurse
Excellent
Very good
Good
Fair
Poor
Level of confidence in physician
Excellent
Very good
Good
Fair
Poor
How organized was your care?
Excellent
Very good
Good
Fair
Poor
Did staff explain your condition?
Excellent
Very good
Good
Fair
Poor
Perceived waiting room time
Very short
Just right
Long
Very long
Perceived time to see physician
Very short
Just right
Long
Very long
CJEM • JCMU
Prevideo
(n = 551)
Postvideo
(n = 581)
40.9
27.9
19.3
7.9
4.0
44.0
26.8
19.3
6.0
3.8
44.2
31.4
18.3
3.8
2.3
46.5
30.2
16.8
4.2
2.2
48.6
29.5
16.6
3.5
1.8
53.7
26.7
14.9
3.7
1.0
37.6
28.9
23.6
6.6
3.3
39.7
29.5
19.2
7.6
4.0
41.8
31.3
16.9
6.0
4.0
43.5
30.8
18.9
4.5
2.3
34.1
33.1
19.2
13.6
37.1
32.2
19.5
11.2
15.9
45.0
25.3
13.8
13.3
45.8
26.0
15.0
p
value
0.26
0.47
0.10
0.48
0.43
0.24
0.31
351
Papa et al.
1.0
0.9
0.8
0.7
0.6
0.5
0.4
3
st
vi
de
o
st
vi
Po
Po
de
de
st
vi
Po
o
2
1
o
3
eo
id
eo
Pr
ev
id
id
Pr
ev
eo
2
1
0.3
Pr
ev
The development of this department-specific instructional
waiting room video was part of an ED initiative to create
quality improvement strategies for our patients. The information provided was intended to improve patient education
and satisfaction, and reduce perceived waiting room times.
Finding ways to improve patient education is especially
difficult in a busy environment where patient–physician
encounters are brief. Our study used a customized video to
describe the ED process of care to our patients. Satisfaction, as well as the ED patient calls to our outpatient referral line accessing the hospital’s specialty clinics, increased
following this intervention. Perceived waiting room times
were not affected; however, after adjusting for other covariates, the perceived waiting room time and the ED waiting room video both impacted patient satisfaction.
Possible explanations for the increased satisfaction because of the ED video include improved patient awareness
of the process of care, realistic patient expectations before
care and reduction in anxiety. Other ED studies have found
that providing information about ED care is correlated
with higher satisfaction.4,15–17 Additionally, meeting patient
expectations during care has also been found to be associated with satisfaction.18,19 Results from a similar smaller
study with telephone follow-up found that patients who
viewed a process of care videotape in the ED had a statistically significant reduction in anxiety.4 A patient-education
approach has the potential to be a low-cost, effective
means of improving performance on identified process
measures as well as overall satisfaction.
A review of 16 studies found that the key elements of ED
satisfaction are patient information, provider–patient interpersonal factors and perceived waiting time.20 Similarly, a
number of prior studies support our findings. A study by
Goldwag and colleagues16 in 2002 revealed that perceived
comfort of ED facilities, patient education and explanations
provided were factors associated with patient satisfaction. In
2000, Boudreaux and colleagues15 investigated predictors of
patient satisfaction in a large municipal ED and showed that
patients’ perceptions of care, rather than demographics and
visit characteristics, most consistently predicted satisfaction.
Educational material can be provided to patients through
different media: verbally, through written material, or visu-
Very good or excellent
satisfaction, %
Discussion
Period
Fig. 3. Comparison of mean satisfaction over consecutive
time periods in both the pre– and post–emergency department (ED) waiting room video phases. Each block or time period was 20 days in length for a total of 6 consecutive 20-day
blocks with 3 in the pre– and 3 in the post–ED video phases.
70
60
Percentage
Age
Variables
ED video
Sex
Length of stay
60.5%
30
10
Reference line
.5
1.0
1.5
19.4%
20.1%
Not helpful
Somewhat helpful
0
2.0
Odds ratio
Very helpful
Response
Fig. 2. Results of multivariate logistic regression analysis
with adjusted odds ratios for variables associated with satisfaction. ED = emergency department.
352
40
20
Perceived wait
0.0
50
Fig. 4. Response of 304 subjects in the postvideo group to
the question “Was it helpful to view the video that explained your care?”
CJEM • JCMU
July • juillet 2008; 10 (4)
Waiting room videos and patient satisfaction
ally, through videos. A randomized study in a preanesthetic
clinic showed that patient satisfaction and information gain
was highest in those patients who received a documentary
video when compared with a brochure or interview.9 Similarly, at a women’s cancer screening clinic, satisfaction
was significantly higher among women receiving videosupported information and graphic-supported information
when compared with women receiving information without teaching aids.6 These randomized studies support the
use of videotaped information over written material.10 It
can be particularly advantageous for patients with limited
reading skills.
Although other studies have shown satisfaction with instructional videos, our customized video was produced onsite and involved our own physician, nursing and support
staff. In the waiting room video, patients and their families
were introduced to the process of care in our ED from registration to discharge thus preparing them for their experience in our ED.
One of our hypotheses was that the ED video would impact perceived waiting room times. In 1995, Thompson
and colleagues21 found that ED patients were least satisfied
when waiting times were longer than expected, were relatively satisfied when waiting times were perceived as equal
to expectations and were highly satisfied when waiting
times were shorter than expected. The findings of this
study suggest that managing waiting time perceptions and
expectations would be a more effective strategy to achieve
improved patient satisfaction in the ED than decreasing actual waiting.17 Despite the effect of the waiting room video
on satisfaction, perceived waiting room time was not affected in our study. Perceived waiting room time was still
the strongest predictor of overall satisfaction in our study.
This is consistent with several studies in the emergency literature that have shown the importance of patients’ perceptions of wait intervals on satisfaction.17,21,22
Calls to our referral line increased after implementation
of the ED video. Although the absolute numbers were
small, the number of ED patient calls requesting access to
specialty clinics quadrupled during the time the ED video
was introduced. This suggests a video of the nature we
studied is another potential means for connecting patients
with a coordinated system of care. A 1994 study of emergency services found that patients do not often realize that
there are other primary care resources that they can access
for treatment of nonacute health problems.23
Limitations
The primary limitation of our study is that it was not a ranJuly • juillet 2008; 10 (4)
domized, controlled design and that it took place at a single site. Several satisfaction studies have implemented a
pre–post design (with historical controls), and have concluded this design to be a valid method, assuming that important confounders are accounted for. In order to account
for pre–post differences we assessed baseline characteristics between the 2 groups as well as baseline satisfaction
level before and after the ED video implementation. Demographic data were comparable and not statistically different in the pre- and postvideo groups, including the actual length of stay. Additionally, we assessed the impact of
several covariates on satisfaction using multivariate analysis and found that the 2 strongest predictors were perceived
waiting room time and the ED waiting room video.
Pre–post designs are susceptible to the effects of secular
trends, such as system changes, during the different study
periods. However, there were no specific ED or system
changes during the period of the study of which the investigators were aware, including changes in patient acuity or
the ED population. To further examine the possibility of
secular trends in satisfaction before and after the intervention, we evaluated pre- and postvideo baseline satisfaction
levels at 3 distinct time points. There was no particular
trend detected in either the pre- or postintervention groups.
It would have been interesting to compare our results
with actual waiting room times, but we did not capture
this. We did, however, compare actual lengths of stay in
the ED in the pre- and postvideo groups and found that
there was no significant difference.
Calls to our outpatient referral line were recorded as patients who visited the ED within the month of their call,
but the patients were not asked if they had received the information from the waiting room video.
Another aspect of intervention studies is ensuring “intervention fidelity,” that is, asking patients if they understand
the intervention (in this case the ED video). Although, we
did not ask patients if they “understood” the video, we did
have a surrogate marker of fidelity by asking patients if
they had “seen” the video and if they found it “helpful.”
There was no blinding in the study, so it is possible that
bias was introduced during the assessments. Although the
research assistant was not blinded to the purpose of the
study, the same research assistant was used in both the preand postintervention phases.
Future studies to determine the effect of a “process of
care” educational ED video should consider the design issues discussed.
We had a large sample size that was determined a priori
and was sufficient to detect a significant difference between the 2 groups. Potential confounders were modelled
CJEM • JCMU
353
Papa et al.
statistically in an effort to control for the pre–post design.
An advantage of our study was that all patients in our convenience sample completed the survey on-site and none
were lost to telephone follow-up as in many other satisfaction studies. Furthermore, our survey tool was based on a
validated ED survey instrument. Future studies should
study the implementation of this educational intervention
in a randomized fashion.
10. Maller CE, Twitty VJ, Sauve A. A video approach to interactive
patient education. J Perianesth Nurs 1997;12:82-8.
11. Ader DN, Seibring AR, Bhaskar P, et al. Information seeking
and interactive videodisc preparation for third molar extraction.
[discussion 31-22]. J Oral Maxillofac Surg 1992;50:27-31.
12. Ruthman JL, Ferrans CE. Efficacy of a video for teaching
patients about prostate cancer screening and treatment. Am J
Health Promot 2004;18:292-5.
Conclusion
This study suggests preparing patients for their ED experience by describing the ED process of care through a waiting room video can improve ED patient satisfaction and
the knowledge of outpatient clinic resources in an ambulatory population. Although perceived waiting room time is
the strongest predictor of satisfaction, an instructional
waiting room video appears to be a tool that can improve
ED patient satisfaction in a discharged ambulatory population. In particular, our findings underscore the importance
of educating patients about ED processes of care.
13. Hall MF, Press I. Keys to patient satisfaction in the emergency
department: results of a multiple facility study. Hosp Health
Serv Adm 1996;41:515-32.
14. Burstin HR, Conn A, Setnik G, et al. Benchmarking and quality
improvement: the Harvard Emergency Department Quality
Study. Am J Med 1999;107:437-49.
15. Boudreaux ED, Ary RD, Mandry CV, et al. Determinants of
patient satisfaction in a large, municipal ED: the role of demographic variables, visit characteristics, and patient perceptions.
Am J Emerg Med 2000;18:394-400.
16. Goldwag R, Berg A, Yuval D, et al. Predictors of patient dissatisfaction with emergency care. Isr Med Assoc J 2002;4:603-6.
Competing interests: None declared.
References
1. Kologlu M, Agalar F, Cakmakci M. Emergency department information: does it effect patients’ perception and satisfaction
about the care given in an emergency department? Eur J Emerg
Med 1999;6:245-8.
2. Krishel S, Baraff LJ. Effect of emergency department information on patient satisfaction. Ann Emerg Med 1993;22:568-72.
3. Bjorvell H, Stieg J. Patients’ perceptions of the health care
received in an emergency department. Ann Emerg Med 1991;
20:734-8.
4. Corbett SW, White PD, Wittlake WA. Benefits of an informational videotape for emergency department patients. Am J
Emerg Med 2000;18:67-71.
5. Pager CK. Randomised controlled trial of preoperative information to improve satisfaction with cataract surgery. Br J Ophthalmol
2005;89:10-3.
6. Greimel ER, Gappmayer-Locker E, Girardi FL, et al. Increasing
women’s knowledge and satisfaction with cervical cancer
screening. J Psychosom Obstet Gynaecol 1997;18:273-9.
7. Jean Wiese H, Boethel C, Phillips B, et al. CPAP compliance:
video education may help! Sleep Med 2005;6:171-4.
8. Lin PC, Lin LC, Lin JJ. Comparing the effectiveness of different
educational programs for patients with total knee arthroplasty.
Orthop Nurs 1997;16:43-9.
354
9. Snyder-Ramos SA, Seintsch H, Bottiger BW, et al. Patient satisfaction and information gain after the preanesthetic visit: a comparison of face-to-face interview, brochure, and video. Anesth
Analg 2005;100:1753-8.
17. Thompson DA, Yarnold PR, Williams DR, et al. Effects of actual waiting time, perceived waiting time, information delivery,
and expressive quality on patient satisfaction in the emergency
department. Ann Emerg Med 1996;28:657-65.
18. Kravitz RL, Callahan EJ, Azari R, et al. Assessing patients’
expectations in ambulatory medical practice. Does the measurement approach make a difference? J Gen Intern Med 1997;
12:67-72.
19. Kravitz RL, Cope DW, Bhrany V, et al. Internal medicine
patients’ expectations for care during office visits. J Gen Intern
Med 1994;9:75-81.
20. Trout A, Magnusson AR, Hedges JR. Patient satisfaction investigations and the emergency department: what does the literature
say? Acad Emerg Med 2000;7:695-709.
21. Thompson DA, Yarnold PR. Relating patient satisfaction to
waiting time perceptions and expectations: the disconfirmation
paradigm. Acad Emerg Med 1995;2:1057-62.
22. Hedges JR, Trout A, Magnusson AR. Satisfied Patients Exiting
the Emergency Department (SPEED). Acad Emerg Med.
2002;9:15-21.
23. Cooke J, Finneran K. A clearing in the crowd: innovations in
emergency services. Pap Ser United Hosp Fund N Y 1994;
(Jan):1-43.
Correspondence to: Dr. Linda Papa, Department of Emergency Medicine,
Orlando Regional Medical Center 86 W. Underwood (S-200), Orlando FL
32806; [email protected]
CJEM • JCMU
July • juillet 2008; 10 (4)


© Copyright 2026