
Passenger Satisfaction Study - Bill and Hillary Clinton National Airport
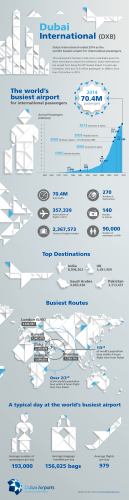
Bill and Hillary Clinton National Airport (LIT)
Passenger Satisfaction Study
Q1 2015
Copyright © 2015 Phoenix Marketing International. All rights reserved.
Methodology
Sample
• 407 departing passengers were interviewed in the gate areas
Interview Dates
• Interviews were conducted from January 4, 2015 to March 30, 2015
Interview
• Interviewer randomly selected departing passengers in the gate areas to complete the survey
• Interviewer asked initial screening questions and if respondents felt comfortable, the surveys were self-administered on a tablet with
an interviewer available to answer any questions
Scale
• A five-point scale was used where 1 is Very Dissatisfied and 5 is Very Satisfied
• This summary will report on Top 2 Box scores (those rating the item a 4 or 5)
Statistical Accuracy
• The total results have a statistical accuracy of +/- 4.9 percent at the 95% confidence level
Statistical Testing
• Significant differences at the 95% confidence level are indicated by green (significantly higher) or red (significantly lower) highlighting
• Comparison slides showing comparisons between business and leisure, male and female, and local and non-local passengers are
included only if there are significant differences between the groups
• Local passengers are defined as within the Little Rock MSA based on provided zip codes, non-local are all other passengers
1
Copyright © 2015 Phoenix Marketing International. All rights reserved.
Clinton National Airport Passenger Satisfaction Survey
Executive Summary
PASSENGER SATISFACTION
• Passengers’ Overall Satisfaction with Clinton National Airport is 93%. This is a higher satisfaction level than the national
average.
• Passengers are most satisfied with Getting to the Terminal, Service at Check-In, Security, and Leaving the Airport.
Passengers are least satisfied with Baggage Delivery, Food & Beverage, and Retail. Clinton National Airport performs higher
than the national average in each service area except for overall Retail satisfaction.
• Leisure passengers are significantly more satisfied than business travelers with Terminal Facilities Overall, the Gate Area
Overall, and their Overall Experience at Clinton National Airport.
• Non-local passengers are significantly more satisfied than local passengers with Retail Overall.
2
Copyright © 2015 Phoenix Marketing International. All rights reserved.
Clinton National Airport Passenger Satisfaction Survey
Overall Satisfaction
Among All Passengers Surveyed, Top 2 Box (5=Very Satisfied/4)
• Nine out of ten passengers (93%) are satisfied overall with their experience at Clinton National Airport.
• Passengers are most satisfied with Getting to the Terminal, Service at Check-In, Security, and Leaving the Airport.
93%
96%
95%
96%
95%
94%
88%
87%
73%
66%
OVERALL
Getting To The Service At CheckSecurity
Terminal Facilities
Food And
SATISFACTION Terminal Overall
In Overall
Checkpoint Overall
Overall
Beverage Overall
Retail Overall
Gate Area Overall Baggage Delivery Leaving The
Overall
Terminal Overall
3
Q21. Considering your entire experience at Bill and Hillary Clinton Airport, please rate your Overall experience today.
Copyright © 2015 Phoenix Marketing International. All rights reserved.
Clinton National Airport Passenger Satisfaction Survey
Overall Satisfaction
Among All Passengers Surveyed, Top 2 Box (5=Very Satisfied/4)
• Clinton National Airport performs significantly higher than the national average in each area except for Food & Beverage and Retail satisfaction.
Clinton National Airport
96%
93%
96%
95%
National Benchmark*
94%
88%
81%
83%
82%
83%
81%
80%
73%
OVERALL
SATISFACTION
Getting To The
Terminal Overall
Service At Check-In
Overall
Security Checkpoint
Overall
Terminal Facilities
Overall
69%
Food And Beverage
Overall
66%
69%
Retail Overall
Gate Area Overall
* National Benchmark based on 35,000 airport evaluations performed by Phoenix Marketing International in 2014
Significant differences at the 95% confidence level are indicated by green (significantly higher) or red (significantly lower) highlighting.
Q21. Considering your entire experience at Bill and Hillary Clinton Airport, please rate your Overall experience today.
Copyright © 2015 Phoenix Marketing International. All rights reserved.
4
Clinton National Airport Passenger Satisfaction Survey
Overall Satisfaction
Among All Passengers Surveyed, Top 2 Box (5=Very Satisfied/4)
• Leisure passengers are significantly more satisfied than business travelers with Terminal Facilities Overall, the Gate Area Overall, and their
Overall Experience at Clinton National Airport.
Business
95%
89%
97%
93%
98%
94%
95%
Leisure
98%
97%
94% 95%
92%
88%
82%
71%
89%
82%
75%
70%
61%
OVERALL
Getting To The Service At CheckSecurity
Terminal Facilities
Food And
SATISFACTION Terminal Overall
In Overall
Checkpoint Overall
Overall
Beverage Overall
Retail Overall
Gate Area Overall Baggage Delivery Leaving The
Overall
Terminal Overall
Significant differences at the 95% confidence level are indicated by green (significantly higher) or red (significantly lower) highlighting.
Q21. Considering your entire experience at Bill and Hillary Clinton Airport, please rate your Overall experience today.
Copyright © 2015 Phoenix Marketing International. All rights reserved.
5
Clinton National Airport Passenger Satisfaction Survey
•Phoenix Marketing International
Travel Research Group
• 732-563-8503 (phone)
800-903-0230 (fax)
• www.phoenixmi.com
Copyright © 2015 Phoenix Marketing International. All rights reserved.


© Copyright 2026