
notes to the financial statements
Meeting the Challenge COSCO Corporation (Singapore) Limited Annual Report 2014 Contents COSCO OVERVIEW INSIDE COSCO AND CORPORATE CITIZENSHIP 1 2 4 6 10 11 67 69 71 Corporate Profile Corporate Structure Financial Highlights Significant Developments Our Major Shipyards Major Deliveries in 2014 KEY MESSAGES 14 18 Message from the Chairman Interview with Vice Chairman and President OPERATIONS AND FINANCIAL REVIEW 24 27 28 Ship Repair, Ship Building and Marine Engineering Dry Bulk Shipping and Others Group Financial Review Research and Development Human Resources and Workplace Safety Corporate Social Responsibility FINANCIAL STATEMENTS 74 78 79 80 81 82 83 84 85 148 Directors’ Report Statement by Directors Independent Auditor’s Report Consolidated Profit or Loss Consolidated Statement of Comprehensive Income Balance Sheets Consolidated Statement of Changes in Equity Consolidated Statement of Cash Flows Notes to the Financial Statements Five-Year Summary 149 Shareholding Statistics 150 Notice of Annual General Meeting Proxy Form for Annual General Meeting Notes for Proxy Form CORPORATE GOVERNANCE AND TRANSPARENCY 32 51 52 58 60 62 Corporate Governance Corporate Information Board of Directors Key Management Investor Relations Risk Management INVESTOR RELATIONS CONTACTS COSCO Corporation (Singapore) Limited Mr Li Man, Vice President Mr Wang Hui, General Manager, Investor Relations Tel: (65) 6885 0888 Fax: (65) 6336 9006 Email: [email protected] SPIN Capital Asia (Investor Relations Consultant) Mr Michael Tan Tel: (65) 6227 7790 Email: [email protected] 4 COSCO Corporation (Singapore) Limited COSCO Overview CORPORATE PROFILE A MARINE GROUP SPECIALISING IN SHIP REPAIR, SHIP BUILDING AND MARINE ENGINEERING. COSCO Corporation (Singapore) Limited, operates one of the largest ship repair, ship building, marine engineering and dry bulk shipping outfits in China. It is the SGX Mainboard-listed subsidiary of China Ocean Shipping (Group) Company (“COSCO Group”), China’s largest shipping group and one of the top shipping conglomerates in the world. Through our 51% stake in COSCO Shipyard Group, one of the largest shipyard groups in China with yards strategically located along China’s coastline, we offer turnkey services in ship repair, ship building and marine engineering. Our portfolio includes deep-water oil rigs, FPSO (Floating Production Storage and Offloading) units, installation vessels, barges and platform vessels. Our yards cater to a worldwide clientele, delivering new builds of varying types and sizes including bulk carriers, oil tankers, special purpose carriers and Liquefied Natural Gas (LNG) carriers. COSCO Corporation is constantly innovating to stay ahead of the competition. We aim to provide cost-effective solutions that meet the current and future needs of the marine industry. Since 2009, we have been part of the FTSE ST China Index and the FTSE ST China Top Index. The Bloomberg World Shipbuilding and Bloomberg Asia Pacific Shipbuilding Indices also include us as a component. Annual Report 2014 1 COSCO Overview CORPORATE STRUCTURE Ship Repair, Ship Building and Marine Engineering 90% COSCO Marine Engineering (Singapore) Pte Ltd 100% COSCO Engineering Pte Ltd 50% COSCO (Nantong) Shipyard Co., Ltd 39% COSCO (Dalian) Shipyard Co., Ltd 51% COSCO Shipyard Group Co., Ltd 100% COSCO (Zhoushan) Shipyard Co., Ltd 95% COSCO (Shanghai) Shipyard Co., Ltd 75% COSCO (Guangdong) Shipyard Co., Ltd 60% COSCO (Lianyungang) Shipyard Co., Ltd (Dissolved on 22 December 2014) 60% COSCO (Qidong) Offshore Co., Ltd 59% COSCO (Dalian) Shipyard Co., Ltd 50% COSCO (Nantong) Shipyard Co., Ltd 51% COSCO (Xiamen) Shipyard Co., Ltd 90% COSCO (Tianjin) Shipyard Co., Ltd 40% Tru-Marine COSCO (Tianjin) Engineering Co., Ltd 100% COSCO (Hongkong) Shipyard Co., Limited (Incorporated on 17 February 2014) 60% COSCO (Nantong) Clavon Ship Engineering Co., Ltd 75% COSCO Dalian Rikky Ocean Engineering Co., Ltd 51% Zhongxing Sea-Land Engineering Co., Ltd 60% COSCO Shipyard Total Automation Co., Ltd 30% Diesel Marine Dalian Ltd 30% Diesel Marine International (Nantong) Co., Ltd 30% DMI (Guangzhou) Ltd 2 COSCO Corporation (Singapore) Limited COSCO Overview Dry Bulk Shipping and Others 100% COSCO (Singapore) Pte Ltd 100% Cos Fair Shipping Pte Ltd 100% Cos Glory Shipping Inc 100% Hanbo Shipping Limited 100% Sanbo Shipping Limited 100% Cos Knight Shipping Maritime Inc. 100% Cos Lucky Shipping Maritime Inc. 100% Cos Orchid Shipping Pte Ltd 100% Cos Prosperity Shipping Pte Ltd 100% Harington Property Pte Ltd Annual Report 2014 3 COSCO Overview FINANCIAL HIGHLIGHTS Turnover (S$’m) Net Profit Attributable to Equity Holders (S$’m) 4,261 2014 2013 3,508 3,734 2012 2011 4,163 2010 3,861 Net Assets (s$’m) 2,230 2013 2,175 2012 2,049 2010 21 2013 31 2012 106 2011 140 249 2010 Revenue by Activities (%) 2014 2011 2014 1.2% Charter hire and others 2,000 1,794 98.8% Ship repair, ship building and marine engineering 4 COSCO Corporation (Singapore) Limited COSCO Overview 5-YEAR PROFIT AND LOSS ACCOUNTS (S$’m) 2010 2011 2012 2013 2014 Turnover 3,861 4,163 3,734 3,508 4,261 402 286 229 61 17 0 1 1 0 0 Operating Profit before Tax Share of (Loss)/Profit of Associated Companies 43 74 60 8 (9) Net Profit 359 213 170 53 26 Non-Controlling Interests 110 73 64 22 5 Net Profit Attributable to Equity Holders of the Company 249 140 106 31 21 2010 2011 2012 2013 2014 2,239.2 2,239.2 2,239.2 2,239.2 2,239.2 11.1 6.2 4.7 1.4 0.9 Dividend per Share (cents) 4.0 3.0 2.0 1.0 0.5 Dividend Cover (times) 2.8 2.1 2.4 1.4 1.9 Net Tangible Assets per Share (cents) 53.1 57.7 56.8 59.2 60.7 Net Asset Value per Share (cents) 53.5 58.1 57.2 59.7 61.1 Income Tax Expense/(Credit) OTHER KEY STATISTICS Number of Shares (m) Diluted Earnings per Share (cents) 0.1 0.4 1.0 1.3 2.5 Return on Equity (%) 21.8 11.2 8.2 2.3 1.5 Return on Assets (%) 4.0 2.1 1.5 0.4 0.2 Gearing Ratio (net of cash)(times) Dividend Per share (cents) And Diluted Earnings Per Share (cents) 12 Diluted Earnings per Share (cents) 11.1 Dividend per Share (cents) 9 6 6.2 4.7 4.0 3.0 3 2.0 1.4 1.0 0 2010 2011 2012 2013 0.9 0.5 2014 Annual Report 2014 5 COSCO Overview SIGNIFICANT DEvelopments Deliveries in 2014 Kai Xuan Yi Hao Jack-up drilling rig GelBRay Express Livestock carrier EDrill-1 Self-erecting drilling tender barge 6 COSCO Corporation (Singapore) Limited COSCO Overview SapuraKENCANA 3500 Pipelay heavy lift vessel M.V. Chauvin Tide Platform supply vessel Annual Report 2014 7 COSCO Overview SIGNIFICANT DEvelopments Current projects Semi-submersible accommodation vessel Anchor handling tug supply vessel Floating accommodation units 8 COSCO Corporation (Singapore) Limited COSCO Overview LeTourneau Super 116E Jack-up drilling rig 28,000 m3 LNG carrier Semi-submersible accommodation vessel Jack-up rig Annual Report 2014 9 COSCO Overview OUR MAJOR SHIPYARDS Shipyard Capabilities Dalian Dry dock (dwt) Floating dock (dwt) Marine Engineering/ Shipbuilding/Repair 80,000 80,000 180,000 300,000 Qidong Marine Engineering 200,000 – Nantong Marine Engineering/Repair – 150,000 80,000 Shanghai Marine Engineering/Repair – 35,000 80,000 Zhoushan Marine Engineering/ Shipbuilding/Repair 80,000 400,000 230,000 – Guangdong Marine Engineering/ Shipbuilding/Repair Total – 80,000 150,000 990,000 1,135,000 Dalian Qidong Nantong Shanghai Zhoushan Guangdong 10 COSCO Corporation (Singapore) Limited COSCO Overview MAJOR DELIVERIES IN 2014 Name of Vessel Project DetailsDelivered In COSCO Dalian Shipyard M.V. Union Voyager New build 82,000 DWT bulk carrier March 2014 M.V. Guotou 108 New build 57,000 DWT bulk carrier April 2014 M.V. Flag Zannis New build 80,000 DWT bulk carrier September 2014 M.V. Cic Epos New build 80,000 DWT bulk carrier October 2014 SapuraKencana FLB-1 Floatover launch barge June 2014 M.V. Puerto Rosario New build 64,000 DWT bulk carrier June 2014 M.V. Porto Leone New build 64,000 DWT bulk carrier June 2014 Bumblebee Stinger barge December 2014 COSCO Zhoushan Shipyard COSCO Guangdong Shipyard M.V. Ioannis G New build 57,000 DWT bulk carrier January 2014 M.V. Gelbray Express New build 4,500 m livestock carrier February 2014 M.V. Fuat Bey New build 35,300 DWT bulk carrier March 2014 EDrill-1 Self-erecting drilling tender barge April 2014 M.V. Girolando Express New build 4,500 m livestock carrier July 2014 EDrill-2 Self-erecting drilling tender barge November 2014 M.V. Chauvin Tide Platform supply vessel December 2014 T-18 New build tender rig March 2014 SapuraKencana 1200 Pipelay heavy lift vessel March 2014 Sea Challenger Wind turbine installation vessel April 2014 SapuraKencana 3500 Pipelay heavy lift vessel May 2014 Kai Xuan Yi Hao Jack-up rig July 2014 2 2 COSCO Nantong Shipyard Annual Report 2014 11 COSCO Overview Amidst continued volatility in the surrounding business environment, we are focused and flexible. Developing our range of expertise; widening our customer base; improving efficiency. This balance will give us the ballast needed as we push forward. COSCO Dalian Shipyard COSCO Overview Key Messages Message from the CHAIRMAN “We believe our shipyards’ wide repertoire of competencies for various marine engineering products puts us on a steady course to meet the challenges of the global market.” Li Yun Peng Chairman 14 COSCO Corporation (Singapore) Limited Key Messages Dear Shareholders This report is being presented in the midst of difficult market conditions as the world economy continues to face challenges coupled with the substantial drop in oil prices since the second half of 2014. For COSCO Corporation, the performance in the financial year that ended 31 December 2014 was subdued in the face of the many challenges that compounded the already difficult operating conditions. During the year, the Group had continued to step up efforts to further improve productivity, job execution and cost efficiency to maximise yields from our projects. The projects executed were contracted in recent years at much lower prices owing to market conditions prevailing then, while costs have continued to increase. The Group’s turnover was $4.3 billion, an increase of 21.5% from $3.5 billion for the previous year. Gross profit decreased by 9.4% to $291.0 million. Profit attributable to shareholders was $20.9 million, a 31.8% decline from 2013, in spite of every effort to execute projects more efficiently and cost effectively. Diluted earnings per share was 0.9 cent. Group net asset value per ordinary share as at 31 December 2014 was slightly higher at 61.1 cents. Contribution from Marine Engineering Remains Strong The bulk of our income continues to be generated by our shipyard operations, which contributed to 98.8% of overall turnover mainly from growth in revenue from the marine engineering and ship building segments. In 2014, we delivered marine engineering projects comprising 2 self-erecting drilling tender barges, 2 pipelay heavy lift vessels, 1 jack-up rig, 1 tender rig, 1 stinger barge, 1 float-over launch barge, 1 platform supply vessel and 1 wind turbine installation vessel. 8 bulk carriers and 2 livestock carriers were also delivered. Marine engineering and shipbuilding had contributed 73% and 13% of shipyard revenue respectively. In the year under review, our ship repair business remained stable contributing to 10% of total shipyard revenue. We also continued to deliver ship conversion jobs, with the segment accounting for 4% of total shipyard revenue. The Baltic Dry Index (BDI), the internationally recognised indicator for commodities shipping, was at 2,113 points at the beginning of 2014, declining to 782 points at the end of 2014 to average 1,105 points for the entire year. For our dry bulk shipping and other businesses segment, revenue fell by 5.6% to $52.5 million. Stable Order Book Despite Market Challenges As at 31 December 2014, our accumulated orders stood at US$8.4 billion with progressive deliveries till 2017. We added US$1.6 billion of new contracts to our order book during the year under review. Most of the new orders received in 2014 were marine engineering products including 8 platform supply vessels, 4 emergency response/rescue/field support vessels, 4 sub-sea supply vessels, 1 jack-up rig, 1 accommodation barge, 1 floating accommodation unit, and 1 module carrier. New shipbuilding orders included 9 bulk carriers and 3 livestock carriers. Noteworthy is a US$470 million contract the Group secured from Maersk Supply Service AS (“MSS”), a member of the Moller-Maersk Group, to construct four sub-sea supply vessels scheduled for delivery in the fourth quarter of 2016, with an option for two additional units. The array of building and project capabilities at our six modern shipyards in Guangdong, Zhoushan, Shanghai, Nantong, Qidong and Dalian dotted along China’s coastline has helped us secure diversified contracts from both the marine engineering and shipbuilding segments to tide over the difficult market. Annual Report 2014 15 Key Messages Message from the CHAIRMAN “Moving forward, we will continue to focus on the improvement of our productivity and cost control measures. We will also exercise greater prudence to ensure that business risks are continually better managed to further support the sustainability of the Group.” Volatile Market Conditions To Persist Slowing economic growth from the beginning of 2014 dampened the marine engineering business, and the sharp fall in oil prices from the middle of the year under review compounded the situation. Brent Crude had collapsed by about 60% from a high of US$115 per barrel to below US$47 per barrel in January 2015 following continued slowdown in demand growth and record increase in non-OPEC supply. In February 2015, it recovered to around US$60 per barrel. Markets have yet to feel the full impact of the oil price plunge and the wider implications for inflation, currencies, business costs, as well as government finances and the global economy. In an update of its World Economic Outlook in January 2015, the International Monetary Fund (IMF) lowered its global growth forecast for 2015 by 0.3% to 3.5%. It said the net benefit of the sharp decline in oil prices would be more than offset “by persistent negative forces, including the lingering legacies of the crisis and lower potential growth in many countries”. IMF projected growth in advanced economies to rise to 2.4% in both 2015 and 2016, but observed “the increasing divergence between the United States, on the one hand, and the Euro area and Japan, on the other”. For the emerging markets and developing economies, it forecasted growth to remain broadly stable at 4.3% in 2015 and expected that to rise to 4.7% in 2016, lower than its earlier forecast in October 2014. 16 COSCO Corporation (Singapore) Limited The International Energy Agency (IEA), in its February 2015 Oil Market Report, expects the global oil market over the next few years “to begin a new chapter in its history” and foresees “prices stabilising at levels higher than recent lows but substantially below the highs of the last three years”. There have also been reports that energy firms in the Middle East and the United States have begun demobilising drilling equipment, cutting capital spending and jobs and restructuring their debt. New orders for 2015 from the marine engineering segment may not look promising. Yards are likely to face the risks of buyers delaying project deliveries and even cancellations if the price of oil does not recover meaningfully in 2015. The massive decline in oil prices is expected to have significant repercussions on offshore exploration activity and could severely impact our marine engineering business, which accounts for a sizeable proportion of our turnover. Even with lower oil prices expected to drive improvement in world trade, the global dry bulk shipping market remains in overcapacity. Together with an expected credit squeeze for the shipbuilding sector, we are also very concerned about orders for dry bulk vessels going forward. In the light of challenging economic and business conditions, COSCO continues to maintain a cautious outlook going into 2015. Key Messages Meeting the Challenge Since 2006, COSCO Corporation has developed into an integrated marine engineering solutions provider with the capability for a wide range of marine engineering products, as well as marine transport vessels. The quality and diversity of our new contracts have improved over the years, with encouraging orders of higher specification semi-submersible rigs and jack-up drilling rigs, and a greater variety and size of offshore support vessels and cargo carriers. The Group continues to build a wider variety of products than most others in China. This gives us the advantage of accommodating varied customer requirements. We believe our shipyards’ wide repertoire of competencies for various marine engineering products puts us on a steady course to meet the challenges of the global market. Our research and development team has also been working hard on honing our design capability and preparing for new challenges brought by more demanding specifications, especially in the marine engineering areas. We have further strengthened the foundation of our marine engineering capability, and will continue to gear ourselves for higher quality and more cost-effective output from our yards. As one of the larger players in China’s marine engineering space, we have capitalised on our first-mover advantage to address the ever-changing needs of our clientele. We will continue to enhance our project execution capability by further improving our work processes and up-skilling our workers and at the same time keeping a tight lid on costs across our shipyards in China. We continue to be vigilant with the ebb and flow of the market and increase our responsiveness to the needs of our customers in the ship repair, ship building and marine engineering segments. We take a cautious approach into the new financial year, with a keen eye on global economic conditions. Going forward, the COSCO team will work even harder to strengthen our relationship with core clients and explore various avenues to offer better value propositions for all our customers. Dividend Announcement In these trying times, the Board is proposing a first and final dividend of 0.5 cent per share to be approved at the upcoming Annual General Meeting. On behalf of the Board of Directors, I would like to take this opportunity to thank all our valued shareholders for your understanding and continued strong support. We would also like to record our appreciation to the management and staff for their contributions in 2014 and their continued determination and hard work in support of the Group’s efforts to manage change and address new challenges. Li Yun Peng Chairman In spite of all these efforts, the pressure of increasing costs has in some ways negated much of the benefits in the year under review. Moving forward, we will continue to focus on the improvement of our productivity and cost control measures. We will also exercise greater prudence to ensure that business risks are continually better managed to further support the sustainability of the Group. Annual Report 2014 17 Key Messages interview with vice CHAIRMAN and president “We have made considerable headway in our construction capability, and the yards’ technological base is today more advanced than before. “ CAPTAIN WU ZI HENG Vice Chairman and President 18 COSCO Corporation (Singapore) Limited Key Messages 1.What efforts have the company made in 2014? In 2014, marine engineering continued to be a major contributor. Despite many challenges, we have continually improved our technical competency and execution capability and received support from our customers. Our efforts in further developing our marine engineering segment has made a great difference to the Group’s performance over the years, especially when the dry bulk shipping market took a steep dive after the financial crisis. If we had not managed change and gone into the marine segment of the market as one of the first movers in China back in 2006, we would have been in a more difficult position today. We have over the last eight years been restructuring and re-engineering some of our major yards in China for higher value projects, such as semisubmersible drilling rigs, jack-up drilling rigs, drilling tender barges, accommodation rigs and vessels, wind turbine installation vessels, heavy lift pipelay vessels and offshore support vessels. We have made considerable headway in our construction capability, and the yards’ technological base is today more advanced than before. Our shipyards are able to deliver more sophisticated products with new and complex specifications. For instance, we had in July 2014 delivered “Kai Xuan Yi Hao”, a LeTourneau Workhorse jack-up drilling rig with a number of major technological and production breakthroughs for COSCO. The rig operates at depths of over 400 feet and drills at depths of up to 35,000 feet. It has been deployed by its Chinese operator in the East China Sea. During the year under review, delivery was made for a deepwater pipelay heavy lift vessel capable of oil pipe processing, laying, installation and heavy lift work. We also delivered two drilling tender barges, the “EDrill-1” and “EDrill-2” which incorporate high-end specifications. These units are equipped with lightweight Drilling Equipment Set (DES) and are amongst the better designed units built so far for the tender barge market. Another notable project was the first Rolls-Royce UT 771 CDL design supply vessel with a loading capacity of 3,800 tonnes and accommodation for 46 crew. While we have been able to increase our share of marine engineering projects, I must emphasise that we will continue to maintain our capability to build a wide range of transport vessels, including bulk carriers, livestock carriers and oil tankers, and hopefully increase our share of the ship conversion and repair business. I believe the diversity of our shipyard capability has been a source of strength in the last few years. 2. What are your observations on the various scenarios given by economists and analysts on the global economy and the maritime market following the sharp drop in oil prices? Recently, there have been a lot of news reports and projections on the world economy in 2015. Although not all of the forecasts are congruent, the general consensus is the world economy may recover slower than it was expected months ago. The International Monetary Fund (IMF) in its January 2015 Outlook report said that higher oil supply and lower prices would give the global economy a boost, though this boost is projected to be more than offset by negative factors including investment weakness due to lower expectations about medium-term growth in many advanced and emerging market economies. It projected 2015–16 global economic growth at 3.5% and 3.7%, down 0.3% relative to its October 2014 World Economic Outlook. IMF said the revisions followed its reassessment of prospects in China, Russia, the Euro area, and Japan, as well as in some major oil exporting countries where there could be weaker activity because of the sharp oil price decline. Current market conditions for our industry, especially marine engineering, remain very fluid. There have been differing views on how soon oil prices will bottom out and after that, how long it will take for prices to reach a sustainable level for offshore production to pick up again. Already some companies in the energy and allied industries are facing lay-offs, temporary shutdowns and spending cuts and cancellations. Our biggest concern is how deep the actual cuts in capital expenditure for offshore exploration and production will be, as they can have a significant impact on our order book for drilling rigs, tender barges and other offshore vessels going forward. We will keep our fingers firmly on the pulse of the market and maintain a steady course in our pursuit of excellence within the organisation. We have to tread very cautiously in the near term. Annual Report 2014 19 Key Messages interview with vice CHAIRMAN and president 3. Against the backdrop of falling oil prices, how do you think the Marine engineering segment will look like in 2015? Recent reports have said major oil companies have announced capital expenditure cuts, contract renegotiations, contract terminations and staff layoffs in the exploration and production sector amidst declining rig leasing rates and deployment. The International Energy Agency (IEA) has said that investment in oil production is expected to decline by US$100 billion, or 15%, in 2015 compared to the previous year. Crude oil prices have fallen by about 60% since June 2014. OPEC had earlier in November 2014 maintained its position not to cut output. It recently said it did not expect oil prices to drop any further and predicted non-OPEC oil supply growth to slow down including US drillers producing less than previously projected. In February 2015, the IEA predicted in its monthly oil market report that oil prices would stabilise substantially below the high levels of more than US$100 per barrel enjoyed by producers over the last three years. IHS Petrodata’s weekly rig count on 27 February 2015 showed that the worldwide supply of rigs totalled 869, up from 835 a year ago and utilisation has fallen to 87.8% from 94.7%. Our marine engineering segment is facing tremendous pressure in the short-term. However, the longer term outlook for Floating Production Storage and Offloading (FPSO)/Floating Storage and Offloading (FSO), Shuttle Oil Tankers, Floating Storage & Regasification Units (FSRU) and Floating Liquefied Natural Gas (FLNG) remains promising. We have to continue gearing ourselves up and be ready to take on higher value projects. This will ensure that we have the sustained capability to capture potential opportunities that may present themselves in these times. As at 31 December 2014, the marine engineering projects include 25 units of platform supply vessels, 7 units of jack-up rigs, 4 units each of semi-submersible accommodation vessels, subsea supply vessels and emergency/response/rescue/field support vessels, 3 floating accommodation units, 2 units of semi- 20 COSCO Corporation (Singapore) Limited submersible accommodation rigs, 1 FPSO, 1 Sevan 650 Drilling Unit, 1 semi-submersible tender assist drilling rig, and 1 DP3 accommodation barge. 4.With the slower growth for shipping services and the continuing global bulk shipping tonnage surplus, what do you think is in store for the dry bulk shipping business in 2015? In 2014, despite the overall decline in the dry bulk shipping market, we were able to charter out most of our dry bulk vessels at the start of the year when the Baltic Dry Index (BDI) was relatively higher. With the economic slowdown, demand for ships to transport raw materials has declined. The slide in commodity prices is an unwelcome indication that economic conditions are not likely to get better unless growth in most regions of the world recovers firmly. Nonetheless, a strong recovery in emerging economies is necessary to drive demand for commodities and spur growth in the shipping sector. The BDI was at 2,113 points at the beginning of 2014, declining to 782 points at the end of the year, with an average of 1,105 points for the entire year. However, the Index fell to its all-time low of 509 points on 18 February 2015. Given the tonnage oversupply in the market, we foresee our dry bulk shipping business will continue to face considerable headwinds. 5. Taking into account the performance of 2014, how do you see the market for the shipbuilding, repair and conversion segments in the new financial year? We delivered 8 bulk carriers and 2 livestock carriers in 2014. Currently, our shipbuilding projects include 23 bulk carriers ranging from 35,000 DWT to 92,000 DWT, 5 oil tankers, 3 module carriers, 3 livestock carriers, 2 salvage lifting vessel, 1 LNG carrier and 1 cargo & training ship. The majority of the vessels repaired at our yards were bulk carriers, followed by container ships, tankers, chemical ships and others. The Clarkson Newbuilding Price Index recovered from June 2013 at 126 points and peaked at 140 points in mid-2014 before declining to 138 in December 2014. Correspondingly, the China Newbuilding Price Index had Key Messages recovered steadily in 2013 and reached a high of 960 points in mid-2014 before ending at 939 in December 2014. Going forward, the market for newbuilds is expected to be lacklustre, but we expect to see a resilient market for dual-fuel eco-friendly ships, LNG carriers and special purpose vessels with higher specifications. With the highly volatile global market conditions, prices may not recover any time soon. We foresee near-term price weakness in the face of the global tonnage surplus that has grown with a younger fleet. This is expected to curtail appetite for investment in newbuilds. Furthermore, we are very concerned about credit availability from cautious lenders to the maritime industry. We will endeavour to innovate and pursue higher quality contracts. Over the years, we have extended our ship building capability for an increasingly wider range of vessels, in addition to bulk carriers. Against the backdrop of tonnage overcapacity, younger global fleet and lower repair prices, we believe the ship repair and conversion market may still face pressures. However, opportunities may present themselves as many ship owners with older fleets are likely to allocate higher budgets for repair, with the increased cash flow resulting from lower oil prices and operating costs. There should also be additional opportunities after the enactment of the more stringent International Maritime Organisation Convention amendments. In 2014, our shipyards in Dalian, Guangdong and Zhoushan were included in the ‘white list’ published by the Ministry of Industry and Information Technology of the People’s Republic of China. This is in recognition of the overall building quality and management competency of our yards. This may help our yards to receive favourable policy support and gain easier access to loans especially from state-owned banks. 6. What is the Company doing to sustain its performance in 2015? Our wide-ranging capabilities have been a key factor in our sustained performance since 2006, when we started our marine engineering business. With our six shipyards in China each well-equipped to handle projects of various dimensions, we have the added flexibility that most other shipyards lack in addressing changing market requirements. COSCO has grown into an integrated marine engineering solutions provider with the capability for projects spanning the maritime value chain. COSCO Corporation is one of the leading marine engineering groups in the People’s Republic of China. We are moving up the value chain of more sophisticated, higher-value semi-submersible drilling rigs and subsea supply vessels. This will help us continue to build a stronger foundation for this core segment of our business. Having said that, we need to be mindful of the trade-offs between building higher value complex product types and the resulting cost and execution challenges. We have come a long way to build a formidable pool of resources and expertise for numerous projects, especially at the mid to higher end of the value spectrum. Our recent landmark deal with Maersk Supply Service to construct four sub-sea supply vessels is a vote of confidence in the technical capability that we have honed over the years. We believe opportunities still exist in the current difficult market and we will have to work much harder. Today, we are in a better position to take advantage of opportunities when the market recovers – for both marine engineering and shipbuilding segments. Pressing forward, we are guided by some good practices to see us through this difficult time. They include but are not limited to the following: pursue strategic and transformation goals, pro-actively engage major clients and capitalise on market opportunities; step up productivity to ensure on-time delivery of projects, control costs to enhance competitiveness; adopt Lean Management practices to improve efficiency and quality; promote innovation, augment and upgrade technical competencies; and manage risks with an eye on business sustainability. Annual Report 2014 21 COSCO Guangdong Shipyard Our broad expertise enables us to build a wide variety of projects, including oil rigs, platform supply vessels, drilling tender barges and bulk carriers. These diverse skills continue to stand us in good stead. Operations and Financial Review SHIP REPAIR, SHIP BUILDING AND MARINE ENGINEERING Overview A leading marine conglomerate, COSCO Corporation (COSCO) offers capabilities in ship repair, ship building and marine engineering supported by six major shipyards strategically located along China’s coastline. Owned by COSCO Shipyard Group, a subsidiary of COSCO Corporation, these six modern shipyards are located from Guangdong in the south to Zhoushan, Shanghai, Nantong, Qidong along the central coast, to Dalian in the north. Together, these assets and capabilities position COSCO to meet the evolving challenges of the global marine industry. In a year characterised by weak business and economic conditions, COSCO focused on producing quality projects and expanding its manufacturing knowledge base. This is in keeping with our long-term strategy of upgrading our skills and broadening our engineering experience. In 2014, we delivered projects to international clients comprising 8 bulk carriers, 2 livestock carriers, 2 pipelay heavy lift vessels, 2 self-erecting drilling tender barges, 1 tender rig, 1 wind turbine installation vessel, 1 float- 24 COSCO Corporation (Singapore) Limited over launch barge, 1 jack-up rig, 1 stinger barge and 1 offshore platform supply vessel. This diverse portfolio is a testimony to our Group’s efforts in growing an enlarged customer base and strengthening our technical capabilities, particularly in the marine engineering sector. We were an early mover into this highly-competitive sector, delivering many newbuilds and securing numerous contracts over the years. Shipyard operations continued to be the main business driver for COSCO, comprising 98.8% of Group revenue over the year. Ship Building In 2014, COSCO delivered 8 bulk carriers of various tonnages and 2 livestock carriers. COSCO’s competence in building livestock carriers was reinforced by the delivery of ‘Girolando Express’ and ‘Gelbray Express’ to a European client, following the successful delivery of two livestock carriers in 2013. These livestock carriers are “next generation” livestock vessels with a loading capacity of approximately 4,500 square metres and a cruising range of around 18,000 nautical miles. They are fitted with animal-welfare facilities meeting Australian Maritime Safety Authority (AMSA) regulatory requirements and incorporating a bow design that will Operations and Financial Review ensure fuel savings while maintaining high speeds and maximum comfort for livestock and crew. Marine Engineering COSCO completed a diverse range of new projects in 2014, delivering platform supply vessel, multi-functional pipelay vessels, jack-up rig and drilling tender barges. A major milestone for the year was the delivery of ‘Kai Xuan Yi Hao’, a newbuild jack-up rig to a Chinese buyer in July. It is the first LeTourneau Workhorse jack-up drilling rig built and delivered by a Chinese shipyard, marking a number of major technological and production breakthroughs for COSCO. Measuring 66.71 metres in length and 67.06 metres in width, the rig is designed to operate at depths of 400 feet. Built to the high standards of ABS class and Habitability Plus (HAB+), this unit is capable of performing drilling operations at depths of up to 35,000 feet. The rig has been chartered by China Oilfield Services Limited for a five-year period and is deployed for drilling operations in the East China Sea. In April, we delivered the ‘EDrill-1’, a high-end drilling tender barge to a Singaporean owner, Energy Drilling, with a charter contract to PTT Exploration & Production Public Co. Ltd (PTTEP) for a fixed term of three years, starting August 2014. As one of the latest and best designed units built so far for the tender barge market, its performance has been highly acclaimed by the charterer and the crew. Equipped for drilling operations in water depths up to 6,000 feet, a drilling depth of 20,000 feet and a 400 tonne lifting capacity, the tender barge is currently deployed in the Gulf of Thailand for the Bongkot Program. Following the successful delivery of ‘EDrill-1’, we delivered the second self-erecting drilling tender barge, ‘EDrill-2’ in November. ‘EDrill-2’ measures 99.97 metres LOA, 29.87 metres in breadth and 11.35 metres in depth and can accommodate a crew of 170, similar to the specifications of ‘EDrill-1’. We delivered in March a deepwater specialised pipelay heavy lift vessel, ‘SapuraKencana 1200’, to Malaysian owner, TL Offshore Bhd. This was the first of two pipelay heavy lift vessels delivered by COSCO Nantong Shipyard in 2014. The second, named ‘SapuraKencana 3500’ was delivered in May. These pipelay heavy lift vessels are designed to carry out multiple functions, including oil pipe processing, laying, installation and heavy lifting. The ABS-classed vessel is capable of working in shallow water of up to 200 metres with a ten-point mooring system and is also equipped with a DP3 dynamic positioning system, which enables it to carry out heavylifting installation of large scale offshore structures such as platform blocks, modules and jackets, as well as S-type pipe laying operations in depths of up to 1,500 metres. In December, we delivered our first offshore platform supply vessel, ‘Chauvin Tide’, to US-based international petroleum service company, Tidewater Inc. The vessel adopts the Rolls-Royce UT 771 CDL design and measures 83.75 metres LOA, and 18 metres in breadth. With a loading capacity of 3,800 tonnes, it is able to accommodate a crew of 46. Annual Report 2014 25 Operations and Financial Review SHIP REPAIR, SHIP BUILDING AND MARINE ENGINEERING Types of Vessels Repaired in FY2014 by Number of Vessels Shipyard Revenue in FY2014 by Type of Job Ship Repair 10% Others 12% Ship Building 13% Containers Ships 13% Ship Conversion 4% FY2014 Chemical Ships 8% Tankers 10% Bulk Carriers 57% FY2014 Marine Engineering 73% New Orders As at 31 December 2014, COSCO secured a total order book of US$8.4 billion, with progressive deliveries up till 2017. New orders in 2014 included 9 bulk carriers, 8 platform supply vessels, 4 emergency response/ rescue/field support vessels, 4 sub-sea supply vessels, 3 livestock carriers, 1 jack-up rig, 1 accommodation barge, 1 floating accommodation unit and 1 module carrier. Super 116E class design. The state-of-the-art rig, scheduled for delivery in the third quarter of 2016, will be built to ABS classification, with notation A1. The rig will be a self-elevating drilling unit capable of drilling high pressure, high temperature (HPHT) wells. It is capable of drilling up to 30,000 feet, and operates in depths of up to 350 feet, with accommodation for 120. The rig will be equipped for efficient operation and lay-out, and built to optimise safety, deck space and material handling. In August, we entered into a US$470 million EPCI contract with Denmark’s Maersk Supply Service (MSS) to construct 4 sub-sea supply vessels. This contract entails engineering, procurement, installation, construction and commissioning works of the vessels and marks the first time MSS placed newbuild orders with a Chinese shipyard. The vessels will measure 137 metres LOA, 27 metres in breadth and 11 metres in depth and will be equipped with an electric propulsion system, a DP3 dynamic positioning system, dynamically compensated deepwater cranes, underwater robots and heli-decks. They are designed to carry out sub-sea cable laying, well installation and maintenance work. The vessels are rated for operations in depths of up to 3,000 metres. Delivery of the first vessel is expected in the fourth quarter of 2016. To broaden our engineering experience, we secured orders from an Asian company in April for 4 Emergency Response/Rescue/Field Support Vessels (ERRVs). Scheduled for delivery progressively in the first half of 2016, the vessels in the new series are designed to provide emergency response assistance and other services for offshore oil field facilities. They will adopt the conventional double engine/propeller propulsion system and measure 62 metres in length, 15.5 metres in breadth and 6 metres in depth, and will be equipped with a bow thruster and a retractable thruster. We secured a US$184 million contract in May with Derwent Ocean Limited S.A, part of Foresight Group, to build one jack-up drilling rig based on the LeTourneau 26 COSCO Corporation (Singapore) Limited In July, we also entered into a contract with a European owner to build one DP3 accommodation barge scheduled for delivery in the third quarter of 2016. With only a limited number of such units in operation or under construction, the mid-range offshore accommodation unit is currently in demand in West Africa and the Middle East market. Operations and Financial Review DRY BULK SHIPPING AND OTHERS Over the year in review, we secured repeat orders for 8 platform supply vessels. This comes on the back of orders for 10 similar vessels secured a year before. Likewise, following the successful delivery of two livestock carriers in 2013, and another two in 2014, COSCO secured an order valued at about US$57 million from a European buyer to build two more livestock carriers scheduled for delivery in the second half of 2015. Dry Bulk Shipping and Others COSCO has an established presence in the dry bulk shipping business. Currently comprising a fleet of 10 dry bulk carriers with a total carrying capacity of 550,900 DWT, our ships ply global trading routes, transporting cargo such as iron ore, coal, steel, cement and fertiliser to major ports worldwide. These dry bulk carriers are chartered out to other ship owners and operators, and serve our large client base of shipping companies from Germany, Norway, Denmark, Greece, Switzerland, UK, USA and others. Over the year under review, our dry bulk shipping and other businesses decreased marginally by 5.6% in turnover from $55.6 million in 2013 to S$52.5 million in 2014. This was due to lower short-term charter rates compared to the prior year. As a percentage of Group turnover, this segment comprised 1.2%. We remain aware of the persistent global glut in the dry bulk carrier fleet, and note that any rebound in the BDI may be short-lived or subdued as expansion in the global bulk carrier fleet continues to outpace demand. This surplus fleet capacity may impact our dry bulk shipping business as well as our bulk carrier shipbuilding operations. Against this challenging environment and lacklustre global economic conditions, we maintain a cautious outlook. Going forward, we will have to remain agile and leverage on our strengths and competitive advantages. The Baltic Dry Index (BDI), a key measure of shipping costs for commodities, averaged 1,105 points over the year in review, a decrease of 8.4%, year-on-year. The Baltic Exchange Handysize Index (BHSI) averaged 524 points, a decrease of 6.8% over the year. Meanwhile, the Baltic Exchange Supramax Index (BSI) averaged 939 points, which was a 4.5% decrease compared with 2013. Currently, the Group’s dry bulk shipping fleet comprises Panamax and Handymax carriers. Annual Report 2014 27 Operations and Financial Review GROUP Financial Review OVERVIEW The Group achieved net profit attributable to equity holders of $20.9 million on turnover of $4.3 billion in 2014. Turnover from dry bulk shipping and other businesses decreased marginally by 5.6% from $55.6 million in 2013 to $52.5 million in 2014. TURNOVER Group turnover increased 21.5% to $4.3 billion in 2014 from $3.5 billion in 2013 owing to an increase in shipyard revenue. The BDI started the year 2014 at 2,113 points and ended the year at 782 points. The BDI averaged 1,105 points for 2014, which was a 8.4% decrease from the average of 2013 of 1,206 points. Currently, the group’s dry bulk shipping fleet comprises Panamax and Handymax carriers. Turnover from shipyard operations increased by 21.9% to $4.2 billion in 2014 from $3.5 billion in 2013, owing mainly to growth in revenue from marine engineering and ship building segments. Shipyard business remained the biggest revenue contributor, forming 98.8% of Group turnover in 2014. The Group delivered 8 bulk carriers in 2014. Of these, COSCO Dalian Shipyard delivered 4 bulk carriers, while COSCO Zhoushan and COSCO Guangdong Shipyard delivered 2 bulk carriers each. In addition, COSCO Guangdong Shipyard delivered 2 livestock carriers, 2 tender barges and 1 platform supply vessel, COSCO Nantong Shipyard delivered 2 pipelay heavy lift vessels, 1 wind turbine installation vessel, 1 tender rig and 1 jack-up rig, and COSCO Zhoushan Shipyard delivered 1 float-over launch barge and 1 stinger barge. 28 COSCO Corporation (Singapore) Limited PROFITABILITY Gross profit decreased 9.4% from $321.2 million in 2013 to $291.0 million in 2014 mainly due to higher inventory write-downs. On 9 January 2015, the Group announced that the management of COSCO Nantong decided to discontinue the Octabuoy hull and topside module project with ATP Oil and Gas (UK) Limited, a company in voluntary arrangement (CVA) in the United Kingdom. This resulted in a one-off charge of S$91.4 million in 2014. Operations and Financial Review Other income and other gains and losses comprised gain from the disposal of scrap metal, interest income, net currency exchange gain/(loss) and others. Compared to 2013, other income and other gains and losses increased marginally by 1.7% to $112.0 million in 2014 mainly due to an exchange gain of $6.7 million (2013: exchange loss of $18.9 million) and partially offset by lower government grants and compensation received from customers. Interest expense increased by 15.2% to $127.7 million in 2014 due to higher bank borrowings deployed to fund shipyard operations. The tax credit of $9.0 million in 2014 is mainly due to tax incentives available to certain subsidiaries in the People’s Republic of China (PRC), recognition of previously unrecognised deferred tax assets in the current financial year and the adjustment for over provision of tax in respect of prior years. Net profit attributable to equity holders of the Company decreased 31.8% from $30.6 million in 2013 to $20.9 million in 2014. BALANCE SHEET AND CASH FLOW (31 December 2014 vs 31 December 2013) Cash and cash equivalents decreased from $2.0 billion to $1.6 billion mainly due to cash used in operating activities. Trade and other receivables increased $1.6 billion to $4.6 billion mainly due to higher construction contracts due from customers in the marine engineering segment, partially offset by a decrease in advances paid to suppliers (from $595.6 million to $494.7 million). SHARE CAPITAL COSCO’s share capital remained unchanged at $270.6 million. There was no new issue and allotment of shares under the COSCO Group Employees’ Share Option Scheme 2002. EQUITY Shareholder’s equity increased marginally by $32.0 million mainly due to the profits earned in 2014 and an increase in currency translation reserve, partially offset by the payment of dividends in May 2014. GEARING Total bank borrowings increased from $3.8 billion to $5.0 billion due to additional funding procured for business operations. The Group had a gearing ratio (net of cash) of 2.5 at the end of 2014. EARNINGS PER SHARE On a fully diluted basis, net earnings per share decreased from 1.4 cents in 2013 to 0.9 cent in 2014. DIVIDENDS PER SHARE The Board of Directors has proposed a first and final tax exempt one-tier dividend of 0.5 cent. The dividend payout will amount to $11.2 million (2013: $22.4 million) while dividend cover was 1.9. NET ASSET VALUE PER SHARE The net asset value per share of COSCO Corporation increased by 2.3% from 59.7 cents per share at 31 December 2013 to 61.1 cents per share at 31 December 2014. Trade and other payables decreased $63.7 million to $2.6 billion mainly due to a decrease in advances received from customers (from $558.8 million to $364.9 million), partially offset by higher accruals for operating expenses. Total borrowings increased by $1.2 billion to $5.0 billion due to additional funding procured to finance shipyard operations. Annual Report 2014 29 With improving marine engineering and ship building expertise, coupled with modern shipyards and astute management, we seek to offer more value-add in all we do. COSCO Qidong Offshore Corporate Governance and Transparency Corporate Governance COSCO Corporation (Singapore) Limited (“COSCO Corporation” or the “Company”) and its subsidiaries (together, the “Group”) believe that good corporate governance is essential to facilitate effective, entrepreneurial and prudent management that can deliver the long-term success of the Company. The Board of Directors (the “Board”), guided by the Singapore Code of Corporate Governance 2012 (the “CG Code 2012”) issued by the Monetary Authority of Singapore (the “MAS”), remains committed to the principles and guidelines stated therein to achieve high standards of business integrity, ethics and professionalism across all its activities. The Company complies with all key principles and guidelines set out in the CG Code 2012. A. BOARD MATTERS THE BOARD’S CONDUCT OF AFFAIRS Principle 1 Governance is overseen by the Board together with Management, who is led by the Group President and accountable to the Board. All directors make decisions objectively in the best interests of the Company and have exercised due diligence and independent judgment in so doing. The principal functions of the Board apart from its statutory responsibilities are: a) to provide entrepreneurial leadership; approve the strategic objectives, corporate policies and authorisation matrix of the Company; and ensure that the necessary financial and human resources are in place for the Company to meet its objectives; b) to approve the nominations to the Board and appointment of key management, as may be recommended by the Nominating Committee; c) to oversee the processes for risk management, financial reporting and compliance and evaluate the adequacy of internal controls; approve annual budget, key operational matters, major acquisition and divestment proposals, major funding proposals of the Company; d) to assume responsibility for corporate governance framework of the Company and establish a framework of prudent and effective controls which enables risks to be assessed and managed, including safeguarding of shareholders’ interests and the Company’s assets; e) to review management performance; f) to identify the key stakeholder groups and recognise that their perceptions affect the Company’s reputation; g) to set values and standards (including ethical standards) of the Company and ensure that obligations to shareholders and others are understood and met; and h) to promote corporate social responsibilities throughout the Group and include environmental and social factors as part of its strategic formulation. 32 COSCO Corporation (Singapore) Limited Corporate Governance and Transparency The Board has delegated certain functions to the established Board Committees, namely Strategic Development, Enterprise Risk Management, Audit, Nominating and Remuneration Committees, save for the following matters which are reserved for the Board’s decision: l the recommendations of the Strategic Development Committee; l the Group’s long term objectives and commercial strategy; l the making of any decision to cease to operate all or any material part of the business of the Group or to extend the Group’s activities into new business; l the consideration of any proposal to merge or amalgamate the Company with any other company; l the approval of any acquisition of any investment, asset or business by the Company or any of its subsidiaries which would involve the commencement of an activity of a substantially different nature or character to any activity from time to time carried on by the Company or any of its subsidiaries; l the approval of any changes relating to the Group’s capital structure including changing the amount or currency of the Company’s share capital, reduction of capital, share issues (except under employee share options plan); l the approval of risk management policy for the Company and its subsidiaries; l the approval of the Company’s quarterly results, audited financial statements and other appropriate statements for inclusion in the Company’s Annual Report as well as the issue of Annual Report; l the recommendation of the payment of any dividend by the Company or any exercise of the powers of the Board in relation to reserves or capitalisation of profit; l appointment or removal of director from the Board (with recommendation made by the Nominating Committee) and the appointment or removal of the Company Secretary; l make changes to the structure and size of the Board, following receipt of recommendation from the Nominating Committee; l in the case of any conflict of interest which the Board, after being appropriately advised, considers to be material, as to whether such conflict should be authorised and, if so, authorise such conflict upon such terms and conditions as the Board considers appropriate; l determining the remuneration packages for senior executives of the Company (following receipt of recommendation by the Remuneration Committee); l reviewing the performance of the Board annually; and l any matter required to be considered or approved by the Board as a matter of law or regulation. During the financial year, the Board had met five (5) times to discharge its duties and had on various occasions used circular resolutions in writing to sanction certain decisions. Day to day management of the Group has been delegated to the Group President and Executive Directors. Annual Report 2014 33 Corporate Governance and Transparency Corporate Governance The attendance of the Directors at meetings of the Board and Board Committees for financial year ended 31 December 2014 is set out in the table below: Type of Meetings Committee Name Li Yun Peng Liang Yan Feng1 Wu Zi Heng Liu Lian An Wang Yu Hang2 Wang Hai Min3 Ma Zhi Hong Tom Yee Lat Shing Wang Kai Yuen Er Kwong Wah Ang Swee Tian Ma Hong Han (Alternate to Ma Zhi Hong) Li Man (Alternate to Li Yun Peng) Ouyang Chao Mei4 (Alternate to Wang Yu Hang) Ouyang Chao Mei5 (Alternate to Liang Yan Feng) Enterprise Risk Strategic Nominating Remuneration Management Development No. of No. of No. of No. of Meeting Meetings Meeting Meeting held: 1 held: 4 held: 1 held: 1 No. of No. of No. of No. of Meeting Meetings Meeting Meeting Attended Attended Attended Attended Board No. of Meetings held: 5 No. of Meetings Attended Audit No. of Meetings held: 5 No. of Meetings Attended 3 2 5 5 2 2 4 5 5 5 5 NA NA NA NA NA NA NA 5 5 5 5 NA NA 1 NA NA NA NA 1 1 1 1 NA NA 1 NA NA NA NA 1 1 1 1 NA 2 3 4 2 NA NA 4 4 4 4 1 NA 1 NA NA NA NA 1 1 1 1 4 NA NA NA 4 NA 5 NA NA NA NA NA 3 NA NA NA 2 NA 2 NA NA NA 2 NA Notes: 1 Mr Liang Yan Feng was appointed as Non-Independent and Non-Executive Director and a member of the Enterprise Risk Management Committee on 8 July 2014. 2 Mr Wang Yu Hang resigned as Non-Independent and Non-Executive Director and a member of the Enterprise Risk Management Committee on 8 July 2014. 3 Mr Wang Hai Min resigned as Non-Independent and Non-Executive Director on 8 July 2014. 4 5 Mr Ouyang Chao Mei ceased to be Alternate Director to Mr Wang Yu Hang on 8 July 2014. Mr Ouyang Chao Mei was appointed as Alternate Director to Mr Liang Yan Feng on 8 July 2014. NA - Not Applicable For effective planning, the schedule of all Board and Board Committee meetings for the next calendar year is always planned in advance. A special Board meeting will be conducted for special project whenever it is required. The Company’s Articles of Association (the “Articles”) allow Board meetings to be conducted by way of telephone and video conferencing. 34 COSCO Corporation (Singapore) Limited Corporate Governance and Transparency BOARD COMPOSITION AND GUIDANCE Principle 2 The Board has nine (9) members: two (2) Executive Directors, three (3) Non-Executive Directors and four (4) NonExecutive Independent Directors. No individual or group of individuals dominates the Board’s decision-making. Collectively, the Non-Executive Directors and Non-Executive Independent Directors bring a wide range of experience and expertise as they all currently occupy or have occupied senior positions in industry and public life, and as such, each contributes significant weight to Board decisions. None of the Non-Executive Independent Directors has any relationship with the Company, its related companies or its officers that could interfere, or be reasonably perceived to interfere, with the exercise of the director’s independent business judgment with a view to the best interests of the Company. The Board believes that there is a strong and independent element on the Board and allows the Board to exercise objective judgment on corporate affairs independently from Management and 10% shareholders. It is also noted that the independent directors must make up at least half of the Board where the Chairman is not an independent director pursuant to Guideline 2.2 of the CG Code 2012. However, this requirement is not applicable to the Company until its financial year commencing 1 January 2017. The Board of COSCO Corporation comprises the following members: Li Yun Peng Wu Zi Heng Liu Lian An Liang Yan Feng Ma Zhi Hong Tom Yee Lat Shing Wang Kai Yuen Er Kwong Wah Ang Swee Tian Chairman and Non-Independent and Non-Executive Director Vice Chairman, President and Non-Independent Executive Director Non-Independent and Executive Director Non-Independent and Non-Executive Director Non-Independent and Non-Executive Director Non-Executive Lead Independent Director Non-Executive Independent Director Non-Executive Independent Director Non-Executive Independent Director The Directors’ profiles are set out on pages 52 to 56 of this Annual Report. Board assesses the effectiveness of the Board as a whole and the contribution by each Director to the effectiveness of the Board annually. It is of the view that the current size of the Board is appropriate and will facilitate effective decision making. The Board, collectively, possess an appropriate balance and diversity of skills, experience and knowledge of the Company, which provide core competencies such as accounting or finance, business or management experience, industry knowledge, strategic planning experience and customer-based experience and knowledge. Rigorous reviews have been carried out by the Board to assess the independent status of Mr Tom Yee Lat Shing (who was appointed on 16 November 1993), Dr Wang Kai Yuen (who was appointed on 2 May 2001) and Mr Er Kwong Wah (who was appointed on 20 December 2002), who have served on the Board beyond nine years. All of them are considered independent in accordance with the Guideline 2.3 of the CG Code 2012. The Board will continue reviewing the size and composition of the Board and the independent status of its directors on an ongoing basis. Directors are provided with regular updates on relevant new laws and regulations, and evolving commercial risks and business conditions from the Company’s relevant advisors. Newly appointed directors would receive a formal letter setting out the director’s duties and obligations and receive comprehensive and tailored induction and training in areas such as accounting, legal and industry-specific knowledge on joining the Board. Annual visits are arranged for NonExecutive Independent Directors to acquaint them with important operations overseas. STRATEGIC DEVELOPMENT COMMITTEE The Strategic Development Committee (“SDC”) comprises the following directors, majority of whom is independent directors: Wu Zi Heng (Chairman) Li Yun Peng Tom Yee Lat Shing Wang Kai Yuen Er Kwong Wah Ang Swee Tian Non-Independent Executive Non-Independent and Non-Executive Non-Executive Lead Independent Non-Executive Independent Non-Executive Independent Non-Executive Independent Annual Report 2014 35 Corporate Governance and Transparency Corporate Governance The Board acknowledges the importance of strategic planning and development. SDC assists the Board in fulfilling its responsibilities for developing, evaluating and monitoring the Company’s long and short-term strategic goals. The SDC operates at the Board level but does not assume the Board’s governance accountability or to make final strategic decisions. The SDC acts solely to address and develop current and future strategy-related issues. It has the responsibility for creating and driving the Company’s strategy development and planning and Management takes responsibility for implementing the Company’s strategies after the SDC received approval from the Board. The SDC held one meeting during the financial year. The SDC has the following authority and responsibilities: a) Review and develop Company Strategies: Meet with Management periodically to review, develop and evaluate the Company’s evaluation and implementation of its business strategy; b) Provide Resource Support: Support the Board or Management in the evaluation and/or refining of the Company’s strategic plans; c) Assess Progress: Review and assess the status of implementation of the Company’s business strategy and whether the results are consistent with the goals of the strategic plan as adopted by the Board; and d) Recommend Improvements: Recommend areas of improvement and provide feedback to the Board and Management regarding the overall success of the business strategy. CHAIRMAN AND CHIEF EXECUTIVE OFFICER Principle 3 Mr Li Yun Peng and Capt Wu Zi Heng, who are not related to each other, are respectively the Chairman of the Board and the President of the Company. The roles of the Chairman and the President undertaken by separate persons will create a clear division of responsibilities and maintain an effective oversight. The Chairman is responsible for the workings of the Board, ensuring the integrity and effectiveness of its governance process. In his absence, his appointed alternate would act on his behalf. The President is the most senior executive in the Company and has full executive responsibilities over the business directions and operational decisions of the Group. He works closely with the Board to implement the policies set by the Board to realise the Group’s vision. BOARD MEMBERSHIP Principle 4 Recommendations for nominations of new directors and retirement of directors are made by the Nominating Committee (“NC”) and considered by the Board as a whole. The NC reviews and assesses candidates for directorship before making recommendations to the Board. The NC takes into consideration the skills and experience required and the existing composition of the Board and strives to ensure that the Board has an appropriate balance of independent directors as well as directors with the right profile of expertise, skills, attributes and abilities when recommending new directors to the Board. The process for the appointment of new directors begins with the NC, together with the Chairman and President cum Vice Chairman of the Company, conducting a needs analysis and identifying the critical requirement in terms of expertise and skills that are needed in the context of the strengths and weaknesses of the existing Board. When a candidate has been endorsed by the NC, the NC will then make a recommendation to the Board for the approval of his appointment. 36 COSCO Corporation (Singapore) Limited Corporate Governance and Transparency The NC assesses and recommends to the Board whether retiring directors are suitable for re-nomination for reelection. In evaluating a director’s contribution and performance for the purpose of re-nomination, the NC takes into consideration a variety of factors such as attendance, preparedness, participation and candour. In accordance with the provisions of the Articles, one-third of the Directors retire by rotation and subject themselves to re-election at every Annual General Meeting (“AGM”) of the Company. In addition, new directors who were appointed by the Board during the year will hold office only until the next AGM and will be eligible for re-election. The dates of initial appointment and last re-election/re-appointment of each of the Directors of the current Board are set out below: Date of Initial Appointment Director Position Li Yun Peng Wu Zi Heng Liu Lian An Liang Yan Feng Ma Zhi Hong Tom Yee Lat Shing Wang Kai Yuen Er Kwong Wah Ang Swee Tian Ma Hong Han Li Man Ouyang Chao Mei Chairman and Non-Independent and Non-Executive Vice Chairman, President and Non-Independent Executive Non-Independent and Executive Non-Independent and Non-Executive Non-Independent and Non-Executive Non-Executive Lead Independent Non-Executive Independent Non-Executive Independent Non-Executive Independent Alternate to Ma Zhi Hong Alternate to Li Yun Peng Alternate to Liang Yan Feng 30.9.2013 5.11.2011 20.2.2012 8.7.2014 2.8.2010 16.11.1993 2.5.2001 20.12.2002 13.11.2007 2.10.2012 30.9.2013 8.7.2014 Date of Last Re-election / Re-appointment 23.4.2014 23.4.2014 20.4.2012 NA 22.4.2013 23.4.2014 23.4.2014 20.4.2012 22.4.2013 NA NA NA Note: NA - Not Applicable NOMINATING COMMITTEE The NC comprises five Directors, majority of whom including the Chairman is independent. The NC members are as follows: Wang Kai Yuen (Chairman) Wu Zi Heng Tom Yee Lat Shing Er Kwong Wah Ang Swee Tian Non-Executive Independent Non-Independent Executive Non-Executive Lead Independent Non-Executive Independent Non-Executive Independent The principal functions of the NC are to: a) identify, review and recommend candidates for appointment as Directors of the Company and appointment to the Board committees as well as to senior management positions in the Company; b) assess the qualifications of the proposed alternate directors to the Board; c) evaluate the effectiveness of the Board as a whole and assess the contribution by each Director, to the effectiveness of the Board; d) determine annually whether or not a Director is independent; e) make recommendations to the Board on re-appointment of Board and Board committee members; and f) the review of training and professional development programs for the Board. Annual Report 2014 37 Corporate Governance and Transparency Corporate Governance During the financial year, the NC held one (1) meeting and had on various occasions used circular resolutions in writing to resolve certain decisions which are then recommended to the Board. The NC had reviewed the nominations for the appointments of those directors that were appointed during the financial year for recommendation to the Board to approve the appointments. In arriving at their decisions on the new appointments, the NC took into consideration the incumbents’ academic qualifications, experience, their individual field of expertise and their potential contributions to the effectiveness of the Board. The NC also met and determined the independence of the Directors is in line with the undertakings described in the CG Code 2012. It also reviewed the composition of the Board and the Board Committees in relation to the needs of the Group. The NC is of the opinion that the Board is able to exercise objective judgment on corporate affairs independently and no individual or small group of individuals dominates the Board’s decision making process. The NC assesses and recommends to the Board whether retiring Directors are suitable for re-election. During the financial year under review, the NC has ascertained that all Directors, including those who have multiple board representations, have devoted sufficient time and attention to the Group’s affairs and have discharged their duties and responsibilities adequately. As time requirements of each director are subjective, the NC has decided not to fix a maximum limit on the number of directorships a director can hold. The NC considers that the multiple board representations held presently by its Directors do not impede their respective performance in carrying out their duties to the Company. The list of current directorships in other listed companies and/or other principal commitments held by the respective Directors are set out on page 57 of this Annual Report. One of the duties of the NC is to assess the qualifications of the appointed alternate directors to the Board. The Alternate Directors of the current Board are: Ma Hong Han Li Man Ouyang Chao Mei Alternate to Ma Zhi Hong Alternate to Li Yun Peng Alternate to Liang Yan Feng All appointed Alternate Directors are based in Singapore and are familiar with the Group’s affairs and qualified to bear all the duties and responsibilities of their respective principal directors, who are principally based in the People’s Republic of China. Mr Tom Yee Lat Shing, who is over the age of 70 years, will have to retire at the forthcoming Annual General Meeting pursuant to Section 153(6) of the Companies Act, Cap. 50. The assessment of Mr Tom Yee Lat Shing’s re-appointment and his independence were given particular consideration by the NC as he has now served on the Board for more than 20 years. The NC believes that due to his strength of character, experience and knowledge, Mr Tom Yee Lat Shing continues to be highly effective as a non-executive lead independent director. He provides objective and rigorous challenges to, and engages in constructive debate with, the Board and the committees on which he sits. Mr Tom Yee Lat Shing also brings a wealth of useful and relevant experience both in his position as a non-executive lead independent director and as the Chairman of the Audit Committee. Accordingly, the NC has recommended and the Board has endorsed the re-appointment of Mr Tom Yee Lat Shing by shareholders at the forthcoming AGM. The NC has also recommended that the following directors be nominated for re-election at the forthcoming AGM: a) Mr Liang Yan Feng pursuant to Article 104; b) Mr Liu Lian An pursuant to Article 98; and c) Mr Er Kwong Wah pursuant to Article 98. In making the recommendation, the NC has considered the directors’ overall contributions and performance. The Board recommends the shareholders to approve the re-election of the said directors. The details of the proposed resolutions are stipulated in the Notice of AGM. 38 COSCO Corporation (Singapore) Limited Corporate Governance and Transparency BOARD PERFORMANCE Principle 5 A formal assessment process is in place to assess the effectiveness of the Board as a whole and the contribution by each Director to the effectiveness of the Board. The NC uses objective and appropriate quantitative and qualitative criteria to assess the performance of the Board as a whole and the contribution of each Director to the effectiveness of the Board. Assessment parameters include evaluation of the Board’s access to information, risk management, accountability, the Board’s performance in relation to discharging its principal functions, communication with management and stakeholders, the business performance of the Company, the quality of Board processes, the attendance records of the Directors at Board and Committee meetings and the level of participation at such meetings. The evaluation of the Board is conducted annually. As part of the process, the Directors will complete appraisal forms which are collated by the Company Secretary. The Company Secretary will then review the results of the appraisal and present the results to the Chairman of the NC who will then present a report to the Board. An individual assessment of each Director is also undertaken annually. The process of the assessment is through selfassessment where each Director will complete appraisal forms which are collated by the Company Secretary. The Company Secretary consolidates the appraisal forms and presents the results to the Chairman of the NC who will then present a report to the Board. ACCESS TO INFORMATION Principle 6 The Board is provided with relevant management information regularly to help them carry out their responsibilities effectively. In addition, all relevant information on material events and transactions are circulated to Directors as and when they arise. All Board members have separate and independent access to the advice and services of the Company Secretary. The Company Secretary attends all Board and Board committees meetings during the financial year. He is responsible for ensuring that Board procedures are followed and that applicable rules and regulations such as the SGX-ST Listing Manual (“Listing Manual”), Companies Act (Chapter 50), Securities and Futures Act (Chapter 289) and the Articles of the Company and all governance matters are complied with. The appointment and the removal of the Company Secretary are subject to the Board’s approval. All Board members also have separate and independent access to the senior management of the Company and the Group. Board members are aware that they, whether as a group or individually, in the furtherance of their duties, can take independent professional advice, if necessary, at the Company’s expense. Annual Report 2014 39 Corporate Governance and Transparency Corporate Governance B. REMUNERATION MATTERS PROCEDURES FOR DEVELOPING REMUNERATION POLICIES Principle 7 REMUNERATION COMMITTEE The Remuneration Committee (“RC”) comprises five Directors, majority of whom including the Chairman is independent. The RC members are as follows: Er Kwong Wah (Chairman) Wu Zi Heng Tom Yee Lat Shing Wang Kai Yuen Ang Swee Tian Non-Executive Independent Non-Independent Executive Non-Executive Lead Independent Non-Executive Independent Non-Executive Independent The principal functions of the RC are to: a) recommend to the Board base salary level, benefits and incentive programmes, and identify components of salary which can best be used to focus management staff on achieving corporate objectives; b) approve the structure of compensation programme (including but not limited to Directors’ fees, salaries, allowances, bonuses, options, share-based incentives & awards and benefits in kind) for the Directors and senior management to ensure that the programme is competitive and sufficient to attract, retain and motivate senior management of the required quality to run the Company successfully; c) review, on annual basis, the compensation package of the Company’s Directors and senior management personnel and determine appropriate adjustments; and d) review the Company’s obligations arising in the event of termination of EDs and key management personnel contracts of service to ensure that such contracts of service contain fair and reasonable termination clauses which are not overly generous; e) administer the COSCO Group Employees’ Share Option Scheme 2002. The RC meets to discuss the performance assessment of the Executive Directors as well as to discuss the level of emoluments to pay. The recommendations for approval of the remuneration of the Executive Directors are forwarded to the Board. The RC also reviews and approves the remuneration of senior management. Directors’ fees are recommended by the RC and are submitted for endorsement by the Board. Directors’ fees are subjected to approval by shareholders at the AGM. LEVEL AND MIX OF REMUNERATION Principle 8 In reviewing the remuneration packages of the Executive Directors, the RC takes into account the respective performance of the Group and the individual. In its deliberation, the RC takes into consideration, remuneration packages and employment conditions within the industry and benchmarked against comparable companies. The RC ensures the level and structure of remuneration of the key management personnel aligned with the long-term interest and risk policies of the Company as well as attract, retain and motivate them to provide good stewardship and management the operations to meet the desire objective of the Company. 40 COSCO Corporation (Singapore) Limited Corporate Governance and Transparency Non-Executive Independent Directors are paid a basic fee for their responsibilities as Independent Directors and servicing various committees. Such fees are approved by the shareholders of the Company as a lump sum payment at the AGM. The Company currently adopts a remuneration policy for staff consisting of a fixed component and a variable component. The fixed component is in the form of a base/fixed salary. The variable component is in the form of a variable bonus that is linked to the Company and individual performance. Another element of the variable component is the grant of share options under the COSCO Group Employees’ Share Option Scheme 2002 which was expired on 8 May 2012 . Information on the COSCO Group Employees’ Share Option Scheme 2002 such as size of grants, exercise price of options that were granted as well as outstanding and vesting period of options are set out on pages 75 and 76 of the Annual Report. During the financial year, the RC held one (1) meeting. The issues deliberated at the meeting and through the circular resolutions in writing included reviewing the termination of options granted, extension of exercise period of options granted, the bonus payments to key management personnel and the compensation programme for the Directors and key management personnel. DISCLOSURE ON REMUNERATION Principle 9 DIRECTORS’ AND KEY MANAGEMENT PERSONNEL REMUNERATION The Directors’ and the top three key management personnel’s remuneration table for the financial year ended 31 December 2014 is as follows: Bonus (%) Other Benefits (%) Total (%) 31 31 24 20 100 100 Non-Independent and Non-Executive Directors in the Band of below S$500,000 Wang Yu Hang *(1) 34 56 34 56 Liang Yan Feng *(2) Ma Zhi Hong * 34 56 Ouyang Chao Mei * 32 50 10 10 10 18 100 100 100 100 Fees (%) Salary (%) Non-Independent Executive Directors in the Band of below S$500,000 Wu Zi Heng 45 Liu Lian An 49 Independent Directors in the Band of below S$500,000 Tom Yee Lat Shing 100 Wang Kai Yuen 100 Er Kwong Wah 100 Ang Swee Tian 100 100 100 100 100 Note: * The salary, bonus and other benefits of the incumbent directors are paid by the subsidiaries. Mr Wang Yu Hang resigned as Non-Independent and Non-Executive Director on 8 July 2014. Mr Liang Yan Feng was appointed as Non-Independent and Non-Executive Director on 8 July 2014. (1) (2) Annual Report 2014 41 Corporate Governance and Transparency Corporate Governance Fees (%) Executives in the Band of below S$500,000 Ma Hong Han Li Man Wong Meng Yun Salary (%) Bonus (%) Other Benefits (%) Total (%) 46 46 55 31 31 33 23 23 12 100 100 100 The Company does not disclose the remuneration of each individual director to the nearest thousand dollars and the aggregate remuneration of the top three key management personnel in accordance with the Principle 9.2 and 9.3 of the 2012 CG Code respectively, as the Board of Directors believes that it is not in the best interest of the Company to fully disclose such information given the highly competitive industry conditions for ship building and offshore marine engineering sectors particularly in the Peoples’ Republic of China. None of the employees of the Company and its subsidiary companies was an immediate family member of a Director and whose remuneration exceeded S$50,000 during the financial year ended 31 December 2014. EXECUTIVES’ REMUNERATION The Company adopts a remuneration strategy that supports a pay-for-performance philosophy. The Company has key performance indicator to link with Company’s performance and shareholders’ returns. Executives participate in an annual performance review process that assesses the individual’s performance and contributions. The remuneration structure for the President and other key management personnel consists of the following components: l SALARY Fixed pay comprises basic salary and the Company’s contribution towards the Singapore Central Provident Fund where applicable. l BONUS Bonus is paid based on the Company’s and individual’s performance. l OTHER BENEFITS Other benefits comprise of usage of Company’s car and other benefits-in-kind. l STOCK OPTION The COSCO Group Employees’ Share Option Scheme 2002, approved by members of the Company on 8 May 2002, had expired on 8 May 2012. The share options have been granted to align the president and key management’s interest with that of shareholders. The options granted to them are made reference to the desired remuneration structure target and valued based on the Binomial Valuation Model. Details of the share option scheme can be found in the “Directors’ Report” section of the Annual Report. 42 COSCO Corporation (Singapore) Limited Corporate Governance and Transparency C. ACCOUNTABILITY AND AUDIT ACCOUNTABILITY Principle 10 The Board has overall responsibility to shareholders for ensuring that the Group is well managed and guided by its strategic objectives. In presenting the Group’s annual and quarterly financial results to shareholders, the Board aims to provide shareholders with a balanced and understandable assessment of the Group’s performance, position and prospects. Management provides the Board with management accounts and other financial statements on a monthly basis or as and when required by the Board. The Board takes adequate steps to ensure compliance with legislative and regulatory requirements, including requirements under the listing rules of the securities exchange. RISK MANAGEMENT AND INTERNAL CONTROLS Principle 11 The Group maintains a robust and effective system of internal controls, addressing financial, operational, compliance and information technology controls, and risk management systems, for all companies within the Group, but recognises that no internal control system will preclude all errors and irregularities. The system is designed to manage rather than to eliminate the risk of failure to achieve business objectives. The controls are to provide reasonable, but not absolute, assurance to safeguard shareholders’ investments and the Group’s assets. The Board is responsible for the governance of risk. The Board should ensure that Management maintains sound system of risk management and internal controls to safeguard shareholders’ interests and the Company’s assets, and should determine the nature and extent of significant risks which the Board is willing to take in achieving its strategic objectives. The Group’s key internal controls include: a) establishment of risk management policies and systems; b) establishment of policies and approval limits for key financial and operational matters, and issues reserved for the Board; c) documentation of key processes and procedures; d) segregation of incompatible functions which give rise to a risk of errors or irregularities not being promptly detected; e) maintenance of proper accounting records; f) safeguarding of assets; g) ensuring compliance with appropriate legislation and regulations; and h) engaging qualified and experience persons to take charge of important functions. Operational risk management measures implemented by the Group include the implementation of safety, security and internal control measures and taking up appropriate insurance coverage. Details of the Group’s financial risk management measures are outlined on pages 133 to 140 in the Notes to the Financial Statements. Annual Report 2014 43 Corporate Governance and Transparency Corporate Governance In the course of the year, the AC and the Enterprise Risk Management Committee have reviewed, together with management and the internal and external auditors, the major business risks and effectiveness of the Group’s internal controls, including controls for managing financial, operational, compliance and information technology controls and risk management systems. Internal control standards are set with the objective of providing reasonable assurance that risks are effectively managed by the Group. The Board has also received assurance from the President and Chief Financial Officer that the financial records as at 31 December 2014 have been properly maintained and the financial statements for the financial year under review give a true and fair view of the Company’s operations and finances and regarding the effectiveness of the Company’s risk management and internal control systems. Based on the work performed by the internal and external auditors, the Group’s framework of management control, the review procedures established and maintained by the Company to monitor the key controls and procedures and to ensure their effectiveness, the annual reviews performed by the management, Board committees and the Board with the concurrence of the AC and Enterprise Risk Management Committee, is of the view that the Group’s framework of internal controls in relation to the financial, operational, compliance and information technology controls and risk management system is adequate as at 31 December 2014 to provide reasonable assurance of the integrity and effectiveness of the Company in safeguarding its assets and shareholders’ value. The Board notes that the system of internal controls and risk management put in place by the Group provides reasonable, but not absolute, assurance that the Group will not be adversely affected by any event that could be reasonably foreseen. In this regard, the Board also notes that no system of controls and risk management can provide absolute assurance against irregularities especially those arising from poor judgment in decision making, human error and fraud. ENTERPRISE RISK MANAGEMENT COMMITTEE The Enterprise Risk Management Committee (“ERMC”) comprises eight members, majority is Non-Executive and the Chairman is independent. The ERMC members are: Ang Swee Tian (Chairman) Wu Zi Heng Liu Lian An Tom Yee Lat Shing Wang Kai Yuen Er Kwong Wah Liang Yan Feng Ma Hong Han Ouyang Chao Mei Non-Executive Independent Non-Independent Executive Non-Independent Executive Non-Executive Lead Independent Non-Executive Independent Non-Executive Independent Non-Independent and Non-Executive Chief Financial Officer Managing Director of COSCO (Singapore) Pte Ltd The ERMC assists the Board in fulfilling its oversight responsibilities on risk management framework and policies. The responsibilities of the ERMC include the following: a. reviews the overall risk management systems and process and makes recommendations on changes as and when considered appropriate; b. reviews the Group’s risk policies, guidelines and limits; and c. reviews periodically the Group’s material risk exposures and evaluates the adequacy and effectiveness of the mitigating measures implemented by management. The ERMC has delegated the day-to-day management of risk within the Group to the Risk Management Committee (“RMC”) of each of its operating subsidiaries. The RMC of each of the subsidiary comprises senior management staff of each division within the operating subsidiaries. 44 COSCO Corporation (Singapore) Limited Corporate Governance and Transparency The ERMC has conducted four (4) meetings during the year at which discussions were held on the establishment of new risk management policies, the existing risk management structure, the key risk exposures of the Group and the action plans to mitigate such risks. COSCO Shipyard Group continues to have a comprehensive strategic agreement with a leading Chinese insurance institution to strengthen its risk management system and to enhance its operational structure. The said insurance institution has established a team to provide the Group with different facades of insurance for domestic and international trades; setting up a standardised claims and liabilities system; the evaluation of ship owners’ credit ratings, the tracking of ship owners’ risk; and the evaluation of countries’ credit ratings. The Company believes all these efforts are to help the Group to move towards the establishment of an all-encompassing risk management system. AUDIT COMMITTEE Principle 12 The Audit Committee (“AC”) comprises all independent directors of the Company, as follows: Tom Yee Lat Shing (Chairman) Non-Executive Lead Independent Wang Kai Yuen Non-Executive Independent Er Kwong Wah Non-Executive Independent Ang Swee Tian Non-Executive Independent The Board is satisfied with the composition of the AC and the AC members are appropriately qualified to discharge their responsibilities. All members of the AC have recent and relevant accounting or related financial management expertise or experience, as the Board interprets such qualification in its business judgment. By briefings given by the External Auditors, the AC and Management are always kept abreast of changes to accounting standards and issues which have a direct impact on financial statements. AC members will also attend trainings regarding the new accounting standards as and when such need arises. The AC performs the following functions: a) reviews with the external auditors, their audit plan, evaluation of the accounting controls, audit reports and any matters which the external auditors wish to discuss; b) reviews with the internal auditors, their audit plan, the adequacy of the internal audit procedures and their evaluation of the effectiveness of the overall internal control systems, including financial, operational, compliance and information technology controls and risk management systems; c) reviews the quarterly and annual financial statements, including announcements to shareholders and the SGXST prior to submission to the Board so as to ensure the integrity of the Company’s financial statements; d) reviews any significant findings and recommendations of the external and internal auditors and related management response and assistance given by the management to auditors; e) reviews interested person transactions to ensure that internal control procedures approved by the shareholders are adhered to; f) conducts annual review of the independence and objectivity of the external auditors, including the volume of non-audit services provided by the external auditors, to satisfy itself that the nature and extent of such services will not prejudice the independence and objectivity of the external auditors before confirming their re-nomination; and g) reviews the qualifications of the candidate(s) for chief financial officer before recommending such appointment to the Board. Annual Report 2014 45 Corporate Governance and Transparency Corporate Governance The AC and the Board of Directors, with the assistance of internal and external auditors, reviews the effectiveness of the key internal controls, including financial, operational, compliance, information technology controls and risk management systems on an on-going basis. There are formal procedures in place for both the internal and external auditors to report independently their findings and recommendations to the AC. The AC has full access to, and cooperation from the Management including internal and external auditors, and has full discretion to invite any Director or executive officer to attend its meetings. The AC has also expressed power to investigate any matter brought to its attention, within its terms of reference, with the power to retain professional advice at the Company’s expense. The Group recognises the importance of the internal audit function which, being independent of Management is one of the principal means by which the AC is able to carry out its responsibilities effectively. The Company has appointed Deloitte & Touche Enterprise Risk Services Pte. Ltd. as the outsourced internal auditors of the Group. The internal auditors plan their internal audit schedules in consultation with the Management and submit their respective plans to the AC for approval. The Internal Auditors report directly to the AC and the AC will then escalate the IA report to the Board as part of their oversight role. The AC conducts regular meetings scheduled on a quarterly basis. Apart from the quarterly meetings, the AC meets with the external and internal auditors, without the presence of the management at least once a year. Ad-hoc meetings may be carried out from time to time, as circumstances require. The AC held five (5) meetings during the financial year. After reviewing the non-audit services provided by the external auditors, PricewaterhouseCoopers LLP, to the Group, the AC is satisfied with the independence and objectivity of the external auditors and recommends to the Board of Directors, the nomination of the external auditors for re-appointment. The fee paid to PricewaterhouseCoopers LLP for audit and non-audit services for the financial year ended 31 December 2014 is S$1,350,000 and S$49,000 respectively. The Company complies with Rules 712 and 715 of the Listing Manual of the Singapore Exchange Securities Trading Limited in relation to appointing appropriate auditing firm based in Singapore to audit its accounts, and its Singaporeincorporated subsidiaries and significant associated companies. Whistle-blowing Policy The Company has in place a whistle-blowing policy and arrangements by which staff may, in confidence, raise concerns about possible corporate improprieties in matters of financial reporting or other matters. To ensure independent investigation of such matters and for appropriate follow-up action, all whistle-blowing reports are to be sent to the internal audit function. The AC, President and Chief Financial Officer of the Company will be informed immediately of all whistle-blowing reports received. Details of the whistle-blowing policy and arrangements are given to all staff for their easy reference. New staff is briefed on these during the orientation programme. INTERNAL AUDIT Principle 13 The AC reviews the adequacy and effectiveness of the internal audit function annually. The internal audit function’s primary line of reporting is to the Chairman of the AC. Internal Audit is an independent function within the Company. Internal Auditors report directly to the AC and administratively to the President. The Company has appointed Deloitte & Touche Enterprise Risk Services Pte. Ltd. as the internal auditors of the Group. The internal auditors have unfettered access to all the Company’s documents, records, properties and personnel, including access to the AC. The AC is satisfied with the independence and objectivity of the outsourced Internal Auditors and believes that they have appropriate standing to perform their functions effectively. 46 COSCO Corporation (Singapore) Limited Corporate Governance and Transparency D. SHAREHOLDER RIGHTS AND RESPONSIBILITIES SHAREHOLDER RIGHTS Principle 14 COSCO treats all shareholders fairly and equitably, and recognises, protects and facilitates the exercise of shareholders’ rights and continually reviews and updates such governance arrangements. The Company strives for timeliness and transparency in its disclosures to the shareholders and the public. All information on the Company’s new initiatives will be disseminated via SGXNET to ensure fair communication with the shareholders and the public. COMMUNICATION WITH SHAREHOLDERS Principle 15 The Company has put in place an investor relations policy to promote regular and effective communication with shareholders. All questions raised by the shareholders would be escalated to and addressed by the Senior Management, General Manager of Investor Relations and/or relevant person-in-charge. All announcements will be disseminated via SGXNET timely in accordance with the Listing Manual. The Company currently holds media and analyst briefings upon the release of its quarterly financial results. Management regularly receives visiting fund managers to provide them an insight to the Company’s business and developments, as well as to better understand and address their concerns. In addition to the media and analyst briefings, the Company has taken part in various investor conferences. This allows the Board to understand the view of the shareholders about the Company. The Company does not practise selective disclosure. Price-sensitive information is first publicly released via SGXNET, either before the Company meets with any group of investors or analysts or simultaneously with such meetings. Subsequently, all released announcements will be uploaded to the Company’s website at www.cosco.com.sg. Where there is inadvertent disclosure made to a select group, the Company ensures it would make the same disclosure publicly to others as promptly as possible. All quarterly and full year results announcements, annual reports, dividend declaration and notice of book closure are announced via SGXNET or issued within the prescribed period under Listing Manual. DIVIDEND POLICY The Company does not have a specific dividend policy. Nonetheless, the Management after reviewing the performance of the Company in the relevant financial period will make appropriate recommendation to the Board. Any dividend declaration will be communicated to shareholders via announcement through SGXNET. For the financial year ended 31 December 2014, the Board has recommended a First and Final tax-exempt (one-tier) Dividend of S$0.005 per ordinary share for the shareholders’ approval at the forthcoming AGM. CONDUCT OF SHAREHOLDER MEETINGS Principle 16 COSCO Corporation encourages shareholders to participate actively in general meetings. At general meetings of the Company, shareholders are given the equitably opportunity to participate effectively in and vote at the meeting and express their views and ask questions regarding the Company and the Group. The Company Secretary is present to brief the attendees the rules govern the general meetings, including voting procedures, upon requested by the shareholder. The proceeding of the AGM is properly recorded, including all comments or queries from shareholders relating to the agenda of the meeting and responses from the Board and Management. All minutes of general meetings are opened to the inspection of shareholder within one month after the general meeting was held when requested by any shareholder. Annual Report 2014 47 Corporate Governance and Transparency Corporate Governance The Company’s Articles allow a shareholder entitled to attend and vote to appoint a proxy who need not be a shareholder of the Company to attend and vote at the meetings. The Board members and chairpersons of the Audit, Nominating, Remuneration, Enterprise Risk Management and Strategic Development Committees are present and available to address shareholders’ questions at general meetings. The external auditors are also present to address shareholders’ queries relating to the conduct of the audit and the preparation and content of the auditors’ report. The Board is of the view that voting by poll is time-consuming and increases the cost of holding general meetings. However, the Board will continue to study the feasibility of conducting poll voting in general meetings on a caseby-case basis. Unless the context otherwise requires or a poll is demanded in accordance with the provision of the Articles, the Company shall, for the time being continue to conduct its votes on a show of hands. The Board notes that pursuant to the Rules 730A (2) of the Listing Manual of the Singapore Exchange Securities Trading Limited, voting by way of poll would be required by 1 August 2015. E. INTERESTED PERSON TRANSACTIONS (“IPTS”) POLICY The Company has adopted an internal policy in respect of any transactions with interested persons and has set out the procedures for review and approval of the Company’s interested person transactions with the China Ocean Shipping (Group) Company and its associates, which are covered by a Shareholders’ Mandate approved at each general meeting. The AC reviews the Shareholders’ Mandate at regular intervals, and is satisfied that the review procedures for IPTs and the reviews to be made periodically by the AC in relation thereto are adequate to ensure that the IPTs will be transacted on normal terms and will not be prejudicial to the interests of the Company and its minority shareholders. Pursuant to Rule 907 of the Listing Manual, the following interested person transactions were entered into during the financial year: Name of interested person Aggregate value of all interested person transaction during the financial period under review (excluding transactions less than $100,000 and transactions conducted under shareholders' mandate pursuant to Rule 920) S$’000 Between Subsidiaries and: Chimbusco Guangzhou Branch Chimbusco Zhoushan Branch China Marine Bunker (Dalian) Co., Ltd China Ocean Shipping (Group) Company Cosco (HK) Insurance Brokers Ltd Cosco (HK) Investment & Development Co., Ltd Cosco (HK) Shipping Co., Ltd COSCO (Weihai) Shipbuilding Marine Technology Co., Ltd Cosco Air Service Shanghai Ltd Cosco Bulk Carrier Co., Ltd Cosco Bulk Carrier Holdings (Cayman) Limited 48 COSCO Corporation (Singapore) Limited Aggregate value of all interested person transactions conducted under shareholders' mandate pursuant to Rule 920 (excluding transactions less than $100,000) S$’000 – – – – – 4,251 7,712 11,090 123 243 – – 1,067 11,547 – – – 530 112 8,837 – 1,002 Corporate Governance and Transparency Name of interested person Aggregate value of all interested person transaction during the financial period under review (excluding transactions less than $100,000 and transactions conducted under shareholders' mandate pursuant to Rule 920) S$’000 Aggregate value of all interested person transactions conducted under shareholders' mandate pursuant to Rule 920 (excluding transactions less than $100,000) S$’000 – – – – – 1,146 5,768 693 2,387,194 102 – – – – – – 195 432 1,844 4,705 1,173 5,506 – – 119 7,034 – – 9,679 3,347 – – – – – – – – – 2,323 3,266 114 4,852 1,590 1,480 983 211 2,490,270 Cosco Bulk Tianjin Forwarding Company Limited Cosco Container Lines Co., Ltd Cosco Far-Reaching Shipping Co., Ltd Cosco Finance Co., Ltd Cosco International Trade Ltd Cosco Jiangsu International Freight Co., Ltd Cosco Logistic (GZ) Heavy Transportation Cosco Logistics Nantong Co., Ltd Cosco Logistics Dalian Co., Ltd Cosco Petroleum Pte Ltd Cosco Shipping Co., Ltd Cosco Wallem Ship Management Co., Ltd Dalian Ocean Shipping Company Nantong Chimbusco Marine Bunker Co., Ltd Nantong Cosco Heavy Industry Co., Ltd Nantong Cosco Ship Equipment Company Qingdao Manning Co-operation Ltd Qingdao Ocean Shipping Company Shanghai Ocean Crew Co., Ltd Shanghai Ocean Shipping Company Shanghai Pan-Asia Shipping Company Shenzhen Ocean Shipping Company Xiamen Ocean Shipping Company Total Balances placed with a fellow subsidiary, Cosco Finance Co., Ltd : - Cash at bank - Short-term bank deposits Loan from a fellow subsidiary, Cosco Finance Co., Ltd As at 31/12/2014 S$’000 As at 31/12/2013 S$’000 375,266 217,215 592,481 286,908 439,612 726,520 – 2,086 Annual Report 2014 49 Corporate Governance and Transparency Corporate Governance F. DEALING IN SECURITIES In line with Chapter 12 Rule 1207(19) of the Listing Manual on dealings in securities, the Company has adopted an internal compliance code which provides guidance to its Directors and officers in relation to dealings in its securities. The Listing Manual prohibits securities dealings by the Directors and employees while in possession of price-sensitive information. The Management should not deal in the Company’s shares on short-term considerations. The Company issues regular circulars to its Directors, principal officers and relevant officers who have access to unpublished material price-sensitive information to remind them of the aforementioned prohibition and to remind them of the requirement to report their dealings in shares of the Company. The Directors and employees are also prohibited from dealing in the securities of the Company during the period commencing two weeks before the announcement of financial results of the Company for each of the first, second and third quarters of its financial year or one month before the announcement of the Company’s full year financial statements. 50 COSCO Corporation (Singapore) Limited Corporate Governance and Transparency Corporate Information Board of Directors Li Yun Peng Chairman and Non-Independent and Non-Executive Director Wu Zi Heng Vice Chairman, President and Non-Independent Executive Director Liu Lian An Non-Independent and Executive Director Liang Yan Feng Non-Independent and Non-Executive Director Ma Zhi Hong Non-Independent and Non-Executive Director Tom Yee Lat Shing Non-Executive Lead Independent Director Wang Kai Yuen Non-Executive Independent Director Er Kwong Wah Non-Executive Independent Director Ang Swee Tian Non-Executive Independent Director Alternate Directors Ma Hong Han Alternate to Ma Zhi Hong Li Man Alternate to Li Yun Peng Ouyang Chao Mei Alternate to Liang Yan Feng Audit Committee Tom Yee Lat Shing Chairman Wang Kai Yuen Er Kwong Wah Ang Swee Tian Remuneration Committee Er Kwong Wah Chairman Wu Zi Heng Tom Yee Lat Shing Wang Kai Yuen Ang Swee Tian Nominating Committee Wang Kai Yuen Chairman Wu Zi Heng Tom Yee Lat Shing Er Kwong Wah Ang Swee Tian Enterprise Risk Management Committee Ang Swee Tian Chairman Wu Zi Heng Liu Lian An Tom Yee Lat Shing Wang Kai Yuen Er Kwong Wah Liang Yan Feng Ma Hong Han Ouyang Chao Mei Strategic Development Committee Wu Zi Heng Chairman Li Yun Peng Tom Yee Lat Shing Wang Kai Yuen Er Kwong Wah Ang Swee Tian Registered Office and Business Contact Information 9 Temasek Boulevard #07-00 Suntec Tower Two Singapore 038989 Telephone: 6885 0888 Facsimile: 6336 9006 Website: www.cosco.com.sg Company Registration Number 196100159G Auditors PricewaterhouseCoopers LLP 8 Cross Street #17-00 PWC Building Singapore 048424 Partner-in-charge: Soh Kok Leong (since FY2012) Company Secretaries Teo Meng Keong Low Siew Tian Share Registrar and Share Transfer Office Tricor Barbinder Share Registration Services (A division of Tricor Singapore Pte Ltd) 80 Robinson Road #02-00 Singapore 068898 Telephone: 6236 3333 Facsimile: 6236 4399 Annual Report 2014 51 Corporate Governance and Transparency Board of Directors MR Li Yun Peng Chairman and Non-Independent and Non-Executive Director Mr Li Yun Peng was appointed as the Chairman and Non-Independent and Non-Executive Director of the Company with effect from 30 September 2013. Mr Li started his career on COSCO’s ocean-going vessels as an engineer. After that, he served in COSCO Tianjin as Deputy Manager and General Manager of Human Resources Department, General Manager of Administration Department and Party Secretary Office. After he joined China Ocean Shipping (Group) Company, Mr Li has taken various posts including Deputy General Manager of Executive Division, Deputy Secretary of Party Disciplinary Inspection Office, General Manager of Supervisory Division, Director of Organisation Division, General Manager of Human Resources Division, Assistant to the President, Party Committee Member, Director of Party Disciplinary Inspection Office and Executive Vice President of COSCO Group. In July 2013, Mr Li Yun Peng was appointed as a Director of Board and the President of China Ocean Shipping (Group) Company. With over 30 years’ expertise in the shipping industry, Mr Li has rich experiences in corporate management, internal control and human resources development. Mr Li Yun Peng received his master’s degree in ship and naval architectural design from Tianjin University. He is a senior engineer. 52 COSCO Corporation (Singapore) Limited Corporate Governance and Transparency Captain Wu Zi Heng Mr Liu Lian An Captain Wu Zi Heng was appointed Vice Chairman, President and Non-Independent Executive Director of the Company in November 2011. Mr Liu Lian An was appointed Executive Director on 20 February 2012. Currently, he is also Chairman of COSCO Holdings (Singapore) Pte. Ltd. Captain Wu brings to his current role almost two decades of directorship experience in various functions within the COSCO Group as well as from other organisations. Prior to his current appointment, from July 2008 to November 2011, Captain Wu was Deputy Managing Director of China Ocean Shipping Tally Company. From December 2002 to March 2008, Captain Wu was Chairman of the National Committee of Chinese Seamen and Construction Workers Union. He was Director of COSCO Research and Development Center from September 1999 to December 2002 and Deputy Managing Director of COSCO Xiamen from December 1995 to September 1999. Born in 1956, Mr Liu graduated from Dalian Maritime University with a Bachelor’s degree in 1982. Vice Chairman, President and Non-Independent Executive Director Non-Independent and Executive Director Mr Liu joined COSCO Tianjin in 1982. Over the past years, he has worked as Manager of Shipping Department and Vice General Manager of COSCO Corporation (Singapore) Ltd., Vice General Manager, General Manager of Shipping Department, Vice General Manager of COSCO BULK and General Manager of China COSCO Bulk Division. Prior to that, from November 1993 to December 1995, Captain Wu helped lead COSCO Xiamen as Assistant Managing Director and as Deputy Director of the executive office and passenger shipping department. Captain Wu started his career in COSCO Guangzhou as a deck officer and was a ship’s master until November 1993. Born in October 1956, Captain Wu started his professional career in July 1975. He graduated from Dalian Maritime University with a master’s degree and is a senior engineer. From September 1978 to August 1982, Captain Wu studied marine navigation in Dalian Maritime University. He is an expert on work safety, as accredited by China’s State Administration of Work Safety. Annual Report 2014 53 Corporate Governance and Transparency Board of Directors MR LIANG YAN FENG Mr Ma Zhi Hong Mr Liang Yan Feng was appointed as a Non-Independent and Non-Executive Director of the Company with effect from 8 July 2014. Mr Ma Zhi Hong has been appointed as a NonIndependent and Non-Executive Director of the Company with effect from 2 August 2010. Mr Liang started his career with COSCO in July 1991. In early years, he had worked as a deputy section manager, section manager and deputy general manager in human resources division of COSCO Group head office. Mr Ma Zhi Hong, born in March 1957, graduated from the Dalian Maritime University with a doctorate degree. He joined COSCO in July 1979. For more than 30 years, Mr Ma has worked as an engineer on-board ships, chief engineering superintendent of COSCO Container Lines Co., Ltd, vice president of COSCO Bulk Carrier Co., Ltd, assistant president of COSCO Group head office, vice president of COSCO (Hong Kong) Group Ltd and deputy managing director of COSCO Shipyard Group Co., Ltd. Non-Independent and Non-Executive Director From November 1997 to September 2000, Mr Liang was managing director of COSCO Human Resources Development Company. From September 2000 to August 2005, he was general manager of asset operation division in COSCO Group head office. From March 2006 to December 2009, he was deputy general manager and managing director of COSCO International Holdings Ltd. After that, he was vice president of COSCO (Hong Kong) Group Ltd and deputy managing director of Dalian Ocean Shipping Company. In May 2014, Mr Liang Yan Feng was appointed president of COSCO Shipyard Group Co. Ltd. Mr Liang graduated from Tsinghua University with a bachelor’s degree and an EMBA degree. 54 COSCO Corporation (Singapore) Limited Non-Independent and Non-Executive Director Corporate Governance and Transparency Mr Tom Yee Lat Shing Dr Wang Kai Yuen Mr Tom Yee Lat Shing was appointed to the Board on 16 November 1993. He is a Non-Executive Lead Independent Director and was last re-elected as Director on 23 April 2014. He was appointed as Lead Independent Director effective from 21 February 2014. He is Chairman of the Company’s Audit Committee and member of the Nominating, Enterprise Risk Management, Remuneration and Strategic Development Committees. Mr Yee is a Singapore Chartered Accountant and was a partner of an international public accounting firm from 1974 to 1989. He has more than 35 years of experience in the field of accounting and auditing and extensive experience in handling major audit assignments of public listed and private companies in various industries, including insurance, manufacturing and retailing. He is currently a consultant. Mr Yee sits on the boards of several Singapore-listed companies. He is a fellow member of the Institute of Chartered Accountants in Australia, CPA (Australia) and Institute of Singapore Chartered Accountants and an associate member of the Institute of Chartered Secretaries and Administrators. He is also a fellow member of the Singapore Institute of Directors. Dr Wang Kai Yuen was appointed as a Non-Executive Independent Director on 2 May 2001. He chairs the Nominating Committee and is a member of the Audit, Enterprise Risk Management, Remuneration and Strategic Development Committee. Dr Wang served as a Member of Parliament for the Bukit Timah Constituency from December 1984 until April 2006. He was the Chairman of Feedback Unit from 2002 until his retirement from politics. He retired as the Centre Manager of Fuji Xerox Singapore Software Centre in December 2009. Dr Wang also holds directorships at ComfortDelgro Group Ltd, CAO (Singapore) Corporation Ltd, Ezion Holdings Ltd, Matex International Ltd, and others. Non-Executive Lead Independent Director Non-Executive Independent Director He graduated from the University of Singapore with a First Class Honours degree in Electrical and Electronics engineering. Dr Wang holds a Master of Science in Electrical Engineering, a Master of Science in Industrial Engineering and a PhD in Engineering from Stanford University, USA. He received a Friend of Labour Award in 1988 for his contributions to the Singapore labour movement. Annual Report 2014 55 Corporate Governance and Transparency Board of Directors Mr Er Kwong Wah Mr Ang Swee Tian Mr Er Kwong Wah was appointed as a Non-Executive Independent Director on 20 December 2002. He chairs the Remuneration Committee and is a member of the Audit, Nominating, Enterprise Risk Management and Strategic Development Committee. A Colombo Plan and Bank of Tokyo Scholar, Mr Er obtained a first class honours degree in Electrical Engineering at the University of Toronto, Canada, in 1970 and an MBA from the Manchester Business School of the University of Manchester, UK in 1978. Mr Ang Swee Tian is a Non-Executive Independent Director of COSCO Corporation (Singapore) Limited. He chairs the Enterprise Risk Management Committee and is a member of the Audit, Remuneration, Nominating and Strategic Development Committees. Non-Executive Independent Director Mr Er spent 27 years in the Singapore Civil Service and served in various departments including the Ministry of Defence, Public Service Commission, Ministry of Finance, Ministry of Education and Ministry of Community Development. He was Permanent Secretary in the Ministry of Education from 1987-1994, and then in the Ministry of Community Development until his retirement in 1998. Currently, he is an Executive Director of the East Asia Institute of Management, as well as an Independent Director on the Boards of several public listed companies. For his outstanding service in the Government and in the community, Mr Er was awarded the PPA (E) or Public Administration Medal (Gold), the BBM (Public Service Star) and the PBM (Public Service Medal). In 1991, the Government of France conferred him a National Honour with the award of Commandeur dans l’Ordre des Palmes Academiques. 56 COSCO Corporation (Singapore) Limited Non-Executive Independent Director Mr Ang was the President of Singapore Exchange Ltd (“SGX”) from 1999 to 2005 during which he played an active role in successfully promoting SGX as a preferred listing and capital raising venue for Chinese enterprises. Mr Ang also played a pivotal role in establishing Asia’s first financial futures exchange, the Singapore International Monetary Exchange (“SIMEX”) in Singapore in 1984 and was instrumental to establishing SGX AsiaClear which started offering OTC clearing facility in 2006. Following his retirement in January 2006, Mr Ang served as Senior Adviser to SGX until December 2007. In March 2007, Mr Ang became the first person from an Asian Exchange to be inducted into the Futures Industry Association’s Futures Hall of Fame which was established to honour and recognise outstanding individuals for their contributions to the global futures and options industry. Mr Ang graduated from Nanyang University of Singapore with a First-Class Honours Degree in Accountancy in 1970. He was conferred a Master Degree in Business Administration with distinction by the Northwestern University in 1973. Corporate Governance and Transparency Further information on Board of Directors The list of current directorships in other listed companies held by the respective Directors are as follows: Director Current directorship in other listed companies Li Yun Peng • China COSCO Holdings Co. Ltd. (Vice Chairman) Wu Zi Heng Nil Liu Lian An Nil Liang Yan Feng Nil Ma Zhi Hong Nil Tom Yee Lat Shing • Bonvest Holdings Ltd (Director) • Pacific Century Regional Development Limited (Director) • Powermatic Data Systems Ltd (Director) Wang Kai Yuen • A-Sonic Aerospace Ltd (Director) • China Aviation Oil (Singapore) Corporation Ltd (Deputy Chairman) • ComfortDelGro Corporation Limited (Director) • EOC Ltd (Director) • Ezion Holdings Ltd (Director) • HLH Group Ltd (Chairman) • Matex International Ltd (Director) Er Kwong Wah • CFM Holding Ltd (Director) • China Essence Group Ltd (Director) • China Oilfield Technology Services Group Ltd (Director) • China Sky Chemical Fiber Co., Ltd (Director) • Eucon Holding Ltd (Director) • GKE Corporation Ltd (Director) • C Y Foundation Group Ltd (Director) Ang Swee Tian • China Aviation Oil (Singapore) Corporation Ltd (Director) Annual Report 2014 57 Corporate Governance and Transparency Key management Mr Wong Meng Yun Financial Controller Mr MA HONG HAN Chief Financial Officer Captain Wu Zi Heng Vice Chairman and President Captain Wu Zi Heng was appointed Vice Chairman, President and Non-Independent Executive Director of the Company in November 2011. Captain Wu brings to his current role almost two decades of directorship experience in various functions within the COSCO Group as well as from other organisations. Prior to his current appointment, from July 2008 to November 2011, Captain Wu was Deputy Managing Director of China Ocean Shipping Tally Company. From December 2002 to March 2008, Captain Wu was Chairman of the National Committee of Chinese Seamen and Construction Workers Union. He was Director of COSCO Research and Development Center from September 1999 to December 2002 and Deputy Managing Director of COSCO Xiamen from December 1995 to September 1999. 58 COSCO Corporation (Singapore) Limited Captain Wu Zi Heng Vice Chairman and President Mr Li MAN Vice President Prior to that, from November 1993 to December 1995, Captain Wu helped lead COSCO Xiamen as Assistant Managing Director and as Deputy Director of the executive office and passenger shipping department. Captain Wu started his career in COSCO Guangzhou as a deck officer and was a ship’s master until November 1993. Born in October 1956, Captain Wu started his professional career in July 1975. He graduated from Dalian Maritime University with a master’s degree and is a senior engineer. From September 1978 to August 1982, Captain Wu studied marine navigation in Dalian Maritime University. He is also an expert on work safety, as accredited by China’s State Administration of Work Safety. Corporate Governance and Transparency Mr MA HONG HAN Chief Financial Officer Mr Ma Hong Han was appointed Chief Financial Officer of the Company in August 2012. He has extensive experience in finance and corporate financial management. From April 1994 to November 1996, Mr Ma worked in the Accounting Department, Finance Division of China the Ocean Shipping (Group) Company. From November 1996 to February 2002, Mr Ma was an assistant manager of Overseas Financial Management Department, Finance Division of China Ocean Shipping (Group) Company. From February 2002 to November 2006, Mr Ma was Deputy General Manager and then General Manager of Finance Division of COSCO Americas Inc. From December 2006 to July 2012, Mr Ma was Deputy General Manager of Finance Division, China Ocean Shipping (Group) Company. Mr Ma graduated from Renmin University of China in July 1994 with a Bachelor’s Degree of Economics. Mr Li MAN Vice President Mr Li Man has rich knowledge and experience in corporate management and business operation. From July 1993 to Oct 1997, Mr Li served as a manager in Secretary Division, Executive Office of Tianjin Ocean Shipping Company. From October 1997 to August 1999, Mr Li was Deputy General Manager of Qingdao AIER Food Co. Ltd. From August 1999 to January 2001, he was Deputy General Manager of Executive Office, COSCO Bulk Carrier Co. Ltd. From January 2001 to September 2005, Mr Li served as Deputy General Manager and General Manager of Tianjin Shore-Based Industry Company, COSCO Bulk Carrier Co. Ltd. Mr Li graduated from Dalian Maritime University in July 1993 with a Bachelor’s Degree in Engineering. He received his MBA in July 2002 and Ph.D. in Business Administration and Enterprise Management in May 2009 from Nankai University. MR WONG MENG YUN Financial Controller Mr Wong Meng Yun has more than 30 years of professional and leadership experience in financial management, corporate finance, internal and external audit and treasury management of which 12 years were in a senior regional management position with a leading US-listed software company prior to his joining the Group in July 2008. He graduated from the University of Singapore with a Bachelor of Accountancy and is a Fellow of the Association of Chartered Certified Accountants, CPA Australia, the Institute of Singapore Chartered Accountants, the Chartered Institute of Arbitrators, the Institute of Arbitrators and Mediators Australia and the Singapore Institute of Arbitrators. He is a Certified Treasury Professional (CTP) with the Association for Financial Professionals as well as a Certified Internal Auditor (CIA) and a Certified Financial Services Auditor (CFSA) with the Institute of Internal Auditors with certification in control self-assessment (CCSA) and risk management assurance (CRMA). He is a Certified Information Systems Auditor (CISA) and a Certified Information Security Manager (CISM) with the Information Systems Audit and Control Association (ISACA). He speaks regularly in public seminars organised by the Institute of Internal Auditors, Singapore and the Institute of Singapore Chartered Accountants on topics related to risk management and internal controls. From September 2005 to August 2007, Mr Li was Deputy General Manager of Executive Office, China Ocean Shipping (Group) Company. From August 2007 to August 2009, Mr Li served as Vice Governor in Yanbian Korean Autonomous Prefecture, Jilin Province, P.R. China. From October 2009 to October 2012, he was Executive Vice President of BOAO COSCO Co. Ltd. Annual Report 2014 59 Corporate Governance and Transparency Investor Relations As a listed entity with both institutional and retail stakeholders, COSCO Corporation recognises that an active investor relations (IR) strategy is pivotal in managing investor communications, expectations and confidence. Management ensures regular performance reporting and clear and timely investor communications. We believe that accurate and substantive corporate disclosure will help investors arrive at a fair and informed assessment of our corporate performance and business prospects. Regular investor engagement has helped to generate investment interest in our company and stock, resulting in our inclusion in the FTSE ST China Index since January 2009, and in the FTSE China Top Index since July 2009. These indices were created to reflect the increasing representation of China-based companies on the Singapore stock market and offer investors benchmarks for monitoring the relative performance of China-based companies on the Singapore Exchange. COSCO Corporation is also a component of the Bloomberg World Shipbuilding Index and Bloomberg Asia Pacific Shipbuilding Index. 3365.15 STI Index 0.560 COSCO Corp Jan Feb Mar Apr May Jun Jul FY2014 60 COSCO Corporation (Singapore) Limited Aug Sep Oct Nov Dec Corporate Governance and Transparency MAjor Investor Relations Events in 2014 DateOrganiserEvent 22-Jan-14 Credit Suisse Exploration & Production and Offshore & Marine Corporate Day 24-Feb-14 COSCO Corporation FY2013 Full Year Results Briefing 5-Mar-14 Bank of America Merrill Lynch ASEAN Stars Conference 2014 23-Apr-14 COSCO Corporation Annual General Meeting 30-Apr-14 COSCO Corporation FY2014 1st Quarter Results Briefing 12-Jun-14 CITI Citi ASEAN Investor Conference 2014 1-Aug-14 COSCO Corporation FY2014 2nd Quarter Results Briefing 27-Aug-14 Macquarie Macquarie ASEAN Conference 3-Nov-14 COSCO Corporation FY2014 3rd Quarter Results Briefing Engaging Investors The trading of COSCO’s stock is supported by timely and pertinent corporate disclosure. Over the year in review, we made announcements on newly secured contracts, project completion and deliveries, quarterly and full year results, growth strategies, operational commentaries and developments and our business outlook. We reach out directly to the general public and shareholders through investor meetings and the Annual General Meeting. Aside from our quarterly financial results briefings, we periodically meet analysts, fund managers, retail investors, banks and other financial institutions to discuss the latest COSCO Corporation corporate developments. In 2014, we continue to participate in analyst meetings and investor conferences. Our senior management is present and fully engaged at these forums. Through these events, we have meaningful interactions with research analysts, fund managers and stockbrokers; thus allowing them to gain a deeper understanding of COSCO’s management, operations and developments, business strategy and outlook. In October 2014, we were runner-up for the ‘Most Transparent Company Award – Industrials Category’ in the Securities Investors Association of Singapore (SIAS) 15th Investors' Choice Awards. This award honours and recognises public listed companies which have demonstrated exemplary corporate governance and transparency practices throughout the year. analyst coverage Company Name of Analyst CIMB CITI Credit Suisse Daiwa Securities DBS Vickers Deutsche Bank Goldman Sachs HSBC JP Morgan Macquarie Maybank Kim Eng Morgan Stanley OCBC Religare UBS UOB Kay Hian Lim Siew Khee Low Horng Han Gerald Wong Royston Tan Ho Pei Hwa Kevin Chong Koh Miang Chuen Neel Sinha Ajay Narayan Mirchandani Somesh Kumar Agarwal Yeak Chee Keong Andy Meng Low Pei Han Vincent Fernando Cheryl Lee Nancy Wei Annual Report 2014 61 Corporate Governance and Transparency Risk Management INTRODUCTION Risk management and internal controls have been the main focus of the various objectives of the Corporate Governance Council (“CG Council”) to raise the standard of corporate governance in its recent Code of Corporate Governance (“CG Code”) revision. In the 2012 CG Code, the CG Council introduced the revised Principle 11 to focus on Risk Management and Internal Controls. Immediately on 10 May 2012, a Risk Governance Guidance for Listed Boards was also released by CG Council. These efforts by CG Council are aimed at providing guidance to listed companies’ boards and management on risk management which aims to ultimately contribute to better and sustained value to investors, raise investor confidence and enhance Singapore’s reputation as a leading and trusted international financial center. At COSCO Corporation (Singapore) Limited , the Board of Directors (“Board”) believes that good corporate governance is an effectual balance of promoting the long-term success of the Company and providing accountability and control systems which are symmetric with risks involved. It is essential to facilitate effective, entrepreneurial and prudent management. The Board has delegated the risk management and internal controls of the Group to an Enterprise Risk Management Committee (“ERMC”). In the ever-changing business environment, the risk management process of the Group is constantly reviewed and updated by the ERMC. The risk management process is aiming to identifying the risk factors that may have a material impact on the Group’s operation, and to manage them appropriately. The Company has adopted an Enterprise Risk Management Policy in August 2012 aims to: • provide a consistent and structured philosophy and process in managing COSCO’s risks; • enable a uniform approach in prioritising, managing, monitoring and mitigating COSCO’s risks; and • establish clear responsibilities, lines of authority, accountabilities and decision making processes. 62 COSCO Corporation (Singapore) Limited With the above policy, the risks identification and management have been carried out and placed under the purview of the ERMC. The material risk factors identified by the Group’s risk management process are set out below. Each of these could have a material and adverse impact on the Group, including its business, financial condition, results of operation and prospect. These risk factors have been divided into four categories: external; internal; execution and financial. RISK MANAGEMENT PROCESS The ERMC has delegated the day-to-day management of risk within the Group to the Risk Management Committee (“RMC”) of each of its operating subsidiaries and each RMC comprises senior management staff of the respective division within the operating subsidiaries. The ERMC also engages Deloitte & Touche Enterprise Risk Services Pte. Ltd. to perform strategic risk profiling in the Group’s major subsidiaries. As the Group’s enterprise risk management programme is a long-term initiative that calls for commitment and inputs from various stakeholders, the enterprise risk management policies have been implemented in phases with guidance from Deloitte & Touche Enterprise Risk Services Pte. Ltd. in a systematic manner and coupled with constant education and training of local management staff and risk owners. The Board currently conducts periodical reviews of the risks and it identifies the key risks for the year ahead to stay current with the ever-changing operating environment. As part of this review, operational and strategic risks are proposed as key risks by the RMC, based on inputs from regions, function heads and business leaders. The risk factors set out below reflect the key risks identified. Each of the key risks is assigned to the Chairman of the RMC at the operating subsidiaries who proposes a level of risk the Group is willing to take and develops appropriate action plans to mitigate the risks. All risk mitigation plans are reviewed and agreed by the Board. Corporate Governance and Transparency Once risk mitigation plans are agreed, each operating subsidiary is asked to carry out a self-assessment exercise which requires all operating units to confirm compliance with the Group’s policies and also to confirm that key operational controls are in place and working effectively. The results of this exercise, together with a review of specific plans for strategic risks, enable the Board to confirm that the business has a sound riskbased framework of internal controls. The Group Auditors, internal and external, provide independent reassurance that the standard of risk management, compliance and control meet the needs of the business. Group Audit status reports are discussed with ERMC, Audit Committee and Board on a regular basis. The Board also recognises that the risks facing the business may sometimes change over short time periods. Every quarter, each operating subsidiary provides an update on new and emerging risks and reports to update the Group’s risks are provided to the ERMC, Audit Committee and the Board. The Board concurred with the opinions of its subcommittees, i.e. Audit Committee and ERMC, of the adequacy of the internal controls system (of which risk management is one of its crucial segments) to addressing its financial, operational, compliance and information technology risks in meeting the current scope of the Group’s business operations. It is not possible and practical to identify and anticipate every risk that may impact the Group. While the Group’s risk management process attempts to identify and manage (where possible) the key risks it faces, no such process can totally eliminate risks or guarantee that every risk is identified, or, that it is possible, economically viable, or prudent to manage such risks. Consequently, there can never be an absolute assurance against the Group failing to achieve its objectives or a material loss arising. Some material risks may not be known, others, even though currently deemed as immaterial, could become material and new risks may also emerge. The Board affirms its overall responsibility on risk management and to review the adequacy and integrity of the control system on an annual basis. 1. EXTERNAL RISKS The Group is subject to a number of external risks. The Group defines external risks as those that stem from factors which are mainly outside of its control. These risks will often arise from the nature of the Group and the industry in which it operates. GLOBAL ECONOMIC DOWNTURN AND UNCERTAINTIES The global capital and credit markets have been experiencing periods of extreme volatility and disruption. The global economic uncertainties, concerns over recession, inflation or deflation, energy costs, geopolitical issues, commodity prices and the availability and cost of credit, have contributed to unprecedented levels of market volatility and diminished expectations for the global economy and the capital and consumer markets. These factors, combined with others, precipitated a severe global economic downturn, the full extent of which remains to be seen. The Group is susceptible to the cyclical world-wide demand and pricing in its industries, which are highly dependent upon global economic condition. The uncertainties are likely to result in a decrease in the overall demand for vessels and risks of default by the ship-owners in taking delivery of the vessels upon completion. LEGAL, REGULATORY, POLITICAL AND SOCIETAL RISKS The Group is at risk from significant and rapid change in the legal systems, regulatory controls, custom and practices in the regions in which it operates. Political uncertainties, regime change and change in society, including increased scrutiny of the Group, its businesses or its industry, for example by governmental and non-governmental organisations or the media Annual Report 2014 63 Corporate Governance and Transparency Risk Management may result in, or increase the rate of, material legal and regulatory change, and changes to custom and practices. These affect a wide range of areas and are expected to have material and adverse impacts on the performance and financial condition of the Group if they are not pre-empted appropriately. COMPETITION The ship repair, ship building, marine engineering and dry bulk shipping industries are highly competitive. The primary bases for competition in the ship repair, ship building and marine engineering industries are matching of the customers’ demands with the capabilities and capacity of a shipyard, the type and quality of vessel, price, delivery schedule/availability and type of equipment. The Group expects to face increased competition from existing competitors and new entrants into these industries in the future. In the event that the Group is unable to continually upgrade its shipyard capabilities, the Group’s business, financial condition, results of operation and prospect may be adversely affected. The Group may face increasingly stiff competition, especially under this era of global uncertainties whereby some players have adopted aggressive pricing strategy in order to secure new orders. The recent steep slide in crude oil prices may result in significantly reduced and slower demand for marine engineering products or cancellation of contracts. Increased competition in the markets have caused and will cause contract values of new ship building contracts to deteriorate thereby adversely impacting the Group’s performance and financial condition. CUSTOMER DEMAND Customer expectations are increasingly demanding. The Group expects greater scrutiny by customers before they take delivery of vessels. This will, inadvertently, increase the building costs of vessels. A failure to recover higher costs could materially and adversely impact the Group’s performance. 64 COSCO Corporation (Singapore) Limited The Group has introduced enhanced modern shipbuilding management system software to better manage and to mitigate the risks of late ship-built delivery and quality. A “COSCO Shipyard CIMS System Maintenance and Operation Regulation” has been developed and updated to ensure common practices, smooth and stable operation throughout the various shipyard subsidiaries. MARKET DOWNTURN RISK Over the past year, the global offshore market has slowed down significantly due to weak global economic conditions and the recent plunge in crude oil prices. Many oil majors have started to cut expenditure leading to fewer orders for deep water rigs. In addition, a number of offshore rigs and supply vessels delivered in past months have not secured contracts for lease yet. Under such challenging circumstances, some customers may delay or refuse to accept delivery of vessels upon completion. Coupled with the shift in payment structure from progressive payment to back-end loaded payment upon delivery, this will adversely impact the cash flow of the Group. As there are maintenance costs to be incurred in the up-keeping of completed vessels, the longer the lead time to find alternative buyers would result in a greater negative impact to the bottom line of the Group. FLUCTUATIONS IN THE BALTIC DRY INDEX (“BDI”) The BDI is a benchmark of the dry bulk shipping industry and is an indication of the price of moving major raw materials by sea. It is generally recognised as an economic indicator of the movement and volume of global trade. An increase in the BDI is generally considered to indicate an increase in demand for dry bulk shipping, whereas a decrease in the BDI is generally considered to indicate a decrease in demand for dry bulk shipping, and the capital expenditure of dry bulk shipping companies are usually driven mainly by the BDI outlook. Corporate Governance and Transparency In recent years, the dry bulk shipping index has recorded historical lows as the shipping industry is experiencing excess capacity thereby leading to lower charter rates. The fluctuations in the BDI result in an uncertain outlook for the dry bulk shipping industry, which typically has an impact on vessel owners’ willingness to place new orders for bulk carrier vessels, which in turn affects demand for the Group’s services and products. A number of strategies have been implemented to mitigate these risks including management oversight of operating performance and project delivery through regular executive management briefings, increased effectiveness of procurement initiatives to reduce unit costs and improvements in delivery times of projects. The Group also has in place a selection process for contractors, suppliers and vendors and also regularly monitors those who have been selected. 2. INTERNAL RISKS Internal risks are those arising from factors primarily within the Group’s control, including from the Group structure and processes. INFORMATION TECHNOLOGY INFRASTRUCTURE The Group depends on accurate, timely information and numerical data from key software application to aid dayto-day business and decision making. Any disruption caused by failings in these systems, of underlying equipment or of communication networks could delay or otherwise impact the Group’s day- to-day business and decision making and have materially adverse effects on the Group’s performance. OPERATIONAL PERFORMANCE AND PROJECT DELIVERY Failure to meet production targets can result in increased unit costs, which are pronounced at operations with higher levels of fixed costs. Unit costs may exceed forecasts, adversely affecting performance and the results of operations. Failure to meet project delivery times and production budgets could have a negative effect on operational performance and lead to increased costs or reductions in revenue and profitability. In addition, the Group faces third party risks of underperforming and non-performing contractors, suppliers or vendors affecting the Group’s ability to execute its projects as planned, resulting in delays and cost overruns. These effects are compounded when substitute suppliers or vendors are not easily available, particularly for specialised or customised equipment. The Group has also established an enterprise technology standards system under the guidance of Singaporean and South Korean experts to enhance the basic design and detailed design of ships and marine engineering products. EMPLOYEES The Group depends on the continued contributions of its executive officers and employees, both individually and as a group. While the Group reviews its people policies on a regular basis and invests significant resources in training and development and recognising individuals with high potential, there can be no guarantee that it will be able to attract, develop and retain these individuals at an appropriate cost and ensure that the capabilities of the Group’s employees meet its business needs. Any failure to do so may affect the Group’s performance. The ability to recruit, develop and retain appropriate skills for the Group is made difficult by competition for skilled labour. The failure to retain skilled employees or to recruit new staff may lead to increased costs, interruptions to existing operations and delays in existing and new projects. A number of strategies are implemented to mitigate this risk including attention to an appropriate suite of reward and benefit structures and ongoing refinement of the Group as an attractive employee proposition. Annual Report 2014 65 Corporate Governance and Transparency Risk Management MANAGING COST OF WAGES THROUGH OUTSOURCING Ship repair is a labor-intensive industry and an increase in wages will have a significant impact on the Group. The Group had been encountering increases in labour cost. Other than having a permanent work force of skilled employees on the payroll, the Group has adopted a contract hiring system where unskilled or semiskilled manpower is hired on a contractual basis and paid according to projects undertaken. While this has benefited the Group because of the decrease in fixed manpower costs, there is a risk of failure by these third parties to deliver on their contractual commitments, which may adversely impact the Group’s reputation and performance. RAW MATERIALS The Group depends upon the availability, quality and cost of steel and steel-plates from around the world, which exposes it to price, quality and supply fluctuations. Although the Group will take measures to protect against the short-term impacts of these fluctuations and of the concentration of supply, there is no guarantee that these will be effective. A failure to recover higher costs of shortfalls in availability of materials of the appropriate quality could materially and adversely affect the Group’s performance. The Group manages this risk through constant monitoring of the markets in which it operates and continuous review of capital expenditure programmes to ensure they reflect market conditions. A continuous focus on operating expenditure is also an important method of mitigating this risk. The Group has developed uniform processes and procedures with applications such as SAP to manage procurement of raw materials. The Group also has developed strategic alliances with certain selected major steel mills and other leading companies on the purchase of steel supply, bunker, marine valves, boilers, engines and other related equipment to mitigate risks in such supplies. 66 COSCO Corporation (Singapore) Limited 3. FINANCIAL RISKS The Group’s activities expose it to a variety of financial risks: market risk (including currency risk, interest rate risk and price risk), credit risk and liquidity risk. Risk management is carried out under policies approved by the Board of Directors. The Board approves guidelines for overall risk management, as well as policies covering these specific areas. MANAGING CURRENCY FLUCTUATION The main financial risks facing the Group are fluctuations in foreign currency, interest rate risk, availability of financing to meet the Group’s needs and default by counterparties and customers. Any of these financial risks may materially and adversely impact the Group’s business, financial condition, results of operation and prospects. The Group has established a management system to address financial risks. Fluctuations in currency exchange rates are closely monitored. The Group at its discretion may employ simple forward hedging on a systematic approach to meet its financial obligations and both foreign and local currencies needs. The Group does not engage in speculative foreign investments. Strict compliance controls are in place to ensure that procedures are adhered to and management decisions are not made unilaterally. The Group also engaged the guidance of the holding company in managing its foreign exchange risk exposure. The holding company has an experienced Treasury operations team responsible for managing the funding requirements and liquidity risks. A detailed disclosure of the Group’s financial risks can be found on pages 133 to 140 in the Notes to the Financial Statements. Inside COSCO and Corporate Citizenship Research and Development As one of the majors in the marine industry, COSCO is mindful that innovation is vital to eventual success in the ever-changing and dynamic maritime sector. Our extensive research and development efforts have enabled us to produce innovative solutions, as we seek to enhance our broad range of modern shipbuilding and marine engineering capabilities. Spearheading the research and development (R&D) activities is our COSCO Shipyard Technology Centre. With satellite offices in our COSCO Shipyard Group headquarters and various shipyards, it staffs over 1,600 research professionals. The Technology Centre primarily engages in the R&D of oil and gas-related products and technologies. It also undertakes design of specialised vessels and marine engineering products. The R&D Centres in Nantong and Qidong shipyards, designated as National Level Training Centres in 2011 and 2013 respectively, designs marine engineering projects, such as cylindrical rigs, semi-submersible rigs, FPSOs and wind turbine installation vessels. At Dalian Shipyard Technology Centre, the team engages in design work for FPSO conversion, jack-up rigs, LNG carriers and platform support vessels, among other things. Concurrently, our supporting enterprises work together with the shipyards to develop designs of complementary products such as the jack-up drilling platform’s lift system and single-point mooring systems. With dedicated R&D capabilities, we endeavour to manufacture and patent innovative, efficient, reliable and industry-leading products. These activities augment our core operations, allowing us to offer more value-add in our services. R&D Endeavours in 2014 Despite challenging business, operational and global economic conditions throughout the year, COSCO was able to secure various contracts spanning ship repair, ship building and marine engineering. This is a testament to our range of modern expertise. In March 2014, our COSCO Nantong Shipyard delivered a pipelay heavy lift vessel to SapuraKencana Petroleum in Malaysia. Named “SapuraKencana 1200”, the vessel is designed for operations in oil piping processing, laying, installation, and heavy lifting. Classed by the American Bureau of Shipping (ABS), this vessel is equipped with a DP3 dynamic positioning system which allows heavylifting installation of large-scale offshore structures like platform blocks, modules and jackets, as well as S-type pipe laying operations in water depths of up to 1,500 metres. With a design draft of 7.5 metres and a lifting capacity of 1,300 tonnes, “SapuraKencana 1200” also operates in shallow waters of up to 200 metres with a ten-point mooring system. Annual Report 2014 67 Inside COSCO and Corporate Citizenship Research and Development In the same month, COSCO Dalian Shipyard commenced the building of China’s first 28,000 m³ LNG carrier. This eco-friendly LNG carrier uses a cutting-edge C-type tank and a dual-fuel propulsion system that is safer, reliable and efficient. COSCO’s eco-friendly “green” ships have received the Green Ship II certification issued by the China Classification Society (CCS). In April 2014, the wind turbine installation vessel, “Sea Challenger,” was delivered by our Nantong shipyard to Danish company A2SEA. Together with “Sea Installer,” both were built by COSCO Nantong Shipyard and are the first of their kind to have been designed and built in China. These third-generation wind turbine installation vessels are efficient for one person to complete jackup operations using the remote-controlled seawater lifting device, navigation, and DP2 dynamic positioning. Equipped with advanced steerable thrusters, these vessels have enhanced mobility, enabling them to make a 180-degree turn in approximately 5 to 6 seconds. “Sea Challenger” and “Sea Installer” have both successfully accomplished wind turbine installation works in the UK sector of the North Sea. They meet both DNV offshore construction specifications and Danish maritime standards, and have been awarded the DNV class notation “Clean Design”. COSCO also achieved another engineering design milestone over the year. We designed for Maersk the world’s largest and most advanced deepwater offshore installation vessel. Using electric propulsion, it will be equipped with a 400 tonne crane folding arm and a DP3 dynamic positioning system. This state-of-the-art vessel will be able to undertake subsea engineering installation, maintenance and repair at depths of up to 3,000 metres. 68 COSCO Corporation (Singapore) Limited Accolades In June 2014, COSCO Shipyard was recognised by the Ministry of Industry and Information Technology of the People’s Republic of China (PRC) for their R&D on the jack-up drilling platform lift system. In October 2014, COSCO Nantong Shipyard’s research patent for the rotating closure of a floating drilling production platform won the 16th China Patent Gold Award. COSCO Dalian Shipyard has also garnered accolades for its series of FPSO conversion works, winning the first prize in the Liaoning Excellence New Product Award in November 2014. COSCO Shanghai Shipyard has also obtained national patents for a number of products including the lashing and transportation for the offshore module supporting device, miniature global navigation satellite systems and low interference communications for offshore vessels. Navigating forward As we continue to move up the value chain, we are committed to enhance our R&D capabilities, especially in our marine engineering sector. We aim to invest in human capital through continuous intensive training and in new technology, to facilitate discovery and innovation. Cognisant of the changes in our industry, we seek to expand our operational areas and advance our expertise to meet the evolving needs of our international clientele. Inside COSCO and Corporate Citizenship Human Resource and Workplace Safety Human Resources Fostering Potential Skilled and motivated employees form the backbone of success for every corporation. Our comprehensive human resources strategy aims to nurture and maximise the potential of our employees. At COSCO, carefully structured programmes encompassing recruitment, training, incentives, compensation and benefits are put in place to equip our people with the right skills and competencies to execute their jobs. Investing in human capital – Recruitment and continuous learning As a leading marine conglomerate, we recognise the key role a quality workforce plays. We strive to recruit and retain talent by way of competitive remuneration, reward schemes, regular reviews and performance appraisals. Each year, we place top graduates from highly regarded Chinese universities in management trainee courses in preparation for future management roles. We track their progress closely and assist them in achieving their career and personal goals as they grow with the company. In our dynamic industry, we recognise that skills need to be updated and upgraded. As an advocate of continuous learning, we regularly send our employees on courses related to international standards and safety measures, technical, engineering as well as management skills. Technical staff are assessed annually to ensure their skills meet the necessary standards. In addition, COSCO organises training courses for our senior technical management staff to strengthen and reinforce their knowledge and expertise. Valuing employees – Reward and retention As a far-sighted employer, we seek to develop our Group as an employer of choice through open dialogue, fair management, sharing of responsibilities and decisionmaking, and the institution of a performance and achievement appraisal system. Through this system, we aim to align employee work goals with personal career development and remuneration. COSCO further strengthened the management team’s capability over the year in review. Top management officers and middle level managers from COSCO Shipyard Group’s headquarters and subordinate enterprises had undergone job rotation to broaden their exposure to various business lines. In addition, marine engineering professionals were staffed to complement the strengths of the existing team. Outlook In 2015, we will further improve our appraisal and career development system. We will enhance management team exchanges among different shipyards. At the same time, we will improve training programmes for middle level management in the areas of technology, production, quality control and procurement. Our human resources policies have been successful and as we embark on 2015, we will continue with the effective management of our workforce of contract and permanent staff. Workplace Safety Workplace safety awareness Safety is a basic right and our number one value. Our first and foremost responsibility is protecting our workers. To ensure the safety of all our employees and stakeholders, COSCO has an established system of safety regimes aimed at inculcating a strong culture of safety in the workplace. All shipyard staff undergo workplace safety training courses designed to identify potential workplace hazards and to be instructed on precautionary safety measures. The courses ensure all shipyard workers are fully aware of the risks and consequences associated with dangerous behaviour and that they comply with safety regulations. To ensure fundamental levels of proficiency and understanding, assessments are conducted on a regular basis. New hires will have to complete mandatory training courses and pass relevant examinations prior to commencing their duties. COSCO adopts training plans and training matrix such as Behaviour-based Safety (BBS) and Job Safety Analysis (JSA) for risk management personnel. Workers in high-risk specialised trades must undergo additional safety training specific to their fields. In 2014, a total of 333 specialist training courses and 98 theory tests were conducted. Annual Report 2014 69 Inside COSCO and Corporate Citizenship Human Resource and Workplace Safety The annual “Safety Month” was launched in June 2014 for staff and workers of all levels across COSCO shipyards in China. The aim of the campaign is to promote safety awareness, improve safety development, refine operation standards and enhance the staff’s skill base. occupational health and safety. In addition, we have also adopted and put into practice the DuPont’s Felt Leadership framework so as to actively build a safety culture on the ground. In 2014, 89 major safety exercises and 409 on-site inspections were conducted at the shipyards. COSCO Nantong Shipyard and COSCO Qidong Shipyard conducted radioactive emergency and heatstroke rescue drills, CPR training, emergency rescue and other specialised training to assess and manage risk associated with catastrophes and force majeure. In 2014, we released the “COSCO Shipyard Group Typhoon Contingency Guidelines”. Our preemptive research, planning and deployment of typhoon contingency measures ensure all business units are well prepared to handle disruptions caused by inclement weather conditions. To further improve our offshore marine safety management system, COSCO Nantong Shipyard and COSCO Dalian Shipyard are now adopting the SMSA framework to keep up with the best practices of major oil companies. In June 2014, COSCO Dalian Shipyard and COSCO Qidong Shipyard passed stringent safety audits to qualify as suppliers for Total S.A. and Shell Global Solutions International B.V. In July 2014, COSCO Nantong Shipyard was recognised by the State Administration of Work Safety (SAWS) as a model enterprise for its outstanding achievements and standards in occupational safety, health and security. During the year in review, COSCO Nantong Shipyard also won, for the fifth consecutive year, honorary awards in a national competition jointly administered by the AllChina Federation of Trade Unions and SAWS. Upholding safety standards Activities to promote safety standards are undertaken year-round. Besides the “Safety Month” in June, we carry out regular safety education and training. Weekly mandatory training sessions are held to discuss the latest safety rules and regulations. During these sessions, we also carry out live demonstrations of safety measures as well as assessment tests to evaluate participants’ proficiency and readiness. We have also implemented a grading system in the safety management officers’ course, providing an additional avenue for front-line safety personnel to monitor and manage the safety of each individual shipyard. To further bolster standards, external consultancies are engaged to evaluate safety standards among various departments in COSCO, and award certifications in the areas of work environment quality and workplace safety. COSCO adopts industry best practices and complies with international safety standards. We have established our safety management system in accordance with the requirements of the OHSAS 18000 occupational health and safety management system standards to ensure 70 COSCO Corporation (Singapore) Limited Environmental safety As one of the largest shipyard operations in China, we are always keeping a keen eye on our ecological footprints. Our Safety Committee, established in 2009, conducts regular site visits to all our shipyards to ensure that safety requirements are strictly adhered to. We also implement action plans that minimise detrimental effects to the environment. Our equipment and tools are inspected and sent for monthly maintenance while upgrades to facilities and equipment are carried out regularly to cut down on resource wastage due to inefficiencies. Medical welfare benefits As a people-oriented company, COSCO is fully committed to the well being of our staff. Our on-site medical facilities at every shipyard, annual health checks and medical welfare benefits such as medical insurance, hospitalisation and dental benefits ensures our staff are well taken care of. The year ahead In 2015, we will maintain our focus on upholding safety standards and continue providing a safe and healthy work environment for the workforce. Looking beyond shipyard safety, we will continue with our on-ship safety regime for our bulk carrier fleet by sending crew for regular training on piracy prevention and management, and management of smuggling, pollution, fire, collision, personal injury and typhoon disasters. We will also seek to enhance our ship tracking, monitoring and inspection operations, and information exchange among all onshore and offshore departments and crew. Inside COSCO and Corporate Citizenship Corporate Social Responsibility Captain Wu receiving a token of appreciation from Prime Minister Lee Hsien Loong at the 2014 SCO Fundraising Gala Dinner and Concert. Overview At COSCO, we strongly believe that an organisation with a significant market presence and impact should embody a socially responsible corporate culture. With this conviction, we have adopted industry best practices throughout our organisation and leveraged on our established standing to influence standards on corporate social engagement. In the long-term, the alignment of business strategy and operations with socially responsible practices strengthens our corporate culture and brand identity. It also generates both tangible and intangible benefits for all our stakeholders including shareholders, business partners, employees, customers, suppliers, communities and the environment. Social Contributions COSCO actively engages charities in the communities we work in. Through various charitable events and activities, we aim to develop relationships, support worthy causes, and take on diverse roles to serve specific local needs. Promoting the spirit of volunteerism, we encourage our employees to get involved in their local charities and give back to the community. Singapore One of the charities we have been earnestly supporting is the Yellow Ribbon Project. In 2014, we donated S$10,000 to the Yellow Ribbon Fund at the annual fund raising event. COSCO has also been a patron to the Singapore Chinese Orchestra for the past three years. In 2014, we, donated S$20,000 at its 2014 Fundraising event. China In China, youth social development is an issue we are committed to. Over the years, COSCO’s group of companies in China has been involved in campaigns that advocate education and youth social welfare. Since 2011, COSCO Zhoushan Shipyard’s Youth League Committee has been organising educational programmes to support students in remote areas and providing counselling services. Over the year in review, COSCO Shanghai Shipyard was involved in several Corporate Social Responsibility initiatives such as the annual donation drive and a blood donation campaign. Workers at COSCO Dalian Shipyard also visited the elderly and physically challenged villagers in Wafangdian City, Dalian. In addition, COSCO Guangdong Shipyard has established family support services for workers’ families. Nantong Diesel trade unions initiated a micro-donation scheme—one dollar to build one dream—to support the children of workers with financial difficulties to complete their education. In August, COSCO Nantong Shipyard organised an emergency blood donation drive to aid burn victims from a major explosion which occurred at a metal factory in Kunshan, Jiangsu. Over 2014, COSCO Shipyard Group and its affiliated unions have contributed over RMB2.0 million in funds and made over 400 visits to underprivileged employees. Annual Report 2014 71 Inside COSCO and Corporate Citizenship Corporate Social Responsibility Supporting Arts and Culture Our shipyards also support the arts and cultural activities with the objective of promoting work-life balance among workers. COSCO Nantong Shipyard has conducted photography, calligraphy and aerobics classes, while COSCO Zhoushan Shipyard organised annual sports events for workers. COSCO Dalian Shipyard has organised recreational games to enhance workplace camaraderie. as tests from owners have shown. To date, COSCO Zhoushan Shipyard has secured over eight bulbous bow conversions jobs from European owners. The “COSCO Summer Night” event organised by COSCO Guangdong shipyard, is a series of activities including outdoor movies, talks on morals and ethics, the annual Mooncake festival, and large scale family activities. This strengthens camaraderie among workers and their families. The Youth League Committee at our Guangdong shipyard has been organising internal development training programmes to spur workers’ creativity. Meanwhile, COSCO Shanghai Shipyard has also formed a choir to represent the company in many choral competitions. Through their adoption of dust control measures during cutting and welding, COSCO Shanghai Shipyard was able to reinforce the yard’s environmental awareness, as well as its ability to carry through pro-environmental measures. Many experts have since lauded the yard as an eco-friendly manufacturer. This recognition is a testament to the yard’s efforts in environment protection, emission control and eco-friendly manufacturing. The Shanghai shipyard has always had a strong sense of environmental and social responsibility, never compromising the environment for their business performance. Environmental Awareness Environmental awareness and pro-environmental measures are essential to building a sustainable future for all communities. COSCO recognises this and is committed to fulfil our responsibility as a corporate citizen through technological innovation, eco-friendly operations and environmentally-sound business practices. As an internationally established shipbuilder, COSCO aims to build ships that are cost and energy efficient. Our COSCO Zhoushan Shipyard has established a track record for successful bulbous bow conversions which could potentially reduce fuel consumption by up to 6%, 72 COSCO Corporation (Singapore) Limited Meanwhile, the research centre of COSCO Shipyard Group has been working on solar energy application technology. With this technology, COSCO has developed COSCO Teng Fei, the largest ship in the world to use an off-grid solar Photo-Voltaic (PV) system. Conclusion Understanding the symbiotic relationship between our business and the larger social and physical environment, COSCO remains dedicated to high standards of Corporate Social Responsibility. Moving into a new year, we will press on with our social involvement and operate in a way that benefits the health, welfare and safety of our employees, customers, communities and the ecological system. FINANCIAL STATEMENTS 74 78 79 80 81 82 83 84 85 148 Directors’ Report Statement by Directors Independent Auditor’s Report Consolidated Profit or Loss Consolidated Statement of Comprehensive Income Balance Sheets Consolidated Statement of Changes in Equity Consolidated Statement of Cash Flows Notes to the Financial Statements Five-Year Summary 149 150 Shareholding Statistics Notice of Annual General Meeting Proxy Form for Annual General Meeting Notes for Proxy Form Financial Statements DIRECTORS’ REPORT For the financial year ended 31 December 2014 The directors present their report to the members together with the audited financial statements of the Group for the financial year ended 31 December 2014 and the balance sheet of the Company as at 31 December 2014. Directors The directors of the Company in office at the date of this report are as follows: Li Yun Peng Wu Zi Heng Liu Lian An Liang Yan Feng (appointed on 8 July 2014) Ma Zhi Hong Tom Yee Lat Shing Wang Kai Yuen Er Kwong Wah Ang Swee Tian Ma Hong Han (alternate director to Ma Zhi Hong) Li Man (alternate director to Li Yun Peng) Ouyang Chao Mei (alternate director to Liang Yan Feng, appointed on 8 July 2014) Arrangements to enable directors to acquire shares and debentures Neither at the end of nor at any time during the financial year was the Company a party to any arrangement whose object was to enable the directors of the Company to acquire benefits by means of the acquisition of shares in, or debentures of, the Company or any other body corporate, other than as disclosed under “Share options” on pages 75 and 76 of this report. Directors’ interests in shares or debentures (a) According to the register of directors’ shareholdings, none of the directors holding office at the end of the financial year had any interest in the shares or debentures of the Company or its related corporations, except as follows: The Company (No. of ordinary shares) Holdings registered in name of director or nominee At At 31.12.2014 1.1.2014 Tom Yee Lat Shing Wang Kai Yuen Er Kwong Wah Ang Swee Tian 1,400,000 900,000 650,000 130,000 1,400,000 900,000 650,000 130,000 Holdings in which director is deemed to have an interest At At 31.12.2014 1.1.2014 – 100,000 – 5,000 – 100,000 – 5,000 Number of unissued ordinary shares under option At At 31.12.2014 1.1.2014 Related corporation China COSCO Holdings Company Limited - Share Appreciation Rights Li Yun Peng Ma Hong Han Li Man 74 COSCO Corporation (Singapore) Limited 1,630,000 60,000 200,000 1,630,000 60,000 200,000 Financial Statements DIRECTORS’ REPORT For the financial year ended 31 December 2014 Directors’ interests in shares or debentures (continued) (b) According to the register of directors’ shareholdings, none of the directors holding office at the end of the financial year had interests in the options to subscribe for ordinary shares of the Company granted pursuant to the COSCO Group Employees’ Share Option Scheme 2002 under “Share options” on pages 75 and 76 of this report. (c) The directors’ interests in the ordinary shares and share options of the Company as at 21 January 2015 were the same as those as at 31 December 2014. Directors’ contractual benefits Since the end of the previous financial year, no director has received or become entitled to receive a benefit by reason of a contract made by the Company or a related corporation with the director or with a firm of which he is a member or with a company in which he has a substantial financial interest, except as disclosed in the accompanying financial statements and in this report, and except that certain directors have employment relationships with the ultimate holding corporation or related corporations, and have received remuneration in those capacities. Share options (a) COSCO Group Employees’ Share Option Scheme 2002 The COSCO Group Employees’ Share Option Scheme 2002 (the “Scheme 2002”) was approved by members of the Company at an Extraordinary General Meeting on 8 May 2002. Under the Scheme 2002, share options to subscribe for the ordinary shares of the Company are granted to directors, key management personnel and employees. The exercise price of the granted options is determined at the average of the closing prices of the Company’s ordinary shares as quoted on the Singapore Exchange for the five market days immediately preceding the date of the grant. The options may be exercised in full or in part in respect of 1,000 shares or a multiple thereof, on the payment of the exercise price. The persons to whom the options have been issued have no right to participate by virtue of the options in any share issue of any other company. The Group has no legal or constructive obligation to repurchase or settle the options in cash. The aggregate number of shares over which options may be granted on any date, when added to the number of shares issued and issuable in respect of all options granted under the Scheme, shall not exceed 15% of the issued shares of the Company on the day preceding that date. Options issued to directors and employees who have been in the service of the Company, subsidiary or associated company, or the holding corporation for at least one year on or prior to the date of the grant, may be exercised twelve months after the date of grant but before the end of one hundred and twenty months. For employees and directors who are in the service of the associated company and non-executive directors, the options shall expire at the end of sixty months. Options issued at a discount to market price, may only be exercised two years after the date of the grant. Options issued to directors and employees who have been in the service of the Company, subsidiary or associated company, or the holding corporation for at least six months but less than one year on or prior to the date of grant, may be exercised twenty-four months after the date of the grant but before the end of one hundred and twenty months. For employees and directors who are in the service of the associated company and non-executive directors, the options shall expire at the end of sixty months. Options issued at a discount to market price, may only be exercised three years after the date of the grant. Particulars of the options granted pursuant to the Scheme 2002 in 2006, 2007 and 2008 known as “2006 Options”, “2007 Options” and “2008 Options” respectively were set out in the Directors’ Report for the financial years ended 31 December 2006, 31 December 2007 and 31 December 2008 respectively. Annual Report 2014 75 Financial Statements DIRECTORS’ REPORT For the financial year ended 31 December 2014 Share options (continued) (a) COSCO Group Employees’ Share Option Scheme 2002 (continued) The Remuneration Committee administering the Scheme 2002 comprises the following directors: Er Kwong Wah (Chairman) Wu Zi Heng Tom Yee Lat Shing Wang Kai Yuen Ang Swee Tian Details of the options granted to directors of the Company are as follows: Aggregate Aggregate Aggregate granted since exercised since lapsed since commencement commencement commencement of Scheme of Scheme of Scheme 2002 to 2002 to 2002 to 31.12.2014 31.12.2014 31.12.2014 Name of directors Tom Yee Lat Shing Wang Kai Yuen Er Kwong Wah 2,200,000 2,200,000 2,200,000 6,600,000 1,900,000 1,900,000 1,600,000 5,400,000 Aggregate outstanding as at 31.12.2014 300,000 300,000 600,000 1,200,000 – – – – No options have been granted during the financial year. No options have been granted to controlling shareholders of the Company or their associates (as defined in the Listing Manual of the Singapore Exchange Securities Trading Limited). No participant under the Scheme 2002 has received 5% or more of the total number of shares under option available under the Scheme 2002. There were no shares of the Company allotted and issued by virtue of the exercise of options to take up unissued shares of the Company during the financial year. There were no unissued shares of the subsidiaries under option at the end of the financial year. (b) Share options outstanding The number of unissued ordinary shares of the Company under option in relation to the Scheme 2002 outstanding at the end of the financial year was as follows: 2006 Options 2007 Options 2008 Options 76 Number of unissued ordinary shares at 1.1.2014 ’000 Number of unissued ordinary shares lapsed during the financial year ’000 Number of unissued ordinary shares at 31.12.2014 ’000 550 3,750 8,910 13,210 – (300) (500) (800) 550 3,450 8,410 12,410 COSCO Corporation (Singapore) Limited Exercise price $ Exercise period 1.23 2.48 2.95 21.2.2007 - 20.2.2016 5.2.2008 - 4.2.2017 24.3.2009 - 23.3.2018 Financial Statements DIRECTORS’ REPORT For the financial year ended 31 December 2014 Audit Committee The members of the Audit Committee at the end of the financial year were as follows: Tom Yee Lat Shing (Chairman) Wang Kai Yuen Er Kwong Wah Ang Swee Tian Non-Executive Non-Executive Non-Executive Non-Executive Lead Independent Independent Independent Independent All members of the Audit Committee were non-executive directors. The Audit Committee carried out its functions in accordance with Section 201B(5) of the Singapore Companies Act. In performing those functions, the Committee reviewed: the scope and the results of internal audit procedures with the internal auditor; the audit plan of the Company’s independent auditor and any recommendations on internal accounting controls arising from the statutory audit; the assistance given by the Company’s management to the independent auditor; and the balance sheet of the Company and the consolidated financial statements of the Group for the financial year ended 31 December 2014 before their submission to the Board of Directors, as well as the Independent Auditor’s Report on the balance sheet of the Company and the consolidated financial statements of the Group. The Audit Committee has recommended to the Board that the independent auditor, PricewaterhouseCoopers LLP, be nominated for re-appointment at the forthcoming Annual General Meeting of the Company. Independent auditor The independent auditor, PricewaterhouseCoopers LLP, has expressed its willingness to accept re-appointment. On behalf of the directors WU ZI HENG Director TOM YEE LAT SHING Director 2 March 2015 Annual Report 2014 77 Financial Statements STATEMENT BY DIRECTORS For the financial year ended 31 December 2014 In the opinion of the directors, (a) the balance sheet of the Company and the consolidated financial statements of the Group as set out on pages 80 to 147 are drawn up so as to give a true and fair view of the state of affairs of the Company and of the Group as at 31 December 2014, and of the results of the business, changes in equity and cash flows of the Group for the financial year then ended; and (b) at the date of this statement, there are reasonable grounds to believe that the Company will be able to pay its debts as and when they fall due. On behalf of the directors WU ZI HENG Director 2 March 2015 78 COSCO Corporation (Singapore) Limited TOM YEE LAT SHING Director Financial Statements INDEPENDENT AUDITOR’S REPORT TO THE MEMBERS OF COSCO CORPORATION (SINGAPORE) LIMITED For the financial year ended 31 December 2014 Report on the Financial Statements We have audited the accompanying financial statements of COSCO Corporation (Singapore) Limited (the “Company”) and its subsidiaries (the “Group”) set out on pages 80 to 147, which comprise the consolidated balance sheet of the Group and balance sheet of the Company as at 31 December 2014, and the consolidated profit or loss, statement of comprehensive income, statement of changes in equity and statement of cash flows of the Group for the year then ended, and a summary of significant accounting policies and other explanatory information. Management’s Responsibility for the Financial Statements Management is responsible for the preparation of financial statements that give a true and fair view in accordance with the provisions of the Singapore Companies Act (the “Act”) and Singapore Financial Reporting Standards, and for devising and maintaining a system of internal accounting controls sufficient to provide a reasonable assurance that assets are safeguarded against loss from unauthorised use or disposition; and transactions are properly authorised and that they are recorded as necessary to permit the preparation of true and fair profit and loss accounts and balance sheets and to maintain accountability of assets. Auditor’s Responsibility Our responsibility is to express an opinion on these financial statements based on our audit. We conducted our audit in accordance with Singapore Standards on Auditing. Those standards require that we comply with ethical requirements and plan and perform the audit to obtain reasonable assurance about whether the financial statements are free from material misstatement. An audit involves performing procedures to obtain audit evidence about the amounts and disclosures in the financial statements. The procedures selected depend on the auditor’s judgement, including the assessment of the risks of material misstatement of the financial statements, whether due to fraud or error. In making those risk assessments, the auditor considers internal control relevant to the entity’s preparation of financial statements that give a true and fair view in order to design audit procedures that are appropriate in the circumstances, but not for the purpose of expressing an opinion on the effectiveness of the entity’s internal control. An audit also includes evaluating the appropriateness of accounting policies used and the reasonableness of accounting estimates made by management, as well as evaluating the overall presentation of the financial statements. We believe that the audit evidence we have obtained is sufficient and appropriate to provide a basis for our audit opinion. Opinion In our opinion, the consolidated financial statements of the Group and the balance sheet of the Company are properly drawn up in accordance with the provisions of the Act and Singapore Financial Reporting Standards so as to give a true and fair view of the state of affairs of the Group and of the Company as at 31 December 2014, and of the results, changes in equity and cash flows of the Group for the year ended on that date. Report on other Legal and Regulatory Requirements In our opinion, the accounting and other records required by the Act to be kept by the Company and by those subsidiaries incorporated in Singapore, of which we are the auditors, have been properly kept in accordance with the provisions of the Act. PricewaterhouseCoopers LLP Public Accountants and Chartered Accountants Singapore, 2 March 2015 Annual Report 2014 79 Financial Statements CONSOLIDATED PROFIT OR LOSS For the financial year ended 31 December 2014 Note 2014 $’000 2013 $’000 4 5 4,260,705 (3,969,664) 291,041 3,508,134 (3,186,946) 321,188 7(a) 7(b) 106,946 5,036 127,556 (17,418) 5 5 8 (84,182) (173,696) (127,697) (66,523) (193,423) (110,845) Share of (loss)/profit of associated companies Profit before income tax 20 (197) 17,251 407 60,942 Income tax credit/(expense) Net profit 9(a) 9,026 26,277 (8,157) 52,785 20,893 5,384 26,277 30,615 22,170 52,785 0.93 0.93 1.37 1.37 Sales Cost of sales Gross profit Other income Other gains and losses Expenses - Distribution - Administrative - Finance Profit attributable to: Equity holders of the Company Non-controlling interests Earnings per share attributable to equity holders of the Company (expressed in cents per share) - Basic earnings per share - Diluted earnings per share 10(a) 10(b) The accompanying notes form an integral part of these financial statements. 80 COSCO Corporation (Singapore) Limited Financial Statements CONSOLIDATED STATEMENT OF COMPREHENSIVE INCOME For the financial year ended 31 December 2014 Note Net profit 2014 $’000 2013 $’000 26,277 52,785 249 53,105 53,354 (92) 118,317 118,225 79,631 171,010 54,373 25,258 79,631 99,053 71,957 171,010 Other comprehensive income: Items that may be reclassified subsequently to profit or loss: Available-for-sale financial assets - Fair value gains/(losses) Currency translation differences arising from consolidation Other comprehensive income, net of tax 31(b)(v) 31(b)(iii) Total comprehensive income Total comprehensive income attributable to: Equity holders of the Company Non-controlling interests The accompanying notes form an integral part of these financial statements. Annual Report 2014 81 Financial Statements BALANCE SHEETS AS AT 31 December 2014 The Group The Company 2014 2013 $’000 $’000 Note 2014 $’000 2013 $’000 11 12 13 14 15 1,560,803 – 4,563,805 1,041,695 177,515 7,252 21,429 7,372,499 2,028,397 770 2,911,828 1,046,764 208,366 – 15,235 6,211,360 46,434 – 31,141 – – – 164 77,739 54,408 – 31,758 – – – 176 86,342 4,377 4,841 303 4,736 – 10,990 2,267,057 9,564 3,029 267,901 2,572,798 36,874 4,391 303 4,826 – 11,293 2,227,868 9,539 3,066 225,212 2,523,372 – – 82 – 371,644 – 647 – – – 372,373 – – 88 – 370,988 – 768 – – – 371,844 9,945,297 8,734,732 450,112 458,186 2,632,163 53,932 2,430,304 56,166 5,172,565 2,695,911 25,288 1,926,065 55,396 4,702,660 17,378 1,569 – – 18,947 18,149 1,531 – – 19,680 2,542,390 837 2,543,227 1,856,463 528 1,856,991 – 704 704 – 398 398 Total liabilities 7,715,792 6,559,651 19,651 20,078 NET ASSETS 2,229,505 2,175,081 430,461 438,108 270,608 284,328 812,819 1,367,755 861,750 2,229,505 270,608 245,139 820,027 1,335,774 839,307 2,175,081 270,608 45,105 114,748 430,461 – 430,461 270,608 45,105 122,395 438,108 – 438,108 ASSETS Current assets Cash and cash equivalents Forward currency contracts Trade and other receivables Inventories Construction contract work-in-progress Income tax receivables Other current assets Non-current assets Trade and other receivables Available-for-sale financial assets Club memberships Investments in associated companies Investments in subsidiaries Investment properties Property, plant and equipment Intangible assets Deferred expenditure Deferred income tax assets 16 17 18 19 20 21 22 23 24 25 29 Total assets LIABILITIES Current liabilities Trade and other payables Current income tax liabilities Borrowings Provisions 27 28 Non-current liabilities Borrowings Deferred income tax liabilities 27 29 EQUITY Capital and reserves attributable to equity holders of the Company Share capital Statutory and other reserves Retained earnings 26 30 31 Non-controlling interests Total equity The accompanying notes form an integral part of these financial statements. 82 COSCO Corporation (Singapore) Limited Financial Statements CONSOLIDATED STATEMENT OF CHANGES IN EQUITY For the financial year ended 31 December 2014 Note 2014 Beginning of financial year Total comprehensive income for the year Non-controlling share of increase in registered capital of a subsidiary Dissolution of a subsidiary Dividend declared by subsidiaries to non-controlling interests of subsidiaries Dividend for 2013 32 Transfer from asset revaluation reserve to retained earnings 31(b)(iv) Transfer from retained earnings to statutory reserves 31(b)(ii) End of financial year 2013 Beginning of financial year Total comprehensive income for the year Dividend declared by subsidiaries to non-controlling interests of subsidiaries Dividend for 2012 Transfer from asset revaluation reserve to retained earnings Transfer from retained earnings to statutory reserves End of financial year Attributable to equity holders of the Company Statutory and other Retained earnings reserves $’000 $’000 Share capital $’000 Noncontrolling interests $’000 Total $’000 820,027 1,335,774 Total Equity $’000 270,608 245,139 – 33,480 20,893 54,373 25,258 79,631 – – – – – – – – 10,679 (2,001) 10,679 (2,001) – – – – – (22,392) – (22,392) (11,493) – (11,493) (22,392) – (2,900) 2,900 – – – – 270,608 8,609 284,328 (8,609) – 812,819 1,367,755 – – 861,750 2,229,505 270,608 152,927 857,971 1,281,506 767,699 2,049,205 – 68,438 30,615 99,053 71,957 171,010 32 – – – – – (44,785) – (44,785) (349) – (349) (44,785) 31(b)(iv) – (3,218) 3,218 – – – 31(b)(ii) – 270,608 26,992 245,139 (26,992) – 820,027 1,335,774 839,307 2,175,081 – – 839,307 2,175,081 The accompanying notes form an integral part of these financial statements. Annual Report 2014 83 Financial Statements CONSOLIDATED STATEMENT OF CASH FLOWS For the financial year ended 31 December 2014 Note Cash flows from operating activities Net profit Adjustments for: - Allowance for impairment of property, plant and equipment - Allowance for impairment of transferable club memberships - Amortisation of deferred expenditure - Depreciation of property, plant and equipment and investment properties - Dividend income - Fair value losses/(gains) on forward currency contracts - Income tax (credit)/expense - Interest expense - Interest income - Allowance for expected losses recognised on construction contracts - Provision for an onerous contract - Write-down of inventories - Net allowance for impairment of trade and other receivables - Loss/(gain) on disposal of property, plant and equipment - Share of loss/(profit) of associated companies - Write-off of property, plant and equipment Changes in working capital: - Inventories and construction contract work-in-progress - Trade and other receivables - Trade and other payables - Other current assets - Provisions for other liabilities - Exchange differences Cash used in operations Income tax paid Net cash used in operating activities Cash flows from investing activities Cash outflow to non-controlling interests on dissolution of a subsidiary Purchase of property, plant and equipment Proceeds from disposal of property, plant and equipment Dividends received Interest received Net cash used in investing activities Cash flows from financing activities Proceeds from borrowings Repayments of borrowings Proceeds from non-controlling interests for increase in registered capital of a subsidiary Decrease in bank deposits pledged Interest paid Dividends paid to equity holders of the Company Dividends paid to non-controlling interests of subsidiaries Net cash provided by financing activities Net (decrease)/increase in cash and cash equivalents Cash and cash equivalents at beginning of financial year Effects of currency translation on cash and cash equivalents Cash and cash equivalents at end of financial year 11 The accompanying notes form an integral part of these financial statements. 84 COSCO Corporation (Singapore) Limited 2014 $’000 2013 $’000 26,277 52,785 163 6 86 153,488 (725) 759 (9,026) 127,697 (45,807) 61,742 25 124,504 25,787 456 197 217 465,846 110 11 86 183,525 (503) (750) 8,157 110,845 (44,712) 85,717 144 23,678 5,228 (666) (407) 469 423,717 (134,427) (1,649,297) (132,908) (6,194) 770 34,846 (1,421,364) (6,307) (1,427,671) (833,616) (160,444) 365,518 (3,370) (323) 89,691 (118,827) (11,598) (130,425) (2,001) (100,632) 3,228 967 49,669 (48,769) – (61,855) 10,620 613 34,451 (16,171) 3,281,016 (2,181,337) 2,103,985 (1,542,339) 10,679 38 (120,822) (22,392) (11,521) 955,661 – 14,207 (110,662) (44,785) (634) 419,772 (520,779) 2,025,040 53,223 1,557,484 273,176 1,675,272 76,592 2,025,040 Financial Statements NOTES TO THE FINANCIAL STATEMENTS For the financial year ended 31 December 2014 These notes form an integral part of and should be read in conjunction with the accompanying financial statements. 1. General information COSCO Corporation (Singapore) Limited (the “Company”) is listed on the Singapore Exchange and incorporated and domiciled in Singapore. The address of its registered office is 9 Temasek Boulevard, #07-00 Suntec Tower Two, Singapore 038989. The principal activities of the Company are those of investment holding. The principal activities of its subsidiaries are set out in Note 21 to the financial statements. 2. Significant accounting policies 2.1 Basis of preparation These financial statements have been prepared in accordance with Singapore Financial Reporting Standards (“FRS”) under the historical cost convention, except as disclosed in the accounting policies below. The preparation of financial statements in conformity with FRS requires management to exercise its judgement in the process of applying the Group’s accounting policies. It also requires the use of certain critical accounting estimates and assumptions. The areas involving a higher degree of judgement or complexity, or areas where assumptions and estimates are significant to the financial statements, are disclosed in Note 3. Interpretations and amendments to published standards effective in 2014 On 1 January 2014, the Group adopted the new or amended FRS and Interpretations of FRS (“INT FRS”) that are mandatory for application for the financial year. Changes to the Group’s accounting policies have been made as required, in accordance with the transitional provisions in the respective FRS and INT FRS. The adoption of these new or amended FRS and INT FRS did not result in substantial changes to the accounting policies of the Group and the Company and had no material effect on the amounts reported for the current or prior financial years except for the following: FRS 112 Disclosures of Interests in Other Entities The Group has adopted the above new FRS on 1 January 2014. The amendment is applicable for annual periods beginning on or after 1 January 2014. It sets out the required disclosures for entities reporting under the new FRS 110 Consolidated Financial Statements and FRS 111 Joint Arrangements, and replaces the disclosure requirements currently found in FRS 27 (revised 2011) Separate Financial Statements and FRS 28 (revised 2011) Investments in Associates and Joint Ventures. The Group has applied FRS 112 retrospectively in accordance with the transitional provisions (as amended subsequent to the issuance of FRS 112 in September 2011) in FRS 112. The Group has incorporated the additional required disclosures into the financial statements. 2.2 Revenue recognition Sales comprise the fair value of the consideration received or receivable for the sale of goods and rendering of services in the ordinary course of the Group’s activities. Sales are presented, net of value-added tax, rebates and discounts, and after eliminating sales within the Group. Annual Report 2014 85 Financial Statements NOTES TO THE FINANCIAL STATEMENTS For the financial year ended 31 December 2014 2. Significant accounting policies (continued) 2.2 Revenue recognition (continued) The Group recognises revenue when the amount of revenue and related cost can be reliably measured, it is probable that the collectability of the related receivables is reasonably assured and when the specific criteria for each of the Group’s activities are met as follows: (a) Rendering of services (i) Ship repair, ship building and marine engineering Revenue from ship repair, ship building, marine engineering, container repairs and services, fabrication work services and production of marine outfitting components is recognised on the percentage-of-completion method based on progress of the contract work, where the outcome of the contract can be estimated reliably. If the contract covers a number of projects and the cost and revenue of such individual projects can be identified within the terms of the overall contract, each such project is treated as a separate contract. Provision is made in full where applicable for expected losses on contracts in progress. Please refer to Note 2.7 “Construction contracts” for the accounting policy on revenue from construction contracts for ship building and marine engineering. (ii) Shipping Revenue from time charter is recognised on the straight-line basis over the period of the time charter agreement. Revenue from voyage charter is recognised rateably over the estimated length of the voyage within the reporting period and ends in the subsequent reporting period. The Group determines the percentage of completion of voyage freight using the discharge-todischarge method. Under this method, voyage revenue is recognised rateably over the period from the departure of a vessel from its original discharge port to departure from the next discharge port. Demurrage is included if a claim is considered probable. Losses arising from time or voyage charters are provided for as soon as they are anticipated. (b) Rental income Rental income from operating leases is recognised on the straight-line basis over the lease term. (c) Sale of scrap materials Income from sale of scrap materials is recognised when the items have been delivered to the customer, the customer has accepted the products and collectibility of the related receivables is reasonably assured. (d) Interest income Interest income is recognised using the effective interest method. (e) Dividend income Dividend income is recognised when the right to receive payment is established. 86 COSCO Corporation (Singapore) Limited Financial Statements NOTES TO THE FINANCIAL STATEMENTS For the financial year ended 31 December 2014 2. Significant accounting policies (continued) 2.3 Group accounting (a) Subsidiaries (i) Consolidation Subsidiaries are all entities (including structured entities) over which the Group has control. The Group controls an entity when the Group is exposed to, or has rights to, variable returns from its involvement with the entity and has the ability to affect those returns through its power over the entity. Subsidiaries are fully consolidated from the date on which control is transferred to the Group. They are deconsolidated from the date on that control ceases. In preparing the consolidated financial statements, transactions, balances and unrealised gains on transactions between group entities are eliminated. Unrealised losses are also eliminated but are considered an impairment indicator of the asset transferred. Accounting policies of subsidiaries have been changed where necessary to ensure consistency with the policies adopted by the Group. Non-controlling interests comprise the portion of a subsidiary’s net results of operations and its net assets, which is attributable to the interests that are not owned directly or indirectly by the equity holders of the Company. They are shown separately in the consolidated profit or loss, statement of comprehensive income, statement of changes in equity and balance sheet. Total comprehensive income is attributed to the non-controlling interests based on their respective interests in a subsidiary, even if this results in the non-controlling interests having a deficit balance. (ii) Acquisitions The acquisition method of accounting is used to account for business combinations by the Group. The consideration transferred for the acquisition of a subsidiary or business comprises the fair value of the assets transferred, the liabilities incurred and the equity interests issued by the Group. The consideration transferred also includes any contingent consideration arrangement and any pre-existing equity interest in the subsidiary measured at their fair values at the acquisition date. Acquisition-related costs are expensed as incurred. Identifiable assets acquired and liabilities and contingent liabilities assumed in a business combination are, with limited exceptions, measured initially at their fair values at the acquisition date. On an acquisition-by-acquisition basis, the Group recognises any non-controlling interest in the acquiree at the date of acquisition either at fair value or at the non-controlling interest’s proportionate share of the acquiree’s identifiable net assets. The excess of (i) the consideration transferred, the amount of any non-controlling interest in the acquiree and the acquisition-date fair value of any previous equity interest in the acquiree over (ii) the fair value of the identifiable net assets acquired is recorded as goodwill. Please refer to Note 2.5 “Intangible assets - Goodwill” for the subsequent accounting policy on goodwill. Annual Report 2014 87 Financial Statements NOTES TO THE FINANCIAL STATEMENTS For the financial year ended 31 December 2014 2. Significant accounting policies (continued) 2.3 Group accounting (continued) (a) Subsidiaries (continued) (iii) Disposals When a change in the Group’s ownership interest in a subsidiary results in a loss of control over the subsidiary, the assets and liabilities of the subsidiary including any goodwill are derecognised. Amounts previously recognised in other comprehensive income in respect of that entity are also reclassified to profit or loss or transferred directly to retained earnings if required by a specific Standard. Any retained equity interest in the entity is remeasured at fair value. The difference between the carrying amount of the retained interest at the date when control is lost and its fair value is recognised in profit or loss. Please refer to Note 2.9 “Investments in subsidiaries and associated companies” for the accounting policy on investments in subsidiaries in the separate financial statements of the Company. (b) Transactions with non-controlling interests Changes in the Group’s ownership interest in a subsidiary that do not result in a loss of control over the subsidiary are accounted for as transactions with equity owners of the Company. Any difference between the change in the carrying amounts of the non-controlling interest and the fair value of the consideration paid or received is recognised within equity attributable to the equity holders of the Company. (c) Associated companies Associated companies are entities over which the Group has significant influence, but not control, generally accompanied by a shareholding giving rise to voting rights of 20% and above but not exceeding 50%. Investments in associated companies are accounted for in the consolidated financial statements using the equity method of accounting less impairment losses, if any. (i) Acquisitions Investments in associated companies are initially recognised at cost. The cost of an acquisition is measured at the fair value of the assets given, equity instruments issued or liabilities incurred or assumed at the date of exchange, plus costs directly attributable to the acquisition. Goodwill on associated companies represents the excess of the cost of acquisition of the associate over the Group’s share of the fair value of the identifiable net assets of the associated company and is included in the carrying amount of the investments. (ii) Equity method of accounting In applying the equity method of accounting, the Group’s share of its associated companies’ post-acquisition profits or losses are recognised in profit or loss and its share of postacquisition other comprehensive income is recognised in other comprehensive income. These post-acquisition movements and distributions received from the associated companies are adjusted against the carrying amount of the investments. When the Group’s share of losses in an associated company equals to or exceeds its interest in the associated company, the Group does not recognise further losses, unless it has legal or constructive obligations to make, or has made, payments on behalf of the associated company. If the associated company subsequently reports profits, the Group resumes recognising its share of those profits only after its share of the profits equals the share of losses not recognised. 88 COSCO Corporation (Singapore) Limited Financial Statements NOTES TO THE FINANCIAL STATEMENTS For the financial year ended 31 December 2014 2. Significant accounting policies (continued) 2.3 Group accounting (continued) (c) Associated companies (continued) (ii) Equity method of accounting (continued) Unrealised gains on transactions between the Group and its associated companies are eliminated to the extent of the Group’s interest in the associated companies. Unrealised losses are also eliminated unless the transactions provide evidence of an impairment of the assets transferred. The accounting policies of associated companies have been changed where necessary to ensure consistency with the accounting policies adopted by the Group. (iii) Disposals Investments in associated companies are derecognised when the Group loses significant influence. If the retained equity interest in the former associated company is a financial asset, the retained equity interest is measured at fair value. The difference between the carrying amount of the retained interest at the date when significant influence is lost, and its fair value and any proceeds on partial disposal, is recognised in profit or loss. Please refer to Note 2.9 “Investments in subsidiaries and associated companies” for the accounting policy on investments in associated companies in the separate financial statements of the Company. 2.4 Property, plant and equipment (a) Measurement (i) Land and buildings Land and buildings are initially recognised at cost. Buildings and leasehold land are subsequently carried at cost less accumulated depreciation and accumulated impairment losses. (ii) Motor vessels Motor vessels are initially recognised at cost and subsequently carried at cost less accumulated depreciation and accumulated impairment losses. The cost of motor vessels includes actual interest incurred on borrowings used to finance the motor vessels while under construction and other direct relevant expenditure incurred in bringing the vessels into operation. For this purpose, the interest rate applied to funds provided for constructing the motor vessels is arrived at by reference to the actual rate payable on borrowings for construction purposes. The capitalisation of interest charges will cease upon the completion and delivery of the motor vessels. (iii) Other property, plant and equipment All other items of property, plant and equipment are initially recognised at cost and subsequently carried at cost less accumulated depreciation and accumulated impairment losses. Annual Report 2014 89 Financial Statements NOTES TO THE FINANCIAL STATEMENTS For the financial year ended 31 December 2014 2. Significant accounting policies (continued) 2.4 Property, plant and equipment (continued) (a) Measurement (continued) (iv) Components of costs The cost of an item of property, plant and equipment initially recognised includes its purchase price and any cost that is directly attributable to bringing the asset to the location and condition necessary for it to be capable of operating in the manner intended by management. Cost also includes borrowing costs that are directly attributable to the acquisition, construction or production of a qualifying asset (Note 2.6). The projected cost of dismantlement, removal or restoration is also recognised as part of the cost of property, plant and equipment if the obligation for the dismantlement, removal or restoration is incurred as a consequence of either acquiring the asset or using the asset for purpose other than to produce inventories. (b) Depreciation Depreciation on other items of property, plant and equipment is calculated using the straight-line method to allocate their depreciable amounts over their estimated useful lives as follows: Leasehold land and buildings Office renovations, furniture, fixtures and equipment Plant, machinery and equipment Motor vehicles Motor vessels Docks and quays Useful lives 10 - 50 years 3 - 5 years 3 - 20 years 5 - 10 years 20 years 40 - 50 years No depreciation is provided for construction-in-progress. The motor vessels are subject to overhauls at regular intervals. The inherent components of the initial overhaul are determined based on the estimated costs of the next overhaul and are separately depreciated over a period of two and a half years in order to reflect the estimated intervals between two overhauls. The costs of the overhauls subsequently incurred are capitalised as additions and the carrying amounts of the replaced components are written off to profit or loss. On 1 January 2014, the Group revised its estimated useful lives of certain assets within leasehold land and buildings, plant and machinery and docks and quays after conducting an operational review of their useful lives. As a result, there was a change in the expected useful lives of these assets. The change in accounting estimate has been applied prospectively subsequent to that date. Accordingly, the adoption of the change in accounting estimate has no effect in prior years. The net book value of property, plant and equipment as at 31 December 2014 has been increased by approximately $37,393,000 and the profit before income tax for the financial year ended 31 December 2014 has been increased by approximately $37,393,000 by way of a decrease in depreciation charge for the financial year as a result of the change. The impact of the change in estimated useful lives for the next five years approximates that of the current financial year. The residual values, estimated useful lives and depreciation method of property, plant and equipment are reviewed, and adjusted as appropriate, at each balance sheet date. The effects of any revision are recognised in profit or loss when the changes arise. (c) Subsequent expenditure Subsequent expenditure relating to property, plant and equipment that has already been recognised is added to the carrying amount of the asset only when it is probable that future economic benefits associated with the item will flow to the Group and the cost of the item can be measured reliably. All other repair and maintenance expenses are recognised in profit or loss when incurred. 90 COSCO Corporation (Singapore) Limited Financial Statements NOTES TO THE FINANCIAL STATEMENTS For the financial year ended 31 December 2014 2. Significant accounting policies (continued) 2.4 Property, plant and equipment (continued) (d) Disposal On disposal of an item of property, plant and equipment, the difference between the disposal proceeds and its carrying amount is recognised in profit or loss within “other gains and losses”. 2.5 Intangible assets Goodwill on acquisitions Goodwill on acquisitions of subsidiaries and businesses on or after 1 January 2010 represents the excess of (i) the sum of the consideration transferred, the amount of any non-controlling interest in the acquiree and the acquisition-date fair value of any previous equity interest in the acquiree over (ii) the fair value of the identifiable net assets acquired. Goodwill on acquisition of subsidiaries and businesses prior to 1 January 2010 and on acquisition of associated companies represents the excess of the cost of the acquisition over the fair value of the Group’s share of the identifiable net assets acquired. Goodwill on subsidiaries is recognised separately as intangible assets and carried at cost less accumulated impairment losses. Goodwill on associated companies is included in the carrying amount of the investments. Gains and losses on the disposal of subsidiaries and associated companies include the carrying amount of goodwill relating to the entity sold, except for goodwill arising from acquisitions prior to 1 January 2001. Such goodwill was adjusted against retained profits in the year of acquisition and is not recognised in profit or loss on disposal. 2.6 Borrowing costs Borrowing costs are recognised in profit or loss using the effective interest method except for those costs that are directly attributable to borrowings acquired specifically for the construction of motor vessels, docks and quays. The actual borrowing costs incurred during the construction period less any investment income on temporary investments of these borrowings, are capitalised in the cost of the docks and quays. 2.7 Construction contracts When the outcome of a construction contract can be estimated reliably, contract revenue and contract costs are recognised as revenue and expenses respectively by reference to the stage of completion of the contract activity at the balance sheet date (“percentage-of-completion method”). When the outcome of a construction contract cannot be estimated reliably, contract revenue is recognised to the extent of contract costs incurred that are likely to be recoverable. When it is probable that total contract costs will exceed total contract revenue, the expected loss is recognised as an expense immediately. Contract revenue comprises the initial amount of revenue agreed in the contract and variations in the contract work and claims that can be measured reliably. A variation or a claim is recognised as contract revenue when it is probable that the customer will approve the variation or negotiations have reached an advanced stage such that it is probable that the customer will accept the claim. The stage of completion is measured by reference to the completion of a physical proportion of the contract work. Costs incurred during the financial year in connection with future activity on a contract are excluded from costs incurred to date when determining the stage of completion of a contract. Such costs are shown as “construction contract work-in-progress” on the balance sheet unless it is not probable that such contract costs are recoverable from the customers, in which case, such costs are recognised as an expense immediately. Annual Report 2014 91 Financial Statements NOTES TO THE FINANCIAL STATEMENTS For the financial year ended 31 December 2014 2. Significant accounting policies (continued) 2.7 Construction contracts (continued) At the balance sheet date, the cumulative costs incurred plus recognised profits (less recognised losses) on each contract is compared against the progress billings. Where the cumulative costs incurred plus the recognised profits (less recognised losses) exceed progress billings, the balance is presented as due from customers on construction contracts within “trade and other receivables”. Where progress billings exceed cumulative costs incurred plus recognised profits (less recognised losses), the balance is presented as due to customers on construction contracts within “trade and other payables”. Progress billings not yet paid by customers and retentions by customers are included within “trade and other receivables”. Advances received are included within “trade and other payables”. 2.8 Investment properties Investment properties include those portions of office buildings that are held for long-term rental yields and/or for capital appreciation. Investment properties are initially recognised at cost and subsequently carried at cost less accumulated depreciation and accumulated impairment losses. Depreciation is calculated using the straight-line method to allocate the depreciable amounts over the estimated useful lives of 10 to 50 years. The residual values, useful lives and depreciation method of investment properties are reviewed, and adjusted as appropriate, at each balance sheet date. The effects of any revision are included in profit or loss when the changes arise. Investment properties are subject to renovations or improvements at regular intervals. The cost of major renovations and improvements is capitalised and the carrying amounts of the replaced components are recognised in profit or loss. The cost of maintenance, repairs and minor improvements is recognised in profit or loss when incurred. On disposal of an investment property, the difference between the disposal proceeds and the carrying amount is recognised in profit or loss. 2.9 Investments in subsidiaries and associated companies Investments in subsidiaries and associated companies are carried at cost less accumulated impairment losses in the Company’s balance sheet. On disposal of such investments, the difference between disposal proceeds and the carrying amounts of the investments are recognised in profit or loss. 2.10 Impairment of non-financial assets (a) Goodwill Goodwill recognised separately as an intangible asset is tested for impairment annually, and whenever there is indication that the goodwill may be impaired. Goodwill included in the carrying amount of an investment in associated company is tested for impairment as part of the investment, rather than separately. For the purpose of impairment testing of goodwill, goodwill is allocated to each of the Group’s cashgenerating unit (“CGU”) expected to benefit from synergies arising from the business combination. An impairment loss is recognised when the carrying amount of a CGU, including the goodwill, exceeds the recoverable amount of the CGU. The recoverable amount of a CGU is the higher of a CGU’s fair value less cost to sell and value-in-use. The total impairment loss of a CGU is allocated first to reduce the carrying amount of goodwill allocated to the CGU and then to the other assets of the CGU pro-rata on the basis of the carrying amount of each asset in the CGU. An impairment loss on goodwill is recognised as an expense and is not reversed in a subsequent period. 92 COSCO Corporation (Singapore) Limited Financial Statements NOTES TO THE FINANCIAL STATEMENTS For the financial year ended 31 December 2014 2. Significant accounting policies (continued) 2.10 Impairment of non-financial assets (continued) (b) Property, plant and equipment Investment properties Investments in subsidiaries and associated companies Property, plant and equipment, investment properties and investments in subsidiaries and associated companies are tested for impairment whenever there is any objective evidence or indication that these assets may be impaired. For the purpose of impairment testing, the recoverable amount (i.e. the higher of the fair value less cost to sell and the value-in-use) is determined on an individual asset basis unless the asset does not generate cash inflows that are largely independent of those from other assets. If this is the case, the recoverable amount is determined for the CGU to which the asset belongs. If the recoverable amount of the asset (or CGU) is estimated to be less than its carrying amount, the carrying amount of the asset (or CGU) is reduced to its recoverable amount. The difference between the carrying amount and recoverable amount is recognised as an impairment loss in profit or loss unless the asset is carried at revalued amount, in which case, such impairment loss is treated as a revaluation decrease. An impairment loss for an asset other than goodwill is reversed only if, there has been a change in the estimates used to determine the asset’s recoverable amount since the last impairment loss was recognised. The carrying amount of this asset is increased to its revised recoverable amount, provided that this amount does not exceed the carrying amount that would have been determined (net of any accumulated amortisation or depreciation) had no impairment loss been recognised for the asset in prior years. A reversal of impairment loss for an asset other than goodwill is recognised in profit or loss, unless the asset is carried at revalued amount, in which case, such reversal is treated as a revaluation increase. However, to the extent that an impairment loss on the same revalued asset was previously recognised as an expense, a reversal of that impairment is also recognised in profit or loss. 2.11 Financial assets (a) Classification The Group classifies its financial assets in the following categories: at fair value through profit or loss, loans and receivables, held-to-maturity, and available-for-sale. The classification depends on the nature of the asset and the purpose for which the assets were acquired. Management determines the classification of its financial assets at initial recognition and in the case of assets classified as held-to-maturity, re-evaluates this designation at each balance sheet date. (i) Financial assets at fair value through profit or loss This category has two sub-categories: financial assets held for trading, and those designated at fair value through profit or loss at inception. A financial asset is classified as held for trading if it is acquired principally for the purpose of selling in the short term. Financial assets designated as at fair value through profit or loss at inception are those that are managed and their performances are evaluated on a fair value basis, in accordance with a documented Group investment strategy. Derivatives are also categorised as held for trading unless they are designated as hedges. Assets in this category are presented as current assets if they are either held for trading or are expected to be realised within 12 months after the balance sheet date. Annual Report 2014 93 Financial Statements NOTES TO THE FINANCIAL STATEMENTS For the financial year ended 31 December 2014 2. Significant accounting policies (continued) 2.11 Financial assets (continued) (a) Classification (continued) (ii) Loans and receivables Loans and receivables are non-derivative financial assets with fixed or determinable payments that are not quoted in an active market. They are presented as current assets, except for those expected to be realised later than 12 months after the balance sheet date which are presented as non-current assets. Loans and receivables are presented as “trade and other receivables” (Note 13) and “cash and cash equivalents” (Note 11) and “other current assets - deposits” (Note 16) on the balance sheet. (iii) Held-to-maturity financial assets Held-to-maturity financial assets are non-derivative financial assets with fixed or determinable payments and fixed maturities that the Group’s management has the positive intention and ability to hold to maturity. If the Group were to sell other than an insignificant amount of held-to-maturity financial assets, the whole category would be tainted and reclassified as available-for-sale. They are presented as non-current assets, except for those maturing within 12 months after the balance sheet date which are presented as current assets. The Group currently does not have any held-to-maturity financial assets. (iv) Available-for-sale financial assets Available-for-sale financial assets are non-derivatives that are either designated in this category or not classified in any of the other categories. They are presented as non-current assets unless the investment matures or management intends to dispose of the assets within 12 months after the balance sheet date. (b) Recognition and derecognition Regular way purchases and sales of financial assets are recognised on trade date - the date on which the Group commits to purchase or sell the asset. Financial assets are derecognised when the rights to receive cash flows from the financial assets have expired or have been transferred and the Group has transferred substantially all risks and rewards of ownership. On disposal of a financial asset, the difference between the carrying amount and the sale proceeds is recognised in profit or loss. Any amount in other comprehensive income relating to that asset is reclassified to profit or loss. Trade receivables that are factored out to banks and other financial institutions with recourse to the Group are not derecognised until the recourse period has expired and the risks and rewards of the receivables have been fully transferred. The corresponding cash received from the financial institutions is recorded as borrowings. (c) Initial measurement Financial assets are initially recognised at fair value plus transaction costs except for financial assets at fair value through profit or loss, which are recognised at fair value. Transaction costs for financial assets at fair value through profit or loss are recognised immediately as expenses. 94 COSCO Corporation (Singapore) Limited Financial Statements NOTES TO THE FINANCIAL STATEMENTS For the financial year ended 31 December 2014 2. Significant accounting policies (continued) 2.11 Financial assets (continued) (d) Subsequent measurement Available-for-sale financial assets and financial assets at fair value through profit or loss are subsequently carried at fair value. Loans and receivables and held-to-maturity financial assets are subsequently carried at amortised cost using the effective interest method. Changes in the fair value of financial assets at fair value through profit or loss including the effects of currency translation, interest and dividends, are recognised in profit or loss when the changes arise. Interest and dividend income on available-for-sale financial assets are recognised separately in profit or loss. Changes in the fair values of available-for-sale debt securities (i.e. monetary items) denominated in foreign currencies are analysed into currency translation differences on the amortised cost of the securities and other changes; the currency translation differences are recognised in profit or loss and the other changes are recognised in other comprehensive income and accumulated in the fair value reserve. Changes in fair values of available-for-sale equity securities (i.e. non-monetary items) are recognised in other comprehensive income and accumulated in the fair value reserve, together with the related currency translation differences. (e) Impairment The Group assesses at each balance sheet date whether there is objective evidence that a financial asset or a group of financial assets is impaired and recognises an allowance for impairment when such evidence exists. (i) Loans and receivables/Held-to-maturity financial assets Significant financial difficulties of the debtor, probability that the debtor will enter bankruptcy, and default or significant delay in payments are objective evidence that these financial assets are impaired. The carrying amount of these assets is reduced through the use of an impairment allowance account which is calculated as the difference between the carrying amount and the present value of estimated future cash flows, discounted at the original effective interest rate. When the asset becomes uncollectible, it is written off against the allowance account. Subsequent recoveries of amounts previously written off are recognised against the same line item in profit or loss. The impairment allowance is reduced through profit or loss in a subsequent period when the amount of impairment loss decreases and the related decrease can be objectively measured. The carrying amount of the asset previously impaired is increased to the extent that the new carrying amount does not exceed the amortised cost had no impairment been recognised in prior periods. (ii) Available-for-sale financial assets In addition to the objective evidence of impairment described in Note 2.11(e)(i), a significant or prolonged decline in the fair value of an equity security below its cost is considered as an indicator that the available-for-sale financial asset is impaired. If any evidence of impairment exists, the cumulative loss that was previously recognised in other comprehensive income is reclassified to profit or loss. The cumulative loss is measured as the difference between the acquisition cost (net of any principal repayments and amortisation) and the current fair value, less any impairment loss previously recognised as an expense. The impairment losses recognised as an expense on equity securities are not reversed through profit or loss. Annual Report 2014 95 Financial Statements NOTES TO THE FINANCIAL STATEMENTS For the financial year ended 31 December 2014 2. Significant accounting policies (continued) 2.11 Financial assets (continued) (f) Offsetting financial instruments Financial assets and liabilities are offset and the net amount reported in the balance sheet when there is a legally enforceable right to offset and there is an intention to settle on a net basis or realise the asset and settle the liability simultaneously. 2.12 Financial guarantees The Company issues corporate guarantees to banks for borrowings of its subsidiaries and third parties for services provided to a subsidiary. These guarantees are financial guarantees as they require the Company to reimburse the banks and third parties if the subsidiaries fail to make principal or interest payments when due in accordance with the terms of their borrowings. Financial guarantees are initially recognised at their fair values plus transaction costs in the Company’s balance sheet. Financial guarantees are subsequently amortised to profit or loss over the period of the subsidiaries’ borrowings, unless it is probable that the Company will reimburse the banks for an amount higher than the unamortised amount. In this case, the financial guarantees shall be carried at the expected amount payable to the banks in the Company’s balance sheet. Intra-group transactions are eliminated on consolidation. 2.13 Borrowings Borrowings are presented as current liabilities unless the Group has an unconditional right to defer settlement for at least 12 months after the balance sheet date, in which case they are presented as noncurrent liabilities. Borrowings are initially recognised at fair value (net of transaction costs) and subsequently carried at amortised cost. Any difference between the proceeds (net of transaction costs) and the redemption value is recognised in profit or loss over the period of the borrowings using the effective interest method. 2.14 Trade and other payables Trade and other payables represent liabilities for goods and services provided to the Group prior to the end of financial year which are unpaid. They are classified as current liabilities if payment is due within one year or less (or in the normal operating cycle of the business if longer). Otherwise, they are presented as noncurrent liabilities. Trade and other payables are initially recognised at fair value, and subsequently carried at amortised cost using the effective interest method. 2.15 Derivative financial instruments and hedging activities A derivative financial instrument is initially recognised at its fair value on the date the contract is entered into and is subsequently carried at its fair value. The method of recognising the resulting gain or loss depends on whether the derivative is designated as a hedging instrument, and if so, the nature of the item being hedged. The Group designates each hedge as fair value hedge. Fair value changes on derivatives that are not designated or do not qualify for hedge accounting are recognised in profit or loss when the changes arise. 96 COSCO Corporation (Singapore) Limited Financial Statements NOTES TO THE FINANCIAL STATEMENTS For the financial year ended 31 December 2014 2. Significant accounting policies (continued) 2.15 Derivative financial instruments and hedging activities (continued) The Group documents at the inception of the transaction the relationship between hedging instruments and hedged items, as well as its risk management objective and strategies for undertaking various hedge transactions. The Group also documents its assessment, both at hedge inception and on an ongoing basis, on whether the derivatives designated as hedging instruments are highly effective in offsetting changes in fair values or cash flows of the hedged items. The carrying amount of a derivative designated as a hedge is presented as a non-current asset or liability if the remaining expected life of the hedged item is more than 12 months, and as a current asset or liability if the remaining expected life of the hedged item is less than 12 months. The fair value of a trading derivative is presented as a current asset or liability. Fair value hedge The Group has not designated any derivatives as hedging instruments during the financial year. 2.16 Fair value estimation of financial assets and liabilities The fair values of financial instruments traded in active markets (such as exchange-traded and over-thecounter securities and derivatives) are based on quoted market prices at the balance sheet date. The quoted market prices used for financial assets are the current bid prices; the appropriate quoted market prices for financial liabilities are the current asking prices. The fair values of financial instruments that are not traded in an active market are determined by using valuation techniques. The Group uses a variety of methods and makes assumptions based on market conditions existing at each balance sheet date. Where appropriate, quoted market prices or dealer quotes for similar instruments are used. Valuation techniques, such as discounted cash flow analyses, are also used to determine the fair values of the financial instruments. However, if the range of reasonable fair value measurements is significant and the probabilities of the various estimates cannot be reasonably assessed, the Group is precluded from measuring the instruments at fair value. The fair values of forward currency contracts are determined using actively quoted forward exchange rates. The fair values of current financial assets and liabilities carried at amortised cost approximate their carrying amounts. 2.17 Leases (a) When the Group is the lessee: The Group leases certain property, plant and equipment from non-related parties. (i) Lessee - Finance leases Leases of property, plant and equipment where the Group assumes substantially all risks and rewards incidental to ownership of the leased assets are classified as finance leases. The leased assets and the corresponding lease liabilities (net of finance charges) under finance leases are recognised on the balance sheet as property, plant and equipment and borrowings respectively, at the inception of the leases based on the lower of the fair value of the leased assets and the present value of the minimum lease payments. Each lease payment is apportioned between the finance expense and the reduction of the outstanding lease liability. The finance expense is recognised in profit or loss on a basis that reflects a constant periodic rate of interest on the finance lease liability. Annual Report 2014 97 Financial Statements NOTES TO THE FINANCIAL STATEMENTS For the financial year ended 31 December 2014 2. Significant accounting policies (continued) 2.17 Leases (continued) (a) When the Group is the lessee: (continued) (ii) Lessee - Operating leases Leases of property, plant and equipment where substantially all risks and rewards incidental to ownership are retained by the lessors are classified as operating leases. Payments made under operating leases (net of any incentives received from the lessors) are recognised in profit or loss on a straight-line basis over the lease term. (b) When the Group is the lessor: The Group leases certain items of property, plant and equipment and investment properties to nonrelated parties and related parties. (i) Lessor - Operating leases Leases of property, plant and equipment and investment properties where the Group retains substantially all risks and rewards incidental to ownership are classified as operating leases. Rental income from operating leases (net of any incentives given to lessees) is recognised in profit or loss on the straight-line basis over the lease term. Initial direct costs incurred by the Group in negotiating and arranging operating leases are added to the carrying amount of the leased asset and recognised as an expense in profit or loss over the lease term on the same basis as the lease income. 2.18 Inventories Inventories are carried at the lower of cost and net realisable value. Cost is determined using the weighted average method. The cost of finished goods and work-in-progress comprises raw materials, direct labour, other direct costs and related production overheads (based on normal operating capacity) but excludes borrowing costs. Net realisable value is the estimated selling price in the ordinary course of business, less the estimated costs of completion and applicable variable selling expenses. 2.19 Income taxes Current income tax for current and prior periods is recognised at the amount expected to be paid to or recovered from the tax authorities, using the tax rates and tax laws that have been enacted or substantively enacted by the balance sheet date. Deferred income tax is recognised for all temporary differences arising between the tax bases of assets and liabilities and their carrying amounts in the financial statements except when the deferred income tax arises from the initial recognition of goodwill or an asset or liability in a transaction that is not a business combination and affects neither accounting nor taxable profit or loss at the time of the transaction. A deferred income tax liability is recognised on temporary differences arising on investments in subsidiaries and associated companies, except where the Group is able to control the timing of the reversal of the temporary difference and it is probable that the temporary difference will not reverse in the foreseeable future. A deferred income tax asset is recognised to the extent that it is probable that future taxable profit will be available against which the deductible temporary differences and tax losses can be utilised. Deferred income tax is measured: (i) 98 at the tax rates that are expected to apply when the related deferred income tax asset is realised or the deferred income tax liability is settled, based on tax rates and tax laws that have been enacted or substantively enacted by the balance sheet date; and COSCO Corporation (Singapore) Limited Financial Statements NOTES TO THE FINANCIAL STATEMENTS For the financial year ended 31 December 2014 2. Significant accounting policies (continued) 2.19 Income taxes (continued) (ii) based on the tax consequence that will follow from the manner in which the Group expects, at the balance sheet date, to recover or settle the carrying amounts of its assets and liabilities, except for investment properties. Investment property measured at fair value is presumed to be recovered entirely through sale. Current and deferred income tax are recognised as income or expense in profit or loss, except to the extent that the tax arises from a business combination or a transaction which is recognised directly in equity. Deferred tax arising from a business combination is adjusted against goodwill on acquisition. 2.20 Provisions Provisions are recognised when the Group has a present legal or constructive obligation as a result of past events; it is more likely than not that an outflow of resources will be required to settle the obligation; and the amount has been reliably estimated. Provisions are not recognised for future operating losses. The Group recognises the estimated liability to repair or replace products still under warranty at the balance sheet date. This provision is calculated based on estimates by technical engineers and historical experience of the level of repairs and replacements. Other provisions are measured at the present value of the expenditure expected to be required to settle the obligation using a pre-tax discount rate that reflects the current market assessment of the time value of money and the risks specific to the obligation. The increase in the provision due to the passage of time is recognised in profit or loss as finance expense. Changes in the estimated timing or amount of the expenditure or discount rate are recognised in profit or loss when the changes arise. 2.21 Employee compensation Employee benefits are recognised as an expense, unless the cost qualifies to be capitalised as an asset. (a) Defined contribution plans Defined contribution plans are post-employment benefit plans under which the Group pays fixed contributions into separate entities such as the Central Provident Fund and social security plans in the People’s Republic of China (“PRC”) on a mandatory, contractual or voluntary basis. The Group has no further payment obligations once the contributions have been paid. (b) Employee leave entitlements Employee entitlements to annual leave are recognised when they accrue to employees. A provision is made for the estimated liability for annual leave as a result of services rendered by employees up to the balance sheet date. (c) Share-based compensation The Group operates an equity-settled, share-based compensation plan. The value of the employee services received in exchange for the grant of the options is recognised as an expense with a corresponding increase in the share option reserve over the vesting period. The total amount to be recognised over the vesting period is determined by reference to the fair value of the options granted on the date of the grant. Non-market vesting conditions are included in the estimation of the number of shares under option that are expected to become exercisable on the vesting date. At each balance sheet date, the Group revises its estimates of the number of shares under options that are expected to become exercisable on the vesting date and recognises the impact of the revision of the estimates in profit or loss, with a corresponding adjustment to the share option reserve over the remaining vesting period. Annual Report 2014 99 Financial Statements NOTES TO THE FINANCIAL STATEMENTS For the financial year ended 31 December 2014 2. Significant accounting policies (continued) 2.21 Employee compensation (continued) (c) Share-based compensation (continued) When the options are exercised, the proceeds received (net of transaction costs) are credited to share capital account when new ordinary shares are issued. 2.22 Currency translation (a) Functional and presentation currency Items included in the financial statements of each entity in the Group are measured using the currency of the primary economic environment in which the entity operates (“functional currency”). The financial statements are presented in Singapore Dollars, which is the functional currency of the Company. (b) Transactions and balances Transactions in a currency other than the functional currency (“foreign currency”) are translated into the functional currency using the exchange rates at the dates of the transactions. Currency translation differences resulting from the settlement of such transactions and from the translation of monetary assets and liabilities denominated in foreign currencies at the closing rates at the balance sheet date are recognised in profit or loss. However, in the consolidated financial statements, currency translation differences arising from borrowings in foreign currencies and other currency instruments designated and qualifying as net investment hedges and net investment in foreign operations, are recognised in other comprehensive income and accumulated in the currency translation reserve. When a foreign operation is disposed of or any borrowings forming part of the net investment of the foreign operation are repaid, a proportionate share of the accumulated translation differences is reclassified to profit or loss, as part of the gain or loss on disposal. Foreign exchange gains and losses that impact profit or loss are presented in profit or loss within “other gains and losses”. Non-monetary items measured at fair values in foreign currencies are translated using the exchange rates at the date when the fair values are determined. (c) Translation of Group entities’ financial statements The results and financial position of all the Group entities (none of which has the currency of a hyperinflationary economy) that have a functional currency different from the presentation currency are translated into the presentation currency as follows: (i) assets and liabilities are translated at the closing exchange rates at the reporting date; (ii) income and expenses are translated at average exchange rates (unless the average is not a reasonable approximation of the cumulative effect of the rates prevailing on the transaction dates, in which case, income and expenses are translated using the exchange rates at the dates of the transactions); and (iii) all resulting currency translation differences are recognised in other comprehensive income and accumulated in the currency translation reserve. The currency translation differences are reclassified to profit or loss on disposal or partial disposal of the entity giving rise to such reserve. Goodwill and fair value adjustments arising on the acquisition of foreign operations are treated as assets and liabilities of the foreign operations and translated at the closing rates at the reporting date. 100 COSCO Corporation (Singapore) Limited Financial Statements NOTES TO THE FINANCIAL STATEMENTS For the financial year ended 31 December 2014 2. Significant accounting policies (continued) 2.23 Segment reporting Operating segments are reported in a manner consistent with the internal reporting provided to the key management whose members are responsible for allocating resources and assessing performance of the operating segments. 2.24 Cash and cash equivalents For the purpose of presentation in the consolidated statement of cash flows, cash and cash equivalents include cash on hand, deposits with financial institutions which are subject to an insignificant risk of change in value and bank overdrafts and exclude pledged deposits with financial institutions. Bank overdrafts are presented as current borrowings on the balance sheet. For cash subjected to restriction, assessment is made on the economic substance of the restriction and whether they meet the definition of cash and cash equivalents. 2.25 Share capital Ordinary shares are classified as equity. Incremental costs directly attributable to the issuance of new ordinary shares are deducted against the share capital account. 2.26 Dividends to Company’s shareholders Dividends to the Company’s shareholders are recognised when the dividends are approved for payment. 2.27 Government grants Grants from the government are recognised as a receivable at their fair value when there is reasonable assurance that the grant will be received and the Group will comply with all the attached conditions. Government grants receivable are recognised as income over the periods necessary to match them with the related costs which they are intended to compensate, on a systematic basis. Government grants relating to expenses are shown separately as other income. Government grants relating to assets are deducted against the carrying amount of the assets. 3. Critical accounting estimates, assumptions and judgements Estimates, assumptions and judgements are continually evaluated and are based on historical experience and other factors, including expectations of future events that are believed to be reasonable under the circumstances. (a) Construction contracts The Group uses the percentage-of-completion method to account for its contract revenue. The stage of completion is measured by reference to the contract costs incurred to date compared to the estimated total costs for the contract. Significant assumptions are used to estimate the total contract costs and the recoverable variation works that affect the stage of completion and the contract revenue respectively. In making these estimates, management has relied on past experience and industry practices. If the stage of completion increases/decreases by 10% (2013: 10%) from management’s estimates, the Group’s revenue will increase/decrease by $808,005,000 (2013: $572,539,000) and the Group’s cost of sales will increase/decrease by $740,208,000 (2013: $525,949,000). If the total contract costs to be incurred increase/decrease by 10% (2013: 10%) from management’s estimates, the Group’s cost of sales will increase/decrease by $470,038,000 (2013: $335,607,000). Annual Report 2014 101 Financial Statements NOTES TO THE FINANCIAL STATEMENTS For the financial year ended 31 December 2014 3. Critical accounting estimates, assumptions and judgements (continued) (b) Useful life of property, plant and equipment The management of the Group determines the estimated useful lives and related depreciation expense for the property, plant and equipment. The management of the Group estimates useful lives of the property, plant and equipment by reference to expected usage of the property, plant and equipment, expected repair and maintenance, and technical or commercial obsolescence arising from the changes or improvements in the market. The useful lives and related depreciation expense could change significantly as a result of the changes in these factors. Please refer to Note 2.4(b) “Property, plant and equipment – Depreciation” for the change in accounting estimate for useful lives of certain assets within leasehold land and buildings, plant and machinery and docks and quays adopted by the Group on 1 January 2014. (c) Impairment of trade receivables (including amount due from customer on construction contracts) Management reviews its trade receivables (including amount due from customer on construction contracts) for objective evidence of impairment regularly. Significant financial difficulties of the debtor, the probability that the debtor will enter bankruptcy, and default or significant delay in payments are considered objective evidence that a receivable is impaired. In determining this, management has made judgement as to whether there is observable data indicating that there has been a significant change in the payment ability of the debtor, or whether there have been significant changes with adverse effect in the technological, market, economic or legal environment in which the debtor operates in. Where there is objective evidence of impairment, management has made judgements as to whether an impairment loss should be recorded in profit or loss. In determining this, management has used estimates based on historical loss experience for assets with similar credit risk characteristics. The methodology and assumptions used for estimating both the amount and timing of future cash flows are reviewed regularly to reduce any differences between the estimated loss and actual loss experience. The net present values of estimated cash flows from management’s estimates for all past due receivables, will not result in any significant impact to the Group’s allowance for impairment. (d) Warranty claims The provision for warranty is based on estimates from known and expected warranty work and contractual obligation for further work to be performed after completion. The warranty provision could differ from future claims. Movements in provision for warranty are detailed in Note 28(b). 4. Revenue The Group Rendering of services - Ship repair, ship building and marine engineering - Charter hire Others Total sales 102 COSCO Corporation (Singapore) Limited 2014 $’000 2013 $’000 4,208,197 51,611 897 4,260,705 3,452,505 54,731 898 3,508,134 Financial Statements NOTES TO THE FINANCIAL STATEMENTS For the financial year ended 31 December 2014 5. Expenses by nature The Group Allowance for impairment of property, plant and equipment (Note 23) Allowance for impairment of transferable club memberships Amortisation of deferred expenditure Raw materials, finished goods, consumables and other overheads Changes in inventories and construction contract work-in-progress Commission Crew overheads Depreciation of property, plant and equipment and investment properties (Notes 22 and 23) Director and employee compensation (Note 6) Net allowance for impairment of trade and other receivables Write-down of inventories Allowance for expected losses recognised on construction contracts Non-audit service fees paid/payable to auditor of the Company Provision for an onerous contract Rental expense on operating leases Repairs and maintenance Sub-contractor expenses Vessel overheads Write-off of property, plant and equipment Other expenses Total cost of sales, distribution and administrative expenses 6. 2014 $’000 2013 $’000 163 6 86 2,714,530 (61,057) 54,029 12,185 110 11 86 2,834,362 (784,475) 41,714 12,401 153,488 382,662 25,787 124,504 61,742 49 25 43,313 19,331 619,380 9,957 217 67,145 4,227,542 183,525 363,758 5,228 23,678 85,717 35 144 78,758 18,813 439,680 16,147 469 126,731 3,446,892 Director and employee compensation The Group Wages, salaries and staff benefits Employer’s contribution to defined contribution plans Directors’ fees of the Company 2014 $’000 2013 $’000 340,264 42,093 305 382,662 323,250 40,203 305 363,758 Annual Report 2014 103 Financial Statements NOTES TO THE FINANCIAL STATEMENTS For the financial year ended 31 December 2014 7. Other income and other gains and losses (a) Other income The Group Compensation received from customers Dividend income Government grants Interest income Rental income Sale of scrap materials Sundry income (b) 2014 $’000 2013 $’000 374 725 5,999 45,807 2,960 43,543 7,538 106,946 17,452 503 14,678 44,712 2,379 44,178 3,654 127,556 Other gains and losses The Group 2014 $’000 Currency exchange gain/(loss) – net Fair value (losses)/gains on forward currency contracts (Loss)/gain on disposal of property, plant and equipment (Loss)/gain on sale of bunker stock Other income and other gains and losses 8. 2013 $’000 6,737 (759) (456) (486) 5,036 (18,933) 750 666 99 (17,418) 111,982 110,138 Finance expenses The Group Interest expense - Bank borrowings and bills payable - Loan from a fellow subsidiary Total interest expense Less: Amount capitalised in construction of property, plant and equipment (Note 23) Finance expenses recognised in profit or loss 104 COSCO Corporation (Singapore) Limited 2014 $’000 2013 $’000 128,028 52 128,080 109,829 1,330 111,159 (383) 127,697 (314) 110,845 Financial Statements NOTES TO THE FINANCIAL STATEMENTS For the financial year ended 31 December 2014 9. Income taxes (a) Income tax (credit)/expense The Group 2014 $’000 2013 $’000 851 34,090 34,941 718 34,505 35,223 (39,494) (4,553) (16,040) 19,183 (228) (8,070) (8,298) (172) (9,832) (10,004) 3,825 (9,026) (1,022) 8,157 Tax (credit)/expense attributable to profit is made up of: Profit for the financial year: Current income tax - Singapore - Foreign Deferred income tax (Note 29) - Foreign (Over)/under provision in prior financial years: Current income tax - Singapore - Foreign Deferred income tax (Note 29) - Foreign The tax on the Group’s profit before tax differs from the theoretical amount that would arise using the Singapore standard rate of income tax as follows: The Group Profit before tax and share of profit of associated companies Tax calculated at a tax rate of 17% (2013: 17%) Effects of: - Change in tax rate in other countries - Different tax rates in other countries - Tax incentives - Income not subject to tax - Expenses not deductible for tax purposes - Utilisation of previously unrecognised deferred tax assets - Deferred tax assets not recognised - Recognition of previously unrecognised deferred tax assets - Over provision of current income tax in prior years - Under/(over) provision of deferred income tax in prior years - Others Tax (credit)/charge 2014 $’000 2013 $’000 17,448 60,535 2,966 10,291 – (4,650) (4,001) (128) 4,686 (1,899) 554 (2,110) (8,298) 3,825 29 (9,026) 3,299 (3,792) (987) (72) 5,547 (10) 4,858 – (10,004) (1,022) 49 8,157 Annual Report 2014 105 Financial Statements NOTES TO THE FINANCIAL STATEMENTS For the financial year ended 31 December 2014 9. Income taxes (continued) (b) The tax (charge)/credit relating to each component of other comprehensive income is as follows: Before tax $’000 Fair value gain/(loss) on available-for-sale financial assets Currency translation differences arising from consolidation Other comprehensive income 10. 2014 Tax charge $’000 After tax $’000 2013 Tax credit $’000 Before tax $’000 After tax $’000 332 (83) 249 (123) 31 (92) 53,105 53,437 – (83) 53,105 53,354 118,317 118,194 – 31 118,317 118,225 Earnings per share (a) Basic earnings per share Basic earnings per share is calculated by dividing the net profit attributable to equity holders of the Company by the weighted average number of ordinary shares outstanding during the financial year. Net profit attributable to equity holders of the Company ($’000) Weighted average number of ordinary shares outstanding for basic earnings per share (’000) Basic earnings per share (cents per share) (b) 2014 2013 20,893 30,615 2,239,245 2,239,245 0.93 1.37 Diluted earnings per share For the purpose of calculating diluted earnings per share, the weighted average number of ordinary shares outstanding is adjusted for the effects of all dilutive potential ordinary shares arising from share options. For share options, the weighted average number of shares on issue has been adjusted as if all dilutive share options were exercised. The number of shares that could have been issued upon the exercise of all dilutive share options less the number of shares that could have been issued at fair value (determined as the Company’s average share price for the financial year) for the same total proceeds is added to the denominator as the number of shares issued for no consideration. No adjustment is made to the net profit. Diluted earnings per share attributable to equity holders of the Company is calculated as follows: 2014 2013 20,893 30,615 Weighted average number of ordinary shares outstanding for basic earnings per share (’000) 2,239,245 2,239,245 Weighted average number of ordinary shares outstanding for diluted earnings per share (’000) 2,239,245 2,239,245 0.93 1.37 Net profit attributable to equity holders of the Company ($’000) Diluted earnings per share (cents per share) 106 COSCO Corporation (Singapore) Limited Financial Statements NOTES TO THE FINANCIAL STATEMENTS For the financial year ended 31 December 2014 11. Cash and cash equivalents Cash and cash equivalents at the end of the financial year comprise the following: The Group Cash at bank and on hand Short-term bank deposits 2014 $’000 2013 $’000 647,639 913,164 1,560,803 689,502 1,338,895 2,028,397 The Company 2014 2013 $’000 $’000 998 45,436 46,434 8,598 45,810 54,408 Cash at bank and short-term bank deposits include an amount of $592,481,000 (2013: $726,520,000) placed with a fellow subsidiary, COSCO Finance Co., Ltd. For the purpose of presenting the consolidated statement of cash flows, the consolidated cash and cash equivalents comprise the following: The Group Cash and bank balances (as above) Less: Bank deposits pledged Cash and cash equivalents per consolidated statement of cash flows 2014 $’000 2013 $’000 1,560,803 (3,319) 1,557,484 2,028,397 (3,357) 2,025,040 In 2014, cash and bank balances and short-term bank deposits of the Group amounting to $3,319,000 (2013: $3,357,000) are pledged as security for trade finance facilities. 12. Forward currency contracts Contract notional amount $’000 The Group Fair value Assets $’000 Liabilities $’000 2013 Non-hedging instruments - Forward currency contracts 125,906 770 – There were no forward currency contracts outstanding as at 31 December 2014. Annual Report 2014 107 Financial Statements NOTES TO THE FINANCIAL STATEMENTS For the financial year ended 31 December 2014 13. Trade and other receivables - current The Group Trade receivables: - Non-related parties (i) - Fellow subsidiaries - Associated companies Less: Allowance for impairment of receivables - Non-related parties Trade receivables - net Construction contracts due from customers (Note 15): - Non-related parties (i) Other receivables: - Non-related parties - Fellow subsidiaries (ii) - Associated companies (ii) - A subsidiary (iii) Less: Allowance for impairment of other receivables - non-related parties Other receivables – net Loan to an associated company (iv) Advances paid to suppliers Staff advances Dividend receivable from - Subsidiaries - Associated companies Total 108 The Company 2014 2013 $’000 $’000 2014 $’000 2013 $’000 456,633 23,006 313 479,952 215,099 22,667 – 237,766 – – – – – – – – (37,581) 442,371 (11,323) 226,443 – – – – 3,561,426 2,031,327 – – 67,681 5,792 113 – 73,586 55,161 10,125 1 – 65,287 8 – – 48 56 7 – – 1,392 1,399 (12,234) 61,352 (11,978) 53,309 – 56 – 1,399 – 939 – – 494,654 595,584 – – 1,063 1,120 – – – 2,939 4,563,805 – 3,106 2,911,828 31,085 – 31,141 30,359 – 31,758 (i) Certain subsidiaries of the Group have factored trade receivables and construction contracts due from customers with carrying amounts of $1,779,895,000 (2013: $1,119,841,000) to banks in exchange for cash during the financial year ended 31 December 2014. The transactions have been accounted for as collateralised borrowings as the banks have full recourse to the subsidiaries in the event of default by the debtors (Note 27). (ii) Other receivables due from fellow subsidiaries and associated companies are unsecured, interestfree and are repayable on demand. (iii) Other receivables due from a subsidiary are unsecured, interest-free and are repayable on demand. (iv) As at 31 December 2013, the loan to an associated company is unsecured, interest-bearing at 6.15% per annum and is repayable on demand. COSCO Corporation (Singapore) Limited Financial Statements NOTES TO THE FINANCIAL STATEMENTS For the financial year ended 31 December 2014 14. Inventories The Group Raw materials Work-in-progress Finished goods 2014 $’000 2013 $’000 298,576 743,056 63 1,041,695 295,049 706,883 44,832 1,046,764 The cost of inventories recognised as an expense and included in “cost of sales” amounted to $3,797,632,000 (2013: $3,066,475,000). 15. Construction contract work-in-progress The Group Beginning of financial year Contract costs incurred during the financial year Contract expenses recognised in profit or loss Currency translation differences End of financial year Aggregate costs incurred and profits recognised (less losses recognised) to date on uncompleted construction contracts Less: Progress billings Currency translation differences Presented as: Due from customers on construction contracts (Note 13) Due to customers on construction contracts (Note 26) Advances received on construction contracts (Note 26) 2014 $’000 2013 $’000 208,366 3,226,590 (3,261,063) 3,622 177,515 93,009 2,643,902 (2,537,414) 8,869 208,366 4,929,113 (1,657,781) 129,333 3,400,665 3,563,072 (1,682,434) 51,111 1,931,749 3,561,426 (160,761) 3,400,665 2,031,327 (99,578) 1,931,749 344,271 495,181 – 8,697 Retentions on construction contracts 16. Other current assets The Group Deposits Prepayments 2014 $’000 2013 $’000 2,974 18,455 21,429 2,660 12,575 15,235 The Company 2014 2013 $’000 $’000 – 164 164 16 160 176 Annual Report 2014 109 Financial Statements NOTES TO THE FINANCIAL STATEMENTS For the financial year ended 31 December 2014 17. Trade and other receivables - non-current The Group 2014 $’000 2013 $’000 Trade receivables from non-related parties (i) Less: Current portion 27,402 (23,025) 4,377 40,595 (15,380) 25,215 Other receivables from a non-related party (ii) – 4,377 11,659 36,874 (i) Trade receivables amounting to $19,038,000 (2013: $32,456,000) are unsecured, bear interest ranging from 4% to 8% per annum with quarterly instalment payments that are repayable in full by 2016. The remaining trade receivables amounting to $8,364,000 (2013: $8,139,000) are secured, bear interest at 4.5% per annum in 2014 and 5.5% per annum in 2015, and are repayable in full by 2015. The pledge was secured under a second preferred mortgage issued by the debtor to the subsidiary. The fair values of the non-current trade receivables approximate its carrying amounts, determined from cash flow analyses discounted at market borrowing rates of 2.97% (2013: 2.67%) per annum which the directors expect to be available to the Group. (ii) 18. Other receivables from a non-related party are unsecured and interest-free. As at 31 December 2013, the fair values of the non-current other receivables were not materially different from its carrying amounts, determined from cash flow analyses discounted at market borrowing rates of 4.22% per annum which the directors expected to be available to the Group. Available-for-sale financial assets The Group Beginning of financial year Currency translation differences Fair value gain/(loss) recognised in other comprehensive income (Note 31(b)(v)) End of financial year 2014 $’000 2013 $’000 4,391 118 4,244 270 332 4,841 (123) 4,391 At the balance sheet date, available-for-sale financial assets include the following: The Group Quoted equity shares in a corporation, at fair value Unquoted equity shares in corporations, at cost - A fellow subsidiary - A non-related party 2014 $’000 2013 $’000 795 438 2,989 1,057 4,046 4,841 2,921 1,032 3,953 4,391 The directors have assessed that the range of reasonable fair value measurements is significant and the probabilities of the various estimates cannot be reasonably assessed. Therefore, the unquoted equity shares have been measured at cost. 110 COSCO Corporation (Singapore) Limited Financial Statements NOTES TO THE FINANCIAL STATEMENTS For the financial year ended 31 December 2014 19. Club memberships The Group Transferable club memberships, at cost Currency translation differences Allowance for impairment in value of club memberships 20. The Company 2014 2013 $’000 $’000 2014 $’000 2013 $’000 669 6 664 5 428 – 428 – (372) 303 (366) 303 (346) 82 (340) 88 Investments in associated companies The Group Beginning of financial year Currency translation differences Share of (loss)/profit after tax Dividends declared, net of tax End of financial year 2014 $’000 2013 $’000 4,826 107 (197) – 4,736 4,235 282 407 (98) 4,826 Set out below are the associated companies of the Group as at 31 December 2014. The directors are of the opinion that the associated companies are immaterial to the Group individually and in aggregate and accordingly, no summarised financial information of the associated companies is disclosed. The associated companies as listed below have share capital consisting solely of ordinary shares, which are held directly by the Group; the country of incorporation is also their principal place of business. There are no contingent liabilities relating to the Group’s interest in the associated companies. Name of associated companies Principal activities Country of incorporation/ business % of paid-up capital held by subsidiaries 2014 2013 % % DMI (Guangzhou) Ltd (i) Overhaul and spare-parts replacement and repair People’s Republic of China (“PRC”) 30 30 Tru-Marine Cosco (Tianjin) Engineering Co., Ltd (i) Overhaul and spare-parts replacement and repair PRC 40 40 Diesel Marine International (Nantong) Co., Ltd (i) Overhaul and spare-parts replacement and repair PRC 30 30 Diesel Marine Dalian Ltd (i) Overhaul and spare-parts replacement and repair PRC 30 30 (i) Audited by Ruihua Certified Public Accountants, PRC. Annual Report 2014 111 Financial Statements NOTES TO THE FINANCIAL STATEMENTS For the financial year ended 31 December 2014 21. Investments in subsidiaries The Company 2014 2013 $’000 $’000 Unquoted equity shares Beginning of financial year Accumulated impairment losses End of financial year 388,746 (17,102) 371,644 388,746 (17,758) 370,988 2014 $’000 2013 $’000 17,758 (656) 17,102 18,477 (719) 17,758 Movement in accumulated impairment losses are as follows: Beginning of financial year Reversal of impairment charge End of financial year There has been a favourable change in estimates used to determine the recoverable amount of a previously loss-making subsidiary since the last impairment loss was recognised. Therefore, the Group recognised a reversal of the impairment during the financial year. The Group had the following subsidiaries as at 31 December 2014 and 2013: Name 112 Principal activities Country of incorporation/ business Cost of investment 2014 2013 $’000 $’000 Proportion of Proportion of ordinary shares Proportion of ordinary shares ordinary shares held by nondirectly held by held by the controlling the Company Group interests 2014 2013 2014 2013 2014 2013 % % % % % % COSCO (Singapore) Pte Ltd (i) Ship owning, ship chartering and investment holding Singapore 87,664 87,664 100 100 100 100 – – COSCO Marine Engineering (Singapore) Pte Ltd (i) Ship repairing, marine engineering, container repairs and services, fabrication works services and production of marine outfitting components Singapore 2,242 2,242 90 90 90 90 10 10 Harington Property Pte Ltd (i) Trading and investing in properties, provide property management services and investment holding Singapore 52,701 52,701 100 100 100 100 – – COSCO Corporation (Singapore) Limited Financial Statements NOTES TO THE FINANCIAL STATEMENTS For the financial year ended 31 December 2014 21. Investments in subsidiaries (continued) Name Principal activities Country of incorporation/ business Cost of investment 2014 2013 $’000 $’000 COSCO Shipyard Group Co., Ltd (iii) and (iv) Investment holding People’s Republic of China (“PRC”) 191,173 191,173 COSCO (Nantong) Shipyard Co., Ltd (iii) and (iv) Ship repair and marine engineering PRC 24,670 COSCO (Dalian) Shipyard Co., Ltd (iii) and (iv) Ship repair, ship building and marine engineering PRC COSCO (Guangdong) Shipyard Co., Ltd (iii) and (iv) Ship repair, ship building and marine engineering COSCO (Zhoushan) Shipyard Co., Ltd (iii) and (iv) Proportion of Proportion of Proportion of ordinary shares ordinary shares ordinary shares held by nondirectly held by held by the controlling the Company Group interests 2014 2013 2014 2013 2014 2013 % % % % % % 51 51 51 51 49 49 24,670 50 50 75 75 25 25 30,296 30,296 39 39 69 69 31 31 PRC – – – – 38 38 62 62 Ship repair, ship building and marine engineering PRC – – – – 51 51 49 49 COSCO (Xiamen) Shipyard Co., Ltd (iii) Ship repair PRC – – – – 26 26 74 74 COSCO (Shanghai) Shipyard Co., Ltd (iii) and (iv) Ship repair and marine engineering PRC – – – – 48 48 52 52 COSCO (Tianjin) Shipyard Co., Ltd (iii) Ship repair PRC – – – – 46 46 54 54 COSCO Ship repair (Lianyungang) Shipyard Co., Ltd (v) PRC – – – – – 31 – 69 Annual Report 2014 113 Financial Statements NOTES TO THE FINANCIAL STATEMENTS For the financial year ended 31 December 2014 21. Investments in subsidiaries (continued) Name 114 Principal activities Country of incorporation/ business Cost of investment 2014 2013 $’000 $’000 Proportion of Proportion of Proportion of ordinary shares ordinary shares ordinary shares held by nondirectly held by held by the controlling the Company Group interests 2014 2013 2014 2013 2014 2013 % % % % % % COSCO (Qidong) Offshore Co., Ltd (iii) and (iv) Marine engineering PRC – – – – 31 31 69 69 COSCO Dalian Rikky Ocean Engineering Co., Ltd (iii) Overhaul, repair, commissioning and spare-parts replacement of governor, turbocharger and engine fuel system PRC – – – – 38 38 62 62 COSCO (Nantong) Clavon Ship Engineering Co.,Ltd (formerly known as COSCO (Nantong) Ocean Shipyard Co., Ltd) (iii) Ship repair and corrosion control PRC – – – – 31 31 69 69 Zhongxing Sea-Land Engineering Co., Ltd (formerly known as Zhongyuan Sea-Land Engineering Co., Ltd) (iii) Ship repair PRC – – – – 26 26 74 74 COSCO Shipyard Total Automation Co., Ltd (iii) Design, manufacture, sale and technical service relating to vessels and industrial instruments PRC – – – – 31 31 69 69 COSCO Corporation (Singapore) Limited Financial Statements NOTES TO THE FINANCIAL STATEMENTS For the financial year ended 31 December 2014 21. Investments in subsidiaries (continued) Name Principal activities Country of incorporation/ business Cost of investment 2014 2013 $’000 $’000 Proportion of Proportion of Proportion of ordinary shares ordinary shares ordinary shares held by nondirectly held by held by the controlling the Company Group interests 2014 2013 2014 2013 2014 2013 % % % % % % COSCO (Hongkong) Shipyard Co., Ltd (vi) Provision of shipyard financing, marketing and sales of shipbuilding and offshore projects PRC – – – – 51 – 49 – Cos Fair Shipping Pte Ltd (i) Ship owning and ship chartering Singapore/ Worldwide – – – – 100 100 – – Cos Glory Shipping Inc. (i) Ship owning and ship chartering Panama/ Worldwide – – – – 100 100 – – Hanbo Shipping Limited (ii) Ship owning and ship chartering Hong Kong/ Worldwide – – – – 100 100 – – Sanbo Shipping Limited (ii) Ship owning and ship chartering Hong Kong/ Worldwide – – – – 100 100 – – Cos Orchid Shipping Pte Ltd (i) Ship owning and ship chartering Singapore/ Worldwide – – – – 100 100 – – Cos Prosperity Ship owning and Shipping ship chartering Pte Ltd (i) Singapore/ Worldwide – – – – 100 100 – – Cos Knight Shipping Maritime Inc. (i) Ship owning and ship chartering Panama/ Worldwide – – – – 100 100 – – Cos Lucky Ship owning and Shipping ship chartering Maritime Inc. (i) Panama/ Worldwide – – – – 100 100 – – COSCO Engineering Pte Ltd (i) Singapore – – – – 100 100 – – Ship repairing, marine engineering, container repairs and services, fabrication works services and production of marine outfitting components 388,746 388,746 Annual Report 2014 115 Financial Statements NOTES TO THE FINANCIAL STATEMENTS For the financial year ended 31 December 2014 21. Investments in subsidiaries (continued) (i) Audited by PricewaterhouseCoopers LLP, Singapore. (ii) Audited by PricewaterhouseCoopers firms outside Singapore. (iii) Audited by Ruihua Certified Public Accountants, PRC. (iv) Audited by PricewaterhouseCoopers LLP, Singapore and firms outside Singapore for the purposes of preparation of consolidated financial statements of the Group. (v) Dissolved on 22 December 2014 with cessation of registration with relevant companies’ registry. (vi) Incorporated on 17 February 2014 through COSCO Shipyard Group Co., Ltd. Significant restrictions Cash and short-term deposits of $1,430,289,000 (2013: $1,892,926,000) are held in the PRC and are subject to local exchange control regulations. These local exchange control regulations provide for restrictions on exporting capital from the country, other than through normal dividends. Carrying value of non-controlling interest COSCO Shipyard Group Co., Ltd and its subsidiaries Other subsidiaries with immaterial non-controlling interests 2014 $’000 2013 $’000 860,230 1,520 861,750 835,164 4,143 839,307 Summarised financial information of subsidiaries with material non-controlling interests Set out below are the summarised financial information for COSCO Shipyard Group Co., Ltd and its subsidiaries that has non-controlling interests that are material to the Group. These are presented before inter-company eliminations and exclude direct interest held by the Company in COSCO (Dalian) Shipyard Co., Ltd and COSCO (Nantong) Shipyard Co., Ltd. There were no transactions with non-controlling interests for the financial years ended 31 December 2014 and 2013. Summarised balance sheet 116 2014 $’000 2013 $’000 Current assets Assets Liabilities Total current net assets 7,230,336 (5,175,436) 2,054,900 6,065,674 (4,708,135) 1,357,539 Non-current assets Assets Liabilities Total non-current net (liabilities)/assets 2,430,179 (2,542,389) (112,210) 2,370,304 (1,856,463) 513,841 Net assets 1,942,690 1,871,380 COSCO Corporation (Singapore) Limited Financial Statements NOTES TO THE FINANCIAL STATEMENTS For the financial year ended 31 December 2014 21. Investments in subsidiaries (continued) Summarised profit or loss 2014 $’000 2013 $’000 4,192,177 3,435,978 Profit before income tax Income tax credit/(expense) Net profit 18,546 9,832 28,378 65,283 (13,851) 51,432 Other comprehensive income Total comprehensive income 45,603 73,981 112,042 163,474 Dividends paid to non-controlling interests (11,393) (249) Sales Summarised cash flows Net cash used in operating activities Net cash used in investing activities Net cash provided by financing activities Net (decrease)/increase in cash and cash equivalents Cash and cash equivalents at beginning of year Effects of currency translation on cash and cash equivalents Cash and cash equivalents at end of year 22. 2014 $’000 2013 $’000 (1,442,873) (45,344) 977,358 (510,859) 1,890,364 47,465 1,426,970 (141,929) (14,053) 464,556 308,574 1,510,167 71,623 1,890,364 Investment properties The Group 2014 $’000 2013 $’000 15,916 105 12 16,033 16,083 271 (438) 15,916 4,623 31 389 – 5,043 4,353 61 384 (175) 4,623 Net book value 10,990 11,293 Fair values 21,715 21,667 Cost Beginning of financial year Currency translation differences Reclassification from/(to) property, plant and equipment (Note 23) End of financial year Accumulated depreciation Beginning of financial year Currency translation differences Depreciation charge Reclassification to property, plant and equipment (Note 23) End of financial year Annual Report 2014 117 Financial Statements NOTES TO THE FINANCIAL STATEMENTS For the financial year ended 31 December 2014 22. Investment properties (continued) Investment properties comprise mainly office units leased to fellow subsidiaries, associated companies and non-related parties under operating leases. Investment properties are stated at cost less accumulated depreciation as the Group has elected to adopt the cost model method to measure its investment properties. Valuation techniques used to derive Level 2 fair values Level 2 fair values of the investment properties have been derived using the sales comparison approach. Sale prices of comparable properties in close proximity are adjusted for differences in key attributes such as property size. The most significant input into this valuation approach is selling price per square metre. Valuation process of the Group The Group engages external, independent and qualified valuers to determine the fair values of the investment properties at the end of each financial year based on the properties’ highest and best use. As at 31 December 2014 and 2013, the fair values of the properties have been determined by CBRE Private Limited. The following amounts are recognised in profit or loss: The Group Rental income Direct operating expenses arising from investment properties that generate rental income 118 COSCO Corporation (Singapore) Limited 2014 $’000 2013 $’000 1,088 1,044 515 500 Financial Statements NOTES TO THE FINANCIAL STATEMENTS For the financial year ended 31 December 2014 23. Property, plant and equipment The Group Leasehold land and buildings $’000 2014 Cost Beginning of financial year 1,089,365 Currency translation differences 25,684 Additions 3,130 Disposals (3,730) Reclassification to investment properties (Note 22) (12) Reclassification from inventories – Reclassification 16,152 End of financial year 1,130,589 Office renovations, furniture, fixtures and equipment $’000 Plant, machinery and equipment $’000 Motor vehicles $’000 Motor vessels $’000 59,174 976,638 47,191 288,814 987,203 35,588 3,483,973 1,399 1,846 (8,991) 23,313 10,160 (11,379) 1,102 1,154 (2,141) 13,959 3,558 (2,670) 23,616 – (172) 851 80,784 (11) 89,924 100,632 (29,094) – – – – – – (12) – 1,174 54,602 – 10,000 1,008,732 – 551 47,857 – 310 303,971 45,843 4,635 1,061,125 – (32,822) 84,390 45,843 – 3,691,266 Docks Constructionand quays in-progress $’000 $’000 Total $’000 Accumulated depreciation and impairment losses Beginning of financial year Currency translation differences Depreciation charge Impairment charge Disposals Reclassification End of financial year 219,023 48,946 506,629 40,917 162,138 278,452 – 1,256,105 6,360 33,157 – (442) (7) 258,091 1,402 6,272 – (8,976) 7 47,651 14,971 73,136 163 (11,166) – 583,733 1,068 2,682 – (2,119) – 42,548 8,596 13,151 – (2,442) – 181,443 7,638 24,701 – (48) – 310,743 – – – – – – 40,035 153,099 163 (25,193) – 1,424,209 Net book value End of financial year 872,498 6,951 424,999 5,309 122,528 750,382 84,390 2,267,057 55,481 937,271 46,400 267,111 918,509 21,793 3,265,165 3,504 2,051 (2,612) 60,090 3,179 (24,555) 2,865 155 (3,093) 9,074 2,512 (2,309) 59,009 – – 1,402 51,571 (1,038) 200,145 61,855 (43,630) – 750 59,174 – 653 976,638 – 864 47,191 – 12,426 288,814 – 9,685 987,203 – (38,140) 35,588 438 – 3,483,973 2013 Cost Beginning of financial year 1,018,600 Currency translation differences 64,201 Additions 2,387 Disposals (10,023) Reclassification to investment properties (Note 22) 438 Reclassification 13,762 End of financial year 1,089,365 Accumulated depreciation and impairment losses Beginning of financial year Currency translation differences Depreciation charge Impairment charge Disposals Reclassification End of financial year 177,751 42,233 406,180 37,225 146,578 229,509 – 1,039,476 11,912 37,382 – (8,197) 175 219,023 2,833 6,442 – (2,562) – 48,946 28,456 90,318 110 (17,162) (1,273) 506,629 2,463 4,411 – (3,182) – 40,917 5,096 11,295 – (2,104) 1,273 162,138 15,650 33,293 – – – 278,452 – – – – – – 66,410 183,141 110 (33,207) 175 1,256,105 Net book value End of financial year 870,342 10,228 470,009 6,274 126,676 708,751 35,588 2,227,868 Annual Report 2014 119 Financial Statements NOTES TO THE FINANCIAL STATEMENTS For the financial year ended 31 December 2014 23. Property, plant and equipment (continued) The Group (continued) Borrowing costs of $383,000 (2013: $314,000) which arise mainly due to financing for the construction of docks and quays are capitalised during the financial year (Note 8) at an effective interest rate of 5.88% (2013: 5.89%) per annum. The Company Office renovations, furniture, fixtures and equipment $’000 Motor vehicles $’000 Total $’000 2014 Cost Beginning of financial year Additions Disposals End of financial year 566 18 (12) 572 1,122 – – 1,122 1,688 18 (12) 1,694 Accumulated depreciation Beginning of financial year Depreciation charge Disposals End of financial year 556 11 (12) 555 364 128 – 492 920 139 (12) 1,047 17 630 647 2013 Cost Beginning of financial year Additions End of financial year 565 1 566 1,122 – 1,122 1,687 1 1,688 Accumulated depreciation Beginning of financial year Depreciation charge End of financial year 546 10 556 236 128 364 782 138 920 10 758 768 Net book value End of financial year Net book value End of financial year 120 COSCO Corporation (Singapore) Limited Financial Statements NOTES TO THE FINANCIAL STATEMENTS For the financial year ended 31 December 2014 24. Intangible assets The Group 2014 $’000 2013 $’000 Goodwill arising on consolidation 9,564 9,539 Cost Beginning of financial year Currency translation differences End of financial year 9,539 25 9,564 9,477 62 9,539 Net book value 9,564 9,539 Impairment tests for goodwill Goodwill is allocated to the Group’s cash-generating units (“CGU”), identified as the subsidiaries in the PRC according to country of operation and business segments. The business segment refers to ship repair, ship building and marine engineering. The recoverable amount of a CGU is determined based on value-in-use calculations. Cash flow projections used in the value-in-use calculations were based on financial forecasts approved by management covering a three-year period. Cash flows beyond 2014 were extrapolated using the estimated growth rate stated below. The growth rate does not exceed the long-term average growth rate for ship repair, ship building and marine engineering business in the PRC in which the CGU operates. Key assumptions used for value-in-use calculations: Growth rate1 Discount rate2 1 2 2014 2013 3.50% 4.36% 3.70% 4.22% Weighted average growth rate used to extrapolate cash flows beyond the budget period Pre-tax discount rate applied to the pre-tax cash flow projections These assumptions were used for the analysis of the CGU within the business segment. Management determined budgeted gross margin based on past performance and its expectations of the market development. The weighted average growth rate used was consistent with the forecasts included in industry reports. The discount rate used was pre-tax and reflected specific risks relating to the relevant segments. The impairment test has revealed that the recoverable amount of the CGU is higher than its carrying amount. Hence, there is no impairment charge recognised for the financial years ended 31 December 2014 and 31 December 2013. In addition, a decrease in the growth rate or an increase in the discount rate by 1% per annum would not result in any impairment charge for both financial years. 25. Deferred expenditure Deferred expenditure relates to prepaid rental for leasehold land on operating leases and is amortised on the straight-line basis over the lease period. Annual Report 2014 121 Financial Statements NOTES TO THE FINANCIAL STATEMENTS For the financial year ended 31 December 2014 26. Trade and other payables The Group The Company 2014 2013 $’000 $’000 2014 $’000 2013 $’000 574,927 5,154 13,031 593,112 565,599 1,919 38,604 606,122 – – – – – – – – 339,451 4,820 344,271 490,474 4,707 495,181 – – – – – – 160,761 505,032 99,578 594,759 – – – – 20,667 63,619 – – – – – – – – 15,000 – 15,000 15,000 2 15,002 Deposits received 9,191 9,944 – – Deferred income 6,272 7,354 – – Other accruals for operating expenses 1,493,322 1,410,065 2,378 3,147 Dividend payable to non-controlling interests of subsidiaries Total 4,567 2,632,163 4,048 2,695,911 – 17,378 – 18,149 Trade payables: - Non-related parties - Associated companies - Fellow subsidiaries Construction contracts: Advances received (Note 15): - Non-related parties - Fellow subsidiaries Due to customers (Note 15): - Non-related parties Advances from non-related parties Non-trade payables: - A subsidiary - A fellow subsidiary The non-trade payables to subsidiary and fellow subsidiary are unsecured, interest-free and are repayable on demand. 122 COSCO Corporation (Singapore) Limited Financial Statements NOTES TO THE FINANCIAL STATEMENTS For the financial year ended 31 December 2014 27. Borrowings The Group Current Bank borrowings (unsecured) Bank borrowings (secured) Loan from a fellow subsidiary (unsecured) Bills payable Non-current Bank borrowings (unsecured) Bank borrowings (secured) Total borrowings 2014 $’000 2013 $’000 1,215,510 1,034,950 – 179,844 2,430,304 1,133,610 666,244 2,086 124,125 1,926,065 1,797,445 744,945 2,542,390 4,972,694 1,402,866 453,597 1,856,463 3,782,528 The exposure of the borrowings of the Group to interest rate changes and the contractual repricing dates at the balance sheet dates are as follows: The Group Less than 1 year 1 – 5 years Over 5 years (a) 2014 $’000 2013 $’000 2,430,304 2,542,390 – 4,972,694 1,926,065 1,849,162 7,301 3,782,528 Security granted At the balance sheet date, total borrowings include secured liabilities of $1,779,895,000 (2013: $1,119,841,000) for the Group. Bank borrowings of the Group are secured over certain trade receivables (Note 13) and certain construction contracts due from customers (Note 13). (b) Loan from a fellow subsidiary As at 31 December 2013, the loan from a fellow subsidiary of $2,086,000 is unsecured, interestbearing at 5.35% and is repayable on demand. The loan from a fellow subsidiary has been fully repaid during the current financial year. Annual Report 2014 123 Financial Statements NOTES TO THE FINANCIAL STATEMENTS For the financial year ended 31 December 2014 27. Borrowings (continued) (c) Fair values of non-current borrowings At the balance sheet date, the carrying amounts of non-current borrowings approximated their fair values. The fair values were determined from cash flow analyses, discounted at the market borrowing rates which the directors expected to be available to the Group as follows: 2014 Bank borrowings 28. 2013 USD RMB USD RMB 2.97% 4.36% 2.67% 4.22% Provisions The Group Provision Provision Provision Provision (a) for for for for off hire claim (Note (a)) warranties (Note (b)) legal claims (Note (c)) an onerous contract (Note (d)) 2014 $’000 2013 $’000 1,514 53,811 841 – 56,166 2,321 43,449 9,482 144 55,396 Movements in provision for off hire claim on hire income are as follows: The Group Beginning of financial year Provision made during the financial year Provision utilised during the financial year Currency translation differences End of financial year 2014 $’000 2013 $’000 2,321 540 (1,485) 138 1,514 2,794 332 (904) 99 2,321 Provision for off hire claim on charter hire income is in respect of refund to be made to customers for period in which the motor vessels are not available for use. 124 COSCO Corporation (Singapore) Limited Financial Statements NOTES TO THE FINANCIAL STATEMENTS For the financial year ended 31 December 2014 28. Provisions (continued) (b) Movements in provision for warranties are as follows: The Group Beginning of financial year Provision made during the financial year Provision utilised during the financial year Currency translation differences End of financial year 2014 $’000 2013 $’000 43,449 11,621 (2,758) 1,499 53,811 44,057 15,456 (19,315) 3,251 43,449 The Group provides one to two-year warranties on certain ship building and marine engineering contracts and undertakes to repair or rectify defects that fail to perform satisfactorily. A provision is recognised at the balance sheet date for expected warranty claims based on an estimate by technical engineers and past experience of the possible repairs and rectifications. (c) Movements in provision for legal claims are as follows: The Group Beginning of financial year Currency translation difference Provision made during the financial year Provision written back during the financial year Provision utilised during the financial year End of financial year 2014 $’000 2013 $’000 9,482 (110) 642 (9,131) (42) 841 8,868 571 43 – – 9,482 The provision for legal claims is in respect of certain legal claims brought against the Group by customers. During the financial year, a portion of such legal claims were written back as the outcome of a litigation case was favourable to a subsidiary within the Group. (d) Movements in provision for an onerous contract are as follows: The Group Beginning of financial year Provision made during the financial year Provision utilised during the financial year Currency translation differences End of financial year 2014 $’000 2013 $’000 144 25 (179) 10 – – 144 – – 144 The provision for an onerous contract is in respect of a charter hire contract where the costs of meeting the obligation under the contract exceed the expected revenue for the remaining contractual period. Annual Report 2014 125 Financial Statements NOTES TO THE FINANCIAL STATEMENTS For the financial year ended 31 December 2014 29. Deferred income taxes Deferred income tax assets and liabilities are offset when there is a legally enforceable right to offset current income tax assets against current income tax liabilities and when the deferred income taxes relate to the same fiscal authority. The amounts, determined after appropriate offsetting, are shown on the balance sheets as follows: The Group Deferred income tax assets: - To be recovered within one year - To be recovered after one year Deferred income tax liabilities: - To be settled after one year The Company 2014 2013 $’000 $’000 2014 $’000 2013 $’000 260,924 6,977 267,901 218,756 6,456 225,212 – – – – – – 837 528 704 398 Movement in the deferred income tax account is as follows: The Group Beginning of financial year Change in tax rate Currency translation differences Deferred tax (credited)/charged to profit or loss Deferred tax charged/(credited) to other comprehensive income (Note 31(b)(v)) End of financial year The Company 2014 2013 $’000 $’000 2014 $’000 2013 $’000 (224,684) – (6,794) (194,482) 3,299 (13,109) 398 – 12 7,302 – 137 (35,669) (20,361) 294 (7,041) 83 (267,064) (31) (224,684) – 704 – 398 Deferred income tax assets are recognised for tax losses, provisions and accruals carried forward to the extent that realisation of the related tax benefits through future taxable profits is probable. The Group has unrecognised tax losses of $32,091,000 (2013: $20,579,000) for which no deferred tax asset has been recognised at the balance sheet date which can be carried forward and used to offset against future taxable income subject to meeting certain statutory requirements by those companies with unrecognised tax losses in their respective countries of incorporation. The unrecognised tax losses will mainly expire in 2018. 126 COSCO Corporation (Singapore) Limited Financial Statements NOTES TO THE FINANCIAL STATEMENTS For the financial year ended 31 December 2014 29. Deferred income taxes (continued) The movements in the deferred income tax assets and liabilities (prior to offsetting of balances within the same tax jurisdiction) during the financial year were as follows: The Group Deferred income tax liabilities Accelerated tax depreciation Beginning of financial year Charged to profit or loss End of financial year 2014 $’000 2013 $’000 130 4 134 130 – 130 Fair value gain Beginning of financial year Currency translation differences Charged/(credited) to other comprehensive income (Note 31(b)(v)) End of financial year 82 2 102 11 83 167 (31) 82 Undistributed profits of foreign subsidiaries Beginning of financial year Currency translation differences Charged/(credited) to profit or loss End of financial year 398 12 294 704 7,302 137 (7,041) 398 610 14 298 83 1,005 7,534 148 (7,041) (31) 610 Total Beginning of financial year Currency translation differences Charged/(credited) to profit or loss Charged/(credited) to other comprehensive income End of financial year Reconciliation of total deferred income tax liabilities after appropriate offsetting from the same tax jurisdiction is as follows: The Group Total deferred income tax liabilities Offsetting of deferred income tax assets from the same tax jurisdiction Total deferred income tax liabilities after appropriate offsetting from the same tax jurisdiction 2014 $’000 2013 $’000 1,005 (168) 610 (82) 837 528 Annual Report 2014 127 Financial Statements NOTES TO THE FINANCIAL STATEMENTS For the financial year ended 31 December 2014 29. Deferred income taxes (continued) The Group Deferred income tax assets 2014 $’000 2013 $’000 Tax losses Currency translation differences Credited to profit or loss End of financial year (565) (14,289) (14,854) – – – Provisions and accruals Beginning of financial year Change in tax rate Currency translation differences Credited to profit or loss End of financial year (225,294) – (6,243) (21,678) (253,215) (202,016) 3,299 (13,257) (13,320) (225,294) Total Beginning of financial year Change in tax rate Currency translation differences Credited to profit or loss End of financial year (225,294) – (6,808) (35,967) (268,069) (202,016) 3,299 (13,257) (13,320) (225,294) Reconciliation of total deferred income tax assets after appropriate offsetting from the same tax jurisdiction is as follows: The Group Total deferred income tax assets Offsetting of deferred income tax liabilities from the same tax jurisdiction Total deferred income tax assets after appropriate offsetting from the same tax jurisdiction Deferred income tax liabilities Undistributed profits of foreign subsidiaries Beginning of financial year Currency translation differences Charged/(credited) to profit or loss End of financial year 128 COSCO Corporation (Singapore) Limited 2014 $’000 2013 $’000 (268,069) (225,294) 168 82 (267,901) (225,212) The Company 2014 2013 $’000 $’000 398 12 294 704 7,302 137 (7,041) 398 Financial Statements NOTES TO THE FINANCIAL STATEMENTS For the financial year ended 31 December 2014 30. Share capital Issued share capital No. of ordinary shares Amount ’000 $’000 2014 Beginning and end of financial year 2,239,245 270,608 2013 Beginning and end of financial year 2,239,245 270,608 All issued shares are fully paid. There is no par value for these ordinary shares. Fully paid ordinary shares carry one vote per share and carry a right to dividends as and when declared by the Company. Share options The COSCO Group Employees’ Share Option Scheme 2002 (the “Scheme 2002”) was approved by members of the Company at an Extraordinary General Meeting on 8 May 2002. Under the Scheme 2002, share options to subscribe for the ordinary shares of the Company are granted to directors, key management personnel and employees. The exercise price of the granted options is determined at the average of the closing prices of the Company’s ordinary shares as quoted on the Singapore Exchange for the five market days immediately preceding the date of the grant. The options may be exercised in full or in part in respect of 1,000 shares or a multiple thereof, on the payment of the exercise price. The persons to whom the options have been issued have no right to participate by virtue of the options in any share issue of any other company. The Group has no legal or constructive obligation to repurchase or settle the options in cash. The aggregate number of shares over which options may be granted on any date, when added to the number of shares issued and issuable in respect of all options granted under the Scheme, shall not exceed 15% of the issued shares of the Company on the day preceding that date. Options issued to directors and employees who have been in the service of the Company, subsidiary or associated company, or the holding corporation for at least one year on or prior to the date of the grant, may be exercised twelve months after the date of grant but before the end of one hundred and twenty months. For employees and directors who are in the service of the associated company and non-executive directors, the options shall expire at the end of sixty months. Options issued at a discount to market price, may only be exercised two years after the date of the grant. Options issued to directors and employees who have been in the service of the Company, subsidiary or associated company, or the holding corporation for at least six months but less than one year on or prior to the date of grant, may be exercised twenty-four months after the date of the grant but before the end of one hundred and twenty months. For employees and directors who are in the service of the associated company and non-executive directors, the options shall expire at the end of sixty months. Options issued at a discount to market price, may only be exercised three years after the date of the grant. Particulars of the options granted pursuant to the Scheme 2002 in 2006, 2007 and 2008 known as “2006 Options”, “2007 Options” and “2008 Options” respectively were set out in the Directors’ Report for the financial years ended 31 December 2006, 31 December 2007 and 31 December 2008 respectively. Annual Report 2014 129 Financial Statements NOTES TO THE FINANCIAL STATEMENTS For the financial year ended 31 December 2014 30. Share capital (continued) Share options (continued) Movements in the number of unissued ordinary shares under option at the end of the financial year and their exercise prices are as follows: The Group and the Company Financial year ended 31 December 2014 Number of ordinary shares under option outstanding Lapsed Beginning during End of of financial financial financial year year year ’000 ’000 ’000 2006 Options 2007 Options 2008 Options 550 3,750 8,910 13,210 – (300) (500) (800) 550 3,450 8,410 12,410 Exercise price $ 1.23 2.48 2.95 Exercise period 21.2.2007 - 20.2.2016 5.2.2008 - 4.2.2017 24.3.2009 - 23.3.2018 Financial year ended 31 December 2013 Number of ordinary shares under option outstanding Lapsed Beginning during End of of financial financial financial year year year ’000 ’000 ’000 2006 Options 2007 Options 2008 Options 550 6,250 12,750 19,550 – (2,500) (3,840) (6,340) 550 3,750 8,910 13,210 Exercise price $ 1.23 2.48 2.95 Exercise period 21.2.2007 - 20.2.2016 5.2.2008 - 4.2.2017 24.3.2009 - 23.3.2018 As at 31 December 2014 and 2013, all outstanding options are exercisable. There was no share option issued in 2014 and 2013. There were also no shares of the Company allotted and issued by virtue of the exercise of options to take up unissued shares of the Company in 2014 and 2013. 31. Statutory and other reserves The Group (a) 130 Composition: Share option reserve Statutory reserve Currency translation reserve Asset revaluation reserve Fair value reserve Other reserve COSCO Corporation (Singapore) Limited 2014 $’000 2013 $’000 44,578 234,106 5,322 – 253 69 284,328 44,578 225,497 (28,031) 2,900 126 69 245,139 The Company 2014 2013 $’000 $’000 44,578 – – – – 527 45,105 44,578 – – – – 527 45,105 Financial Statements NOTES TO THE FINANCIAL STATEMENTS For the financial year ended 31 December 2014 31. Statutory and other reserves (continued) The Group (b) 2014 $’000 2013 $’000 44,578 44,578 The Company 2014 2013 $’000 $’000 Movements: (i) Share option reserve Beginning and end of financial year 44,578 44,578 The Group (ii) (iii) (iv) (v) Statutory reserve Beginning of financial year Transfer from retained earnings End of financial year Currency translation reserve Beginning of financial year Net currency translation differences of financial statements of foreign subsidiaries and associated companies Non-controlling interests End of financial year Asset revaluation reserve Beginning of financial year Revaluation reserve transferred to retained earnings End of financial year Fair value reserve Beginning of financial year Fair value gain/(loss) for available-for-sale financial asset (Note 18) Deferred tax (charged)/credited to other comprehensive income (Note 29) Non-controlling interests End of financial year 2014 $’000 2013 $’000 225,497 8,609 234,106 198,505 26,992 225,497 (28,031) (96,516) 53,105 (19,752) 5,322 118,317 (49,832) (28,031) 2,900 (2,900) – 6,118 (3,218) 2,900 126 173 332 (123) (83) 249 (122) 253 31 (92) 45 126 Statutory reserve represents the amount set aside in compliance with the local laws in the PRC where the subsidiaries of the Group reside. Statutory and other reserves are non-distributable. 32. Dividends The Group and Company 2014 2013 $’000 $’000 Ordinary dividends paid Final tax-exempt one-tier dividend paid in respect of the previous financial year of 1.0 cents (2013: 2.0 cents) per ordinary share 22,392 44,785 Annual Report 2014 131 Financial Statements NOTES TO THE FINANCIAL STATEMENTS For the financial year ended 31 December 2014 32. Dividends (continued) At the Annual General Meeting scheduled on 24 April 2015, a first and final tax-exempt one-tier dividend of 0.5 cent per ordinary share (2013: first and final tax-exempt one-tier dividend of 1 cent per ordinary share) amounting to a total of $11,196,000 (2013: $22,392,000), based on the number of shares issued as of 31 December 2014, will be recommended. These financial statements do not reflect the dividends recommended for the financial year ended 31 December 2014, which will be accounted for in equity as an appropriation of retained earnings in the financial year ending 31 December 2015. 33. Commitments (a) Capital commitments Capital expenditure contracted for at the balance sheet date but not recognised in the financial statements are as follows: The Group Property, plant and equipment (b) 2014 $’000 2013 $’000 53,960 86,564 Operating lease commitments – where the Group is a lessee The Group leases various office premises, docks and quays from non-related parties and related parties under non-cancellable operating lease agreements. The leases have varying terms, escalation clauses and renewal rights. The future aggregate minimum lease payables under non-cancellable operating leases contracted for at the balance sheet date but not recognised as liabilities, are as follows: The Group Not later than 1 year Later than 1 year but not later than 5 years Later than 5 years (c) 2014 $’000 2013 $’000 10,304 35,876 68,018 114,198 11,782 34,499 67,441 113,722 Operating lease commitments – where the Group is a lessor The Group leases out certain items of property, plant and equipment and investment properties to non-related parties and related parties under non-cancellable operating leases. The future minimum lease receivables under non-cancellable operating leases contracted for at the balance sheet date but not recognised as receivables, are analysed as follows: The Group Not later than 1 year Later than 1 year but not later than 5 years 132 COSCO Corporation (Singapore) Limited 2014 $’000 2013 $’000 6,865 25 6,890 17,711 434 18,145 Financial Statements NOTES TO THE FINANCIAL STATEMENTS For the financial year ended 31 December 2014 34. Financial risk management Financial risk factors The Group’s activities expose it to a variety of financial risks: market risk (including currency risk, interest rate risk and price risk), credit risk and liquidity risk. Risk management is carried out under policies approved by the Board of Directors. The Board approves guidelines for overall risk management, as well as policies covering these specific areas. (a) Market risk (i) Currency risk Currency risk arises from transactions denominated in currencies other than the respective functional currencies of the entities in the Group. The Group monitors its foreign currency exchange risk closely and where appropriate, enters into forward currency contracts to manage the currency exposure. In addition, the Group has certain investments in foreign operations, whose net assets are exposed to currency translation risk. Currency exposure to the net assets of the Group’s foreign operations in the People’s Republic of China is managed primarily through borrowings denominated in RMB and USD. The Group’s currency exposure based on the information available to key management is as follows: At 31 December 2014 Financial assets Cash and cash equivalents and available-for-sale financial assets Trade and other receivables, excluding advances paid to suppliers Receivables from subsidiaries Other financial assets Financial liabilities Borrowings Payables by subsidiaries Other financial liabilities SGD $’000 USD $’000 RMB $’000 Others* $’000 38,581 375,448 1,149,875 1,740 1,565,644 6,454 – 100 45,135 3,783,324 – – 4,158,772 282,190 31,085 2,874 1,466,024 1,560 – – 3,300 4,073,528 31,085 2,974 5,673,231 – – 10,434 10,434 4,290,927 – 106,107 4,397,034 681,767 31,085 1,972,479 2,685,331 – – 13,527 13,527 4,972,694 31,085 2,102,547 7,106,326 (1,433,095) Net financial assets/(liabilities) 34,701 (238,262) (1,219,307) (10,227) Less: Net financial assets/(liabilities) denominated in the respective entities’ functional currencies (34,980) (53,712) 1,219,307 – Add: Firm commitments and highly probable forecast transactions in foreign currencies Currency exposure – (279) 2,976,770 2,684,796 – – Total $’000 (15,193) (25,420) * Others mainly include Euro, Norwegian Kronor and Japanese Yen. Annual Report 2014 133 Financial Statements NOTES TO THE FINANCIAL STATEMENTS For the financial year ended 31 December 2014 34. Financial risk management (continued) (a) Market risk (continued) (i) Currency risk (continued) At 31 December 2013 Financial assets Cash and cash equivalents and available-for-sale financial assets Trade and other receivables, excluding advances paid to suppliers Receivables from subsidiaries Other financial assets Financial liabilities Borrowings Payables by subsidiaries Other financial liabilities SGD $’000 USD $’000 RMB $’000 18,955 793,135 1,217,874 2,824 2,032,788 2,057 – 103 21,115 2,192,357 – – 2,985,492 158,691 30,359 2,557 1,409,481 13 – – 2,837 2,353,118 30,359 2,660 4,418,925 – – 4,940 4,940 2,880,348 – 228,350 3,108,698 902,180 30,359 1,796,294 2,728,833 – – 12,398 12,398 3,782,528 30,359 2,041,982 5,854,869 (1,435,944) Net financial assets/(liabilities) 16,175 (123,206) (1,319,352) (9,561) Less: Net financial assets/(liabilities) denominated in the respective entities’ functional currencies (15,741) (56,118) 1,319,225 – Add: Firm commitments and highly probable forecast transactions in foreign currencies Less : Currency forwards Currency exposure – 2,249,944 – (79,581) – 434 (125,906) 1,944,714 – (127) – (89,142) * Others mainly include Euro, Norwegian Kronor and Japanese Yen. 134 Others* $’000 COSCO Corporation (Singapore) Limited Total $’000 Financial Statements NOTES TO THE FINANCIAL STATEMENTS For the financial year ended 31 December 2014 34. Financial risk management (continued) (a) Market risk (continued) (i) Currency risk (continued) The Company’s currency exposure based on the information available to key management is as follows: 2014 2013 SGD USD RMB Total SGD USD RMB Total $’000 $’000 $’000 $’000 $’000 $’000 $’000 $’000 Cash and cash equivalents 19,667 26,766 1 46,434 2,295 52,112 1 54,408 Trade and other receivables 56 – 31,085 31,141 1,411 4 30,359 31,774 19,723 26,766 31,086 77,575 3,706 52,116 30,360 86,182 17,378 – – 17,378 18,147 – 2 18,149 Net financial assets/(liabilities) 2,345 26,766 31,086 60,197 (14,441) 52,116 30,358 68,033 Less: Net financial assets/(liabilities) denominated in the entity’s functional currency (2,345) – – 14,441 – – – 26,766 31,086 – 52,116 30,358 Financial assets Financial liabilities Other financial liabilities Currency exposure If the USD changes against the SGD and RMB by 500 basis points (2013: 500 basis points) with all other variables including tax rate being held constant, the effects arising from the net financial asset position will be as follows: 2014 2013 Increase/(decrease) Profit after tax Profit after tax $’000 $’000 The Group USD against SGD - Strengthened - Weakened 810 (810) 1,712 (1,712) USD against RMB - Strengthened - Weakened (2,040) 2,040 (1,461) 1,461 The Company USD against SGD - Strengthened - Weakened 838 (838) 1,713 (1,713) RMB against SGD - Strengthened - Weakened 6,040 (6,040) 6,040 (6,040) Annual Report 2014 135 Financial Statements NOTES TO THE FINANCIAL STATEMENTS For the financial year ended 31 December 2014 34. Financial risk management (continued) (a) Market risk (continued) (ii) Price risk The Group is not exposed to any significant equity securities price risk. (iii) Cash flow and fair value interest rate risks Cash flow interest rate risk is the risk that the future cash flows of a financial instrument will fluctuate because of changes in market interest rates. Fair value interest rate risk is the risk that the fair value of a financial instrument will fluctuate due to changes in market interest rates. The Group has cash balances placed with reputable banks and financial institutions which generate interest income for the Group. The Group manages its interest rate risks by placing such balances on varying maturities and interest rate terms. The Group’s interest rate risk mainly arises from non-current borrowings. The Group monitors the interest rates on borrowings closely to ensure that the borrowings are maintained at favourable rates and will use derivative financial instruments to hedge their exposures when the exposure is significant. The Group’s borrowings at variable rates on which effective hedges have not been entered into, are denominated mainly in RMB and USD. If the RMB and USD interest rates increase/ decrease by 0.5% (2013: 0.5%) with all other variables including tax rate being held constant, the profit after tax will be lower/higher by Nil (2013: $465,000) and $15,577,000 (2013: $7,946,000) respectively as a result of higher/lower interest expense on these borrowings. (b) Credit risk Credit risk refers to the risk that a counter party will default on its contractual obligation resulting in financial loss to the Group. Concentrations of credit risk with respect to trade receivables are limited due to the Group’s large number of customers who are internationally dispersed. Due to these factors, management believes that no additional credit risk beyond the amount of allowance for impairment made is inherent in the Group’s and Company’s trade receivables. The Group has no significant concentrations of credit risk. The Group has policies in place to ensure that sales of products and services are made to customers with an appropriate credit history. A subsidiary in the Group obtained a pledge of 4 vessels (2013: 4 vessels) valued at US$78,000,000 (2013: US$100,000,000) to secure its outstanding trade receivables of US$6,400,000 (2013: US$6,400,000) as at 31 December 2014. The pledge was secured under a second preferred mortgage issued by the debtor to the subsidiary. Other than the above-mentioned, the Group and Company do not hold any other collateral. The maximum exposure to credit risk for each class of financial instruments is the carrying amount of that class of financial instruments presented on the balance sheet. The Group’s and Company’s major classes of financial assets are bank deposits, trade receivables (including amount due from customer on construction contracts) and other receivables (including loan to an associated company, staff advances, and dividend receivable from associated companies). 136 COSCO Corporation (Singapore) Limited Financial Statements NOTES TO THE FINANCIAL STATEMENTS For the financial year ended 31 December 2014 34. Financial risk management (continued) (b) Credit risk (continued) The credit risk for trade and other receivables based on the information provided to key management is as follows: The Group By business segments Ship repair, ship building and marine engineering Shipping Others (i) 2014 $’000 2013 $’000 4,068,673 4,846 9 4,073,528 2,345,955 7,156 7 2,353,118 Financial assets that are neither past due nor impaired Bank deposits that are neither past due nor impaired are mainly deposits with banks with high credit-ratings assigned by international credit-rating agencies. Trade and other receivables that are neither past due nor impaired are substantially companies with a good collection track record with the Group. (ii) Financial assets that are past due and/or impaired There is no other class of financial assets that is past due and/or impaired except for trade and other receivables. The age analysis of trade and other receivables past due but not impaired is as follows: The Group 2014 $’000 Past due 0 to 3 months Past due 3 to 6 months Past due over 6 months 2013 $’000 5,666 146,488 153,529 305,683 1,830 1,344 3,307 6,481 The carrying amount of trade and other receivables individually determined to be impaired and the movement in the related allowance for impairment are as follows: The Group 2014 $’000 2013 $’000 Gross amount Less: Allowance for impairment 49,815 (49,815) – 23,301 (23,301) – Beginning of financial year Currency translation differences Allowance made Allowance utilised End of financial year 23,301 1,560 25,787 (833) 49,815 16,905 1,208 5,228 (40) 23,301 Annual Report 2014 137 Financial Statements NOTES TO THE FINANCIAL STATEMENTS For the financial year ended 31 December 2014 34. Financial risk management (continued) (c) Liquidity risk The Group adopts prudent liquidity risk management by maintaining sufficient cash and having an adequate amount of committed credit facilities and the ability to close out market positions. Due to the dynamic nature of the underlying businesses, the Group aims at maintaining flexibility in funding by keeping committed credit facilities available. The table below analyses the maturity profile of the Group’s and Company’s financial liabilities (including forward currency contracts) based on contractual undiscounted cash flows. (d) Less than 1 year $’000 Between 1 and 5 years $’000 The Group At 31 December 2014 Other financial liabilities Borrowings (2,102,547) (2,538,874) – (2,602,556) – – At 31 December 2013 Gross-settled currency forwards - Receipts - Payments Other financial liabilities Borrowings 126,081 (125,906) (2,041,982) (2,005,616) – – – (1,899,274) – – – (7,641) The Company At 31 December 2014 Other financial liabilities (17,378) – – At 31 December 2013 Other financial liabilities (18,149) – – Over 5 years $’000 Capital risk The Group’s objectives when managing capital are to safeguard the Group’s ability to continue as a going concern and to maintain an optimal capital structure so as to maximise shareholder value. In order to maintain or achieve an optimal capital structure, the Group may adjust the amount of dividend payment, return capital to shareholders, issue new shares, obtain new borrowings or sell assets to reduce borrowings. Management monitors capital based on the return on shareholders’ fund. The return on shareholders’ fund was 1.5% per annum for the current financial year ended 31 December 2014 (2013: 2.3% per annum). The return on shareholders’ fund is calculated as net profit attributable to equity holders of the Company divided by average shareholders’ equity. The Group and the Company are in compliance with all externally imposed capital requirements for the financial years ended 31 December 2014 and 31 December 2013. 138 COSCO Corporation (Singapore) Limited Financial Statements NOTES TO THE FINANCIAL STATEMENTS For the financial year ended 31 December 2014 34. Financial risk management (continued) (e) Fair value measurements The following table presents assets and liabilities measured at fair value and classified by level of the following fair value measurement hierarchy: (i) quoted prices (unadjusted) in active markets for identical assets or liabilities (Level 1); (ii) inputs other than quoted prices included within Level 1 that are observable for the asset or liability, either directly (as prices) or indirectly (derived from prices) (Level 2); and (iii) inputs for the asset or liability that are not based on observable market data (unobservable inputs) (Level 3). Level 1 $’000 Level 2 $’000 Level 3 $’000 Total $’000 The Group 2014 Assets Available-for-sale financial assets - Quoted equity shares Total assets 795 795 – – – – 795 795 2013 Assets Available-for-sale financial assets - Quoted equity shares Forward currency contracts Total assets 438 – 438 – 770 770 – – – 438 770 1,208 There were no transfers between levels 1 and 2 during the year. The fair value of financial instruments traded in active markets (such as trading and available-for-sale securities) is based on quoted market prices at the balance sheet date. The quoted market price used for financial assets held by the Group is the current bid price. These instruments are included in Level 1. The fair value of financial instruments that are not traded in an active market (for example, overthe-counter derivatives) is determined by using valuation techniques. The Group uses a variety of methods and makes assumptions that are based on market conditions existing at each balance sheet date. The fair value of forward foreign exchange contracts is determined using quoted forward currency rates at the balance sheet date. These investments are classified as Level 2. In infrequent circumstances, where a valuation technique for these instruments is based on significant unobservable inputs, such instruments are classified as Level 3. The carrying amount less impairment provision of trade receivables and payables are assumed to approximate their fair values. The fair value of financial liabilities for disclosure purposes is estimated based on quoted market prices or dealer quotes for similar instruments by discounting the future contractual cash flows at the current market interest rate that is available to the Group for similar financial instruments. The carrying amount of current borrowings approximates their fair value. Annual Report 2014 139 Financial Statements NOTES TO THE FINANCIAL STATEMENTS For the financial year ended 31 December 2014 34. Financial risk management (continued) (f) Financial instruments by category The carrying amount of different categories of financial instruments is as disclosed on the face of the balance sheets and in Note 18 to the financial statements, except for the following: The Group Loans and receivables Financial liabilities at amortised cost (g) The Company 2014 2013 $’000 $’000 2014 $’000 2013 $’000 5,637,305 4,384,175 77,575 86,182 7,075,241 5,824,510 17,378 18,149 Offsetting financial assets and financial liabilities The financial assets and liabilities of the Group and the Company are not subject to enforceable master netting arrangements or similar agreement. Financial assets and liabilities are settled on a gross basis. 35. Immediate and ultimate holding corporation The Company’s immediate and ultimate holding corporation is China Ocean Shipping (Group) Company, registered in the People’s Republic of China. 36. Related party transactions (a) The Company is controlled by China Ocean Shipping (Group) Company (“COSCO”), the parent company and a state-owned enterprise established in the PRC. COSCO itself is controlled by the PRC government, which also owns a significant portion of the productive assets in the PRC. In accordance with amendment to FRS 24, other governmentrelated entities and their subsidiaries (other than COSCO group companies), directly or indirectly controlled, jointly-controlled or significantly influenced by the PRC government are also defined as related parties of the Group. On that basis, related parties include COSCO and its subsidiaries, other government-related entities and their subsidiaries directly or indirectly controlled, jointly controlled or significantly influenced by the PRC government, other entities and corporations in which the Company is able to control or exercise significant influence and key management personnel of the Company and COSCO as well as their close family members. The transactions conducted with government-related entities are based on terms agreed between the parties. 140 COSCO Corporation (Singapore) Limited Financial Statements NOTES TO THE FINANCIAL STATEMENTS For the financial year ended 31 December 2014 36. Related party transactions (continued) (a) (continued) In addition to the related party information and transactions disclosed elsewhere in the consolidated financial statements, the following is a summary of significant related party transactions entered into the ordinary course of business between the Group and its related parties during the financial year. The Group 2014 $’000 2013 $’000 Revenue Sales to ultimate holding corporation Sales to fellow subsidiaries Sales to associated companies Sales to related parties Rental income received/receivable from fellow subsidiaries Rental income received/receivable from associated companies Rental income received/receivable from related parties Service income received from ultimate holding corporation Service income received from fellow subsidiaries Service income receivable from associated companies Interest received/receivable from a fellow subsidiary Interest received/receivable from an associated company 123 52,177 221 – 931 11 62 81 1,719 556 13,210 18 – 47,182 83 873 975 16 75 101 3,101 340 13,708 33 Expenditure Purchases from fellow subsidiaries Purchases from associated companies Purchases of plant and equipment from a fellow subsidiary Rental paid/payable to fellow subsidiaries Vessel rental paid/payable to a fellow subsidiary Crew wages paid/payable to fellow subsidiaries Sub-contractor costs paid/payable to fellow subsidiaries Sub-contractor costs paid/payable to associated companies Utilities expenses paid/payable to a related party corporation Service expenses paid/payable to fellow subsidiaries Service expenses paid/payable to an associated company Service expenses paid/payable to related parties Insurance premium paid/payable to a fellow subsidiary Interest paid/payable to a fellow subsidiary 44,768 680 22 844 813 8,118 10,372 12,748 – 467 5 84 243 53 50,159 206 – 7,422 13,440 8,007 5,464 8,640 503 2,097 – 83 248 1,330 37 36 7 17 Commitments Operating lease commitments with fellow subsidiaries where the Group is a lessor Operating lease commitments with an associated company where the Group is a lessor Related parties refer to corporations related by common shareholders. Outstanding balances as at 31 December 2014, arising from sales or purchases of goods and services and loan from a fellow subsidiary, are set out in Notes 13, 26 and 27 respectively. Annual Report 2014 141 Financial Statements NOTES TO THE FINANCIAL STATEMENTS For the financial year ended 31 December 2014 36. Related party transactions (continued) (b) Share options granted to key management and non-executive directors There were no share options granted to key management and non-executive directors of the Group during 2014 and 2013. The share options were given on the same terms and conditions as those offered to other employees of the Company (Note 30). There were no outstanding number of share options granted to key management of the Group at the end of the financial year 2014 and 2013. (c) Key management personnel compensation Key management personnel compensation is as follows: The Group Salaries and other short-term employee benefits Directors’ fees of the Company Employer’s contribution to defined contribution plans including Central Provident Fund 2014 $’000 2013 $’000 2,806 305 3,045 305 9 3,120 9 3,359 Included in the above was total compensation to directors of the Company amounting to $2,808,000 (2013: $3,014,000). 37. Segment information Management has determined the operating segments based on the reports reviewed by the key management that are used to make strategic decisions. The key management considers the business from the business segment perspective. The segment in the People’s Republic of China derives revenue from ship repair, ship building and marine engineering activities. On the other hand, the segments in Singapore derive revenue from shipping, ship repair and marine engineering. 142 COSCO Corporation (Singapore) Limited Financial Statements NOTES TO THE FINANCIAL STATEMENTS For the financial year ended 31 December 2014 37. Segment information (continued) The segment information provided to the key management for the reportable segments is as follows: Shipping $’000 Ship repair, ship building and marine engineering activities $’000 All other segments $’000 51,611 – 51,611 4,208,197 1,885 4,210,082 897 20,550 21,447 4,260,705 22,435 4,283,140 (22,435) 4,260,705 5,510 98,536 (4,708) 99,338 45,807 (127,697) (197) 17,251 9,026 26,277 3,785 – 96,827 86 20 – 100,632 86 12,003 140,826 659 153,488 (850) – 26,637 124,504 – – 25,787 124,504 – 25 61,742 – – – 61,742 25 – 163 – 163 185,274 9,414,321 68,224 9,667,819 4,736 4,841 267,901 9,945,297 16,263 2,669,430 2,636 2,688,329 4,972,694 53,932 837 7,715,792 Total for continuing operations $’000 Financial year ended 31 December 2014 The Group Sales - External sales - Inter-segment sales Elimination Segment results Interest income Finance expense Share of loss of associated companies Profit before income tax Income tax credit Net profit Other segment items Capital expenditure - Property, plant and equipment Amortisation of deferred expenditure Depreciation of property, plant and equipment and investment properties Net (reversal)/allowance for impairment of trade and other receivables Write-down of inventories Allowance for expected losses recognised on construction contracts Provision for an onerous contract Allowance for impairment of property, plant and equipment Segment assets Associated companies Available-for-sale financial assets Deferred income tax assets Consolidated total assets Segment liabilities Borrowings Current income tax liabilities Deferred income tax liabilities Consolidated total liabilities Consolidated net assets 2,229,505 Annual Report 2014 143 Financial Statements NOTES TO THE FINANCIAL STATEMENTS For the financial year ended 31 December 2014 37. Segment information (continued) The segment information provided to the key management for the reportable segments is as follows: (continued) Ship repair, ship building and marine engineering activities $’000 All other segments $’000 54,731 – 54,731 3,452,505 1,741 3,454,246 898 33,951 34,849 3,508,134 35,692 3,543,826 (35,692) 3,508,134 734 129,030 (3,096) 126,668 44,712 (110,845) 407 60,942 (8,157) 52,785 2,536 – 59,318 86 1 – 61,855 86 11,397 171,467 661 183,525 839 – 4,389 23,678 – – 5,228 23,678 – 144 85,717 – – – 85,717 144 – 110 – 110 189,359 8,235,248 75,696 8,500,303 4,826 4,391 225,212 8,734,732 15,450 2,733,256 2,601 2,751,307 3,782,528 25,288 528 6,559,651 Shipping $’000 Total for continuing operations $’000 Financial year ended 31 December 2013 The Group Sales - External sales - Inter-segment sales Elimination Segment results Interest income Finance expense Share of profit of associated companies Profit before income tax Income tax expense Net profit Other segment items Capital expenditure - Property, plant and equipment Amortisation of deferred expenditure Depreciation of property, plant and equipment and investment properties Net allowance for impairment of trade and other receivables Write-down of inventories Allowance for expected losses recognised on construction contracts Provision for an onerous contract Allowance for impairment of property, plant and equipment Segment assets Associated companies Available-for-sale financial assets Deferred income tax assets Consolidated total assets Segment liabilities Borrowings Current income tax liabilities Deferred income tax liabilities Consolidated total liabilities Consolidated net assets 144 COSCO Corporation (Singapore) Limited 2,175,081 Financial Statements NOTES TO THE FINANCIAL STATEMENTS For the financial year ended 31 December 2014 37. Segment information (continued) Geographical information The Group’s business segments operate in two main geographical areas: People’s Republic of China - the operations in this area are principally in ship repair, ship building and marine engineering; and Singapore - the operations in this area are principally in shipping, ship repair and marine related activities and rental of property. Sales are based on the country in which the services are rendered to the customer. Non-current assets are shown by the geographical area where the assets are located. Sales People’s Republic of China Singapore * * 2014 $’000 2013 $’000 4,189,859 70,846 4,260,705 3,435,034 73,100 3,508,134 Non-current assets 2014 2013 $’000 $’000 2,438,684 134,114 2,572,798 2,385,232 138,140 2,523,372 The Group’s shipping companies operate in worldwide shipping routes. Hence, it would not be meaningful to allocate sales to any geographical segments for shipping activities. Revenue of approximately $Nil (2013: $491,272,000) is derived from a single customer. This revenue is attributable to the People’s Republic of China ship repair, ship building and marine engineering segment. 38. Contingent liability On 5 August 2013, a customer of a subsidiary served notice of termination on alleged grounds of delay in the delivery of a vessel, the construction of which is substantially completed. On 5 September 2013, the customer submitted a request for arbitration in London for which the customer claimed for a refund of the first instalment paid on the contract amounting to US$110 million together with interest thereon, damages and interest thereon, indemnity for future losses, further or other relief and costs. On 7 October 2013, the customer rejected the subsidiary’s without prejudice proposal to settle the matter. The subsidiary has appointed legal advisers in London in relation to the arbitration and is responding to the request for arbitration accordingly. Given the current stage of arbitration proceedings, the directors are of the opinion that it is difficult to quantify the eventual financial impact of the arbitration, if any, as at the date of these financial statements. Notwithstanding the arbitration proceedings, the subsidiary has on 13 January 2014 refunded the first instalment paid of US$110 million together with payment of interest thereon amounting to US$8.1 million to the customer. Annual Report 2014 145 Financial Statements NOTES TO THE FINANCIAL STATEMENTS For the financial year ended 31 December 2014 39. New or revised accounting standards and interpretations Below are the mandatory standards, amendments and interpretations to existing standards that have been published, and are relevant for the Group’s accounting periods beginning on or after 1 January 2015 or later periods and which the Group has not early adopted. FRS 24 Related Party Disclosures (effective for annual periods beginning on or after 1 July 2014) The standard is amended to include, as a related party, an entity that provides key management personnel services to the reporting entity or to the parent of the reporting entity (‘the management entity’). The reporting entity is not required to disclose the compensation paid by the management entity to the management entity’s employees or directors, but it is required to disclose the amounts charged to the reporting entity by the management entity for services provided. This amendment will not result in any changes to the Group’s accounting policies but will require more disclosures in the financial statements. FRS 40 Investment Property (effective for annual periods beginning on or after 1 July 2014) The standard is amended to clarify that FRS 40 and FRS 103 are not mutually exclusive. The guidance in FRS 40 assists preparers to distinguish between investment property and owneroccupied property. Preparers also need to refer to the guidance in FRS 103 to determine whether the acquisition of an investment property is a business combination. The Group will apply this amendment for acquisition of investment property taking place on/after 1 January 2015. FRS 102 Share-based payment (effective for annual periods beginning on or after 1 July 2014) The amendment clarifies the definition of vesting condition and separately defines ‘performance condition’ and ‘service condition’. The Group will apply this amendment from 1 January 2015, but this is not expected to have any significant impact on the financial statements of the Group. FRS 103 Business Combinations (effective for annual periods beginning on or after 1 July 2014) The standard is amended to clarify that an obligation to pay contingent consideration which meets the definition of a financial instrument is classified as a financial liability or as equity, on the basis of the definitions in FRS 32, Financial instruments: Presentation. The standard is further amended to clarify that all non-equity contingent consideration, both financial and non-financial, is measured at fair value at each reporting date, with changes in fair value recognised in profit and loss. The standard is also amended to clarify that FRS 103 does not apply to the accounting for the formation of any joint arrangement under FRS 111. The amendment also clarifies that the scope exemption only applies in the financial statements of the joint arrangement itself. The Group will apply this amendment for business combinations taking place on/after 1 January 2015. FRS 108 Operating Segments (effective for annual periods beginning on or after 1 July 2014) The standard is amended to require disclosure of the judgements made by management in aggregating operating segments. This includes a description of the segments which have been aggregated and the economic indicators which have been assessed in determining that the aggregated segments share similar economic characteristics. The standard is further amended to require a reconciliation of segment assets to the entity’s assets when segment assets are reported. This amendment will not result in any changes to the Group’s accounting policies but will require more disclosures in the financial statements. 146 COSCO Corporation (Singapore) Limited Financial Statements NOTES TO THE FINANCIAL STATEMENTS For the financial year ended 31 December 2014 39. New or revised accounting standards and interpretations (continued) FRS 113 Fair Value Measurement (effective for annual periods beginning on or after 1 July 2014) The amendment clarifies that the portfolio exception in FRS 113, which allows an entity to measure the fair value of a group of financial assets and financial liabilities on a net basis, applies to all contracts (including non-financial contracts) within the scope of FRS 39. This amendment is not expected to have any significant impact on the financial statements of the Group. FRS 15 Revenue from Contracts with Customers (effective for annual periods beginning on or after 1 January 2017) The standard deals with revenue recognition and establishes principles for reporting useful information to users of financial statements about the nature, amount, timing and uncertainty of revenue and cash flows arising from an entity’s contracts with customers. Revenue is recognised when a customer obtains control of a good or service and thus has the ability to direct the use and obtain the benefits from the good or service. The standard replaces FRS 18 Revenue and FRS 11 Construction contracts and related interpretations. The Group is assessing the impact of the standard on the financial statements. FRS 9 Financial Instruments (effective for annual periods beginning on or after 1 January 2018) The standard addresses the classification, measurement and recognition of financial assets and financial liabilities. The complete version of FRS 9 was issued in July 2014. It replaces the guidance in FRS 39 that relates to the classification and measurement of financial instruments. FRS 9 retains but simplifies the mixed measurement model and establishes three primary measurement categories for financial assets: amortised cost, fair value through other comprehensive income and fair value through P&L. The basis of classification depends on the entity’s business model and the contractual cash flow characteristics of the financial asset. Investments in equity instruments are required to be measured at fair value through profit or loss with the irrevocable option at inception to present changes in fair value in other comprehensive income not recycling. There is now a new expected credit losses model that replaces the incurred loss impairment model used in FRS 39. For financial liabilities there were no changes to classification and measurement except for the recognition of changes in own credit risk in other comprehensive income, for liabilities designated at fair value through profit or loss. FRS 9 relaxes the requirements for hedge effectiveness by replacing the bright line hedge effectiveness tests. It requires an economic relationship between the hedged item and hedging instrument and for the ‘hedged ratio’ to be the same as the one management actually use for risk management purposes. Contemporaneous documentation is still required but is different to that currently prepared under FRS 39. The Group has yet to assess the full impact of the standard on the financial statements. 40. Comparatives Certain comparative amounts have been reclassified for consistency with the presentation of the current year consolidated financial statements. The reclassification has no material impact to the Group. 41. Authorisation of financial statements These financial statements were authorised for issue in accordance with a resolution of the Board of Directors of COSCO Corporation (Singapore) Limited on 2 March 2015. Annual Report 2014 147 Financial Statements FIVE-YEAR SUMMARY Note PROFIT OR LOSS Sales Operating profit before taxation Share of (loss)/profit of associated companies Profit before income tax Income tax (expense)/credit Net profit Attributable to: Equity holders of the company Non-controlling interests Net profit Dividend 1 2 BALANCE SHEET Share capital Statutory and other reserves Retained earnings Non-controlling interests Total equity Trade and other receivables Available-for-sale financial assets Club memberships Investments in associated companies Investment properties Property, plant and equipment Intangible assets Deferred expenditure Deferred income tax assets Current assets Current liabilities Non-current liabilities Net Assets RATIOS Basic earnings per share (cents) Dividend per share (cents) Dividend cover (times) Net tangible assets per share (cents) Gearing ratio (Net of Cash) 3 4 5 2010 $’000 2011 $’000 2012 $’000 2013 $’000 2014 $’000 3,861,445 401,873 4,162,921 286,842 3,734,261 229,041 3,508,134 60,535 4,260,705 17,448 (27) 401,846 (43,420) 358,606 717 287,559 (74,195) 213,364 580 229,621 (59,842) 169,779 407 60,942 (8,157) 52,785 (197) 17,251 9,026 26,277 248,837 109,769 358,606 89,570 139,671 73,693 213,364 67,177 105,685 64,094 169,779 44,785 30,615 22,170 52,785 22,392 20,893 5,384 26,277 11,196 270,608 103,950 824,059 595,860 1,794,477 49,089 3,434 557 3,569 14,619 2,207,952 9,468 3,169 212,703 3,548,782 (3,817,496) (441,369) 1,794,477 270,608 181,320 849,305 699,241 2,000,474 63,867 4,407 390 4,102 14,405 2,412,126 9,526 3,211 241,513 4,246,963 (4,496,234) (503,802) 2,000,474 270,608 152,927 857,971 767,699 2,049,205 44,344 4,244 310 4,235 11,730 2,225,689 9,477 3,020 201,914 4,888,594 (3,778,379) (1,565,973) 2,049,205 270,608 245,139 820,027 839,307 2,175,081 36,874 4,391 303 4,826 11,293 2,227,868 9,539 3,066 225,212 6,211,360 (4,702,660) (1,856,991) 2,175,081 270,608 284,328 812,819 861,750 2,229,505 4,377 4,841 303 4,736 10,990 2,267,057 9,564 3,029 267,901 7,372,499 (5,172,565) (2,543,227) 2,229,505 11.1 4.0 2.8 53.1 0.1 6.2 3.0 2.1 57.7 0.4 4.7 2.0 2.4 56.8 1.0 1.4 1.0 1.4 59.2 1.3 0.9 0.5 1.9 60.7 2.5 Notes 1. The share of (loss)/profit of associated companies is net of tax. 2. The dividend for 2014 is calculated based on the number of shares issued as of 31 December 2014. The actual amount payable will be based on the number of shares issue at book closure date, which will be accounted for in equity as an appropriation of retained earnings in the financial year ending 31 December 2015. 3. Basic earnings per share is calculated as net profit attributable to equity holders of the company divided by the weighted average number of ordinary shares issued in the financial year. 4. The dividend cover is calculated as net profit attributable to equity holders of the Company divided by the amount of equity dividend. 5. Gearing ratio is derived by taking total borrowings (net of cash) over the shareholders’ funds. 148 COSCO Corporation (Singapore) Limited Financial Statements SHAREHOLDING STATISTICS As at 3 March 2015 STATISTICS OF SHAREHOLDERS AS AT 3 MARCH 2015 Class of Shares Voting Rights - Ordinary shares One Vote per share DISTRIBUTION OF SHAREHOLDERS AS AT 3 MARCH 2015 SIZE OF SHAREHOLDINGS 1 - 99 100 - 1,000 1,001 - 10,000 10,001 - 1,000,000 1,000,001 and above NO. OF SHAREHOLDERS 25 2,612 20,021 11,273 45 33,976 % NO. OF SHARES % 0.07 7.69 58.93 33.18 0.13 100.00 604 2,568,237 112,448,826 495,722,612 1,628,504,675 2,239,244,954 0.00 0.11 5.02 22.14 72.73 100.00 SUBSTANTIAL SHAREHOLDER AS AT 3 MARCH 2015 DIRECT INTEREST NO. NAME 1. CHINA OCEAN SHIPPING (GROUP) COMPANY NO. OF SHARES HELD 1,194,565,488 % 53.35 DEEMED INTEREST NO. OF SHARES HELD % – – NO. OF SHARES % TWENTY LARGEST SHAREHOLDERS AS AT 3 MARCH 2015 SHAREHOLDER’S NAME 1 2 3 4 5 6 7 8 9 10 11 12 13 14 15 16 17 18 19 20 CHINA OCEAN SHIPPING (GROUP) COMPANY SEMBCORP MARINE LTD CITIBANK NOMINEES SINGAPORE PTE LTD DBS NOMINEES PTE LTD UNITED OVERSEAS BANK NOMINEES PTE LTD RAFFLES NOMINEES (PTE) LTD UOB KAY HIAN PTE LTD SCM INVESTMENT HOLDINGS PTE LTD SEMBMARINE INVESTMENT PTE LTD BANK OF SINGAPORE NOMINEES PTE LTD OCBC SECURITIES PRIVATE LTD OCBC NOMINEES SINGAPORE PTE LTD PHILLIP SECURITIES PTE LTD HUI SHUNE MING @ HUI SHUN MENG HSBC (SINGAPORE) NOMINEES PTE LTD MAYBANK KIM ENG SECURITIES PTE LTD CIMB SECURITIES (SINGAPORE) PTE LTD CITIBANK CONSUMER NOMINEES PTE LTD DBS VICKERS SECURITIES (SINGAPORE) PTE LTD DBSN SERVICES PTE LTD TOTAL 1,194,565,488 70,000,000 54,993,959 43,563,120 33,512,608 26,833,528 23,059,970 21,000,000 20,400,000 17,316,949 17,054,024 11,049,169 9,161,710 7,800,000 7,212,976 6,850,881 5,948,010 5,777,112 5,543,000 4,642,084 1,586,284,588 53.35 3.13 2.46 1.95 1.50 1.20 1.03 0.94 0.91 0.77 0.76 0.49 0.41 0.35 0.32 0.31 0.27 0.26 0.25 0.21 70.87 COMPLIANCE WITH RULE 723 OF THE SGX-ST LISTING MANUAL Based on information available and to the best knowledge of the Company as at 3 March 2015 approximately 46.51% of the ordinary shares of the Company are held by the public. The Company is therefore in compliance with Rule 723 of the SGX-ST Listing Manual. Annual Report 2014 149 Financial Statements NOTICE OF ANNUAL GENERAL MEETING NOTICE IS HEREBY GIVEN THAT the Annual General Meeting of the Company will be held at Suntec Singapore International Convention & Exhibition Centre, 1 Raffles Boulevard, Suntec City, Singapore 039593, Meeting Room 331 – 332, Level 3 on Friday, 24 April 2015 at 3:00 p.m. for the purpose of transacting the following businesses: Ordinary Business: 1. To receive and adopt the Directors’ Report and Audited Financial Statements for the financial year ended 31 December 2014 together with the Auditors’ Report thereon. (Resolution 1) 2. To approve a First and Final tax-exempt (one-tier) Dividend of S$0.005 per ordinary share for the year ended 31 December 2014. (Resolution 2) 3. To approve payment of Directors’ Fees of S$305,000 for the year ended 31 December 2014. (last year: S$305,000) (Resolution 3) 4. To re-elect the following directors, on recommendation of the Nominating Committee and endorsement of the Board of Directors, who are retiring in accordance with Article 98 of the Articles of Association of the Company and who, being eligible, offer themselves for re-election: a. Mr Liu Lian An (See Explanatory Note 1) (Resolution 4) b. Mr Er Kwong Wah (See Explanatory Note 2) (Resolution 5) 5. To re-elect, on recommendation of the Nominating Committee and endorsement of the Board of Directors, Mr Liang Yan Feng, a Director who is retiring in accordance with Article 104 of the Articles of Association of the Company and who, being eligible, offer himself for re-election. (See Explanatory Note 3) (Resolution 6) 6. To re-appoint, on recommendation of the Nominating Committee and endorsement of the Board of Directors, Mr Tom Yee Lat Shing, a Director who will retire under Section 153(6) of the Companies Act (Cap 50), to hold office from the date of this Annual General Meeting until the next Annual General Meeting of the Company. (See Explanatory Note 4) (Resolution 7) 7. To re-appoint Messrs. PricewaterhouseCoopers LLP as Auditors and to authorise the Directors to fix their remuneration. (Resolution 8) Special Business: To consider and, if thought fit, to pass the following as Ordinary Resolutions, with or without modifications: 8. General Mandate to authorise the Directors to issue shares or convertible securities: “That pursuant to Section 161 of the Companies Act (Cap 50) and the Listing Rules of the Singapore Exchange Securities Trading Limited (the “Listing Rules”), authority be and is hereby given to the Directors to: 150 (a) issue shares in the capital of the Company (whether by way of bonus, rights or otherwise); or (b) make or grant offers, agreements or options that might or would require Shares to be issued, including but not limited to the creation and issue of (as well as adjustments to) warrants, options, debentures or other instruments convertible into Shares; COSCO Corporation (Singapore) Limited (Resolution 9) Financial Statements NOTICE OF ANNUAL GENERAL MEETING at any time and upon such terms and conditions and for such purposes as the Directors may in their absolute discretion deem fit provided that: 9. (i) the aggregate number of shares and convertible securities that may be issued shall not be more than 50% of the issued shares in the capital of the Company (calculated in accordance with (ii) below), of which the aggregate number of shares and convertible securities issued other than on a pro rata basis to existing shareholders must be not more than 20% of the issued shares in the capital of the Company (calculated in accordance with (ii) below); and (ii) for the purpose of determining the aggregate number of shares and convertible securities that may be issued pursuant to (i) above, the percentage of issued share capital shall be calculated based on the issued shares in the capital of the Company at the time of the passing of this resolution after adjusting for (a) new shares arising from the conversion or exercise of any convertible securities; (b) new shares arising from exercising share options or vesting of share awards outstanding or subsisting at the time of the passing of this resolution and (c) any subsequent consolidation or subdivision of shares; and (iii) unless revoked or varied by ordinary resolution of the shareholders of the Company in general meeting, this resolution shall remain in force until the next Annual General Meeting of the Company or the date by which the next Annual General Meeting of the Company is required by law to be held, whichever is earlier.” (See Explanatory Note 5) Proposed Renewal of Shareholders’ Mandate for Recurrent Interested Person Transactions (i) “That approval be and is hereby given for the renewal of the mandate for the purposes of Chapter 9 of the Listing Manual of the SGX-ST, for the Company, its subsidiaries and associated companies or any of them to enter into any of the transactions falling within the types of Interested Person Transactions, particulars of which are set out in the Appendix A (“Appendix”) to the Annual Report of the Company for the financial year ended 31 December 2014 with any party who is of the class of Interested Persons described in the Appendix provided that such transactions are made on normal commercial terms and will not be prejudicial to the interests of the Company and its minority shareholders and in accordance with the review procedures set out in the Appendix; (ii) That the Audit Committee of the Company be and is hereby authorised to take such actions as it deems proper in respect of such procedures and/or to modify or implement such procedures as may be necessary to take into consideration any amendment to Chapter 9 of the Listing Manual of the SGX-ST which may be prescribed by the SGX-ST from time to time; (iii) That the Directors of the Company be and are hereby authorised to complete and do all such acts and things (including all such documents as may be required) as they may consider expedient or necessary or in the interests of the Company to give effect to this Resolution; and (iv) That the authority conferred by this Resolution shall, unless revoked or varied by the Company in general meeting, continue in force until the conclusion of the next Annual General Meeting of the Company or the date by which the next Annual General Meeting of the Company is required by law to be held, whichever is earlier.” (See Explanatory Note 6) (Resolution 10) BY ORDER OF THE BOARD Teo Meng Keong Company Secretary Singapore, 2 April 2015 Annual Report 2014 151 Financial Statements NOTICE OF ANNUAL GENERAL MEETING Explanatory Notes on Business to be transacted 1. Mr Liu Lian An will, upon re-election as a Director, remain as a member of Enterprise Risk Management Committee. 2. Mr Er Kwong Wah will, upon re-election as a Director, remain as the Chairman of the Remuneration Committee and a member of the Enterprise Risk Management Committee, Nominating Committee, Audit Committee and Strategic Development Committee; and will be considered independent for the purpose of Rule 704(8) of the Listing Manual of the SGX-ST. 3. Mr Liang Yan Feng will, upon re-election as a Director, remain as a member of the Enterprise Risk Management Committee. 4. Mr Tom Yee Lat Shing will, upon re-appointment, remain as the Chairman of the Audit Committee and a member of the Nominating Committee, Remuneration Committee, Enterprise Risk Management Committee and Strategic Development Committee; and will be considered independent for the purposes of Rule 704(8) of the Listing Manual of the SGX-ST. 5. Ordinary Resolution 9 is to empower the Directors of the Company from the date of the above Meeting until the next Annual General Meeting to issue shares and/or convertible securities in the capital of the Company up to an amount not exceeding in aggregate 50% of the issued shares in the capital of the Company of which the total number of shares and convertible securities issued other than on a pro-rata basis to existing shareholders shall not exceed 20% of the issued shares in the capital of the Company at the time the resolution is passed, for such purposes as they consider would be in the interests of the Company. This authority will, unless revoked or varied at a general meeting, expire at the next Annual General Meeting of the Company. 6. Ordinary Resolution 10 is to renew the General Mandate to allow the Company, its subsidiaries and associated companies or any of them to enter into certain Recurrent Interested Person Transactions with person who are considered “Interested Persons” (as defined in Chapter 9 of the Listing Manual of the SGX-ST). The Company’s Audit Committee has confirmed that the methods and procedures for determining the transaction process have not changed since the last renewal of the Shareholders’ Mandate on 23 April 2014 in respect of transactions described in Section 2.1 of Schedule II of the Appendix; and since the approval of the additional Shareholders’ Mandate on 17 July 2007 in respect of transactions described in Section 2.2 of Schedule II of the Appendix; and that the said methods and procedures are sufficient to ensure that the Recurrent Interested Person Transactions will be carried out on normal commercial terms and will not be prejudicial to the interests of the Company and its minority shareholders. NOTES: i. A member of the Company entitled to attend and vote at a meeting is entitled to appoint one or two proxies to attend and vote in his stead. A proxy need not be a member of the Company. ii. Where a member appoints two proxies, the appointments shall be invalid unless he specifies the proportion of his shareholding (expressed as a percentage of the whole) to be represented by each proxy. iii. The instrument appointing a proxy or proxies must be deposited at the registered office of the Company at 9 Temasek Boulevard, #07-00 Suntec Tower Two, Singapore 038989 not later than 48 hours before the time fixed for holding the Annual General Meeting. iv. This instrument appointing a proxy or proxies must be under the hand of the appointer or his attorney duly authorised in writing. Where the instrument appointing a proxy or proxies is executed by a corporation, it must be executed either under its common seal or under the hand of any attorney duly authorised. v. A corporation which is a member may also authorise by resolution of its directors or other governing body, such person as it thinks fit to act as its representative at the meeting in accordance with Section 179 of the Companies Act (Cap 50). 152 COSCO Corporation (Singapore) Limited Financial Statements NOTICE OF ANNUAL GENERAL MEETING NOTICE OF BOOKS CLOSURE The Company had on 16 February 2015, subject to the approval of shareholders to the First and Final Dividend being obtained at the Annual General Meeting to be held on 24 April 2015, the Transfer Books and the Register of Members of the Company will be closed on 5 May 2015 for the preparation of dividend warrants for shareholders of ordinary shares registered in the books of the Company. Duly completed registrable transfers of ordinary shares in the capital of the Company (“Shares”) received by the Company’s Share Registrar, Tricor Barbinder Share Registration Services, 80 Robinson Road, #02-00, Singapore 068898 up to 5:00 p.m. on 4 May 2015 will be entitled to the proposed First and Final Dividend. Members whose Securities Accounts with The Central Depository (Pte) Limited are credited with Shares at 5:00 p.m. on 4 May 2015 will be entitled to the proposed First and Final Dividend. Payment of the dividends, if approved by members at the Annual General Meeting, will be made on 18 May 2015. BY ORDER OF THE BOARD Teo Meng Keong Company Secretary Singapore, 2 April 2015 Annual Report 2014 153 This page has been intentionally left blank. COSCO CORPORATION (SINGAPORE) LIMITED Important: (Incorporated in the Republic of Singapore) (Company Registration No.: 196100159G) 1. For investors who have used their CPF monies to buy the Company’s shares, this Annual Report is sent to them at the request of their CPF Approved Nominees solely FOR INFORMATION ONLY. 2. This Proxy Form is not valid for use by CPF investors and shall be ineffective for all intents and purposes if used or purported to be used by them. 3. CPF investors who wish to vote should contact their CPF Approved Nominees. ANNUAL GENERAL MEETING PROXY FORM I/We NRIC/Passport No. of being a member of Cosco Corporation (Singapore) Limited (the “Company”), hereby appoint Name Address NRIC/Passport No. Address NRIC/Passport No. Proportion of Shareholdings (%) And/or (delete as appropriate) Name Proportion of Shareholdings (%) as my/our proxy/proxies to attend and to vote for me/us on my/our behalf and, if necessary, to demand a poll, at the Annual General Meeting of the Company to be held at Suntec Singapore International Convention & Exhibition Centre, 1 Raffles Boulevard, Suntec City, Singapore 039593, Meeting Room 331 – 332, Level 3 on Friday, 24 April 2015 at 3:00 p.m. and at any adjournment thereof. I/We have indicated with an “X” in the appropriate box against the item how I/we wish my/our proxy/proxies to vote. If no specific direction as to voting is given or in the event of any item arising not summarised below, my/our proxy/proxies may vote or abstain at the discretion of my/our proxy/proxies. No. 1. 2. 3. 4. 5. 6. 7. 8. 9. 10. Resolutions ORDINARY BUSINESS To receive and adopt the Directors’ Report and Audited Financial Statements for the year ended 31 December 2014 together with the Auditors’ Report thereon. To declare a First and Final tax exempt (one-tier) Dividend of S$0.005 per ordinary share for the year ended 31 December 2014. To approve payment of Directors’ Fees. To re-elect Mr Liu Lian An, who is retiring under Article 98 of the Articles of Association of the Company. To re-elect Mr Er Kwong Wah, who is retiring under Article 98 of the Articles of Association of the Company. To re-elect Mr Liang Yan Feng, who is retiring under Article 104 of the Articles of Association of the Company. To re-appoint Mr Tom Yee Lat Shing, who is retiring pursuant to Section 153(6) of the Companies Act, Cap 50. To re-appoint Messrs. PricewaterhouseCoopers LLP as Auditors of the Company and to authorise the Directors to fix their remuneration. SPECIAL BUSINESS To authorise Directors to issue shares pursuant to Section 161 of the Companies Act, Cap 50. To approve the renewal of Shareholders’ Mandate for Recurrent Interested Person Transactions. Dated this day of 2015 Total No. of Shares in CDP Register Register of Members Signature of Member(s) or Common Seal IMPORTANT: Please Read Notes for This Proxy Form. For Against No. of Shares NOTES: 1. Please insert the total number of Shares held by you. If you have Shares entered against your name in the Depository Register (as defined in section 130A of the Companies Act, Chapter 50 of Singapore), you should insert that number of Shares. If you have Shares registered in your name in the Register of Members, you should insert that number of Shares. If you have Shares entered against your name in the Depository Register and Shares registered in your name in the Register of Members, you should insert the aggregate number of Shares entered against your name in the Depository Register and registered in your name in the Register of Members. If no number is inserted, the instrument appointing a proxy or proxies shall be deemed to relate to all the Shares held by you. 2. A Shareholder of the Company entitled to attend and vote at a meeting of the Company is entitled to appoint one or two proxies to attend and vote on his behalf. Such proxy need not be a Member of the Company. 3. Where a Shareholder appoints two proxies, the appointments shall be invalid unless he specifies the proportion of his shareholding (expressed as a percentage of the whole) to be represented by each proxy. 4. The instrument appointing a proxy or proxies must be deposited at the registered office of the Company at 9 Temasek Boulevard, #07-00 Suntec Tower Two, Singapore 038989 not less than 48 hours before the time set for holding the annual general meeting. The sending of a Proxy Form by a Shareholder does not preclude him from attending and voting in person at the annual general meeting if he finds that he is able to do so. In such event, the relevant Proxy Forms will be deemed to be revoked. First fold Please affix postage stamp COSCO CORPORATION (SINGAPORE) LIMITED 9 Temasek Boulevard, #07-00 Suntec Tower Two, Singapore 038989 Second fold 5. The instrument appointing a proxy or proxies must be under the hand of the appointer or of his attorney duly authorised in writing. Where the instrument appointing a proxy or proxies is executed by a corporation, it must be executed either under its seal or under the hand of a director or an officer or attorney duly authorised. 6. Where an instrument appointing a proxy or proxies is signed on behalf of the appointer by an attorney, the power of attorney (or other authority) or a duly certified copy thereof must (failing previous registration with the Company) be lodged with the instrument of proxy, failing which the instrument may be treated as invalid. 7. A corporation which is a Shareholder may authorise by resolution of its directors or other governing body such person as it thinks fit to act as its representative at the annual general meeting, in accordance with section 179 of the Companies Act, Chapter 50 of Singapore. 8. The Company shall be entitled to reject the instrument appointing a proxy or proxies if it is incomplete, improperly completed or illegible or where the true intentions of the appointer are not ascertainable from the instructions of the appointer specified in the instrument appointing a proxy or proxies. In addition, in the case of a Shareholder whose Shares are entered in the Depository Register, the Company may reject any instrument appointing a proxy or proxies lodged if the Shareholder, being the appointer, is not shown to have Shares entered against his name in the Depository Register as at 48 hours before the time appointed for holding the annual general meeting, as certified by The Central Depository (Pte) Limited to the Company. Third fold Apply glue here 9 Temasek Boulevard #07-00 Suntec Tower Two Singapore 038989 Telephone: 6885 0888 Facsimile: 6336 9006 w w w. c o s c o . c o m . s g


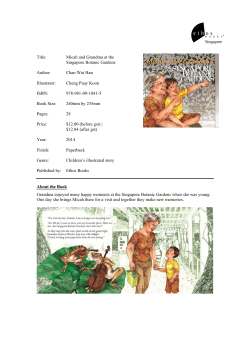

© Copyright 2026