
Day and Night-Time Drive Analysis using Stereo Vision for
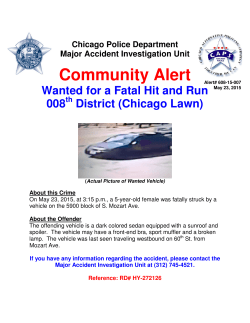
IEEE Intelligent Vehicles Symposium, June 2015 (to appear)
Day and Night-Time Drive Analysis using Stereo Vision for Naturalistic
Driving Studies
Mark P. Philipsen1,2 , Morten B. Jensen1,2 , Ravi K. Satzoda1 ,
Mohan M. Trivedi1 , Andreas Møgelmose2 , and Thomas B. Moeslund2
Abstract— In order to understand dangerous situations in
the driving environment, naturalistic driving studies (NDS)
are conducted by collecting and analyzing data from sensors
looking inside and outside of the car. Manually processing
the overwhelming amounts of data that are generated in
such studies is very comprehensive. We propose a method
for automatic data reduction for NDS based on stereo vision
vehicle detection and tracking during day- and nighttime. The
developed system can automatically register five NDS events,
mainly related to intersections, from an existing NDS dictionary.
We propose a new drive event which takes advantage of the
extra dimension provided by stereo vision.In total, six drive
events are selected on the basis of them being problematic to
detect automatically using conventional monocular computer
vision approaches. The proposed system is evaluated on dayand nighttime data, resulting in drive analysis report. The
proposed system reach an overall precision of 0.78 and an
overall recall of 0.72.
(a)
(b)
(c)
(d)
(e)
(f)
Fig. 1: Automatically detectable data and events. Green is
ego-vehicle, red is other vehicles. (a) Avg. vehicles in front
of ego-vehicle (b) Distance to rear-end of front vehicle. (c)
Vehicle turn to opposite direction. (d) Vehicle turn left across
path. (e) Vehicle drive straight across path. (f) Vehicle turn
to same direction.
I. INTRODUCTION & MOTIVATION
In 2011 a total of 253,108,389 vehicles were registered in
the USA [1], with this many vehicles on the road, crashes are
going to happen. In order to analyze the causes of crashes, a
lot of research has been done in naturalistic driving studies
(NDS). NDS are the study of data from everyday driving,
where a wide range of data are collected and analyzed.
The purpose is to provide insight into the patterns and
behaviors of drivers leading up to and during near-crashes
and crashes. [2] defines the scope of understanding vehicular
traffic behavior from video as being able to analyze and
recognize moving behavioral patterns and being able to
describe them using natural language.
The two most notable NDS are the 100-car study [3]
and the Strategic Highway Research Program(SHRP) [4],
[5], which try to determine patterns and factors impacting
the driver’s behavior on the road. Discovering these patterns
and factors could provide an indication of what sometimes
leads to crashes. The previously mentioned 100-car study
is based on data captured from 2 million miles on the
road, corresponding to nearly 4,300 hours of data, captured
from 240 different drivers in the span of 1 year. In the
more recent SHRP study, nearly 3,100 drivers have been
collecting data from six different places in the USA during
the 3-year study. The information is collected with a variety
of sensors, providing data such as speed, GPS-position,
vehicle dynamics, and video footage covering 360◦ around
1 Computer Vision and Robotics Research Laboratory, UC San Diego, La
Jolla, CA 92093-0434, USA
2 Visual Analysis of People Laboratory, Aalborg University, 9000 Aalborg, Denmark.
the vehicle. All this data is not straightforward to analyze.
In [6] the NDS data is categorized into:
•
•
•
Low-level: sensor data e.g. position from GPS.
Mid-level: drive events e.g. lane changes or traffic
density information.
High-level: high level semantics e.g. driver behavior or
driving styles.
In [7], [8], data reduction for NDS is carried out manually
by trained personnel, e.g. hand-labeling a sequence of video
footage. The hand-labeling of events must be consistent,
therefore a dictionary, such as the one found in [9] is used.
This NDS dictionary was adapted in SHRP. If processing of
the collected data could be automated, it would allow for
more comprehensive studies. 61% of daytime and 38% of
night time crashes involve multiple vehicles [10], therefore
NDS events based on detection and tracking of other
vehicles are essential. Since a disproportionate number of
crashes happen at night [11], it is important to also to detect
vehicles during nighttime. Intersection are especially prone
to crashes, since vehicles need to cross paths. To the best
of the authors’ knowledge, non of the current published
work in the area of data reduction for NDS, utilize stereo
vision for automatic drive analysis. [12] detects objects’ 3D
location and orientation in intersection traffic scenes using
scene information from stereo images. However, it is not
used for NDS, nor evaluated on nighttime data. In [13], the
symmetry and color rear-lamp pairs are utilized for detection
and tracking. A similar approach is used in [14], where
IEEE Intelligent Vehicles Symposium, June 2015 (to appear)
the proposed system is limited to only consider scenarios
where vehicles are fully visible. The same paper provides
a brief overview of how monocular vehicle detection has
trouble dealing with variations in lighting, weather, changing
vehicle shape, and color. The most notable issue with these
approaches is that the detection is highly depended on both
rear-lamps being visible. Stereo vision is used in [15] to
track a vehicle after detecting it using monocular vision.
The purpose of introducing stereo vision is to make their
system more robust to occlusion. This is also discussed in
[16], where the introduction of 3D shows promising results
and alleviate some occlusion issues. Most vehicle detection
is done in the monocular domain, as e.g in [17] where
lane detection is included for localizing and tracking the
vehicles and in [18] where parts of vehicles are detected
and tracking, the same paper remarks that detecting the
turning vehicles in intersection is especially challenging.
Monocular systems which aspire to detect vehicle from all
possible viewpoints and under changing light conditions,
requires a large amount of varied training data.
In this paper, we introduce a stereo vision system for
automatic NDS data reduction on both day- and nighttime
data. This enables detection and tracking of vehicles in
scenarios that would be problematic for monocular detectors.
The proposed system will handle a handful of NDS events,
which especially benefit from the extra dimension in stereo
vision. The treated NDS events are illustrated in Figure 1.
The contributions made in this paper are:
• Using stereo vision for automatic data reduction for
NDS on both day- and nighttime data, with focus on
intersections (Figure 1c, 1d, 1e, 1f).
• Using stereo vision for determining the average number
of vehicles in front of the ego-vehicle. (Figure 1a).
• Introducing a new NDS event: Average distance to
vehicles directly in front of the ego-vehicle. (Figure 1b).
The rest of the paper is organized as follows: In Section
II, related work in the area of data reduction for NDS is
presented followed by an overview of recent work on stereo
vision for obstacle detection on roads. An overview of the
developed system and the drive semantics that we wish to
label automatically are presented in Section III. In section IV
the methods which constitute the system are presented. The
results are discussed in Section V, followed by concluding
remarks in Section VI.
II. RELATED WORK
Before developing a stereo vision system to be used for
generating a drive analysis report, we briefly present some of
the recent research published with regards to automatic NDS
data reduction. Furthermore, we introduce some of the recent
and most notable work in the field of object detection with
stereo vision. This is limited only consider stereo vision with
the purpose of either improving the disparity with regard to
object detection in traffic scenes and work that utilizes stereo
vision for vehicle detection.
A. NDS Data Reduction
In [19], the statistics of near-crashes and crashes are used
to identify factors related to driver associated risks, such as
age, experience, gender, and demographic. Similar studies
are conducted in [20], where results show that near-crash
and crash percentage among teenagers were 75 % lower in
the presence of adult passengers and 96 % higher among
teenagers with risky friends. In [21] NDS are used to quantify
distracting activities from e.g. a mobile phone, that results in
loss of concentration. Results show that a driver in average
is engaged in a distracting activity every 6 minutes, which
could results in a near-crash or crash.
The process for manual data reduction for NDS is quite
comprehensive and time consuming, it is therefore desirable
to automate it by e.g. applying computer vision to understand
the traffic scene. An example of one such study is seen
in [6], where monocular computer vision and information
from the CAN bus is used to automatically detect 23 drive
events, including lane position, vehicle localization within
lanes, vehicle speed, traffic density, and road curvature. In
[22], a system is developed for automatic labeling driver
behavior events with regards to overtaking and receding
vehicle detection. This type of system is categorized as
Looking-In and Looking-Out(LiLo), which is discussed in
depth in [23]. LiLo fits well with using multiple inputs
to understand the driver’s behavior. An example of Li is
[24] where driver behavior with respect to hand activity is
evaluated.
B. Object Detection Using Stereo Vision
In [25], a review of the research conducted since 2005
in both monocular and stereo vision with respect to visionbased vehicle detection is presented. Before 2005, [26]
conducted a review of on-road vehicle detection. Most of
the research published with regard to vehicle detection is
evaluating the methods on data, representing a limited part
of the challenges. In [27] the accurate and efficient SemiGlobal Matching(SGM) is introduced. SGM make use of
epipolar geometry, and in most cases a set of rectified stereo
images. Horizontal lines in the images are used as a scan
lines, matches are then found with a 1D disparity search. A
match for a pixel in the left image is found in the right image
by searching through the corresponding horizontal line and
locating the most similar block to a reference block around
the original pixel in the left image. The offset between these
pixels is known as the disparity, which is directly related to
the distance to the corresponding object. In the same paper,
the LR-RL-consistency check is proposed for reducing noise
in the calculated disparity image.
In [28], [29], the so-called v-disparity is generated and
used for separating objects from the ground/road surface. The
v-disparity examines the vertical coordinates in a (u,v) image
coordinate system and is constructed using a disparity map
from, e.g. the SGM algorithm. What is especially histograms
are calculated for each row in the disparity. Significant
surfaces in the disparity map will then show up as lines in
the v-disparity.
IEEE Intelligent Vehicles Symposium, June 2015 (to appear)
Fig. 2: Flow diagram of the developed system, illustrated with both day- and nighttime data.
In [30], 6D-vision is introduced, where features are found
in the left monocular image and then located in 3D by
using the stereo images. For each feature point, a Kalman
filter is used to estimate a 6D vector consisting of the 3D
position and 3D motion vector. [30] is able to do egomotion compensation by identifying the static 6D points.
The predicted static world points are then compared to the
remaining points to isolate the ego-motion. In [31], this
work is continued and by using 6D-vision, tracked feature
points are represented as stixels, which is a vertical areas of
equal disparity. The tracked objects are being classified using
prior knowledge of vehicle shapes. Alternatively, objects
can be classified using clustering in the disparity map, as
seen in [28]. In [32], [33], temporal and scene priors from
good conditions are used with the purpose of improving
the disparity map in adverse weather conditions, such as
night, rain, and snow. Using these priors, the object detection
rate improves on a database of 3000 frames including bad
weather while reducing the false positive rate.
IV. METHODS
In this section all of the methods which are used in the
proposed system are presented. The section is divided into
subsections corresponding to the stages seen in Figure 2.
A. Generate Disparity Map & Noise Removal
Stereo images captured under poor conditions may contain
very dark, very bright, or otherwise untextured regions
causing noise and artifacts in the disparity map. Besides
this, inconsistencies between the image pairs may arise in
an uncontrolled environment e.g. because of reflections in
the camera lenses. A noisy disparity map is bound to lead to
problems later in the system, therefore the disparity map is
post-processed in an attempt to reduce the number of noisy
pixels. Figure 3 shows an examples of a two noisy disparity
image in the left box. In the right box, the two corresponding
noise reduced disparity images are seen.
III. SYSTEM OVERVIEW
The flow of the system is shown in Figure 2. A Bumblebee
XB3 stereo camera is used to acquire stereo image pairs with
a capture speed of 16 FPS in an resolution of 1280x960.
These images are rectified using the factory calibration. A
disparity map is generated and noisy pixels are removed.
The road surface is removed using the detected line in a
corresponding v-disparity. The remaining pixels are considered vehicle candidate pixels. These pixels are projected into
3D world coordinates and outliers are removed. Clusters are
found by grouping points that are close neighbors. Each
sufficiently big cluster is regarded as a detected vehicle. The
clusters’ center points are used for nearest neighbor tracking
between frames and for determining the distances from egovehicle to detected vehicles. Before the detected vehicles’
movement between frames is determined, their movement is
adjusted according to the ego-vehicles motion. Finally, the
vehicles are tracked, and NDS event are detected and logged
in a drive analysis report.
Fig. 3: Examples of raw day and night-time disparity maps
and the corresponding noise reduced disparity maps.
1) LR-RL consistency check: By using first left and then
right image as reference, when searching for matches in
the stereo pair, a so called LR-RL consistency check is
done. The LR-RL consistency check is used a little differently compared to the original proposal in [27] and the
implementation provided by OpenCV. We wish to keep as
many disparity pixels as possible for later stages. In case of
a disparity difference in the consistency check, the lowest
IEEE Intelligent Vehicles Symposium, June 2015 (to appear)
value is simply selected as the output pixel, rather than
discarding the pixel entirely. The result this modified LRRL consistency check versus the traditional, with a maximum
disparity difference of 5 is seen in Figure 4.
found. The remaining x and y components of the world coordinate are the column and row index of the disparity pixel.
Equation (1) shows the relations that make this possible.
z=
(a)
(b)
Fig. 4: (a) Traditional LR-RL consistency check. (b) Proposed LR-RL consistency check.
2) Temporal consistency check: By looking at the value
of a pixel in the previous frame and comparing it with the
value in the current frame, a significant amount of noise
can be removed. This check is based on the assumption
that it is uncommon for correctly matched disparity pixels
to erratically change value from frame to frame. In case of
movement, this check will result in a dark edge around the
moving objects in the disparity map.
3) Monocular color check: Large uniform regions are
problematic when calculating the disparity map as they may
result in artifacts and noise. Especially in night scenes, a
large part of the images consist of dark regions. The same
is the case in brightly lit scenes. Over and under exposure
can be handled to some degree by adjusting the camera
accordingly. Regions are removed by searching for pixels
with values very close to either of the extremes in the left
monocular RGB image. As these pixels are considered as
sources of noise, they are simply masked out in the disparity
map.
B. Road Surface Removal
The noise reduced disparity map contains disparities for
road surface pixels and obstacle pixels. Since the vehicles
that must be detected are found among the obstacle pixels,
the disparity pixels associated with the road surface must be
removed.
1) Road surface detection using v-disparity: The road
surface is found by searching for the most significant line in
the v-disparity using RANSAC. This method will not work
well unless parts of the road surface is visible. In cases where
a satisfactory line cannot be found, the last good line is used
for road surface removal. Additionally, the line parameters
are filtered using a Kalman filter to smooth out faulty road
surface estimations. The calculated line is then used as a
threshold for determining if pixels belong to objects above
the road surface.
C. Project To Point Cloud & Cloud Filtering
1) Projecting disparity image to 3D point cloud: Using
the camera’s focal length f (in pixels) and baseline b(in
meters), along with the calculated disparity d(in pixels), the
actual distance z to objects in the camera’s view can be
f ·B
d
x=
col · z
f
y=
row · z
f
(1)
Only disparity map pixels above a certain threshold are
projected to 3D world points. This is due to the exponentially increasing inaccuracy with lower disparity values,
which makes it difficult to determine whether point is noise,
background, or in fact belong to an object.
D. Vehicle Segmentation in Point Cloud
The acquired point cloud is preprocessed in the following
steps in order to clean up the data points for segmentation
into clusters constituting vehicles.
1) A pass through filter removes near and distant points.
These point degrade performance and can be removed
since they are of little interest.
2) Remaining points are downsampled using a voxel grid,
insuring an even distribution of points and greatly
reduces the number of points, resulting in a reduced
processing time.
3) Outlier removal based on mean distance to neighboring points compared to a global mean and standard
deviation.
Clusters are found by creating a k-d tree which organizes
points according to their distance to neighbors, this enables
efficient searches in the 3D point cloud.
E. Vehicle Tracking
In order to understand what other drivers are doing in
relation to the ego-vehicle, their vehicles must be tracked.
This is done based on the center point of each of the
segmented clusters, these center points are filtered using a
Kalman filter in order to make the prediction of a match in
the following frame more accurate. The best match is found
using the euclidean distance between the predicted center
point and the segmented center point in the next frame.
F. Visual Ego-Motion Compensation
For compensating for the subject vehicle’s ego-motion
while e.g. approaching an intersection, we utilize the LIBVISO2: C++ Library for Visual Odometry 2 which can
calculate the translation and rotation between moving frames
captured by stereo camera. For further explanation we refer
to [34].
G. NDS Event Detection
For all detected vehicles, individual frame to frame movements are categorized to form a basis for determining which
NDS events have occurred. Figure 5 shows the different
movements that are detected. Based on the movements, a
histogram is created and used for classifying the NDS event
type. The arrows symbolizes vectors between vehicle center
points and the attached letters indicate the movement type.
IEEE Intelligent Vehicles Symposium, June 2015 (to appear)
detected events(FP), and finally missed events(FN). Precision
and recall are calculated according to (2).
TP
TP
(2)
Recall =
TP + FP
TP + FN
Precision is the ratio of correct event detections compared
to the actual number of events. Recall is the ratio of correct
event detections compared to the total number of detections.
In Figure 7, an example of the NDS event left turn across
Path is seen. The blue cross represents the cluster’s center of
mass, the blue text, next to the blue circle, is the measured
distance from ego-vehicle to the vehicle’s closest point. The
blue text stating, "R" and "OR" next to the green circle, tells
that the detected vehicles’ movements are determined to be
right and opposite right movement, respectively.
P recision =
Fig. 5: Movements detected by the system. Every movement
is seen from the viewpoint of the ego-vehicle. S (same
direction), SR (same direction and towards the right), SL
(same direction and towards the left), O (opposite direction),
OR (opposite direction and towards the right), OL (opposite
direction and towards the left), R (right), L (left).
In addition to the movements seen in Figure 5, a category
is created for cases where little or no movement are detected.
This category is labeled OO. A movement histogram is
created for each vehicle, where a bin corresponds to one
type of movement. The histogram is matched to a training
histogram for each of the NDS events. Figure 6 shows an
example on one such histogram.
Fig. 6: Example of histogram of detected movements.
The following four NDS event are each described by
specific training histograms.
• Other vehicle turn left across path.
• Other vehicle turn onto opposite direction.
• Other vehicle drive straight across path.
• Other vehicle turn onto same direction.
Additionally, we quantify the existing NDS event, Average
number of cars in front of ego-vehicle. The total number of
detected vehicles is recorded for each frame throughout the
entire video sequence and the average is calculated when
the NDS rapport is generated. The purpose is to quantify the
traffic scene density, by the average number of vehicles in
front for the ego-vehicle. Finally we propose a new NDS
event which is the average distance to the rear end of the
vehicle directly in front of the ego-vehicle. This is meant as
a measure of the ego-vehicle driver’s aggressiveness.
V. RESULTS
The system is evaluated based on 14 day and 12 night
video sequences. In each sequence the occurrence of each
event, also referred to as the ground truth (GT) is manually hand-labeled. Precision and recall are found using the
system output(SO), correctly detected events(TP), incorrectly
Fig. 7: Partially occluded vehicle detected in a left turn.
In Table I the results are shown. The 12 nighttime video
sequences consists of a total of 3933 frames. The 14 daytime
videos consists a total of 4992 frames. A result of e.g 35/32
corresponds to 32 manually annotated GT events and 35
system detections. For calculating the precision and recall,
each classification done by the system is manually defined
as either a TP, FP, or FN. The listed precision and recall
numbers are a total from both day- and nighttime data.
TABLE I: Summary of drive analysis from NDS. Results are
listed as [SO/GT]. P and R are abbreviations for precision
and recall.
Drive Behavior Event
Daytime
Nighttime
P
R
Right - straight across path
Left - straight across path
Left turn across path
Turn onto opposite dir.
Short turn onto same dir.
Long turn onto same dir.
Avg. number of cars
Avg. distance to car
35/32
45/34
5/5
32/37
7/5
1/16
1.67/1.74
8.73 m
5/19
11/33
20/1
41/15
9/5
1/8
1.6/1.3
10.98 m
0.95
0.87
0.75
0.68
0.63
1
NA
NA
0.63
0.67
1
0.93
1
0.09
NA
NA
Table I indicates that the proposed system is able to handle
most of the events. However, the system often had difficulties
with detecting vehicle far away, especially at night, resulting
in poor performance for vehicles turning onto the same
direction. The average distance to the vehicle in front of
the ego-vehicle was found to be shorter during the daytime,
which could indicate people are using a larger safety distance
when the visibility is decreased, or it might be a result of
lower traffic density in those hours.
Future improvements to the system includes creating a
mask using top-hat morphology instead of the monocular
IEEE Intelligent Vehicles Symposium, June 2015 (to appear)
color check for removing big texture-less regions. The color
check method removes big parts of black and white vehicles.
It was not possible to verify the accuracy of the measured
average distance to vehicles, based on the video clips that
were used for testing. Finding the ground truth using a laser
range finder would be interesting to establish the accuracy
of the distance measurements. The ego-motion compensation
proved useful, but the estimates were noisy at times. The
exact motion of the vehicle can alternatively be extracted
from the CAN bus. More significant was the impact from
the tracked center points of vehicles, which would shift
back and fourth based on the quality of the disparity map.
These two issues were the main contributors to wrong event
classifications. The varying performance can be attributed
to the difficult conditions under which much of the image
data was collected. Most false negatives were a result of
occlusions or incorrect road surface detection.
VI. CONCLUSION
We presented a system using stereo vision for automatic
data reduction in NDS with focus on intersections and distance measurements. The use of stereo vision is considered
beneficial, especially in scenarios such as the one seen in
Figure 7. The system proved to work in both day and
nighttime conditions with a drop in overall performance
for the night sequences. Experiments show very promising
detection, trajectory, and automatic event classification rates
with an overall precision of 0.78 and recall of 0.72.
Future work includes looking at additional NDS events
where stereo vision can be utilized and identifying the exact
accuracy of the distance measurements achieved with stereo
vision.
R EFERENCES
[1] U.S. Department of Transportation - Bureau of Transportation Systems, “National transportation statistics,” 2011.
[2] B. T. Morris and M. M. Trivedi, “Understanding vehicular traffic
behavior from video: a survey of unsupervised approaches,” Journal
of Electronic Imaging, vol. 22, pp. 041 113–041 113, 2013.
[3] V. L. Neale, T. A. Dingus, S. G. Klauer, J. Sudweeks, and M. Goodman, “An overview of the 100-car naturalistic study and findings,”
National Highway Traffic Safety Administration, Paper, 2005.
[4] L. N. Boyle, S. Hallmark, J. D. Lee, D. V. McGehee, and N. J. Ward,
“Integration of analysis methods and development of analysis plan,”
Transportation Research Board of the National Academics, Tech. Rep.,
2012.
[5] G. Davis and J. Hourdos, “Development of analysis methods using
recent data: Shrp2 safety research,” Transportation Research Board of
the National Academics, Tech. Rep., 2012.
[6] R. Satzoda and M. Trivedi, “Drive analysis using vehicle dynamics
and vision-based lane semantics,” Intelligent Transportation Systems,
IEEE Transactions on, pp. 1–10, 2014.
[7] D. LeBlanc, “Road departure crash warning system field operational
test: methodology and results. volume 1: technical report,” 2006.
[8] T. A. Dingus, S. Klauer, V. L. Neale, A. Petersen, S. E. Lee, J. Sudweeks, M. A. Perez, J. Hankey, D. Ramsey, S. Gupta, C. Bucher, Z. R.
Doerzaph, J. Jermeland, and R. Knipling, “The 100-car naturalistic
driving study phase ii, results of the 100-car field experiment,” 2006.
[9] Virginia Tech Transportation Institute (VITTI), “Researcher dictionary
for video reduction data,” Tech. Rep., 2012.
[10] National Highway Traffic Safety Administration, “Passenger vehicle
occupant fatalities by day and night a contrast,” 2012.
[11] US National Library of Medicine National Institutes of Health, “Road
traffic casualties understanding the nighttime death toll,” 2012.
[12] A. Geiger, M. Lauer, C. Wojek, C. Stiller, and R. Urtasun, “3d traffic
scene understanding from movable platforms,” Pattern Analysis and
Machine Intelligence (PAMI), 2014.
[13] R. O’Malley, E. Jones, and M. Glavin, “Rear-lamp vehicle detection
and tracking in low-exposure color video for night conditions,” Intelligent Transportation Systems, IEEE, vol. 11, pp. 453–462, June
2010.
[14] R. O’Malley, M. Glavin, and E. Jones, “Vehicle detection at night
based on tail-light detection,” 2010.
[15] E. Ohn-Bar, S. Sivaraman, and M. Trivedi, “Partially occluded vehicle
recognition and tracking in 3d,” in Intelligent Vehicles Symposium (IV),
2013 IEEE. IEEE, 2013, pp. 1350–1355.
[16] N. Buch, S. A. Velastin, and J. Orwell, “A review of computer vision
techniques for the analysis of urban traffic,” Intelligent Transportation
Systems, IEEE, vol. 12, pp. 920–939, 2011.
[17] S. Sivaraman and M. M. Trivedi, “Integrated lane and vehicle detection, localization, and tracking: A synergistic approach,” Intelligent
Transportation Systems, IEEE, vol. 14, pp. 906–917, 2013.
[18] ——, “Vehicle detection by independent parts for urban driver assistance,” Intelligent Transportation Systems, IEEE, vol. 14, pp. 1597–
1608, 2013.
[19] F. Guo and Y. Fang, “Individual driver risk assessment using naturalistic driving data,” Accident Analysis & Prevention, vol. 61, pp. 3 –
9, 2013, emerging Research Methods and Their Application to Road
Safety Emerging Issues in Safe and Sustainable Mobility for Older
Persons The Candrive/Ozcandrive Prospective Older Driver Study:
Methodology and Early Study Findings.
[20] B. G. Simons-Morton, M. C. Ouimet, Z. Zhang, S. E. Klauer, S. E.
Lee, J. Wang, R. Chen, P. Albert, and T. A. Dingus, “The effect of
passengers and risk-taking friends on risky driving and crashes/near
crashes among novice teenagers,” Journal of Adolescent Health,
vol. 49, pp. 587 – 593, 2011.
[21] S. P. McEvoy, M. R. Stevenson, and M. Woodward, “The impact of
driver distraction on road safety: results from a representative survey
in two australian states,” Injury prevention, vol. 12, pp. 242–247, 2006.
[22] R. Satzoda and M. Trivedi, “Overtaking amp; receding vehicle detection for driver assistance and naturalistic driving studies,” in Intelligent
Transportation Systems (ITSC), IEEE, 2014, pp. 697–702.
[23] M. M. Trivedi, T. Gandhi, and J. McCall, “Looking-in and lookingout of a vehicle: Computer-vision-based enhanced vehicle safety,”
Intelligent Transportation Systems, IEEE Transactions on, vol. 8, pp.
108–120, 2007.
[24] E. Ohn-Bar, S. Martin, and M. M. Trivedi, “Driver hand activity
analysis in naturalistic driving studies: challenges, algorithms, and
experimental studies,” Journal of Electronic Imaging, vol. 22, pp.
041 119–041 119, 2013.
[25] S. Sivaraman and M. M. Trivedi, “A review of recent developments in
vision-based vehicle detection,” Intelligent Vehicles Symposium (IV),
IEEE, pp. 310–315, 2013.
[26] Z. Sun, G. Bebis, and R. Miller, “On-road vehicle detection: a review,”
Pattern Analysis and Machine Intelligence, IEEE, pp. 694–711, 2006.
[27] H. Hirschmuller, “Accurate and efficient stereo processing by semiglobal matching and mutual information,” in Computer Vision and
Pattern Recognition (CVPR), IEEE, 2005, pp. 807–814.
[28] A. Broggi, A. Cappalunga, C. Caraffi, S. Cattani, S. Ghidoni, P. Grisleri, P. Porta, M. Posterli, and P. Zani, “Terramax vision at the urban
challenge 2007,” Intelligent Transportation Systems, IEEE, pp. 194–
205, 2010.
[29] R. Labayrade, D. Aubert, and S. S. Ieng, “Onboard road obstacles
detection in night condition using binocular ccd cameras,” in in ESV,
2003.
[30] C. Rabe, U. Franke, and S. Gehrig, “Fast detection of moving objects
in complex scenarios,” in Intelligent Vehicles Symposium, IEEE, 2007,
pp. 398–403.
[31] F. Erbs, A. Barth, and U. Franke, “Moving vehicle detection by optimal
segmentation of the dynamic stixel world,” in Intelligent Vehicles
Symposium (IV), IEEE, 2011, pp. 951–956.
[32] S. Gehrig, M. Reznitskii, N. Schneider, U. Franke, and J. Weickert,
“Priors for stereo vision under adverse weather conditions,” in Computer Vision Workshops (ICCVW), IEEE, Dec 2013, pp. 238–245.
[33] S. Gehrig, N. Schneider, and U. Franke, “Exploiting traffic scene
disparity statistics for stereo vision,” in Computer Vision and Pattern
Recognition Workshops (CVPRW), IEEE, 2014, pp. 688–695.
[34] A. Geiger, J. Ziegler, and C. Stiller, “Stereoscan: Dense 3d reconstruction in real-time,” in Intelligent Vehicles Symposium (IV), 2011.


© Copyright 2026