
Document 109390
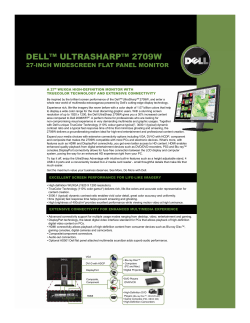
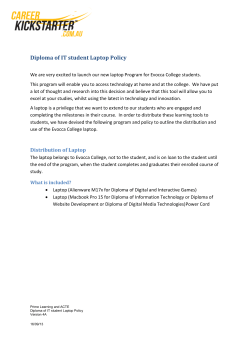
Product Carbon Footprint (PCF) Assessment of
Dell Laptop – Results and Recommendations
Scott O'Connell, Markus Stutz
Abstract— The product carbon footprint (PCF) of a
mainstream Dell laptop, including raw materials consumption,
manufacturing, logistics, product use and end-of-life
management was assessed in order to determine environmental
“hot spots” across the life cycle. Product bill of material (BOM),
supply chain logistics, product energy use and end-of-life
scenario data were utilized to model the carbon footprint using
generic data found in the GaBi database. The total PCF for three
target markets and a life time of four years has been determined
to be between 300 and 400kg CO2eq, comparable to driving ca.
1200km in an SUV or drinking ca. 240l of orange juice. The
distribution between manufacturing and use is nearly equal,
suggesting that an increased focus is needed on improvements
within the manufacturing supply chain.
Index Terms—product carbon footprint (PCF), laptop,
manufacturing, motherboard
I. INTRODUCTION
P
RODUCT Carbon Footprint (PCF) is defined as the
“life cycle green house gas (GHG) emissions of goods and
services”. In other words the PCF assesses the life cycle GHG
emissions that are released as part of the processes of creating,
modifying, transporting, storing, using, providing, recycling or
disposing of goods and services. GHG include CO2, CH4,
N2O, CFCs, etc. and are commonly expressed in kg of CO2
equivalents (kg CO2eq). PCF is a subset of Life Cycle
Assessment (LCA), with the analysis limited to emissions that
have an effect on climate change. Care has also to be taken
that PCF assessment, analysis or accounting is not confused
with PCF reporting or labeling.
There are some emerging legal and market requirements for
PCF assessment, however none of these have been finalized
to-date. The most significant legal requirements could come
from France, where the Grenelle d’Environment legislation
could require that from 1. January 2011 consumers must be
informed about the PCF of products. There also have been
initiatives in California (Bill AB 19) and in the recast of the
EuP (Ecodesign for energy using products) to introduce
mandatory PCF assessments and labeling.
Increasingly Dell customers are asking for PCF information
and retailers such as Tesco in the UK, FNAC in France and
Scott O’Connell is with Dell Inc., Environmental Affairs, Austin, TX,
78753, USA (512 723 2512, [email protected]).
Markus Stutz is with Dell GmbH, EMEA Environmental Affairs, 60549
Frankfurt, Germany ([email protected]).
Walmart in the US are considering PCF for products they are
selling. There are also developments to include PCF as one
criterion in ecolabels such as EPEAT or Blue Angel.
Therefore Dell Environmental Affairs initiated a pilot
project for a PCF of a mainstream laptop [1].
II. GOAL AND SCOPE
A. Goal of the Study
The goal of the study was to assess the Product Carbon
Footprint (PCF) of a current Dell laptop with the aim to
quantify the PCF in kg of CO2-equivalents (kg CO2eq).
Another goal was to determine environmental hot spots over
the product’s life cycle, with specific focus on material,
component, and product manufacturing and use. The study
was not intended for competitive product evaluations.
As customer inquiries on PCF of Dell products are
increasing, the study was also aimed at developing a white
paper and website which could be shared with customers.
This study was also intended to prepare for potential future
regulation on PCF, which is discussed in France under the
Grenelle d’Environment law and possible labelling
requirements by retailers.
B. Scope of the Study
A Dell Latitude E6400 was chosen as the functional unit for
this study. This model was selected because it is typical highvolume, mainstream business laptop and therefore
representative for a range of similar laptop products. It is also
Energy Star® 5.0 qualified and EPEAT Gold registered.
Fig. 1. Dell Latitude E6400 laptop.
The system boundaries include:
1.
2.
3.
4.
5.
6.
7.
Material
(=components,
parts)
and
product
manufacturing in Asia
Transport to final assembly
Final assembly in Asia and Europe
Transport to customers in the USA, Germany, and
China respectively
Use in the US, Europe, and China for four years
Transport to recycling
End of life disposal and recycling.
III. LIFE CYCLE INVENTORY
A. Background Data
In order to facilitate the study, generic data from the GaBi
database was used to replace actual data acquisition in
factories and assembly plants etc. This specifically is the case
for electronic components like integrated circuits (ICs), active
and passive components, as well as printed wiring boards.
Also generic energy mixes both for manufacturing and use
were used. Further generic end of life processes were used to
determine impacts at end of life. Certain assumptions were
also made for each life cycle phase, as noted in the following
sections. Different assumptions may have resulted in different
results/conclusions.
B. Manufacturing Phase
The bill of materials (BOM) was used as a starting point for
inventory of components and subassemblies (= the parts).
Additionally the laptop was disassembled and the part masses
were verified against the BOM. Packaging data of the laptop
was available from the Environmental Datasheet (EDS,
http://www.dell.com/regulatory_compliance_datasheets), that
of the external power supply (EPS) from the BOM.
The transport of the five heaviest components and
subassemblies (battery, chassis, hard drive, display, and
motherboard) to the product manufacturing site in China was
taken into account. The transport of the other parts was
averaged based on those components.
To take into account the scenarios for the three regions (US,
Europe, China) different Dell final assembly sites (Malaysia,
Poland and China) were included. Energy consumption
(electric power, fuels, thermal energy) for each of these final
assembly plants was also provided. Depending on the
scenario, one or more of these sites are used. For the use in the
US a 50% split in final assembly between China and Malaysia
was assumed. For use in Europe all final assembly was
assumed to take place in Poland. For use in China, all final
assembly was assumed to take place in China.
C. Logistics
Transport from product manufacturing locations in China to
Dell final assembly and distribution centers and finally to the
customer can be varied, depending on laptop customization
level and lead time. For this study, the following assumptions
were used to take into account the scenarios for three regions:
US
• 50% air transport from China to Malaysia
•
•
•
•
•
•
•
•
50% truck transport within China
Air transport from Malaysia or China to western or
eastern US
90% truck transport to customer (1500km)
10% air transport to customer (1500km)
Europe
Air transport from China to Poland
Truck transport from Poland to customer (1000km)
China
Truck transport within China (1200km)
Truck transport from China to customer (1500km)
D. Use Phase
For this study it was deemed appropriate to make use of the
method for Energy Star’s Typical Energy Consumption
(TEC). The TEC is an agreed upon method of comparing the
energy performance of computers, which focuses on the
typical electricity consumed while in normal operation during
a representative period of time. For laptops the TEC is the
value for typical annual electricity use, measured in kilowatthours (kWh), using measurements of average operational
mode power levels (off, sleep, idle) scaled by an assumed
typical usage model (duty cycle). In case of laptops it is
assumed that it spends 60% of its time in off mode, 10% in
sleep mode and 30% in idle mode. Idle mode is defined as a
state in which the operating system and other software have
completed loading, a user profile has been created, the
machine is not asleep, and activity is limited to those basic
applications that the system starts by default. It is inherently
assumed that idle mode is a good proxy for the laptop carrying
out work, thus being in an active mode.
The benefit of choosing the Energy Star TEC is the
possibility to enable benchmarking between various products
and manufacturers as well as removing ambiguity caused by
different usage patterns.
Life time of the product was estimated at 4 years, this is
consistent with general business customer use models.
It was assumed that the external power supply is connected
to the electricity supply 24 hours a day, throughout 365 days
of the year.
The use phase was considered in each of three main
regions: US, Europe and China. In each country the respective
distribution routes are applied as well as the country/regionspecific grid mixes during the use phase. These are the US
grid mix for the US, the EU-25 grid mix for Europe, and the
Chinese grid mix for China.
E. End of Life
Although it is common for laptops to be refurbished/reused
at the end of the first customer use, it was assumed in this
study that the laptop was sent for recycling at the end of the
first customer use (4 years). A baseline scenario for end of life
was adopted according to WEEE, which requires recycling of
75% of the product. To enable analysis of scenarios also a
recycling rate of 0%, i.e. 100% of the product goes to landfill
(worst case), as well as the best case of 100% recycling were
taken into account.
Transport distance to recycling was set at 500km by truck in
each region.
IV. LIFE CYCLE IMPACT ASSESSMENT (LCIA)
A. Total Life Cycle
Fig. 2 shows the total PCF in the three regions as well as the
contribution of the different life cycle phases. The total PCF is
between 320kg CO2eq when used in Europe and 370kg
CO2eq for use in China. The difference between the regions is
relatively small, as the impact from manufacturing is
independent of the region of use and as the use phase has a
relatively low impact overall. The differences between the
regions are of course due to the differing emissions from
Manufacturing
Transport to recycling
Transport to customer
Recycling 75%
Use phase
500,0
400,0
300,0
transport. This is the case for the US and EU scenario, where
the laptops are transported by plane to the distribution centers.
The high impact of air transport is due to the fact that it is very
energy intensive. Transport by truck, which is the case for the
China scenario in contrast has a very low impact. This is also
true for the final distribution to the customer from the
distribution center.
End of life (with the assumption of 75% recycling rate) has
a contribution of between 4-9%, reducing the total carbon
footprint of the laptop by ca. 30kg of CO2eq in each scenario.
Transport to recycling has but a minor contribution, less than
0.1% of the total impact.
B. Manufacturing
As shown in the previous chapter, manufacturing makes up
nearly half of the total product carbon footprint in the US
scenario. Since the manufacturing represents a significant
contribution, it is further broken down in part production,
assembly and transport to customer (see Fig. 3). Upstream
material extraction and processing, as well as transport to
assembly are included in the part production.
200,0
160
100,0
140
0,0
120
-100,0
EU
China
power generation in the three regions.
Fig. 2. Total Product Carbon Footprint [kg CO2e] of the E6400 laptop in the
three regions.
100
kg CO2eq
US
80
60
40
The contribution from the use phase represents between
65% (for China) and 47% (in Europe) of total impacts. The
contribution of the manufacturing phase is thus relatively high
with between 42 and 50% (in China and Europe, resp.). This
distribution comes a bit as a surprise, as for most other ICT
equipment the use phase dominates by far. In this case the
relative complexity of the laptop and its relative short life time
results in this change. A key conclusion for mobile (and short
lived) products is therefore that the manufacturing phase is
gaining in importance with respect to PCF. On the other hand
it also points to the fact that a lot of effort has already gone
into enhancing energy efficiency of mobile products.
Transport to customer is relevant where it includes air
20
0
Part production
Assembly
Transport to customer
Fig. 3. Carbon Footprint [kg CO2eq] of the manufacturing phase (part
production, assembly) and the transport to customer.
Because of the overwhelming importance
production, it is shown in further detail in Fig. 4.
of
part
80
70
60
kg CO2eq
50
40
30
20
10
rT
ra
ns
po
rt
Tr
uc
k
Tr
an
sp
or
t
Ai
ey
bo
ar
d
K
at
te
ry
B
up
pl
y
ow
er
S
ac
ka
gi
ng
P
E
xt
er
na
lP
D
r iv
e
is
k
D
O
pt
ic
al
e
ai
nb
oa
rd
M
D
riv
Di
sk
D
is
pl
ay
Ha
rd
C
ha
ss
is
In
te
rn
al
ca
bl
es
0
Fig. 4. Carbon Footprint [kg CO2eq] of part production. air and truck transport represent transport to assembly. Upstream material manufacturing processes are
contained within the impact of each individual part.
There are but a handful of parts that make up about 95% of
the total impact caused by part production. These are, in order
of importance, the motherboard, the display, the chassis and
the battery, with the motherboard alone constituting almost
50% of the total production impacts and over 20% of the total
product carbon footprint. An interesting observation is that
while the overall mass of both motherboard and display is
relatively low, their impact is significant. The chassis, the
second-heaviest component (18% by mass) does play an
important role in shaping the impact, mostly (ca. 90%) coming
from the energy intensive magnesium alloys that make up
most of its weight, as well as from aluminium (heat sink) and
high-energy plastics (internal frame). Relative to its mass,
however, the chassis contributes very little to the overall
picture. Notably, the largest part by mass (39%), packaging is
hardly even visible in the chart due to the fact that most of its
mass is made of paper/cardboard, which requires little energy
input and the raw material itself – wood – is a carbon-neutral
material. It also becomes instantly clear that transport to
assembly (air and truck) does not play a significant role.
Further analysis shows that in case of the chassis and the
battery, the raw materials and their upstream extraction and
processing can be accounted for the high impact, in case of the
display and motherboard, the part production processes are
responsible.
In order to better understand the carbon footprint
contribution of the motherboard, it is shown to a further level
of detail in Figure 5.
Fig. 5. Carbon footprint contributions from components of the motherboard
Most of the impacts at this level stem from the RAM bars
(two pieces) with 16 integrated circuits (ICs) on each, and
gold connectors (200 pins). Although by mass very small, the
size and number of ICs is very large compared with the rest of
the board. The impact of the ICs derives largely from the
energy-intensive manufacture processes especially the silicon
wafer manufacture for the die. This motherboard is a prime
example of how electronic components are often rather
process-intensive than material-intensive, i.e. energy use for
manufacturing processes may be responsible for the bulk of
the impacts. In case of the RAM bars, the gold pins also
contribute significantly to the impact, in this case, however, as with other precious metals – the upstream processes of
extraction and purification add the most relevant impacts.
Second most noteworthy is the contribution of the substrate
itself, i.e. the bare printed wiring board, including the
assembly process in which the board is populated with
electronic components. Substrate manufacturing is again a
highly energy-intensive process, and this rather than the
upstream processes behind the constituting materials,
determines its impact. Third most relevant is the contribution
of the standard active components, i.e. ICs, transistors diodes
and LEDs on the motherboard. All these components also
contain a die, and as such carry the burden of wafer
manufacture, as well precious metals such as gold, silver or
palladium. Other larger contributions come from the graphics
card (with housing) and the CPU which both contain their own
substrate and die. The larger contribution of the graphics card
is owing to a larger die size. It is important to note that
precious metal content in electronics has decreased over time
due to cost.
C. Use phase
While the use phase represents a significant impact when
looking at the total product carbon footprint, not much detail
can be derived from this assessment. As easily derived, the
time spent in idle (as proxy for active use of the laptop) is
responsible for over 90% of the impacts.
It is also clear that the assumptions taken for the use phase
determine the overall results quite significantly. Taking into
account an “active” mode or calculating with weekends and
holidays spent in off mode changes the overall impact. Based
on internal research we however believe that the Energy Star
TEC is a very good proxy for a realistic use of a laptop.
D. End of Life (EoL)
Fig. 6 shows the impacts and credits associated with the end
of life treatment of the laptop in the base case, i.e. assuming
75% recycling rate and no further losses of materials during
sorting etc.
collected material can be recycled and used to replace primary
magnesium with the same alloy content as that of the laptop
components. Mechanical recycling, however, is often not
possible for nonmetals, such as plastics and paper. In this
model, such materials are often incinerated yielding energy
(thermal and electric), and this amount is credited much the
same way as materials: the amount of energy that is yielded
will not need to be produced elsewhere, and therefore the
burdens associated with power production for the given
amount, are avoided. Incineration, however, has the
disadvantage of also producing emissions of greenhouse
gases, therefore the impacts in this case are even higher than
the generated credits. Shredding of the motherboard yields the
second highest credits, owing to the large amount of precious
metals to be gained from the ICs and other components. The
avoided primary production of those precious metals is of
great significance. The landfilled portion of the product, i.e.
the 25% not recycled, produces some emissions, but these are
minor, due to the assumption of a site allowing inert
deposition. Transport to recycling (500km) also has but a
minor impact although larger than that of landfill.
Fig. 7 shows the impact in the different recycling scenarios.
Given the full recycling of the product (100%), credits to be
gained are substantial, 1.5 times that of the 75% recycling
scenario. Compared with the landfill scenario both recycling
options are very favourable with respect to credits yielded in
the overall product carbon footprint.
Fig. 7. Carbon Footprint (kg CO2eq) of the EoL of the laptop in the three
recycling scenarios.
Fig. 6. Carbon Footprint (GWP) of the EoL of the laptop. Negative values are
credits (reduction of the CO2e) and positive values are impacts from the
recycling processes. Inlay: credits from recycling the electronics fraction; key:
Au – Gold, Pd – Palladium, Cu – Copper, Ag – Silver.
Credits should be understood as avoidance of impacts
associated with primary production of the material which is
sent to recycling. In cases where the recycled (secondary)
material can be used directly to replace the primary material,
the primary production of the same amount of material can be
avoided, and thus all environmental impacts associated with
primary production are also avoided. This is why credits are
shown as having a negative impact. Magnesium recycling
yields the largest credits, given the assumption that all
V. STUDY HIGHLIGHTS & KEY ASPECTS
The use phase is by a thin margin the largest contributor
when looking at use taking place in the US or in China. For
the EU scenario manufacturing dominates by an equally thin
margin.
The manufacture phase is the second largest contributor to
the product carbon footprint (given the selected use phase in
the US). The major determinant of the manufacture impact is
the motherboard, followed in order of relevance by the
display, the chassis and the battery. The first two are process
intensive components, while the latter two are rather materialintensive ones. In other words manufacturing processes
(energy provision and auxiliary materials therein) are largely
responsible for the impact of the motherboard and the display,
while upstream material supply and energy demand for mining
and processing, are much more relevant for the latter two.
Notably, the energy and environmental impacts associated
with a unit of mass change dramatically between parts of the
laptop. The motherboard production is associated with over 6
times as high carbon footprint per unit of mass as the chassis.
While this value is relatively constant for material types, the
motherboard’s impact is hardly ever definable by mass due to
the complex production processes that are often area-based
(substrate size, die size) rather than mass-based.
In this specific motherboard the largest impact derives from
the RAM bars, the substrate (printed circuit board) itself and
the standard active components (ICs, diodes, transistors) in
order of importance. Although by size rather small, the RAM
bars have 16 ICs each (32 in total) as well as gold connectors
(200 pins) along their longer edge, in addition to the substrate
which itself is also very energy intensive.
Transport to customer should also be mentioned as point of
interest, whenever overseas/trans-continental transport is the
case. Air transportation, due to the vast amount of kerosene
burnt over the long distances, represents the most significant
impact in the transport phase of the product life cycle.
The recycling gains/credits are substantial. The largely
metallic chassis in this laptop can be recycled mechanically,
providing credits in the value of the primary raw material
(magnesium, aluminium etc.) which amounts to about 50% of
the total credits gained from recycling. However, these results
are based on a strong underlying assumption that the
magnesium alloy employed for most of the chassis is in fact
recycled. Magnesium recycling today takes place at relatively
low levels since the abundance of this metal does not create
sufficient demand on the market for secondary magnesium.
Second largest credit is yielded by the recycling of precious
metals (especially gold), which by mass may seem like
insignificant fractions of the total mass, but by value
(economic and environmental) can significantly change the
overall impacts.
Recycling scenarios with higher or lower collection rates
can change the carbon footprint significantly, as was shown.
In the 100% recycling scenario ca. 40kg CO2eq reduction is
achieved. The 100% landfill scenario on the other hand
increases the impact the total product carbon footprint.
VI. CONCLUSION
The total PCF of the E6400 laptop is comparable to driving
1200km with a Porsche Cayenne (assuming a CO2 emission
of 296g/km [2]) or drinking 240l of orange juice (assuming
360g CO2eq/250 ml [3]). This comparison demonstrates that
the life cycle impacts over a four year life span of the laptop is
relatively modest.
Mapping the key impacts to ongoing activities to lower
Dell’s product impact show that significant achievements have
been made. This is in any case true for lowering product
energy consumption in the use phase through efficiency
programs such as Energy Star® or Energy Smart. Also the
Dell “plant a tree for me” program, enables our customers to
voluntarily offset carbon emissions associated with the use
phase of the product. Dell’s robust recycling programs, which
offers free recycling for consumers, is also enabling to take
into account the credit associated with recycling. No such
credit can be taken into account if the recycling program is not
successful in getting back products to recycling. Actions are
also underway within Dell to scope the total GHG scope 1 and
2 emissions from our operations as well as from those of our
suppliers (Scope 3). This will help to address the high impacts
of manufacturing the parts used in our products, which are
also generally used by the overall industry. The impacts from
the Dell assembly plants, while very low in comparison, are
also offset by maximizing efficiencies, purchasing green
power and responsibly offsetting the rest.
A key conclusion from this PCF is that for mobile products
(with short life times) focus for environmental improvements
needs to increasingly shift from use phase to component
manufacturing. A set of actions needs to be defined by
industry for improving the impacts of component
manufacturing. These actions need to focus on the
motherboard (RAM, substrate), the display as well as on the
chassis and the battery. The role of air transport needs to be
further analyzed as well, as it contributes significantly to the
overall PCF.
Additional PCF of other key ICT products such as desktops,
displays, printers, and servers are strongly suggested as follow
up research.
ACKNOWLEDGMENT
The authors thank Dr. Constantin Herrmann, Alexandra
Saraev, and Flora Vadas from PE International for their
support on this PCF.
REFERENCES
[1]
[2]
[3]
F. Vadas, A. Saraec, C. Herrmann, “Product Carbon footprint of a Dell
Laptop”, 2009
http://www.porsche.com/germany/models/cayenne/cayenne/featuresands
pecs/ accessed 08.02.2010
http://www.pcf-world-forum.org/2008/04/tesco-puts-carbon-reductionlabel-on-20-products/ accessed 08.02.2010
THIS WHITE PAPER IS FOR INFORMATIONAL PURPOSES ONLY,
AND MAY CONTAIN TYPOGRAPHICAL ERRORS AND TECHNICAL
INACCURACIES. THE CONTENT IS PROVIDED AS IS, WITHOUT
EXPRESS OR IMPLIED WARRANTIES OF ANY KIND.


© Copyright 2026