
characterization and improvement of flour of three sudanese wheat
CHARACTERIZATION AND IMPROVEMENT OF FLOUR OF THREE SUDANESE WHEAT CULTIVARS FOR BREAD MAKING By: Abubaker Bashir makawi Bashir B.Sc. Agric. (Honours) Faculty of Agriculture University of Khartoum - (٢٠٠١) A thesis submitted to the University of Khartoum in partial fulfillment for the requirements of the degree of Master of science(Agric) Supervisor: Prof. Abdelmoniem Ibrahim Mustafa Department of Food Science and Technology Faculty of Agriculture University of Khartoum February-٢٠٠٦ To my dear father and mother To my brothers, sisters, friends and colleagues With love I would like to express my deep thanks to my supervisor prof. Abdelmoneim Ibrahim Mustafa for his keen guidance and advice throughout this study. My thanks and appreciation are extended to the staff members of the Food Research Centre, Hudeiba Research Station and Atbara mills for their unlimited help and friendly attitude during the practical work. Iam pleased to express my appreciation to every body who helped or encouraged me during the course of this study. Thanks are first and last to Allah who enabled me to conduct this study by the grace of him and donated me strength and patience. Abstract The aim of this study was to characterize and improve the flour of three Sudanese wheat cultivars for bread making. Three local wheat cultivars: Debaira, Wadi Elneel, and Elneelain were treated with three improvers: Z, A and S and compared with Canadian wheat flour. Proximate composition, Hectolitre weight and thousand kernels weight were carried out for the three local wheat cultivars grain. Gluten quantity and quality, falling number, sedimentation value, pelshenke test values, farinograph characteristics and extensograph characteristics were investigated for the three local cultivars and Canadian wheat flour with and without improvers. Baking quality was determined for two types of bread (loaf and flat) made from the three local cultivars and Canadian wheat flour with and without improvers. The results showed significant difference in the quality tests among the flours and breads made from the three local cultivars and Canadian wheat flours. The local cultivars found to contain low alpha-amylase activity (٦٧٦ to ٤٨٦sec), sedimentation value(١٩٫٦ to٣٢٫٣cm٣), Pelshenke test value (٢٨٫٨ to ٤٩٫٢min), water absorption(٦٣٫٩ to ٦٦٫٠٪), resistance (١٤٠ to ٢٠٨cm), extensibility(١٢٠ to ١٨٣mm), specific loaf volume (٢٫٥٦ to ٣٫٠٧cm٣/g )and high degree of softening(٨٥ to ١٠٦FU). However the Canadian wheat cultivar was found to contain low alpha-amylase activity ( ٦٠٣sec),water absorption (٦١٫٣٪), degree of softening (٣٨FU), relatively high sedimentation value (٣٧٫٤cm٣), resistance (٢٥٢cm), extensibility (٢٣٥mm), specific loaf volume (٣٫٤٤ cm٣/g) and high Pelshenke test value(٩٢٫١ min). Addition of improvers to the three local cultivars and Canadian wheat flours significantly affected the quality tests with the exception of sedimentation value. For the local cultivars addition of improvers increased alpha-amylase activity, Pelshenke test value, degree of softening, resistance, extensibility, specific loaf volume and decreased water absorption. Their lower and higher values changed as follows: (٦٧٦-٤٦٦ sec) and (٤٨٦-٣٩٦ sec), (٢٨٫٨-٣٤٫٥ min) and (٤٩٫٢-٦٩٫٢ min), (٨٥-١٦٠ FU) and (١٠٦-٢٠٥ FU), (١٤٠-٢٤٦ cm) and (٢٠٨-٢٧٩ cm),( ١٢٠-١٢٨ mm) and (١٨٣-١٩٨ mm), (٢٫٥٦-٣٫١٦ cm٣/g) and (٣٫٠٧-٣٫٣٦ cm٣/g) , (٦٣٫٩-٦١٫٦٪) and (٦٦٫٠-٦٢٫٧٪),respectively. On the other hand, addition of improvers to the Canadian cultivars increased alpha-amylase activity (٦٠٣-٤٦٧sec), Pelshenke test value (٩٢٫١-١٠٣٫٤ min), resistance (٢٥٢-٤٠١cm), specific loaf volume (٣٫٤٤-٤٫١١ cm٣/g) and decreased water absorption (٦١٫٣-٥٩٫٧٪), degree of softening(٣٨-٢٣FU) and extensibility (٢٣٥-١٨٩ mm). Sensory evaluation of loaf and flat bread showed that loaf bread made from the Canadian wheat flour with Z improver gained the highest score of general acceptability(٨٫٥). While flat bread made from Debaira cultivar with S improver gained the highest score of general acceptability(٨٫٠). Generally, Debaira cultivar showed better bread making quality as compared with the other two local cultivars. ﻣﻠﺨﺺ اﻷﻃﺮوﺣﺔ ﻳﻬﺪف هﺬا اﻟﺒﺤﺚ إﻟﻰ وﺻﻒ وﺗﺤﺴﻴﻦ دﻗﻴﻖ ﺛﻼث ﻋﻴﻨﺎت ﻣﻦ اﻟﻘﻤﺢ اﻟﺴﻮداﻧﻲ اﻟﻤﺴﺘﺨﺪم ﻓﻲ ﺻﻨﺎﻋﺔ اﻟﺨﺒﺰ .ﺛﻼﺛﺔ ﻋﻴﻨﺎت ﻣﺤﻠﻴﺔ دﺑﻴﺮﻩ ،وادي اﻟﻨﻴﻞ واﻟﻨﻴﻠﻴﻦ ،ﺗﻤﺖ ﻣﻌﺎﻣﻠﺘﻬﺎ ﺑﺜﻼث ﻣﺤﺴﻨﺎت A ،Z :و Sوﻗﻮرﻧﺖ ﺑﻌﻴﻨﺔ ﻣﻦ اﻟﻘﻤﺢ اﻟﻜﻨﺪي. ﺗﻢ إﺟﺮاء اﻟﺘﺤﻠﻴﻞ اﻟﺘﻘﺮﻳﺒﻲ ووزن اﻟﻬﻴﻜﺘﻮﻟﻴﺘﺮ ووزن اﻷﻟﻒ ﺣﺒﺔ ﻟﻠﻌﻴﻨﺎت اﻟﻤﺤﻠﻴﺔ اﻟﺜﻼث ،آﻤﺎ ﺗﻢ ﺗﺤﺪﻳﺪ ﺟﻮدة وآﻤﻴﺔ اﻟﺠﻠﻮﺗﻴﻦ ،رﻗﻢ اﻟﺴﻘﻮط ،ﻗﻴﻤﺔ اﻟﺘﺮﺳﻴﺐ ،ﻗﻴﻢ اﺧﺘﺒﺎر ﺑﻠﺸﻴﻨﻜﻲ ودراﺳﺔ اﻟﺨﻮاص اﻟﺮﻳﻮﻟﻮﺟﻴﺔ ﻟﻠﻌﺠﻴﻨﺔ ﺑﻮاﺳﻄﺔ ﺟﻬﺎزي اﻟﻔﺎرﻳﻨﻮﻏﺮاف واﻻآﺘﻨﺴﻮﻏﺮاف ﻟﺪﻗﻴﻖ اﻟﻌﻴﻨﺎت اﻟﻤﺤﻠﻴﺔ اﻟﺜﻼث ﺑﺎﻹﺿﺎﻓﺔ إﻟﻰ اﻟﻘﻤﺢ اﻟﻜﻨﺪي ﻣﻦ ﻏﻴﺮ ﻣﺤﺴﻨﺎت وﻓﻲ وﺟﻮد اﻟﻤﺤﺴﻨﺎت. آﺬﻟﻚ ﺗﻢ ﺗﺤﺪﻳﺪ ﻣﺪى ﺻﻼﺣﻴﺔ اﻟﻌﺠﻴﻨﺔ اﻟﻤﻜﻮﻧﺔ ﻣﻦ دﻗﻴﻖ اﻟﻌﻴﻨﺎت اﻟﻤﺤﻠﻴﺔ اﻟﺜﻼث ﺑﺎﻹﺿﺎﻓﺔ إﻟﻰ اﻟﻘﻤﺢ اﻟﻜﻨﺪي ﻣﻦ ﻏﻴﺮ ﻣﺤﺴﻨﺎت وﻓﻲ وﺟﻮد اﻟﻤﺤﺴﻨﺎت ﻟﺼﻨﺎﻋﺔ ﻧﻮﻋﻴﻦ ﻣﻦ اﻟﺨﺒﺰ)اﻓﺮﻧﺠﻲ و ﻋﺮﺑﻲ(. أﻇﻬﺮت اﻟﻨﺘﺎﺋﺞ اﺧﺘﻼﻓﺎت ﻣﻌﻨﻮﻳﺔ ﻓﻲ اﺧﺘﺒﺎرات اﻟﺠﻮدة ﻟﻠﺪﻗﻴﻖ واﻟﺨﺒﺰ اﻟﻤﺼﻨﻊ ﻣﻦ اﻟﻌﻴﻨﺎت اﻟﻤﺤﻠﻴﺔ اﻟﺜﻼث ﺑﺎﻹﺿﺎﻓﺔ إﻟﻰ ﻋﻴﻨﺔ اﻟﻘﻤﺢ اﻟﻜﻨﺪي .ﻓﻲ اﻟﻌﻴﻨﺎت اﻟﻤﺤﻠﻴﺔ اﻟﺜﻼث وﺟﺪ أن هﻨﺎﻟﻚ ﻗﻠﺔ ﻓﻲ ﻗﻴﻢ ﻧﺸﺎط اﻷﻟﻔﺎ أﻣﻴﻠﻴﺰ ) ٦٧٦-٤٨٦ث( ،اﻟﺘﺮﺳﻴﺐ ) ٣٢٫٣-١٩٫٦ﺳﻢ،( ٣ اﺧﺘﺒﺎر ﺑﻠﺸﻴﻨﻜﻲ ) ٤٩٫٢-٢٨٫٨دﻗﻴﻘﺔ( ،ﻧﺴﺒﺔ اﻣﺘﺼﺎص اﻟﻤﺎء) ،(% ٦٦٫٠-٦٣٫٩ اﻟﻤﻘﺎوﻣﺔ )٢٠٨ - ١٤٠ﺳﻢ( ،اﻟﻤﻄﺎﻃﻴﺔ)١٨٣ -١٢٠ﻣﻠﻢ(،اﻟﺤﺠﻢ اﻟﻨﻮﻋﻲ )٣٫٠٧-٢٫٥٦ ﺳﻢ/٣ﺟﻢ( وﻋﻠﻮ ﻓﻲ درﺟﺔ اﻟﻨﻌﻮﻣﺔ ) ١٠٦ - ٨٥وﺣﺪة ﻓﺎرﻳﻨﻮﻏﺮاف( .ﺑﻴﻨﻤﺎ وﺟﺪان دﻗﻴﻖ اﻟﻘﻤﺢ اﻟﻜﻨﺪي ﻳﺤﺘﻮي ﻋﻠﻰ ﻗﻴﻤﺔ ﻗﻠﻴﻠﺔ ﻟﻨﺸﺎط اﻷﻟﻔﺎ أﻣﻴﻠﻴﺰ) ٦٠٣ث( ،ﻧﺴﺒﺔ اﻣﺘﺼﺎص اﻟﻤﺎء ) ،(%٦١٫٣درﺟﺔ اﻟﻨﻌﻮﻣﺔ )٣٨وﺣﺪة ﻓﺎرﻳﻨﻮﻏﺮاف( ،ﻗﻴﻤﻪ ﻋﺎﻟﻴﺔ ﻧﺴﺒﻴًﺎ ﻟﻠﺘﺮﺳﻴﺐ) ٣٧٫٤ﺳﻢ ،(٣اﻟﻤﻘﺎوﻣﺔ) ٢٥٢ﺳﻢ( ،اﻟﻤﻄﺎﻃﻴﺔ)٢٣٥ﻣﻠﻢ( ،اﻟﺤﺠﻢ اﻟﻨﻮﻋﻲ ) ٣٫٤٤ﺳﻢ /٣ﺟﻢ( وﻗﻴﻤﺔ ﻋﺎﻟﻴﺔ ﻻﺧﺘﺒﺎر ﺑﻠﺸﻴﻨﻜﻲ ) ٩٢٫١دﻗﻴﻘﺔ ( . إﺿﺎﻓﺔ اﻟﻤﺤﺴﻨﺎت ﻟﻠﺜﻼث ﻋﻴﻨﺎت اﻟﻤﺤﻠﻴﺔ وﻟﺪﻗﻴﻖ اﻟﻘﻤﺢ اﻟﻜﻨﺪي أﺛﺮت ﻣﻌﻨﻮﻳ ًﺎ ﻋﻠﻰ اﺧﺘﺒﺎرات اﻟﺠﻮدة ﺑﺎﺳﺘﺜﻨﺎء اﺧﺘﺒﺎر ﻗﻴﻤﺔ اﻟﺘﺮﺳﻴﺐ .ﺑﺎﻟﻨﺴﺒﺔ ﻟﻠﻌﻴﻨﺎت اﻟﻤﺤﻠﻴﺔ اﻟﺜﻼث إﺿﺎﻓﺔ اﻟﻤﺤﺴﻨﺎت أدت إﻟﻰ زﻳﺎدة ﻧﺸﺎط اﻷﻟﻔﺎ أﻣﻴﻠﻴﺰ ،ﻗﻴﻤﺔ اﺧﺘﺒﺎر ﺑﻠﺸﻴﻨﻜﻲ ،درﺟﺔ اﻟﻨﻌﻮﻣﺔ ،اﻟﻤﻄﺎﻃﻴﺔ ،اﻟﻤﻘﺎوﻣﺔ، اﻟﺤﺠﻢ اﻟﻨﻮﻋﻲ وﺗﻘﺼﺎن ﻧﺴﺒﺔ اﻣﺘﺼﺎص اﻟﻤﺎء ،اﻟﻘﻴﻢ اﻟﻌﻠﻴﺎ واﻟﺪﻧﻴﺎ ﻟﻼﺧﺘﺒﺎرات أﻋﻼﻩ ﺗﻐﻴﺮت آﻤﺎ ﻳﻠﻲ٤٦٦ -٦٧٦) : ث( و) ٣٩٦ -٤٨٦ث( ٣٤٫٥- ٢٨٫٨ ) ،دﻗﻴﻘﺔ( و٦٩٫٢ - ) ٤٩٫٢دﻗﻴﻘﺔ( ٨٥ ١٦٠-) ،وﺣﺪة ﻓﺎرﻳﻨﻮﻏﺮاف ( و) ٢٠٥-١٠٦وﺣﺪة ﻓﺎرﻳﻨﻮﻏﺮاف( ١٢٨ ، )-١٢٠ﻣﻠﻢ( و) ١٩٨ - ١٨٣ﻣﻠﻢ( ٢٤٦- ١٤٠) ،ﺳﻢ ( و)٢٧٩-٢٠٨ﺳﻢ( ٣٫١٦ - ، )٢٫٥٦ﺳﻢ /٣ﺟﻢ( و) ٣.٣٦-٣٫٠٧ﺳﻢ /٣ﺟﻢ( (%٦١٫٦-٦٣٫٩) ،و) (% ٦٢٫٧-٦٦٫٠ ﻋﻠﻰ اﻟﺘﻮاﻟﻲ .ﻣﻦ ﺟﺎﻧﺐ ﺁﺧﺮ إﺿﺎﻓﺔ اﻟﻤﺤﺴﻨﺎت ﻟﺪﻗﻴﻖ اﻟﻘﻤﺢ اﻟﻜﻨﺪي أدت إﻟﻰ زﻳﺎدة ﻧﺸﺎط اﻷﻟﻔﺎ أﻣﻴﻠﻴﺰ ) ٦٠٣-٤٦٧ث ( ،اﻟﻤﻘﺎوﻣﺔ ) ٤٠١-٢٥٢ﺳﻢ ( ،ﻗﻴﻤﺔ اﺧﺘﺒﺎر ﺑﻠﺸﻴﻨﻜﻲ١٠٣٫٤- )٩٢٫١دﻗﻴﻘﺔ( ،اﻟﺤﺠﻢ اﻟﻨﻮﻋﻲ )٤٫١١-٣٫٤٤ﺳﻢ /٣ﺟﻢ( وﻧﻘﺼﺎن ﻧﺴﺒﺔ اﻣﺘﺼﺎص اﻟﻤﺎء ) ،(%٥٩٫٧-٦١٫٣درﺟﺔ اﻟﻨﻌﻮﻣﺔ ) ٢٣-٣٨وﺣﺪة ﻓﺎرﻳﻨﻮﻏﺮاف( و اﻟﻤﻄﺎﻃﻴﺔ )١٨٩-٢٣٥ ﻣﻠﻢ(. اﻟﺘﻘﻴﻴﻢ اﻟﺤﺴﻲ ﻟﻠﺨﺒﺰ اﻷﻓﺮﻧﺠﻲ و اﻟﻌﺮﺑﻲ أﻇﻬﺮ أن اﻟﺨﺒﺰ اﻷﻓﺮﻧﺠﻲ اﻟﻤﻨﺘﺞ ﻣﻦ دﻗﻴﻖ اﻟﻘﻤﺢ اﻟﻜﻨﺪي اﻟﻤﻀﺎف إﻟﻴﻪ ﻣﺤﺴﻦ Zأﻋﻄﻰ أﻋﻠﻰ درﺟﺔ ﻟﻠﺘﻔﻀﻴﻞ اﻟﻌﺎم) ، (٨٫٥ﺑﻴﻨﻤﺎ اﻟﺨﺒﺰ اﻟﻌﺮﺑﻲ اﻟﻤﻨﺘﺞ ﻣﻦ ﻋﻴﻨﺔ دﺑﻴﺮﻩ اﻟﻤﻀﺎف إﻟﻴﻪ ﻣﺤﺴﻦ Sأﻋﻄﻰ أﻋﻠﻰ درﺟﺔ ﻟﻠﺘﻔﻀﻴﻞ اﻟﻌﺎم).(٨٫٠ ﻋﻤﻮﻣًﺎ أﻇﻬﺮت اﻟﻨﺘﺎﺋﺞ أن دﺑﻴﺮﻩ هﻲ أﺟﻮد ﻋﻴﻨﺎت اﻟﻘﻤﺢ اﻟﺴﻮداﻧﻲ ﻓﻲ ﺻﻨﺎﻋﺔ اﻟﺨﺒﺰ ﻣﻘﺎرﻧﺔ ﺑﺎﻟﻌﻴﻨﺘﻴﻦ اﻷﺧﺮﻳﺘﻴﻦ. LIST OF CONTENTS Dedication ………………………………………………………………………………… i Acknowledgements…………………………………………………………………… ii Abstract………………………………………………………………………………….…… iii Arabic abstract………………………………………………………………………..… v List of contents…………………………………………………………………………… vii List of tables…………………………………………………………..…………………… xv List of figures …………………………………………………………………………… xvi List of plates……………………………………………………………………….……… xxi CHAPTER ONE: INTRODUCTION…………………………………….… ١ CHAPTER TWO: LITERATURE REVIEW…………………………… ٣ ٢٫١ Types of wheat…………………………………………………………………….… ٢٫٢ Wheat quality………………………………………………………………………… ٢٫٢٫١ Physical criteria of wheat quality assessment……………………..… ٣ ٤ ٥ ٢٫٢٫١٫١ Test weight……………………………………………………………………… ٢٫٢٫١٫٢ Kernel weight………………………………………………………………..… ٥ ٥ ٢٫٣ General structure…………………………………………………………………… ٦ ٢٫٤ Chemical composition…………………………………………………………… ٧ ٢٫٤٫١ Moisture content………………………………………………………………… ٧ ٢٫٤٫٢ Ash content………………………………………………………………………… ٢٫٤٫٣ Oil content…………………………………………………………………….….… ٢٫٤٫٤ Protein content……………………………………………………………….…… ٢٫٤٫٥ Fibre content………………………………………………………………….…… ٢٫٥ Flour quality…………………..……………………………………………………… ٢٫٥٫١ Protein quantity and quality………………………………………………… ٢٫٥٫٢ Amylase activity………………………………………………………………… ٢٫٥٫٢٫١ Beta – amylase activity………………………………………………..…… ٧ ٨ ٩ ٩ ١٠ ١٠ ١٢ ١٢ ٢٫٥٫٢٫٢ Alpha – amylase activity………………………………………………..… ٢٫٥٫٣ Dough rheological properties…………………………………………….… ٢٫٥٫٣٫١ Water absorption……………………………………………………………… ٢٫٥٫٣٫٢ Viscosity………………………………………………………………………..… ٢٫٥٫٣٫٣ Extensibility…………………………………………………………………..… ٢٫٥٫٣٫٤ Resistance……………………………………………………………………...… ٢٫٥٫٣٫٥ Dough development………………………………………………………… ٢٫٥٫٤ Sedimentation value…………………………………………………………… ٢٫٥٫٥ Wheat meal fermentation time (WMFT) ……………………………… ٢٫٦ Flour additives……………………………………………………………………… ٢٫٦٫١ Bleaching agents………………………………………………………………… ٢٫٦٫١٫١ Chlorine………………………………………………………………………...… ١٣ ١٤ ١٥ ١٥ ١٦ ١٦ ١٦ ١٧ ١٨ ١٨ ١٨ ١٨ ٢٫٦٫١٫٢ Chlorine dioxide……………………………………………………………… ٢٫٦٫١٫٣ Acetone peroxide…………………………………………………………..… ٢٫٦٫١٫٤ Benzoyl peroxide………………………………………………………...…… ٢٫٦٫٢ Dough conditioners………………………………………………………...…… ٢٫٦٫٢٫١ Oxidants………………………………………………………………………..… ٢٫٦٫٢٫١٫١ Potassium bromate………………………………………………………… ٢٫٦٫٢٫١٫٢ Ascorbic acid………………………………………………………………… ٢٫٦٫٢٫١٫٣ Azodicarbonamide………………………………………………………… ٢٫٦٫٢٫١٫٤ Lipoxygenase……………………………………………………………..… ١٨ ١٩ ١٩ ١٩ ٢٠ ٢٠ ٢١ ٢١ ٢٢ ٢٫٦٫٢٫٢ Reductants……………………………………………………………………… ٢٢ ٢٫٦٫٢٫٢٫١ Cysteine…………………………………………………………………….… ٢٣ ٢٫٦٫٢٫٢٫٢ Sodium meta bisulfite…………………………………………………… ٢٣ ٢٫٦٫٢٫٣ Surfactants…………………………………………………………………….… ٢٫٦٫٢٫٣٫١ Sodium stearoyl lactylate (SSL) ………………………………….… ٢٫٦٫٢٫٣٫٢ Monoglyceride (MG) ………………………………………………….… ٢٣ ٢٣ ٢٤ ٢٫٦٫٢٫٣٫٣ Sucrose esters (SE) ……………………………………………………… ٢٤ ٢٫٦٫٢٫٤ Mixing time reducers……………………………………………………… ٢٤ ٢٫٦٫٢٫٤٫١ Fumaric and Sorbic acids……………………………………………… ٢٫٦٫٢٫٤٫٢ Proteases………………………………………………………………..…… ٢٫٦٫٣ Shortening………………………………………………………………………..… ٢٫٦٫٤ Enzymes…………………………………………………………………………..… ٢٫٦٫٥ Fortifications……………………………………………………………………… ٢٫٧ Bread making………………………………………………………………………… ٢٫٧٫١ Rheology of the bread making process………………………………… ٢٫٧٫١٫١ Mixing…………………………………………………………………………..… ٢٤ ٢٥ ٢٥ ٢٦ ٢٦ ٢٧ ٢٨ ٢٨ ٢٫٧٫١٫٢ Fermentation………………………………………………………………….… ٢٫٧٫١٫٣ Baking…………………………………………………………………………..… ٢٫٧٫٢ Bread ingredients…………………………………………………………...…… ٢٫٧٫٢٫١ Flour……………………………………………………………………………..… ٢٫٧٫٢٫٢ Water…………………………………………………………………………….… ٢٫٧٫٢٫٣ Yeast…………………………………………………………………………….… ٢٫٧٫٢٫٤ Salt……………………………………………………………………………….… ٢٫٧٫٣ Bread improvers……………………………………………………………….… ٢٫٧٫٤ Bread quality…………………………………………………………………….… ٢٫٧٫٤٫١ Loaf volume………………………………………………………………….… ٢٫٧٫٤٫٢ Crumb texture………………………………………………………………… ٢٫٧٫٤٫٣ Aroma…………………………………………………………………………..… ٢٩ ٢٩ ٣٠ ٣٠ ٣٠ ٣١ ٣١ ٣١ ٣٢ ٣٢ ٣٣ ٣٤ ٢٫٧٫٤٫٤ Color…………………………………………………………………………..…… CHAPTER THREE: MATERIALS AND METHODS…………... ٣٫١ Materials……………………………………………………………………………..… ٣٫١٫١ Samples of wheat……………………………………………………………..… ٣٫١٫٢ Improvers…………………………………………………………………………… ٣٤ ٣٥ ٣٥ ٣٥ ٣٥ ٣٫١٫٣ Chemicals……………………………………………………………………….… ٣٥ ٣٫٢ Proximate composition………………………………………………………..… ٣٦ ٣٫٢٫١ Moisture content………………………………………………………………… ٣٦ ٣٫٢٫٢ Determination of ash…………………………………………………………… ٣٦ ٣٫٢٫٣ Determination of crude protein…………………………………………… ٣٧ ٣٫٢٫٤ Determination of fat…………………………………………………………… ٣٨ ٣٫٢٫٥ Determination of crude fibre……………………………………………...… ٣٫٣ Gluten quantity and quality…………………………………………………… ٣٫٤ Falling number…………………………………………………………………….… ٣٫٥ Sedimentation values…………………………………………………………..… ٣٩ ٤٠ ٤١ ٤٢ ٣٫٦ Pelshenke test……………………………………………………………………..… ٣٫٧ Farinograph…………………………………………………………………………… ٤٣ ٤٤ ٣٫٨ Extensograph………………………………………………………………………… ٤٦ ٣٫٩ Preparation of bread samples………………………………………………… ٤٧ ٣٫٩٫١ Loaf bread……………………………………………………………………….… ٤٧ ٣٫٩٫١٫١ Physical characteristics of loaf bread………………………………… ٣٫٩٫١٫١٫١ Bread weight………………………………………………………………… ٣٫٩٫١٫١٫٢ Bread volume……………………………………………………………… ٣٫٩٫١٫١٫٣ Bread specific volume…………………………………………………… ٣٫٩٫١٫٢ Sensory evaluation of loaf bread……………………………………..… ٣٫٩٫٢ Flat bread…………………………………………………………………………… ٣٫٩٫٢٫١ Physical characteristics of flat bread…………………………………. ٣٫٩٫٢٫٢ Sensory evaluation of flat bread……………………………………..… ٣٫١٠ Statistical ٤٨ ٤٨ ٤٨ ٤٨ ٤٩ ٤٩ ٥٠ ٥٠ ٥٠ analysis……………………………………………………………...… CHAPTER FOUR: RESULTS AND DISCUSSION………………… ٥١ ٤٫١ Chemical composition…………………………………………………………… ٥١ ٤٫١٫١ Moisture content…………………………………………………………………. ٤٫١٫٢ Ash content………………………………………………………………………… ٤٫١٫٣ Protein content……………………………………………………………….…… ٤٫١٫٤ Fat content………………………………………………………………………..… ٤٫١٫٥ Fibre Content……………………………………………………………………… ٤٫٢ Physical criteria of wheat quality assessment………………………… ٤٫٢٫١ Kernel weight…………………………………………………………………...… ٤٫٢٫٢ Test weight………………………………………………………………………… ٥١ ٥١ ٥٣ ٥٤ ٥٤ ٥٥ ٥٥ ٥٥ ٤٫٣ Gluten quantity and quality…………………………………………………… ٥٧ ٤٫٤ Falling number (seconds) ……………………………………………………… ٦٢ ٤٫٥ Sedimentation value (cm٣) ……………………………………………………. ٦٤ ٤٫٦ Pelshenke test……………………………………………………………………..… ٦٤ ٤٫٧ Farinogram results…………………………………………………………………. ٦٧ ٤٫٨ Extensogram results……………………………………………………………… ٧٨ ٤٫٩ Baking test………………………………………………………………………….… ٨٨ ٤٫٩٫١ Physical characteristics of loaf and flat bread……………………… ٨٨ ٤٫٩٫١٫١ Loaf bread specific volume……………………………………………… ٨٨ ٤٫٩٫١٫٢ Flat bread diameter………………………………………………………… ٩١ ٤٫٩٫١٫٣ Flat bread thickness………………………………………………………… ٩١ ٤٫٩٫٢ Sensory evaluation of loaf bread…………………………………………. ٩٥ ٤٫٩٫٢٫١ Aroma…………………………………………………………………………… ٩٥ ٤٫٩٫٢٫٢ Taste…………………………………...…………………………………………… ٤٫٩٫٢٫٣ Crumb texture………………………………………………………………… ٤٫٩٫٢٫٤ Crumb color……………………..……………………………………………… ٤٫٩٫٢٫٥ Crumb cell uniformity……………………………………………………… ٩٥ ٩٩ ٩٩ ١٠٢ ٤٫٩٫٢٫٦ General acceptability……………………………………………………… ١٠٢ ٤٫٩٫٣ Sensory evaluation of flat bread………………………………………… ١٠٨ ٤٫٩٫٣٫١ Aroma…………………………………………...………………………………… ١٠٨ ٤٫٩٫٣٫٢ Taste……………………………………………...………………………………… ٤٫٩٫٣٫٣ Crust color…………………………..…………………………………………… ١٠٨ ١١٢ ٤٫٩٫٣٫٤ General acceptability……………………………………………………… ١١٢ CHAPTER FIVE: CONCLUSION AND RECOMMENDATIONS ١١٧ ٥٫١ Conclusions………………………………….………………………………………… ١١٧ ٥٫٢ Recommendations………………………………………………………………… ١١٧ REFERENCES ………………………….…………………………………………… ١١٨ APPENDIXES…………………………………………………………………………… ١٣١ LIST OF TABLES Table ١. Page Chemical composition of the whole flours of the three local wheat cultivars (harvested season (٢٠٠٣/٢٠٠٤). …..……………… ٢. ٥٢ Chemical composition of the flours of the three local wheat cultivars (harvested season (٢٠٠٣/٢٠٠٤) and Canadian wheat flour (٧٢٪ extraction rate). ……………………………………………… ٣. ٥٢ Hectolitre and thousand kernels weight of the three local wheat cultivars (harvested season ٢٠٠٣/٢٠٠٤)……………….. ٤. ٥٦ Gluten quantity and quality, falling number, Pelshenke test and sedimentation value of the three Sudanese wheat cultivars and Canadian wheat flours with and without improvers. ……… ٥. ٥٨ Effect of bread improvers on farinogram readings of the three Sudanese wheat cultivars and Canadian wheat flours. ………… ٦. ٦٩ Effect of bread improvers on extensogram readings of the three Sudanese wheat cultivars and Canadian wheat flours….. ٧. ٧٩ Physical characteristics of loaf breads made from the three Sudanese wheat cultivars and Canadian wheat flours with and without improvers. ………………………………………………………… ٨. ٨٩ Physical characteristics of flat breads made from the three Sudanese wheat cultivars and Canadian wheat flours with and without improvers. ٩٢ ………………………………………………………… ٩. Sensory evaluation of loaf bread made from the three Sudanese wheat cultivars and Canadian wheat flours with and with out improvers…………………………………………… ١٠. ٩٦ Sensory evaluation of flat bread made from three Sudanese wheat cultivars and Canadian wheat flours with and with out improvers. …………………………………………………………………… ١٠٩ LIST OF FIGURES Fi Pag g e ١. Effect of improvers on wet gluten content of three Sudanese and Canadian wheat flours………………….……………………………………… ٢. ٥٩ Effect of improvers on dry gluten content of three Sudanese and Canadian wheat flours……………………..…………………………………… ٣. ٦٠ Effect of improvers on gluten index of three Sudanese and Canadian wheat flours………………………..………………………………… ٤. ٦١ Effect of improvers on falling number of three Sudanese and Canadian wheat flours………………………….……………………………… ٥. ٦٣ Effect of improvers on sedimentation value of three Sudanese and Canadian wheat flours………………………………………………….… ٦. ٦٥ Effect of improvers on Pleshenke test of three Sudanese and Canadian wheat flours…………………………………………………….….… ٧. ٦٦ Farinogram of dough prepared from Canadian flour without improvers………………………………………………………………………… ٨. … ٧٠ Farinogram of dough prepared from Canadian flour with Z ٧٠ improver…………………………………………………………………………. … ٩. Farinogram of dough prepared from Canadian flour with A improver…………………………………………………………………………. … ٧١ ١٠. Farinogram of dough prepared from Canadian flour with S improver………………………………………………………………………….. … ٧١ ١١. Farinogram of dough prepared from Debaira flour without improvers………………………………………………………………………… … ٧٢ ١٢. Farinogram of dough prepared from Debaira flour with Z improver…………………………………………………………………………. … ٧٢ ١٣. Farinogram of dough prepared from Debaira flour with A improver…………………………………………………………………………. … ٧٣ ١٤. Farinogram of dough prepared from Debaira flour with S improver…………………………………………………………………………. … ٧٣ ١٥. Farinogram of dough prepared from Wadi Elneel flour without improvers………………………………………………………………………… … ٧٤ ١٦. Farinogram of dough prepared from Wadi Elneel flour with Z improver………………………………………………………………………..… … ٧٤ ١٧. Farinogram of dough prepared from Wadi Elneel flour with A improver………………………………………………………………………..… … ٧٥ ١٨. Farinogram of dough prepared from wadi Elneel flour with S improver………………………………………………………………………..… … ٧٥ ١٩. Farinogram of dough prepared from Elneelain flour without improvers………………………………………………………………………… … ٧٦ ٢٠. Farinogram of dough prepared from Elneelain flour with Z improver…………………………………………………………………………. … ٧٦ ٢١. Farinogram of dough prepared from Elneelain flour with A improver…………………………………………………………………………. … ٧٧ ٢٢. Farinogram of dough prepared from Elneelain flour with S improver…………………………………………………………………………. … ٧٧ ٢٣. Extensogram of dough prepared from Canadian flour without improvers………………………………………………………………………… … ٨٠ ٢٤. Extensogram of dough prepared from Canadian flour with Z improver……………………………………………………………………….… … ٨٠ ٢٥. Extensogram of dough prepared from Canadian flour with A improvers………………………………………………………………………… … ٨١ ٢٦. Extensogram of dough prepared from Canadian flour with S improver………………………………………………………………………..… … ٨١ ٢٧. Extensogram of dough prepared from Debaira flour without improvers……………………………………………………………………….. … ٨٢ ٢٨. Extensogram of dough prepared from Debaira flour with Z improver…………………………………………………………………………. … ٨٢ ٢٩. Extensogram of dough prepared from Debaira flour with A improver……………………………………………………………………….… … ٨٣ ٣٠. Extensogram of dough prepared from Canadian flour with S improver…………………………………………………………………………. … ٨٣ ٣١. Extensogram of dough prepared from Wadi Elneel flour without improvers……………………………………………………………………….. … ٨٤ ٣٢. Extensogram of dough prepared from Wadi Elneel flour with Z improver………………………………………………………………………….. … ٨٤ ٣٣. Extensogram of dough prepared from Wadi Elneel flour with A improver……………………………………………………………………….… … ٨٥ ٣٤. Extensogram of dough prepared from Wadi Elneel flour with S improver…………………………………………………………………………. … ٨٥ ٣٥. Extensogram of dough prepared from Elneelain flour without improvers………………………………………………………………………… … ٨٦ ٣٦. Extensogram of dough prepared from Elneelain flour with Z improver…………………………………………………………………………. … ٨٦ ٣٧. Extensogram of dough prepared from Elneelain flour with A improver…………………………………………………………………………. … ٨٧ ٣٨. Extensogram of dough prepared from Elneelain flour with S improver………………………………………………………………………… … ٨٧ ٣٩. Effect of improvers on specific volume of loaf bread made from flour of Sudanese and Canadian wheat cultivars……………………… ٩٠ ٤٠. Effect of improvers on diameter of flat bread made from flour of Sudanese and Canadian wheat cultivars………………………………… ٩٣ ٤١. Effect of improvers on thickness of flat bread made from flour of Sudanese and Canadian wheat cultivars………………………………… ٩٤ ٤٢. Effect of improvers on aroma of loaf bread made from flour of Sudanese and Canadian wheat cultivars………………………………… ٩٧ ٤٣. Effect of improvers on taste of loaf bread made from flour of Sudanese and Canadian wheat cultivars………………………………… ٩٨ ٤٤. Effect of improvers on crumb texture of loaf bread made from flour of Sudanese and Canadian wheat cultivars……………………… ١٠٠ ٤٥. Effect of improvers on crumb color of loaf bread made from flour of Sudanese and Canadian wheat cultivars……………………………… ١٠١ ٤٦. Effect of improvers on crumb cell uniformity of loaf bread made from flour of Sudanese and Canadian wheat cultivars……………… ١٠٤ ٤٧. Effect of improvers on general acceptability of loaf bread made from flour of Sudanese and Canadian wheat cultivars……………… ١٠٥ ٤٨. Effect of improvers on aroma of flat bread made from flour of Sudanese and Canadian wheat cultivars………………………………… ١١٠ ٤٩. Effect of improvers on taste of flat bread made from flour of Sudanese and Canadian wheat cultivars………………………………… ١١١ ٥٠. Effect of improvers on crust color of flat bread made from flour of Sudanese and Canadian wheat cultivars……………………………… ١١٣ ٥١. Effect of improvers on general acceptability of flat bread made from flour of Sudanese and Canadian wheat cultivars…………….… ١١٤ LIST OF PLATES Plate ١. Page Debaira, Wadi Elneel, Elneelain and Canadian loaf breads without improvers…………………………………………………………..… ٢. ١٠٦ Debaira, Wadi Elneel, Elneelain and Canadian loaf breads with Z improver………………………………………………………………….…… ٣. ١٠٦ Debaira, Wadi Elneel, Elneelain and Canadian loaf breads with A improver…………………………………………………………………….… ٤. ١٠٧ Debaira, Wadi Elneel, Elneelain and Canadian loaf breads with S improver…………………………………………………………………….… ٥. ١٠٧ Debaira, Wadi Elneel, Elneelain and Canadian flat breads without improvers………………………………………………………..…… ٦. ١١٥ Debaira, Wadi Elneel, Elneelain and Canadian flat breads with Z improver……………………………………………………………………… ٧. ١١٥ Debaira, Wadi Elneel, Elneelain and Canadian flat breads with A improver………………………………………………….…………………… ٨. ١١٦ Debaira, Wadi Elneel, Elneelain and Canadian flat breads with S improver………………………………………………………………………………. ١١٦ CHAPTER ONE INTRODUCTION Wheat ranks first among cultivated plants of the world. It is an important source of protein for the inhabitants of developing countries. Wheat is unique among cereals, because it contains gluten which has the characteristic of being elastic when mixed with water and retains the gas developed during dough fermentation. Wheats produced in different parts of the world differ greatly in their intrinsic protein qualities and quantities, the quantity is influenced mainly by environmental factors, but the quality of protein is mainly a heritable characteristic. Wheat is favored for bread baking, the function of baking is to present wheat flours in attractive palatable and digestible forms. Bread is made by baking fermented dough which has main ingredients wheat flour, water, yeast and salt. Sudanese wheats are generally of poor bread making quality, which is attributed to the low protein and gluten quantity and quality, in addition to low alpha amylase activity. Hence improvement of flour quality is very essential for production of good quality bread. Most problems can be solved with the right flour treatment. In many cases it is possible to compensate for a low gluten or protein content. Over strong wheat varieties can also be corrected. Weak doughs can be balanced as required by using the right additive. So far good flours become better and even poorer flours can be processed without serious problems. Objectives: The objectives of this study were: ١. To study the effect of different improvers on the rheological and bread making properties of three local commercial wheat cultivars compared with Canadian wheat. ٢. To determine the quality aspects of the wheat cultivars studied and select the best of them for bread making after treatment with different improvers. CHAPTER TWO LITERATURE REVIEW ٢٫١ Types of wheat: Wheat (Triticum aestvium) is often classified as hard or strong and soft or weak. During milling, the vitreous endosperm of hard wheat tends to break between the cell, producing a flour that is granular to the touch and free – flowing. On the other hand, the mealy, white endosperm of soft wheat tends to be pulverized so that few or no whole cells are left. The resulting flour is softer to the touch than flour made from hard wheat and tends to clump together like talcum. Wheat is also classified as spring or winter wheat. Spring wheat is planted in the spring and harvested in the late summer. Winter wheat is planted in the fall so that it can develop a root system before cold weather. It grows rapidly in the spring and harvested early summer. Winter wheat can be grown only in areas where the root system can survive the winter. Spring wheat is usually harder. However winter wheats may be either hard or soft depending on the variety and the growing conditions (Griswold, ١٩٦٢). Wheat in Sudan is grown under irrigation during the dry and comparatively cool winter season which extends from November to February. The potential yield is limited by day temperature above ٣٥°C at any stage of crop development. The season with acceptable heat limits ranged between ٩٠ and ١١٠ days (Ishage and Ageeb ١٩٩١). Wheat production was confined to the Northern Sudan, along the Nile banks (١٧-٢٢N).However ,after ١٩٤٠s due to increasing demand for wheat consumption and scarcity of land, the growing area extended Southward to the warmer central and Eastern Sudan (١٣١٥N) (Ageeb, ١٩٩٤). One of the main constraints of wheat production in Sudan is heat stress, which adversely affects plant growth and grain formation (Elahmadi, ١٩٩٤). Wheat is getting more important as one of the main cereal foods in the Sudan. In addition to its use as bread, wheat entered into other industries such as biscuits, cakes, macaroni, etc. In the last few years, domestic migration in Sudan from rural area to urban area lead to increased demand for bread, so considerable work is being carried out recently at various research stations to breed high yielding with high quality and disease resistant varieties of wheat. ٢٫٢ Wheat quality: Quality of wheats and end – use quality characteristics of flours are influenced by both genotype and environmental factors, (Peterson, et al., ١٩٩٢). Everson (١٩٨٧) stated that, climate has considerable influence on the type and variety of wheat grown, so the quality varies widely with geographical regions. Zeleny (١٩٧١) reported that, the quality of wheat is usually judged by its suitability for particular end use. ٢٫٢٫١ Physical criteria of wheat quality assessment: ٢٫٢٫١٫١ Test weight: Test weight measures the density of grain in kg per Hectoliter. Hectoliter weight is useful for the grading of wheat. Williams, et al., (١٩٨٦) reported that higher correlations occur between hectoliter weight (test weight) and flour yield. This is because hectoliter weight is related to grain density, rather than weight, and the denser kernels tend to contain more endosperm (flour). Generally immature wheat or wheat affected by drought or diseases is of low density and invariably gives low yields of flour. However, the rounder the kernels, and the smaller the crease, the higher the test weight and flour yield. ٢٫٢٫١٫٢ Kernel weight: Kernel weight, usually expressed in the terms of weight per ١٠٠٠ kernels. This test depends at the same time on the compactness of structure of the grain and its chemical composition including its moisture content. Zeleny (١٩٧١) found that the thousand kernels weight for hard red spring and hard red winter wheats ranged from٢٠to٣٢g, whereas soft white and durum wheats ranged from٣٠ to ٤٠g. Ahmed (١٩٩٥) stated that the thousand kernels weight of Sudanese cultivars ranged between٢٨and٤٤g.However Mohamed (٢٠٠٠) reported that the thousand kernels weight of four Sudanese wheat cultivars Debaira,Elneelain,Condor and Sasaraib ranged between ٣٢and٣٨g. ٢٫٣ General structure: Wheat grain botanically consists of fibrous outer layer (bran), starchy endosperm (flour) and embryo (germ) as reported by Bushuk (١٩٨٦). The wheat grain has the following average composition: endosperm ٨٣ – ٨٥٪, bran ١٢٫٥ – ١٤٫٥٪ and germ ٢٫٥٪ (Egan, et al., ١٩٨١, Anon ١٩٨٧). The endosperm is the source of white flour, and contains the greatest share of protein (protein bodies), starch, minerals, and B – complex vitamins such as thiamin, riboflavin and niacin. The bran consists of small amount of protein, higher amount of B – complex vitamins, dietary fibre and minerals. Germ comprises minimal amounts of protein, but greatest share of fats, vitamins especially tocopherols (Anon ١٩٨٧). ٢٫٤ Chemical composition: ٢٫٤٫١ Moisture content: Moisture content is one of the most important factors affecting the quality of wheat (Anon ١٩٨٧). It has direct economic importance. Generally moisture content is greatly affected by relative humidity at harvest and during storage. Ahmed (١٩٩٥) reported that moisture content of different Sudanese wheat cultivars varies from about ٦٫٣٣ up to about ٨٫٨٦٪. However, Mohamed (٢٠٠٠) found that moisture content of four Sudanese wheat cultivars Debaira, Elneelain, Condor and Sasaraib range between ٧٫٥ and ٧٫٩٥٪. Elagib (٢٠٠٢) mentioned that moisture content of three Sudanese wheat cultivars Debaira, Elneelain, and WadiElneel ranged between ٦٫٢٣ and ٧٫٤٩٪. ٢٫٤٫٢ Ash content: Ash content has been considered an important indicator of flour quality. It gives some indication of the miller’s skill and the degree of refinement in processing (Pratt, ١٩٧١). Zeleny (١٩٧١) mentioned that ash content of wheat is directly related to the amount of bran in the wheat, and hence has a rough inverse relationship to flour yield. He also found that ash content of whole wheat flours ranged between ١٫٤ and ٢٫٠٪. Badi, et al., (١٩٧٨) showed that the ash content of Sudanese wheat cultivars ranged between١٫٣٨ and ١٫٨٤٪for whole wheat flours. Ahmed (١٩٩٥) stated that ash content of whole and white flours of different Sudanese cultivars ranged between ١٫٠٣ and ١٫٢٤٪, ٠٫٣١ and ٠٫٤٧٪ respectively. Mohamed (٢٠٠٠) found that ash content of whole and white flours of four Sudanese cultivars Debaira, Elneelain, Condor and Sasaraib ranged from ١٫٣٥ to ١٫٥٢٪, ٠٫٣٨ to ٠٫٥٠٪ respectively. Elagib (٢٠٠٢) showed that ash content of whole flours of three Sudanese cultivars Debaira, Elneelain, and WadiElneel ranged from ١٫٠ to ١٫٤٥٪. ٢٫٤٫٣ Oil content: The fats limit the keeping quality of wheat flour (Anon ١٩٨٧). Ahmed (١٩٩٥) found that fat content of whole and white flour (٧٢٪ extraction rate) of Sudanese wheat cultivars ranges between ١٫٩١ and ٢٫٣٦٪, ٠٫٨٥ and ١٫٧٣٪ respectively. Mohamed (٢٠٠٠) reported that fat contents of the whole and white flour of Sudanese wheat cultivars Debaira, Elneelain, Condor and Sasaraib, were found to be in the range of ٢٫١٥ to ٢٫٣٥٪ and ١٫٣٣ to ١٫٤٣٪, respectively. ٢٫٤٫٤ Protein content: Wheat is an important source of protein for people of developing countries (Blackman and Payne, ١٩٨٧). George (١٩٧٣) found that the protein content of wheat is highly influenced by the environmental conditions, grain yield and available nitrogen as well as the variety genotype. Ahmed (١٩٩٥) found that protein content of whole flour of different Sudanese cultivars ranged between ١٢٫٣٨ and ١٥٫٣٢٪. Mohamed (٢٠٠٠) showed that the protein content of the whole and white flour of four Sudanese cultivars Debaira, Elneelain, Condor and Sasaraib ranged between ١٢٫٥٩ and ١٤٫٨٢٪, ١١٫٧٩ and ١٣٫٨٥٪ respectively. ٢٫٤٫٥ Fibre content: Fibre is the indigestible carbohydrate in food which acts like a broom to sweep out the digestive tract. Adequate fibre intake has been related to a lower incidence of cancer of the colon and some types of heart diseases and to better control diabetes (Anon ١٩٨٧). Egan, et al., (١٩٨١) found that the fibre percentage in whole wheat flour ranges between ١٫٨ and ٢٫٥٪ and of white flour (٧٢٪ extraction rate) ranges between ٠٫١ and ٠٫٣٪. Ahmed (١٩٩٥) reported that the fibre content of Sudanese wheat cultivars ranged between ١٫٧٥ and ٢٫٣٤٪ for whole flour and between ٠٫٣٠ and ٠٫٤٨٪ for white flour. Mohamed (٢٠٠٠) showed that the fibre content of the whole and white flour of four Sudanese cultivars Debaira, Elneelain, Condor and Sasaraib ranged between ١٫٨٥ and ٢٫٢٥٪, ٠٫٤٠ and ٠٫٤٨ respectively. ٢٫٥ Flour quality: Flour quality denotes the suitability of the flour for a certain use and has no relationship to its nutritive value. Thus a flour of good quality for bread is not necessarily of good quality for cake. The formation of a dough that has a good balance between elasticity and extensibility is one of the hall marks of a high quality flour and one that indicates that the gluten is of good quality. ٢٫٥٫١ Protein quantity and quality: Protein content is not the only factor determining end – use properties. Protein quality can influence the baking properties of both hard wheat flour (Orth and Bushuk ,١٩٧٢) and soft white wheat flour (Kaldy and Rubenthaler ,١٩٨٧). Strong and weak flours produce dough which has different mixing properties; this difference is due mainly to the quality and quantity of protein (Blackman and Payne ,١٩٨٧). An important factor in protein quality is the gluten characteristics of a dough. Gluten is formed by the interactions of the proteins, glutenin and gliadin, which also associate with lipid and pentosans during dough formation (D’Appolonia and Kim ١٩٧٦, Hoseney ١٩٨٦). Kaldy, et al., (١٩٩٣) mentioned that gluten is an important factor in wheat flour quality, which gives wheat flour it’s baking characteristics. Thus, gluten is in reality the skeleton or frame work of wheat flour dough, and is responsible for gas retention. This property gives volume and appearance of the bread. Pomeranz (١٩٧١) reported that a strong dough with an extensive gluten network is suitable for bread making. In contrast a weak dough, without an extensive gluten network, is best for cookies and cakes (Gaines, ١٩٩٠). Tolman, et al., (١٩٩٨) found that the ratio between elasticity and extensibility (glutenin/gliadin) plays a crucial role in the handling properties of the dough and the quality of the final products. Perten (١٩٩٥) stated that gluten index is important for gluten quality. Usually, there is a positive relationship between glutenin quantity and the gluten index percentage. But, there is a negative correlation with the gliadin quantity. Consequently, flour quality is influenced by the nature of the gluten and its various components. ٢٫٥٫٢ Amylase activity: Amylase activity is one of the factors influencing baking quality. During panary fermentation the alpha – and beta – amylases work together in producing fermentable sugars into carbon dioxide and ethyl alcohol. When an insufficient amount of amylase is present, the production of sugars and, consequently, of carbon dioxide remains low, this results in bread with inferior volume, sticky crumb and pale color (Novo, ١٩٧٤). Mathewson (٢٠٠٠) reported that, a normal flour, milled from sound wheat, contain significant amounts of beta – amylase but little or no alpha – amylase, so alpha – amylase must be added to sound flour from an out side source. ٢٫٥٫٢٫١ Beta – amylase activity: The influence of beta – amylase in baking is of a minor importance to the quality of bread crumb, since the beta – amylase can not attack undamaged or non – gelatinized starch. The sugar formation by this enzyme at fermentation temperatures is substantially dependent on the amount of starch which was damaged by grinding. Furthermore, the beta – amylase is inactivated at a relatively lower temperature than alpha – amylase, often simultaneously with the occurrence of starch gelatinization (Pyler ,١٩٧٣). Beta – amylase can produce some maltose to aid fermentation without the presence of alpha – amylase, but the amount produced is relatively small (Mathewson, ٢٠٠٠). ٢٫٥٫٢٫٢ Alpha – amylase activity: Wheat alpha – amylase is recognized as an important enzyme in affecting the quality of wheat for bread making. In formula containing no sugar, the fermentation process is controlled by the appropriate level of alpha – amylase activity and the amount of damaged starch (Stear, ١٩٩٠). Flour supplementation with alpha – amylase increases bread volume. This effect has been shown with fungal, malt and bacterial alpha – amylase (Rubenthaler, et al., ١٩٦٥, Maninder and Jorgensen ١٩٨٣, Kuracina et al., ١٩٨٧). Alpha – amylase is known to improve crust color, texture and shelf – life by producing low molecular size dextrins (Miller and Johnson ١٩٥٥, Ponte, et al., ١٩٦٣, Kulp and Ponte ١٩٨١, Maninder and Jorgensen ١٩٨٣, Kuracina, et al, ١٩٨٧). Perten (١٩٩٦) mentioned that falling number values below ١٥٠ seconds (high amylase activity, sprout damaged wheat) is likely to produce sticky bread crumb. While, ٢٠٠ to ٣٠٠ seconds (optimal amylase activity), produces bread with good crumb, and above ٣٠٠ seconds (low amylase activity, sound wheat), the bread crumb is likely to be dry and the loaf volume is reduced. Kaldy and Rubenthaler (١٩٨٧) found that the falling number of soft white, winter and spring wheats, ranged between ٣٨٠ and ٤٥٠ seconds, and between ١١١ and ٤٧٩ seconds respectively. While, Lukow and Mcvett (١٩٩١) observed that falling number of hard red spring wheat cultivars ranges between ٣٠٢ and ٣٣٢ seconds. Ahmed (١٩٩٥) showed that the falling number values of some Sudanese wheat cultivars ranged between ٣٩٦ and ٤٨٦ seconds. However, Mohamed, (٢٠٠٠) found that the falling number values of four Sudanese wheat cultivars Debaira, Elneelain, Condor and Sasaraib ranged between ٤٢٥ and ٦٧٥ seconds. ٢٫٥٫٣ Dough rheological properties: Flour and water can be mixed into a viscoelastic dough, but the rheology of the resultant dough changes in different ways as the amount and kind of dough conditioner varies (Danno and Hoseney, ١٩٨٢). However Bloksma and Bushuk (١٩٨٨) stated that the characteristics of the dough are depending on type of flour, quantity and quality of ingredients used, and mixing and resting conditions. Hoseney and Rogers (١٩٩٣) mentioned that the wheat flour dough is even able to retain gas, which is essential for production of baked products with a light texture. Determination of the rheological properties of dough is part of the quality assessment of flour. Instruments designed for this purpose have been reviewed by Shuey (١٩٧٥) and by Bloksma and Bushuk (١٩٨٨). Recording dough mixers like the farinograph, yield information on the behavior of the dough during the mixing stage. Load – extension instruments like the extensograph yield information on doughs resistance to extension and on its extensibility, which may be important for gas retention during fermentation and oven rise. ٢٫٥٫٣٫١ Water absorption: Water is one of the most important constituents of dough and plays major role in dough characteristics. The water absorption of wheat flour dough is governed in practice, by the protein content and quality and by the extent to which the starch is damaged mechanically (the greater the damage the greater the absorption), (Bushuk and Hlynka, ١٩٦٤). Generally a high farinograph water absorption of flour is considered an indication of good baking performance. The reason could be that a high protein content causes good baking performance and high water absorption (Bloksma ١٩٧٢, Meredith ١٩٦٦). ٢٫٥٫٣٫٢ Viscosity: Bloksma (١٩٩٠a) stated that the viscosity must be sufficiently large to prevent the ascent of gas cell. This condition is met by virtually all doughs, it does not discriminate between flours with poor and satisfactory baking performance. However Collado and Deleyn (٢٠٠٠) reported that viscosity is more pronounced when there are longer time scales or slower rates of deformation of dough. Popper (٢٠٠٤) reported that a low viscosity is equivalent to alow water absorption. ٢٫٥٫٣٫٣ Extensibility: Dough must be extensible in order to prevent premature rupture of membranes between gas cells. The extensibility must be maintained long enough under baking conditions to permit sufficient oven rise (Bloksma ١٩٩٠a, Bloksma and Bushuk ١٩٨٨). Extensibility, however, is enhanced by the presence of many unbranched, long – chain glutenin molecules (Bloksma, ١٩٩٠a). ٢٫٥٫٣٫٤ Resistance: Bloksma (١٩٧٢) stated that the resistance and elasticity should be low enough to permit large deformations without unduly high stress and sufficiently high to prevent ascent of gas cell. A very high resistance usually leads to poor baking performance is probably a result of the accompanying lack of extensibility (Bloksma, ١٩٧٤). Kieffer (٢٠٠٣) has recently published results from comparative investigations of dough rheology and dough yield. He concludes that only resistance is positively related to baked volume. ٢٫٥٫٣٫٥ Dough development: Dough development is explained by alignment of glutenin molecules, leading to a large number of noncovalent cross links. During dough development, the solubility of the proteins increases (Danno and Hoseney ١٩٨٢, Tanaka and Bushuk ١٩٧٣), and the extractability of lipids decreases (Chung ١٩٨٦, Frazier ١٩٨٦). Faubion and Hoseney (١٩٩٠) reported that, the full bread making potential of the dough is attained only at the optimum point of dough development. Spies (١٩٩٠) mentioned that, beyond the point of optimum mixing, resistance to extension no longer increases and the dough starts to break down. As dough breaks down, it becomes wet and sticky. Bloksma (١٩٩٠b) reported that, a long dough development time of a flour is considered an indication of good baking performance. ٢٫٥٫٤ Sedimentation value: Wheat sedimentation test is a combined measure of gluten quality and quantity. Williams (١٩٧٠) found that, strong gluten swell the most and occupy the biggest volume in lactic acid solution. However Williams, et al., (١٩٨٦) mentioned that hard wheat flour, which have larger mean particle size than soft wheat flours, sediment faster. Mohamed (٢٠٠٠) showed that, the sedimentation value of Sudanese wheat cultivars Debaira, Elneelian, Sasaraib, and Condor ranged between ٢١ and ٢٤cm٣. While Elagib (٢٠٠٢) found that, the sedimentation value of Sudanese wheat cultivars Debaira, Elneelian and WadiElneel ranged between ١٣٫٦٧ and ١٩٫٠٧ c.m٣. ٢٫٥٫٥ Wheat meal fermentation time (WMFT): Wheat meal fermentation time test was developed in Germany by Paul Pelshenke. It gives an estimate of the strength of the wheat and combined gas retention capacity of the wheat protein complex. Williams, et al., (١٩٨٦) reported that wheat with WMFT of ١٥٠-٢٠٠ minutes is most suitable for bread making. ٢٫٦ Flour additives: ٢٫٦٫١ Bleaching agents: Wheat flour can be bleached chemically, by such materials as chlorine, chlorine dioxide, acetone peroxide and benzoyl peroxide. This type of treatment has been carried out by flour millers to improve the color of their flour (dosage given in Appendix ١). However treatment may not always be desirable. ٢٫٦٫١٫١ Chlorine: Chlorine is widely used in the treatment of soft wheat flours to improve cake making properties. It has some color removing effect, indicating action on flour pigments, but the creamy yellow pigments can not be removed completely at the treatment levels used to achieve optimum performance (Pomeranz, ١٩٨٨). ٢٫٦٫١٫٢ Chlorine dioxide: Chlorine dioxide has similar improving and bleaching action. It is no longer used in Europe for their possible harmful effects on health and technical risks involved. There is no doubt that with certain baked goods cholorination of the flour that can only be carried out in the mill – produces best result (Anon ١٩٩٨). ٢٫٦٫١٫٣ Acetone peroxide: Acetone peroxide has both bleaching and improving effect (Johnson, et al., ١٩٦٢, Ferrari, et al., ١٩٦٣). Acetone peroxide rapidly reduces the thiol content of dough and increases its resistance (Tsen, ١٩٦٤). ٢٫٦٫١٫٤ Benzoyl peroxide: Benzoyl peroxide reacts with the carotenoid pigments in flour to render them white, where as their natural color is creamy yellow to yellow. If flour is aged under ideal storage conditions, the same chemical change takes place through natural oxidation (Pomeranz ,١٩٨٨). ٢٫٦٫٢ Dough conditioners: Dough conditioners have been used as additives in baking products for about ٥٠ years to improve dough characteristics, eating quality and shelf life (Stauffer ١٩٨٣, Fitchett and Frazier ١٩٨٦). Dough conditioners may be grouped into four categories: oxidants, reductants, surfactants, and mixing time reducers (Stauffer, ١٩٨٣). ٢٫٦٫٢٫١ Oxidants: Oxidants are compounds added to dough formulations to change the characteristics of the gluten matrix. These changes are commonly called “strengthening agents”. Oxidants enhance the rate at which cross – links are formed, building up and strengthen gluten – protein structures (Allen, ١٩٩٩). MacRitchie (١٩٨٧) observed that oxidants increase the average molecular weight of the glutens and strengthen the dough. Generally, most bakers consider oxidants or oxidizing agents the most important class of dough conditioners because the high speed production of quality baked goods would be virtually impossible without their use. ٢٫٦٫٢٫١٫١ Potassium bromate: Potassium bromate was first introduced as a bread improver in ١٩١٦ (Fitchett and Frazier ,١٩٨٦). It is a slow acting oxidizing agent that work during fermentation, proofing, and baking. The oxidation process affects the dough structure and rheology. It improves dough handling, properties contributing to loaf volume and texture (Giesecke, ٢٠٠٠). Potassium bromate had been used extensively until recent years after tests on laboratory animals raised question as to its mutagenicity (Kurokawa, et al., ١٩٨٣). In (١٩٩٢) JECFA recommended that bromate be excluded from the flour standards because of safety points of view. Consequently, this very efficient and cheap bread improver is being banned in most countries for health reasons. ٢٫٦٫٢٫١٫٢ Ascorbic acid: Ascorbic acid (AA) functions as a reducing agent in the absence of oxygen and is used to reduce mixing time in continuous and vacuum mix system, in the presence of oxygen and flour, it functions as an oxidant (Allen, ١٩٩٩). Qarooni, et al., (١٩٨٩) reported that, the addition of ascorbic acid to the formula of pita bread produced doughs with higher resistant to sheeting and consequently thicker products, and the internal quality parameters significantly deteriorated with this addition. However, opposite results were found by Rubenthaler and Faridi (١٩٨١) who reported improvement in the quality of five breads by the addition of malted barley and ascorbic acid. All treated breads differed significantly from the control in their ability to roll and fold and quality of tearing. ٢٫٦٫٢٫١٫٣ Azodicarbonamide: Azodicarbonamide (ADA) is a rapid acting reagent that reduces the thiol content of dough and increases its resistance to extension. It has no bleaching action (Joiner ١٩٦٢, Tsen ١٩٦٣, ١٩٦٤, Fitchett and Frazier ١٩٨٦). It also shortens the dough development time and decreased tolerance to over mixing (Fitchett and Frazier ,١٩٨٦). Allen (١٩٩٩) reported that (ADA) exhibits rapidly rate of reaction and extended period of oxidation, it also facilitates setting of the basic dough structure. ٢٫٦٫٢٫١٫٤ Lipoxygenase: Lipoxygenase usually added to flour in the form of enzyme active soy flour (Barrett ,١٩٧٥). Lipoxygenase exhibits agluten – strengthening effect and increases the mixing tolerance of a dough. It oxidizes carotenoids and chlorophyll pigments in flour to their colorless form, which result in a bleaching action to whiten flour (Mathewson ,٢٠٠٠). However Hoseney, et al., (١٩٨٠) found that lipoxygenase contributes to stronger mixing characteristics and more tolerance to over mixing. ٢٫٦٫٢٫٢ Reductants: Reductants are compounds used to inhibit the formation of disulfide bonds between gluten subunits and consequently make doughs mix faster and handle more easily. The most commonly used chemical reductants are the sulfhydryl amino acid, cysteine, and the inorganic compound, sodium meta bisulfite. Reductants (reducing agents) enhance the rate at which cross – links are broken or reduced, which degrades and weakens gluten – protein structures (Allen ,١٩٩٩). MacRitchie (١٩٨٧) found that reductants decrease the average molecular weight and weaken the dough. ٢٫٦٫٢٫٢٫١ Cysteine: Cysteine shortened the required mixing time, as determined by the mixograph (Weak, et al, ١٩٧٧). It reduced the energy requirement to mix the doughs to optimum development (Fitchett and Frazier, ١٩٨٦). ٢٫٦٫٢٫٢٫٢ Sodium meta bisulfite: The mode of action of sodium meta bisulfite is similar to cysteine. The over all effect is that the elastic strength of the gluten matrix is decreased, so it become more pliable and extensible. They are commonly used where strong gluten characteristics are not wanted, such as in soda crackers and certain types of hard cookies (Stauffer, ١٩٨٣). ٢٫٦٫٢٫٣ Surfactants: Surfactants are added to soften the crumb or to make the dough more resistant to work input during processing. They are used by food manufacturers to improve the dough strength, volume, and texture of baked goods. Researchers (Knightly ١٩٧٣, Hoseney, et al., ١٩٧٠, Chung ١٩٨٦) found surfactants to be effective in increasing dough strength and mixing tolerance, extensibility and water absorption. ٢٫٦٫٢٫٣٫١ Sodium stearoyl lactylate (SSL): Mixing time of doughs containing (SSL) tended to increase with increased concentration, but stability decreased (Watson and Walker, ١٩٨٦). Contradicting results reported by Tsen and Weber (١٩٨١) who found an increase in the curve’s stability when (SSL) was added in solution to yeasted doughs. ٢٫٦٫٢٫٣٫٢ Monoglyceride (MG): Monoglycerides in bread formula extend shelf life, strengthen the dough, and retard crystallization (Morad and D’Appolonia, ١٩٨٠). However Al – Eid (٢٠٠٠) found that, pita bread supplemented with monoglycerides had an even layer thickness, and very good rolling and folding ability. Moreover crust color was uniform and moderate brown. ٢٫٦٫٢٫٣٫٣ Sucrose esters (SE): Sucrose esters added to bread flour in powder form increase the mixograph mixing time (Watson and Walker, ١٩٨٦). While Farvili et al., (١٩٩٥) found that low concentration (٠٫٢٥٪) of sucrose esters and sodium stearoyl lactylate produced a high quality Arabic (pita) bread than the control. ٢٫٦٫٢٫٤ Mixing time reducers: Mixing time reducers are additives that decrease the number of disulfide bonds formed during mixing (Stauffer, ١٩٨٣). ٢٫٦٫٢٫٤٫١ Fumaric and Sorbic acid: Sidhu, et al., (١٩٨٠) found that the energy input during mixing breaks disulfide links to form two thiol – free radicals, which react with the double bond in fumaric or sorbic acid, forming a covalently bonded addititional product that can not form any linkages between the protein molecular. The difference between this reaction and that of reducing agents is that when mixing stops, the action of fumaric or sorbic acid also stops. A reducing agent continues to weaken the gluten sheet until the reducing agent is depleted. ٢٫٦٫٢٫٤٫٢ Proteases: Proteases are enzymes that hydrolyze peptide bonds in proteins. Some proteases are present in flour, but their activity is generally low. Supplementation with proteases helps to break down the gluten protein so that the dough is softer and more extensible(Mathewson, ٢٠٠٠). Barrett (١٩٧٥) reported that protease breaks a limited number of peptide links in the protein backbone, decreasing the elasticity of the gluten and bringing the development of gluten strength to a maximum in a shorter time. Like reductants, however, proteases continue to work even after mixing is completed, and so can soften the dough during resting and proofing periods. ٢٫٦٫٣ Shortening: A major effect of adding shortening to bread dough is an increase in the volume of the bread. Dough made with and without shortening typically proofs the same height but differ greatly in final loaf volume (Elton and Fisher, ١٩٦٦). However, Junge and Hoseney (١٩٨١) found that doughs made with shortening have been shown to continue to expand for a longer time (to a higher temperature), thus attaining a larger volume than doughs made without shortening. Faridi and Rubenthaler (١٩٨٤) reported that, shortening at the level of ١٪ improved the physical quality. ٢٫٦٫٤ Enzymes: Doughs prepared with insufficient enzyme activity tend to be tight and over elastic. They are difficult to machine because they resist being molded and shaped. They may not fill the shape of the pan because of their resistance to flow. The sheeted dough shrinks back too fast, increasing the individual piece weight. In general, several effects can be expected as a result of specific enzymatic modification of the flour components .keeping in mind that commercial enzymes contain multiple forms of enzymatic activity, one can expect that amylases will produce additional fermentable sugars and will alter the dough consistency, making it softer. Proteases will also soften the dough as the result of gluten protein modification and can produce enough new amino groups to affect product color and flavor through the Millard reaction. Pentosanases will significantly affect dough rheology and depending on the moisture content and type of product produced, can adversely affect product texture (Mathewson, ٢٠٠٠). ٢٫٦٫٥ Fortifications: Wheat in its natural state is an excellent source of many vitamins and minerals, but because most of them are concentrated in the outer layers of the wheat grain, a significant proportion is lost during the milling process. Fortification restores or enhances these key vitamins and minerals. Enriched flour is white flour to which specific B vitamins and ion have been added (Bennion ,١٩٨٠). Optional ingredients are calcium and vitamin D (Bennion ١٩٨٠, and Wolf, et al., ١٩٧٩). ٢٫٧ Bread making: Bread making industry is not modern discipline, but the improvement of its techniques was slowly. From the nineteenth century and forward, with evolution in food science and technology it would be possible to control its different operations. Bread making process is a multi step process which involves many tasks to be performed before the final product is obtained (Dendy ,١٩٩٢). The main factor, which places wheat in the front position among the world crop, is its bread making quality. Wheat is used for several purposes, but the traditional staple food is bread, which is produced in many forms by different processes. Flour suitable for bread making in one country may not be acceptable in others (Anon, ١٩٨٧). Hoseney, et al., (١٩٨٨) stated that, soft wheat flours with low protein content are used for pastry products rather than for bread making, where hard wheat flour with higher protein content is used for bread making. However, Blackman and Payne (١٩٨٧) reported that, the protein content of wheat used for bread making may vary from ١١ to ١٥٪. Generally, good quality flour for bread making should have high water absorption, medium to medium – long mixing requirement, satisfactory mixing tolerance, dough handling properties and good loaf volume. Williams (١٩٧٠) mentioned that the general methods of making bread is to prepare a dough of flour, yeast, salt and water, the yeast acts on the sugars present in the dough, either in the form of added glucose or sucrose or those produced by natural enzymatic action on the flour, producing carbon dioxide gas which distends the dough causing it to rise. At the same time by the initial mixing operation and during the period of fermentation the gluten of the dough is developed and mellowed. When the dough is considered to be in the right condition (ripe) at the end of the fermentation period the dough is divided into pieces of the correct weight, molded to the shape required and allowed to recover and ferment further in the pieces. This part of the process is known as the proof. The pieces are then passed into oven for baking. ٢٫٧٫١ Rheology of the bread making process: The bread making process is divided into its three main stages: mixing, fermentation and baking. Changes in the rheological properties of the dough in each of these stages are the consequences of changes in dough structure at both the molecular and microscopic levels (Bloksma ,١٩٩٠a). ٢٫٧٫١٫١ Mixing: Mixing transforms the combination of a powder – the flour – and a liquid – the water – into a cohesive visco – elastic dough. This dough is capable of retaining the carbon dioxide produced by the yeast during fermentation and the carbon dioxide, water and ethanol evaporating during oven rise. Gas retention is an essential property of dough for bread making. The transformation into a cohesive dough can be followed by observing change in the resistance to mixing or in the microscopic structure of the dough. For proper dough development, both mixing energy and mixing power must be above a critical level, for processing with short fermentation times, high level of both are required. ٢٫٧٫١٫٢ Fermentation: The objective of fermentation is to bring the dough to an optimum condition for baking. During fermentation the carbon dioxide produced by the yeast is collected in the gas cells which have been formed during mixing, and their volume increases. This expansion requires an excess pressure in the cells, estimated to be small compared to atmospheric pressure. A major part is thought to be due to the surface tension in the gas – dough, interface. The result of the expansion of the gas cells is a deformation of the dough phase, but there is little evidence that this contributes significantly to dough development. ٢٫٧٫١٫٣ Baking: When the fermentation process is finished the dough is baked in an oven. During the first stage of baking, the dough expands further, mainly as a result of evaporation of water, carbon dioxide, and ethanol from the dough phase. Gelatinization of starch markedly increases the viscosity at temperature above ٦٠°C, this causes a marked increase in the tensile stress in the dough membranes. During baking they rupture, and the foam is transformed into sponge. A possible explanation of the rupture is that the increase of the tensile stress in the membranes results in a value that exceeds the tensile strength of the liquid dough phase. ٢٫٧٫٢ Bread ingredients: Bread is made of the four essential ingredients, flour, water, yeast, and salt, to which others may be added depending on the type of bread desired. The optional ingredients used most frequently are sugar, milk, and shortening, all of which improve the quality of bread, in addition, small amount of dough conditioners are often used by bakers. ٢٫٧٫٢٫١ Flour: Flour is the major ingredient in bread formula. Wheat flour, and more specifically the protein of wheat flour, is unique in its ability to form dough that retains gas. This is a fundamental property required for the production of all leavened dough based products. American hard red winter and red spring wheat and Australian prime hard wheat with ١٢٫٥٪ protein content at least and ٦٢٫٦٥٪ water absorption is suitable for bread making (NCFM, ٢٠٠٣). ٢٫٧٫٢٫٢ Water: In the dough, water comes next in importance to the flour. It is responsible for the formation of the gluten which gives the dough its rheological characteristics. The amount of water used for making a sac of flour into dough varies and depends on the type of flour used and the type of bread being produced. In a dough the starch took up ٤٦٪ of the water, gluten ٣١٪, and pentosans ٢٣٪ (Bushuk, ١٩٦٦). ٢٫٧٫٢٫٣ Yeast: The baker’s yeast (Saccharomyces cervisia) is the best micro organism adapted for leavening of baker’s product (Banwart ,٢٠٠٢). It needs sugar for producing carbon dioxide and alcohol. If no sugar is available in the dough – no fermentation occurs inspite of an excess of yeast. ٢٫٧٫٢٫٤ Salt: Salt is added to every bread formula as a flavoring agent, and control the rate of fermentation. Its retarding effect on yeast activity can be demonstrated by using an excessive amount of salt. Roach (١٩٨٩) observed increasing mixing time with the addition of sodium chloride, this mean salt also strengthen the gluten. ٢٫٧٫٣ Bread improvers: Bread improvers encompass a large group of dough additives that serve to alter the handling properties of dough or the sensory properties of bread or both. Its designs are constantly changing to meet the rapid advance in food ingredient technology and demand for higher quality bakery products. There are many types of commercial bread improvers manufactured for a variety of applications, whether it is for pan bread, pizza bases, or fermented dough. Each bread improver type is specifically tailored to enable the desired characteristic of dough or bread type to be achieved. The usage of bread improver can vary widely, often reflecting the level quality or type of the improving ingredients that it contains. Bread improvers provided better gas retention, resulting in lower yeast requirements, shorter proof time and larger finished product volume. It also improved tolerance to variations in the quality of flour and other ingredients, and gave drier dough that can be mechanically processed more easily and have greater resistance to abuse. ٢٫٧٫٤ Bread quality: Bread quality is usually judged by: ٢٫٧٫٤٫١ Loaf volume: Soulaka and Morrison (١٩٨٥) reported that loaf volumes obtained from reconstituted flours were larger, and the crumbs softer, as the gelatinization temperature of the starch fraction increased. However, Hoseney, et al., (١٩٧١) did not find a relation between the gelatinization temperature of starches from various plants and their baking quality. Cauvain and Chamberlain (١٩٨٨) stated that, loaf volume increase is attributed to improved gas retention and to extending the period of dough expansion during the baking stage. Perten (١٩٩٥) stated that, quality factors such as loaf volume and water absorption are related to gluten quality and quantity. Higher gluten quantity values generally give a greater bread volume. Basically, strong flours must be used for making good bread. If weak flour is used, loaves of small volume are produced. Mohamed (٢٠٠٠) showed that the bread specific volume of Sudanese wheat cultivars Condor, Sasaraib, Debaira and Elneelian ranged between ٤٫٠٥ and ٣٫٦٦cm٣/g. However Elagib (٢٠٠٢) found that the bread specific volume of Sudanese wheat cultivars Debaira, WadiElneel, and Elneelian ranged between ٣٫٤٧, and ٢٫٩٥cm٣/g. ٢٫٧٫٤٫٢ Crumb texture: Dough is a complex system, and many problems associated with the poor textural quality of a final product can result from a deficiency in one or more of the following dough characteristics: gas generation, gas retention, and setting of the structure in the expanded state. The texture may be too soft, some times “gummy”. This retention of moisture in the crumb results from the production of too – many dextrins from the starch and the loss of gluten structure (Mathewson ,٢٠٠٠). Kaldy and Rubenthaler (١٩٨٧) reported that a fine uniform crumb texture that is tender and moist is one of the main criteria for good bread quality. Generally, flour with high protein content or strong gluten or both, produces a coarse and heavy crumb texture. ٢٫٧٫٤٫٣ Aroma: Aroma is an important factor governing food acceptability. The aroma of bread results from the interaction of reducing sugars and amino compound, accompanied by the formation of aldehydes. Also aroma is affected by the products of alcoholic and, in some cases, lactic acid fermentation (Kent ١٩٨٣, Lyla ٢٠٠٢). Matz (١٩٦٨) mentioned that, yeast consumes sugars and produces carbon dioxide and alcohol, the former reaction is responsible for rising the dough, while alcohol is partly responsible for the aroma of the baked product. ٢٫٧٫٤٫٤ Color: Golden brown color of the crust is one of the most obvious trait of a baked product. This color results from polymerization reactions known as Millard browning and Caramelization. Millard browning occurs when amine groups on amino acids combine with carbonyl groups of reducing sugar molecules. It is temperature and pH dependent, with higher pH increasing the reaction rate. The reaction continious, and colored pigments, known as melanoidins are eventually formed. Caramelization involves only the sugar in the system, and although it is fostered by condition of higher temperature and lower moisture than Millard browning, it likely contributes to the appearance as well. Mathewson (٢٠٠٠) reported that, amylases and proteases can contribute to Millard reaction which requires a reducing sugar and amino group, by making these compounds available. CHAPTER THREE MATERIALS AND METHODS ٣٫١ Materials: ٣٫١٫١ Samples of wheat: Three Sudanese wheat cultivars (Elneelian, Debaira, and Wadi Elneel) and one Canadian wheat cultivar were obtained from Hudieba Research Station and Wheata flour mill, respectively. The samples were cleaned and the physical characters such as, ١٠٠٠ kernel weight, hectoliter weight were determined, then wheat grains were milled in Quadrumat Junior Mill to white flour (٧٢٪ extraction rate), and prepared for chemical analysis and bread making. ٣٫١٫٢ Improvers: Three types of bread improvers: Z (consist of ascorbic acid, plant enzymes, guar, wheat flour), A (consist of ascorbic acid, alpha amylase, enzymes) and S (consist of ascorbic acid, alpha amylase, enzymes) were obtained from the local market and used according to the manufacturers recommendation . ٣٫١٫٣ Chemicals: All chemicals and reagents were of analytical grade. ٣٫٢ Proximate composition: The determination of moisture, crude fibre, crude fat, crude protein and ash were carried out on the samples according to AOAC (١٩٨٤) methods. ٣٫٢٫١ Moisture content: The main steps were as follows: - Two grams of well – mixed samples were weighed accurately in clean preheated moisture dish of known weight by using sensitive balance. - The un covered sample and dish were kept in an oven provided with a fan at ١٠٥°C and let to stay over night. - The dish was then covered and transferred to a desicator and weighed after reaching room temperature. - The dish was heated in the oven for another two hours and was re – weighed (this was repeated until constant weight was obtained). - The loss of weight was calculated as percent of sample weight and expressed as moisture content: Moisture content % = Wt١ – Wt٢ × ١٠٠ Sample weight Where: Wt١ = Weight of sample + dish before oven dry. Wt٢ = Weight of sample + dish after oven dry. ٣٫٢٫٢ Determination of ash: The steps were as follows: - A crucible was weighed empty, and then accurately two grams of sample were put in it. - The contents were ignited in a Muffle – Furnace at ٥٥٠°C for ٣ hours or more until white grey or reddish ash was obtained. - The crucible was removed from furnace and placed in a desicator to cool then was weighed. - The process was repeated until constant weight was obtained. - % Ash content was calculated using the following equation: Ash content % = Wt١ – Wt٢ Sample weight × ١٠٠ Where: Wt١ = Weight of crucible with ashed sample. Wt٢ = Weight of empty crucible. ٣٫٢٫٣ Determination of crude protein: The steps were as follows: - ٠٫٢ gram of samples, plus ٠٫٤ gram catalyst mixture (potassium sulfate + cupric sulfate ١٠:١ by wt), and ٣٫٥ ml of concentrated nitrogen free sulfuric acid, were mixed together in small Kjeldahl flask (١٠٠ ml). - The mixture was digested for two hours, then cooled, diluted, and placed in the distillation apparatus. - Fifteen ml of ٤٠% NaOH solution were added and mixture was heated and distilled until ٥٠ ml were collected in a ١٠٠ ml conical flask. - The ammonia evolved was received in ten ml of ٢٪ boric acid solution plus ٣-٤ drops of universal indicators (methyle red and bromo cresol green). - The trapped ammonia was titrated against (٠٫٠٢N) HCL. - The percentage (g/١٠٠) of protein was calculated by using an empirical factor (٥٫٧) to convert nitrogen into protein as follows: Nitrogen content % = TV × N × ١٤٫٠٠ × ١٠٠ ١٠٠٠ × wt. of sample Protein content % = (nitrogen content %) X ٥٫٧ Where: TV = Actual volume of HCL used for titration (ml HCL – ml blank). N = Normality of HCL. ١٤٫٠٠ = Each ml of HCL is equivalent to ١٤ mg nitrogen. ١٠٠٠ = To convert from mg to gm. ٥٫٧ = Constant factor for wheat flours and wheat products. ٣٫٢٫٤ Determination of fat: The main steps were as follows: - A dry empty extraction flask was weighed. - Two grams sample was weighed and placed in an empty thimble plugged with a piece of cotton wool. - The thimble was placed in soxhlet extractor. - Extraction was carried out for ٧ hours with petroleum spirit (٦٠-٨٠°C). - The apparatus was carefully dismantled and the solvent was evaporated to dryness in an air – oven. - The flask with extracted ether was cooled and weighed. - The total fat content was calculated as follows: Fat content % = Wt١ – Wt٢ Sample weight × ١٠٠ Where: Wt١ = Weight of flask + extracted fat. Wt٢ = Weight of empty flask. ٣٫٢٫٥ Determination of crude fibre: The steps were as follows: - Two grams of an air dried fat – free sample, were transferred to a dry ٦٠٠ ml beaker. - The sample was digested with ٢٠٠ ml of ١٫٢٥٪ (٠٫٢٦N) H٢SO٤ for ٣٠ minutes, and the beaker was periodically swirled. - The contents were removed and filtered through buchner funnel, and washed with boiling water. - The digestion was repeated using ٢٠٠ ml of ١٫٢٥٪ (٠٫٢٣N) NaOH for ٣٠ minutes, and treated similarly as above. - After the last washing the residue was transferred to ashing dish, and dried in an oven at ١٠٥°C over night then cooled and weighed. - The dried residue was ignited in a muffle furnace at ٥٥٠°C to constant weight, and allowed to cool, then – weighed. - The fibre percentage was calculated as follows: Crude fibre % = Wt١ – Wt٢ × ١٠٠ Sample weight Where: Wt١ = Weight of sample and crucible. Wt٢ = Weight of crucible with ashed sample. ٣٫٣ Gluten quantity and quality: Gluten quantity and quality, were carried on wheat flours with and without improvers according to standard ICC method (١٩٦٨) (revised ١٩٩٦) by using Glutomatic instrument (Type ٢٢٠٠). Ten grams of the sample was mixed into a dough with ٥ ml distilled water in a test chamber with bottom sieve. The dough was then washed with ٢٪ solution of sodium chloride. The gluten ball obtained was centrifuged by centrifuge (Type ٢٠١٥) and quickly weighed. The percentage of wet gluten remaining on the sieve after centrifugation is defined as the gluten index. The total wet gluten was dried in a heater (Glutork ٢٠٢٠) to give the dry gluten. The weight of gluten was multiplied by ten to give the percentage of wet or dry gluten. ٣٫٤ Falling number: Alpha – amylase activity was carried on wheat flours with and without improvers according to (Perten (١٩٩٦) - manual falling number (١٤٠٠)). Appropriate flour sample weight, was weighed and transferred into falling number tube and ٢٥±٠٫٢ ml distilled water were added, the stopper was fitted into the top of the viscometer, and shaked well (٢٠-٣٠ times or more if necessary), until a homogenous suspension was formed. The viscometer tube was placed in the boiling water – bath, and locked into position. The test automatically starts. The sample was stirred for ٦٠ seconds, and then the viscometer stirrer was stopped in up position, released and sinked under its own weight through the uniform gelatinized suspension. The time in seconds for the stirrer to fall through the suspension was recorded as the falling number (seconds), the required flour sample weight (R. W) is obtained from the correction tables of sample weight to ١٤٪ moisture basis (ICC ١٠٧/١, ١٩٩٥) and AACC ٥٦-٨١ B, (١٩٩٢), corresponding to ٧g at ١٤٪ moisture, no change is made in the quantity of the water used (٢٥ ml). Calculations: (R. W.) g = ٧ × (١٠٠ -١٤) (١٠٠ – m) Where: m = Actual moisture percentage of the flour sample. (R. W.) = The required flour sample weight used for determination. ٣٫٥ Sedimentation values: Sedimentation value was carried on wheat flours with and without improvers according to AACC (٢٠٠٠). Reagents: ١- Isopropyl alcohol, ٩٩-١٠٠٪, nitrate – free or equivalent. ٢- Water containing ٤ mg bromophenol blue ١ liter. ٣- Lactic acid stock solution, dilute ٢٥٠ U. S. pharmacopeia ٨٥٪, lactic acid ١ liter with water. Reflux diluted acid for ٦ hr without loss of volume. ٤- Mix thoroughly ١٨٠ ml lactic acid stock solution (reagent ٣), ٢٠٠ ml isopropyl alcohol (reagent ١), and water to make ١ liter. Let stand for ٤٨ hrs, before using protect against evaporation. Procedure: ٣٫٢ grams of sieved flour sample were placed in ١٠٠ ml glass stoppered graduated cylinder, simultaneously timing started when ٥٠ ml containing bromophenol blue was added, then flour and water were thoroughly mixed by moving stoppered cylinder horizontally length wise, alternately right and left, through space of ٧ In ١٢ times in each direction in ٥ sec, then flour was completely swept into suspension during mixing. At the end of first ٢ min period, the contents were mixed for ٣٠ sec, in this manner the cylinder was completely inverted then righted up, as if it were pivoted at centre, this action was performed smoothly ١٨ times in the ٣٠ sec. then was let to stand ١٫٥ min. After that ٢٥ ml of isopropyl alcohol lactic acid (reagent ٤) were added, mixed immediately by inverting cylinder four times as the latest step then was let to stand ١٫٧٥ min., mixed again for ١٥ sec, then the cylinder was immediately placed in up right position and let to stand for ٥min.The factor to obtain sedimentation value was brought from table on ١٤٪ moisture basis, (AACC, ٢٠٠٠). ٣٫٦ Pelshenke test: Pleshenke test was carried on wheat flours with and without improvers according to AACC (٢٠٠٠). ٤g of each sample were blended and weighed using quadruplicate one pair on each of two different days, the sample of two different days were put into ١٥٠ ml low form beaker. ٢٫٢٥ ml of yeast suspension were mixed with meal via stirring rod. The resulting mass was then transferred to palm of hand, kneaded, round meal ball, replaced in a beaker and covered with ٨٠ ml water (٣٠°C). The time of immersion was noticed and the beaker was transferred to a constant temperature cabinet, the time was noted when ball started to disintegrate as time in min. The yeast suspension was made up daily (in the two days) by suspending ١٠ g fresh compressed yeast in ١٠٠ ml water. ٣٫٧ Farinograph: Brabender farinograph method was carried on wheat flours with and without improvers according to AACC (٢٠٠٠) The titration curve: Brabender farinograph was operated as described in AACC method (٢٠٠٠). Titration curve was used for the assessment of the water – absorption for each flour sample. A sample of ٣٠٠ gram (١٤٪ moisture) was weighed and transferred into a cleaned mixer. The farinogragh was switched on ٦٣ rpm for one minute, then the distilled water was added from especial burette ( the correct water absorption can be calculated from the deviation, ٢٠ units deviation correspond to ٠٫٥٪ water, if the consistency, is higher than ٥٠٠ F. U. more water is needed and vice – versa). When the consistency is constant, the instrument was switched off and the water drawn from the burette indicates water absorption of the flour in percentage. The standard curve: The measuring mixer was thoroughly cleaned. A sample of ٣٠٠ g was weighed, then introduced into the mixer, the farinogragh was switched on such as before. The water quantity, which is determined by the titration curve, was fed at once. When an appreciable drop on the curve was noticed, the instrument was run further ١٢ minutes, then shut off. The significant readings taken from a farinogragh are: A. Water absorption: is the amount of water added to balance the curve on the ٥٠٠ – FU line, expressed as a percentage of the flour at ١٤٪ moisture. B. Dough development time (peak time): is the time in minutes between the origin of the curve and its maximum. C. Arrival time: is the time between the origin and the point where the curve first reaches the ٥٠٠ – FU line. D. Departure time: is the time between the origin and the point where the top of the curve falls below the ٥٠٠ FU line. E. Dough stability: is defined as the difference in minutes between the departure time and arrival time (D – C). F. Dough softening: is defined as the difference of the dough strength between the moment dough weakening begins and after ١٢ minutes dough kneading (measured in F. U.). G. Mixing tolerance index: is measured as the difference in F. U. between the top of the curve at the optimum and the point on the curve ٥ minutes later. ٣٫٨ Extensograph: Extensograph method was used according to ICC (٢٠٠١). The extensograph and farinograph were set and operated at ٣٠°c. The dough for extensograph was prepared as for the farinograph, but the amount of water used for mixing was ٢٪less due to the addition of ٢٪ salt and the dough was mixed for ٥ min. only. Two pieces of dough (١٥٠ g each) were weighed, molded on the balling unit, rolled with dough roller into cylindrical test pieces, fixed in the dough holder, and stored in the rest cabinet for ٤٥ min. The dough piece was placed on the balance arm of extensograph and stretched by stretching hook until it broke. During the period of stretching the behavior of the dough was recorded on a curve via extensograph. This test was performed at ٤٥, ٩٠, and ١٣٥min intervals Extensograph measurements: A- Energy: measure the area under the curve by means of a planimeter and indicate the value in cm ٢. this value describes the work applied for stretching the dough and is a measure for the flour quality. B- Resistance to extension: is the height of the extensogram at a constant deformation of the dough. The value is determined at the point where the paper has run ٥٠ mm from the beginning of stretching. The result is given in EU with a precision of ٥ EU. C- Extensibility: is the distance in mm traveled by the chart paper from the beginning of stretching until breaking of the test piece. D- Ratio: is the quotient of resistance and extensibility. Ratio = Resistance to extension Extensibility ٣٫٩ Preparation of bread samples: Two types of bread (loaf and flat) were made with and without improvers. ٣٫٩٫١ Loaf bread: The procedure described by Badi, et al., (١٩٧٨) was modified for this type of bread. Bread improvers A, S, and Z were added at ٠٫٠٢٥, ٠٫٠٥, ٠٫٠٦ g respectively according to manufacture recommend. Dry ingredients (flour ٢٥٠ g, dry yeast ٢٫٥ g, salt ١٫٥ g and sugar ٣ g) were mixed for ١ min. using Mono – Universal laboratory dough mixer. Water was added (based on the farinograph optimum absorption) and mixed for ٣ min at medium speed. After mixing the dough was allowed to rest for ١٠ min. at room temperature (٣٨±٢°C), scaled to three portions of ١٢٠ g each, molded into round balls and allowed to rest for another ١٠ min. then molded, put in pans and transferred into the fermentation cabinet for ٤٥ min. The fermented doughs were then baked in Simon Rotary baking oven at ٢٥٠°C for ١٥-٢٠ min. ٣٫٩٫١٫١ Physical characteristics of loaf bread: The loaves were left to cool for ١ hr at room temperature (٣٨±٢°C). ٣٫٩٫١٫١٫١ Bread weight: The weight of the loaf bread was taken in g. ٣٫٩٫١٫١٫٢ Bread volume: The loaf volume was determined by the seed displacement method according to Pyler (١٩٧٣). The loaf was placed in a container of known volume into which small seeds (millet seeds) were run until the container is full. The volume of seeds displaced by the loaf was considered as the loaf volume. ٣٫٩٫١٫١٫٣ Bread specific volume: The specific volume of the loaf was calculated according to the AACC method (٢٠٠٠) by dividing volume (CC) by weight (g). ٣٫٩٫١٫٢ Sensory evaluation of loaf bread: The loaves were sliced with an electric knife and prepared for sensory evaluation same day. The sensory evaluation of bread samples (aroma, taste, crumb texture, crumb color, crumb cell uniformity, general acceptability) was carried out by ١٠ panelists semi trained. The surrounding conditions were kept the same all through the panel test (see Appendix ٢). ٣٫٩٫٢ Flat bread: The procedure described by Qarooni et al (١٩٨٧, ١٩٩٣) was modified for this type of bread. Bread improvers A, S, and Z were added at ٠٫٠٢٥, ٠٫٠٥, ٠٫٠٦ g respectively. Dry ingredients (flour ٢٥٠ g, sugar ٢٫٥ g, salt ٢٫٥ g and dry yeast ٥ g), were mixed for ١ min. using Mono – Universal laboratory dough mixer. Water was added and mixed for ٦ min. at medium speed. The optimum amount of water was determined using the formula of Quarooni (١٩٨٩) and Qarooni et al., (١٩٩٣), with some modifications (baking absorption % = ٢٠ + ٠٫٥٩٦ × optimum water absorption from the farinograph). After one hour of bulk fermentation at ٣٠°C and ٨٥٪ humidity (rh) the dough was divided into pieces of ٦٠ g, rounded by hand, covered and allowed to relax for ١٥ min. in the fermentation cabinet. Dough pieces were flattened by hand and cross sheeted (٠٫٨ mm thickness). All sheeted doughs were put on a wooden board and transferred into the proofing cabinet for ٣٠ min. at ٣٠°C and ٨٥٪ rh. The proofed pieces were put on a pre – heated solid aluminum tray and baked at ٤٠٠°C for ٢ min, instead of ٤٢٥°C for ١٠٠ seconds Loaves were cooled for ١٥ min. and wrapped in plastic bags then kept at room temperature (٣٨±٢°C) for one hour. ٣٫٩٫٢٫١ Physical characteristics of flat bread: Flat bread was evaluated for thickness (cm). Diameter (cm).Three breads were used for the evaluation, the average was noted. ٣٫٩٫٢٫٢ Sensory evaluation of flat bread: The bread pieces were prepared for sensory evaluation same day. The sensory evaluation of bread samples (aroma, taste, crust color, general acceptability) was carried out by ١٠ panelists semi trained. The surrounding conditions were kept the same all through the panel test (see Appendix ٣). ٣٫١٠ Statistical analysis: The analysis of variance was performed to examine the significant effect in all parameters measured. Duncan Multiple Range Test was used to separate the means. CHAPTER FOUR RESULTS AND DISCUSSION ٤٫١ Chemical composition: The chemical composition of the three local commercial wheat cultivars (season ٢٠٠٣/٢٠٠٤) and Canadian wheat is shown in Table (١) and (٢). ٤٫١٫١ Moisture content: The moisture content of the whole wheat flour (١٠٠٪ extraction rate) of the three local wheat cultivars ranged from ٦٫٣٧ to ٧٫٠٢٪. Analysis of variance showed significant differences (P≤٠٫٠٥) among the three Sudanese cultivars in their moisture content. Elneelain showed the highest value, while Debaira gained the lowest value. The results obtained here were in agreement with values obtained by Ahmed (١٩٩٥) who reported that, the moisture content of Sudanese wheat cultivars ranged from ٦٫٣٣ to ٨٫٦٪. The lower moisture content values may be due to the dry season in which wheat cultivars were grown. ٤٫١٫٢ Ash content: Ash content of the whole wheat flours is shown in Table (١), whereas Table (٢) shows the ash content of white wheat flour of the four cultivars. Ash content of whole and white flours of the local wheat cultivars ranged from ١٫٦٣ to ١٫٥١٪ and ٠٫٥٥ to ٠٫٤١٪ respectively. These results were in agreement with the data reported by Zeleny (١٩٧١) who found that,the ash content of the whole wheat flour was in the range of ١٫٤ to ٢٫٠٪. Table (١): Chemical composition of the whole flours of the three local wheat cultivars (harvested season ٢٠٠٣/٢٠٠٤). Moisture (%) ٦٫٣٧c Protein (%) (N × ٦٫٢٥) ١٦٫١٠a Ash (%) ١٫٦٣a Fat Fibre (%) (%) a ١٫٧٥ ١٫٧٤ a Wadi Elneel ٦٫٧٦b ١٣٫٦٣b ١٫٥٦b ١٫٧٨a ١٫٨٦a Elneelain ٧٫٠٢a ١٢٫٦٠c ١٫٥١ b ١٫٥٥b ١٫٨٣a Cultivar Debaira Mean values having different superscript letter in each column differ significantly at(P≤٠٫٠٥) using Duncan's Multiple Range Test(DMRT). Table (٢): Chemical composition of the flours of the three local wheat cultivars (harvested season ٢٠٠٣/٢٠٠٤) and Canadian wheat flour (٧٢٪ extraction rate). Cultivar Moisture (%) ١٠٫٤٠c Protein (%) (N× ٦٫٢٥) ١٤٫٣٦a Ash (%) ٠٫٣٥ c Fat (%) ١٫٠١ c Fibre (%) ١٫١٢a Debaira ١٢٫٠٧a ١٣٫٥٧b ٠٫٥٥ a ١٫٢٢a ١٫٠٨ a Wadi Elneel ١١٫٥٠b ١١٫٩٧c ٠٫٤١ b ١٫١٣b ١٫١٥ a Elneelain ١٢٫٠٠a ١٠٫٧٧d ٠٫٥٠a ١٫٠٤ c ١٫٠٦ a Canadian Mean values having different superscript letter in each column differ significantly at(P≤٠٫٠٥) using Duncan's Multiple Range Test(DMRT). The ash content of Debaira, Wadi Elneel and Elneelain was higher than those reported by Elagib (٢٠٠٢) who found that, ash content for the same cultivars as ١٫٤٥, ١٫٤٠ and ١٫٠ respectively. This difference could be due to seasonal variation. Statistical analysis of the results showed significant difference (P≤٠٫٠٥) among flours (١٠٠٪ extraction rate) and wheat flours (٧٢٪ extraction rate) in their ash content of the three local cultivars. ٤٫١٫٣ Protein content: Protein content of the whole flours is presented in Table (١), while Table (٢) shows the protein content of white flour of the four cultivars. Protein contents of the whole flours and white flours of the three local wheat ranged from ١٢٫٦ to ١٦٫١٪ and ١٠٫٧٧ to ١٣٫٥٧٪ respectively. These results are comparable with the data reported by Mohamed, (٢٠٠٠) who reported, that protein content of white flour of different Sudanese cultivars ranged between ١١٫٧٩ and ١٣٫٨٥, but, it showed high variation from that reported by Elagib (٢٠٠٢) who found that the protein content of whole flour of different Sudanese cultivars ranged between ٩٫٣٧ and ١١٫١٧٪. This may be due to variations in the growing conditions. Analysis of variance showed significant differences, (P≤٠٫٠٥) among the whole and white flours of the three local cultivars in their protein content. ٤٫١٫٤ Fat content: Fat content of the whole wheat flour is illustrated in Table (١), while Table (٢) shows the fat content of white flour, of the four cultivars. Fat contents of the whole and white flours of the local cultivars ranged from ١٫٥٥ to ١٫٧٨٪ and ١٫٠٤ to ١٫٢٢٪ respectively. These values agreed with the results reported by Ahmed (١٩٩٥) who found that fat content of white flour of the Sudanese wheat cultivars ranges between ٠٫٨٥ and ١٫٧٣٪. But, it showed some variation from that reported by Elagib (٢٠٠٢) who stated that, fat content of Debaira and Elneelain cultivars was ٢٫٠ and ١٫٨٪ respectively. Analysis of variance showed significant differences (P≤٠٫٠٥) among the whole and white flours of the local cultivars in their fat content. ٤٫١٫٥ Fibre Content: Fibre values of the whole flours are presented in Table (١), whereas Table (٢) shows the fibre values of white flour of the four cultivars. Fibre contents of the whole and white flours of the local cultivars ranged from ١٫٧٤ to ١٫٨٦٪ and ١٫٠٦ to ١٫١٥ respectively. These results are comparable with those reported by Ahmed (١٩٩٥) and Mohamed (٢٠٠٠) who found that the fibre contents for whole wheat flours were in the range of ١٫٧٥ to ٢٫٣٤٪ and ١٫٨٥ and ٢٫٢٥٪ respectively. Statistical analysis of results showed insignificant differences (P>٠٫٠٥) among the whole and white flours of the local cultivars in their fibre content. ٤٫٢ Physical criteria of wheat quality assessment: ٤٫٢٫١ Kernel weight: Weight per ١٠٠٠ kernels of the three Sudanese cultivars is shown in Table (٣). Thousand kernel weight of the three local wheat cultivars ranged from ٤١٫٢٤ to ٣٤٫١٢g, Wadi Elneel cultivar gave the highest value, with no significant difference (P>٠٫٠٥) compared with Elneelain, while Debaira cultivar gave the lowest value, with significant difference. These results are confirmed by data reported by Ahmed (١٩٩٥) who found that, the weight of ١٠٠٠ kernels of different Sudanese cultivars ranged between ٢٨ and ٤٤g. ٤٫٢٫٢ Test weight: Hectoliter weight of three Sudanese wheat cultivars is shown in Table (٣). The value of the local wheats was found to be in the range of ٨٣٫٨ to ٨٢٫١kg\ hectoliter. The highest value was gained by Wadi Elneel cultivar, whereas Debaira gained the lowest. These results are comparable with that reported by Mustafa(١٩٩٣) who stated that, Hectoliter weight of Canadian red spring wheat cultivars ranged between ٧٤٫٥ and ٨٠٫٧kg\ hectoliter. Statistical analysis of the results, showed significant differences, (P≤٠٫٠٥) among the three cultivars in their Hectoliter weight. Table (٣): Hectolitre and thousand kernels weight of the three local wheat cultivars (harvested season ٢٠٠٣/٢٠٠٤): Hectolitre weight (kg\ hectoliter ) ٨٢٫١c Thousand kernels weight (g) ٣٤٫١٢b Wadi Elneel ٨٣٫٨a ٤١٫٢٤a Elneelain ٨٣٫٠b ٤١٫٢٠a Cultivar Debaira Mean values having different superscript letter in each column differ significantly at(P≤٠٫٠٥) using Duncan's Multiple Range Test(DMRT). ٤٫٣. Gluten quantity and quality: Gluten values (wet, dry and gluten index) of the three Sudanese cultivars and Canadian wheat flours with and without improvers were shown in Table (٤) and Fig. (١) to (٣). Wet gluten contents ranged from ٤٠٫٠ to ٢٤٫٦٪. The Canadian wheat flour with A improver gave the highest value, whereas the lowest value was observed in Elneelain with A improver. Dry gluten values ranged from ١٤٫٠ to ٧٫٩٧٪. The Canadian wheat without improvers gained the highest values, while Elneelain with A improver gained the lowest value. Gluten index values were found to be in the range of ٩٣٫٣٤ to ٦٤٫٥٣٪, the Canadian wheat flour without improvers gained the highest value, whereas the lowest value was gained by Elneelain without improvers. Generally analysis of variance showed significant differences (P≤٠٫٠٥), among the four cultivars with and without improvers in their wet, dry and gluten index values. Debaira gained the higher values of Sudanese cultivars followed by Wadi Elneel and then Elneelain, this is due to the difference in their protein content and quality. Table (٤): Gluten quantity and quality, falling number, pelshenke test and sedimentation value of the three Sudanese wheat cultivars and Canadian wheat flours with and without improvers: Cultivar Canadian Debaira Wadi Elneel Elneelain Improver Control Z A S Control Z A S Control Z A S Control Z A S Gluten quantity and quality wet gluten Dry gluten Gluten index % % % ab a ٣٩٫١٠ ١٤٫٠٠ ٩٣٫٣٤a ٣٩٫٧٥ab ١٣٫٦٥b ٨٧٫٩٣bc a ab ٤٠٫٠٠ ١٣٫٩٠ ٨٤٫١٣cdef ٣٩٫٦٠ab ١٣٫٧٠b ٩١٫١٧ab c c ٣٧٫٦٠ ١٢٫٧٥ ٨٦٫٧١cd ab c ٣٩٫١٠ ١٢٫٨٠ ٨٢٫٦٥ef ٣٨٫٨٥b ١٢٫٦٥c ٨٣٫١٤def ab c ٣٩٫٠٥ ١٢٫٧٥ ٨٦٫٤٢cde d e ٣١٫٠٥ ١٠٫٢٠ ٨١٫٨٠f ٣١٫٠٠d ١٠٫٣٠e ٨٢٫٢٧f d e ٣٠٫٨٠ ١٠٫٣٥ ٨١٫٩٩f d d ٣١٫٣٥ ١١٫٣٥ ٨٣٫٢٦def ٢٨٫٠٥e ٨٫٩٠f ٦٤٫٥٣i f g ٢٦٫٧٠ ٨٫٦٠ ٧١٫٥١h ٢٤٫٦٠g ٧٫٩٧h ٧٠٫٩٥h e g ٨٫٣٩ ٧٨٫٠٥g ٢٨٫٥٠ Falling No. (sec.) Pelshenke test (min.) Sedimentation value (cm٣) ٦٠٢٫٧c ٥٤٦٫٧e ٥٢٥٫٠f ٤٦٧٫٣i ٦٧٦٫٠a ٦٤٧٫٣b ٥١٧٫٠fg ٤٦٦٫٧i ٥٩٥٫٠c ٥٨٣٫٠d ٥١٣٫٧g ٤١٢٫٠j ٤٨٦٫٣h ٤٨٥٫٣h ٤٠٥٫٣j ٣٩٦٫٣k ٩٢٫١٠c ٩٧٫٠٠b ٩٨٫١٧b ١٠٣٫٤a ٤٩٫٢٣h ٥٧٫١٣f ٦٥٫٣٣e ٦٩٫٢٣d ٤٠٫٦٣i ٤٩٫٩٣h ٥٢٫٩٧g ٥٦٫٢٣f ٢٨٫٨٣l ٢٩٫٥٠l ٣١٫٥٠k ٣٤٫٥٧j ٣٧٫٤٠a ٣٧٫٤٠a ٣٧٫٤٠a ٣٧٫٤٠a ٣٢٫٣٠b ٣٢٫٣٠b ٣٢٫٣٠b ٣٢٫٣٠b ٢٧٫٩٠c ٢٧٫٩٠c ٢٧٫٩٠c ٢٧٫٩٠c ١٩٫٦٠d ١٩٫٦٠d ١٩٫٦٠d ١٩٫٦٠d Mean values having different superscript letter in each column differ significantly at (P≤٠٫٠٥) using Duncan's Multiple Range Test (DMRT). Fig (1): Effect of improvers on wet gluten of three local and Canadian wheat flours 40 35 30 25 20 15 10 5 Canadian Debaira Wadi Elneel Cultivar Elneelain S A Z Control S A Z Control S A Z Control S A Z 0 Control Wet gluten values (g) 45 Fig (2): Effect of improvers on dry gluten of three local and Canadian wheat flours 14 12 10 8 6 4 2 Canadian Debaira Wadi Elneel Cultivar Elneelain S A Z Control S A Z Control S A Z Control S A Z 0 Control Dry gluten values (g) 16 Fig (3): Effect of improvers on gluten index of three local and Canadian wheat flours 90 80 70 60 50 40 30 20 10 Canadian Debaira Wadi Elneel Elneelain S A Z Control S A Z Control S A Z Control S A Z 0 Control Gluten index values (%) 100 ٤٫٤ Falling number (seconds): The falling number of the three Sudanese cultivars and Canadian wheat flours with and without improvers was shown in Table (٤) and Fig. (٤). Alpha – amylase activity of the cultivars with and without improvers is found to be in the range of ٦٧٦ to ٣٩٦ seconds. Debaira without improvers gained the highest value (low alpha-amylase activity), whereas Elneelain with S improver gained the lowest value (high alpha – amylase activity). Statistical analysis revealed highly significant differences (P≤٠٫٠٥) among the four cultivars with and without improvers, in their falling number values. From these results it could be observed that the values of falling number of the four cultivars without improvers, were relatively high (low alpha – amylase activity), and this may be attributed to dry harvest time. It was also observed that the addition of improvers increase the alpha-amylase activity, perhaps these improvers contain alpha – amylase enzyme. Generally, Debaira cultivar showed the highest values of falling number (low alpha – amylase activity) among the four cultivars. S improver gave the best result (high alpha – amylase activity) compared with the other two improvers. Fig. (٤) Effect of improvers on falling number of three Fig (4): TheSudanese effect of three Sudanese wheat cultivars and Canadian and Canadian flours wheat flour with and without improvers on falling number 700 600 500 400 300 200 100 Canadian Debaira Wadi Elneel Elneelain S A Z Control S A Z Control S A Z Control S A Z 0 Control Falling number values (sec) 800 ٤٫٥ Sedimentation value (cm٣): Sedimentation values of the three Sudanese cultivars and Canadian wheat flour with and without improvers were shown in Table (٤) and Fig. (٥). Sedimentation values of the four cultivars with and without improvers ranged from ٣٧٫٤ to ١٩٫٦ (cm٣). Canadian wheat without improvers gave the highest value, while Elneelain without improvers gave the lowest value. The present result indicated that the sedimentation values among the four cultivars were not affected by the addition of improvers. Generally, Debaira revealed the highest values of sedimentation compared with Wadi Elneel and Elneelain cultivars. These results showed variation from those reported by Elagib (٢٠٠٢) who found that sedimentation values for the same local cultivars ranged from ١٣٫٦٧ to ١٩٫٠٧ cm٣, this may be due to the variation in the seasons. ٤٫٦ Pelshenke test: The Pelshenke test of the three Sudanese cultivars and Canadian wheat flours with and without improvers was shown in Table (٤) and Fig. (٦). The values of Pelshenke test of the four cultivars with and without improvers ranged from ١٠٣٫٤ to ٢٨٫٨ min. The Canadian wheat with S improver gained the highest value, whereas, Elneelain without improvers gained the lowest value. Fig. (٥) Effect of improvers on sedimentation value of three Fig (5): The effect of three Sudanese cultivars and Canadian wheat Sudanese and Canadian wheat flours flour with and without improvers on sedimentation value 35 30 25 20 15 10 5 Canadian Debaira Wadi Elneel Elneelain S A Z Control S A Z Control S A Z Control S A Z 0 Control Sedimentation value (cm٣) 40 Fig. (6) Effect of improvers on Pelshenke test of three Sudanese and Canadian wheat flours 120 80 60 40 20 Canadian Debaira Wadi Elneel Elneelain S A Z Control S A Z Control S A Z Control S A Z 0 Control Pelnshenke test value (min) 100 Analysis of variance showed significant difference (P≤٠٫٠٥) among the four cultivars with and without improvers in their pelshenke test values. From these results it could be observed that the values of pelshenke test of the four cultivars indicated the positive effect of adding improvers. S improver gave the best result compared with the other two improvers.Debaira gained the highest value among the Sudanese cultivars studied. ٤٫٧ Farinogram results: The farinogram results of the flours of the three Sudanese cultivars and Canadian wheat with and without improvers are shown in Table (٥) and Figs. (٧) to (٢٢). Water – absorption values of the cultivars with and without improvers ranged from ٦٦٫٠to٥٩٫٧٪.The highest value was observed in Debaira without improvers, while the Canadian wheat with S improver gained the lowest value. From the results it is clear that addition of improver to the cultivars exhibited decrease in water absorption compared with the same cultivars without improvers, comparing the Canadian to Sudanese wheat flours (control) the water absorption for Canadian wheat flour is lower than Sudanese wheat flours, this may be due to the difference in milling system between Sudanese and Canadian wheat flours. Dough development time was found to be in the range of ٧٫٨ to ١٫٥ min. The Canadian wheat without improvers gave the highest value, while Elneelain with A improver gained the lowest value. From the present results it is clear that the dough development time was decreased in the flour without improvers with low protein content, these results were in general agreement with the findings of Anaka and Tipples (١٩٧٩) who reported that, dough development time decreases in the flour with low protein content. The dough stability values ranged from ١٧٫٨ to ١٫١ min. The highest value was observed in the Canadian wheat with Z improver, whereas the lowest value was observed in Elneelain with A improver. The degree of softening values was found to be in the range of ٢٠٥ to ٢٣ F.U. Elneelain with A improver gave the highest degree, whereas the Canadian wheat with Z improver gave the lowest degree. Table (٥): Effect of bread improvers on farinogram readings of the three Sudanese wheat cultivars and Canadian wheat flours. Cultivar Water Dough Dough Degree of absorption Stability development softening corrected to١٤٪ (min) time (min) (I.CC), FU Control ٦١٫٣ ١٧٫١ ٧٫٨ ٣٨ Z ٦٠٫٥ ١٧٫٨ ٢٫٥ ٢٣ A ٦٠٫٠ ١٤٫٤ ٣٫٧ ٣٥ S ٥٩٫٧ ١٤٫٨ ٣٫٠ ٣٤ Control ٦٦٫٠ ٢٫٧ ٤٫٥ ٩٥ Z ٦٥٫١ ٤٫٠ ٤٫٨ ١٢٠ A ٦٣٫٥ ٤٫١ ٣٫٨ ١٢٨ S ٦٢٫٧ ٤٫٤ ٣٫٢ ١٢٦ Control ٦٤٫٤ ٣٫٢ ٤٫٠ ٨٥ Wadi Z ٦٣٫٤ ٤٫٣ ٤٫٣ ١٠٦ Elneel A ٦٢٫٥ ٣٫٦ ٢٫٠ ١٤٧ S ٦٢٫١ ٢٫٨ ١٫٧ ١٦٠ Control ٦٣٫٩ ٢٫٦ ٣٫٠ ١٠٦ Z ٦٣٫٣ ٢٫٢ ١٫٧ ١٥٥ A ٦٢٫٧ ١٫١ ١٫٥ ٢٠٥ S ٦١٫٦ ١٫٢ ١٫٧ ١٩٢ Improver Canadian Debiara Elneelain Mean values having different superscript letter in each column differ significantly at(P≤٠٫٠٥) using Duncan's Multiple Range Test(DMRT). ٤٫٨ Extensogram results: The extensogram results of the flours of the three Sudanese cultivars and Canadian wheat with and without improvers are showed in Table (٦) and Figs. (٢٣) to (٣٨). Flour cultivars with improvers exhibited an increase in the energy and resistance at ٤٥ min, ٩٠ min, ١٣٥ min, compared to the cultivars without improvers. From the present results, using S improver with the four cultivars flours showed higher values of energy at ٤٥ min, ٩٠min, ١٣٥ min compared with cultivars without improvers and with the other two improvers. The results also showed that as the fermentation time increased the resistance values of the four cultivars with and without improvers increased. Generally, the addition of improvers to the four cultivars flours showed decrease in extensibility at ٤٥ min, ٩٠min, ١٣٥ min compared with cultivars without improvers. While the addition of improvers to the same cultivars flours revealed an increase in resistance/ extensibility ratio compared to the cultivars without improvers. Perhaps these improvers contain oxidizing agents causing more s – s groups in the dough resulting in high resistance to extension. ٧٨ Table (٦): Effect of bread improvers on Extensogram readings of the three Sudanese wheat cultivars and Canadian wheat flours: Energy (cm)٢ Cultivar Improver b c Control ١٥٣ ١٣٩ ١٧٦ ١٨٧ Z Canadian ١٨١ ١٨١ A ٢٠٧ ١٧٧ S Control ٦٨ ٧٣ ١١٥ ١١٣ Z Debiara ١٠٣ ١٠٧ A ١٤٥ ١٦٧ S Control ٤٨ ٤٩ ٦٤ ٧٦ Z Wadi Elneel ٦٦ ٧٢ A ٦٩ ٧٩ S Control ٢٧ ٣١ ٤٣ ٣٩ Z Elneelain ٤٤ ٤٧ A ٤٧ ٤١ S Mean values having different superscript letter (DMRT). Resistance (cm) Extensibility (mm) R/E d b c d b c d b c d ١٥١ ٢٥٢ ٢٧٧ ٢٩٠ ٢٣٥ ٢٠٧ ٢٠٩ ٢٫١ ٢٫٥ ٢٫٧ ١٨٦ ٣٩٠ ٦٦٦ ٨١٣ ١٨٩ ١٤٥ ١٣٨ ٤٫٠ ٧٫٠ ٧٫٤ ١٦٥ ٣٦٦ ٥٤٧ ٥٩٤ ١٩٩ ١٦٤ ١٤٦ ٣٫٦ ٥٫٣ ٦٫٤ ١٨٥ ٤٠١ ٦٠٠ ٦٦٤ ٢٠٢ ١٤٨ ١٥٢ ٤٫٠ ٦٫٧ ٦٫٦ ٧٢ ١٩١ ١٩١ ١٨٨ ١٨٣ ١٩٤ ١٩١ ١٫٤ ١٫٤ ١٫٤ ١٢٩ ٢٩٠ ٣٤٢ ٤٢٦ ١٨٧ ١٦٢ ١٥٤ ٢٫٥ ٣٫٣ ٤٫٢ ١٢٢ ٢٥٧ ٢٩٤ ٣١٤ ١٨٣ ١٧٠ ١٨٠ ٢٫٣ ٢٫٩ ٣٫٠ ١٦٢ ٣٠٦ ٤١٣ ٤٤٤ ١٩٨ ١٨١ ١٧٠ ٢٫٩ ٤٫١ ٤٫٥ ٥١ ٢٠٨ ٢١٠ ٢٢٧ ١٣٧ ١٣٩ ١٣٧ ١٫٧ ١٫٧ ١٫٩ ٧٤ ٢٧٩ ٣٩٥ ٥٠٦ ١٣١ ١١٩ ١٠٢ ٢٫٧ ٤٫٠ ٥٫٦ ٧٤ ٢٥٨ ٣٠٨ ٣٥٠ ١٤٠ ١٣٢ ١٢٤ ٢٫٤ ٣٫٢ ٣٫٨ ٧٥ ٢٥٦ ٣٢٥ ٣٩٦ ١٤٦ ١٣٦ ١١٨ ٢٫٥ ٣٫٣ ٤٫٢ ٣٢ ١٤٠ ١٥٢ ١٦٢ ١٢٠ ١٢٩ ١٢٦ ١٫٢ ١٫٢ ١٫٤ ٣٦ ٢٤٦ ٣٦٣ ٤١٠ ١١٠ ٨١ ٧١ ٢٫٥ ٤٫٦ ٥٫٨ ٣٩ ٢٠٠ ٣٢٩ ٣٣٠ ١٢٨ ١٠٢ ٩١ ٢٫٠ ٣٫٦ ٣٫٨ ٤٢ ٢٣٠ ٣٢٦ ٣٧٨ ١٢٣ ٩٣ ٨٨ ٢٫٣ ٣٫٨ ٤٫٥ in each column differ significantly at(P≤٠٫٠٥)using Duncan's Multiple Range Test b: after ٤٥ min, c: after ٩٠ min, d: after ١٣٥ min,R/E: resistance/ extensibility. ٤٫٩ Baking test: Baking characteristics of the three Sudanese cultivars and Canadian wheat flours with and without improvers were shown in Tables (٧) to (١٠), Figs. (٣٩) to (٥١) and in plates (١) to (٨). ٤٫٩٫١ Physical characteristics of loaf and flat bread: ٤٫٩٫١٫١ Loaf bread specific volume: Bread specific volume of the three Sudanese cultivars and Canadian wheat flours with and without improvers was shown in Table (٧) and Fig. (٣٩). ٣ F Specific volume (cm /g) values of the flours breads with and without improvers ranged from ٤٫١١٣ to ٢٫٥٦٣ cm٣/g. The Canadian wheat with S improver gave the highest value, whereas Elneelain loaf volume and pelshenke test value indicates that the increase of pelshenke test value (min) correlates positively with the bread volume. Generally Debaira gained the higher values of specific volume compared with the other two Sudanese cultivars. S improver gave the best result followed by A and then Z improver. From the present results, it is clear that the specific volume of the loaf bread was affected by the addition of improvers and by wheat quality, as indicated by the amount of protein content, gluten quantity and quality, Sedimentation value and pelshenke test value. These results are supported by results of Elagib (٢٠٠٢). F F Table (٧): Physical characteristics of loaf breads made from the three Sudanese wheat cultivars and Canadian wheat flours with and without improvers. Cultivar Improver Loaf Weight(g) Loaf Loaf Specific Volume(cm٣) volume(cm٣/g ) Control ١١١٫٤ ٣٨٣٫٣ ٣٫٤٤٣c Z ١١١٫٣ ٤١٦٫٧ ٣٫٧٤٣b A ١١١٫٧ ٤٢٣٫٣ ٣٫٧٨٧b S ١١١٫٢ ٤٥٦٫٧ ٤٫١١٣a Control ١٠٥٫٣ ٣٣٦٫٧ ٣٫٠٦٧g Z ١١١٫٥ ٣٤٣٫٣ ٣٫٠٨٠g A ١١٢٫٠ ٣٤٣٫٣ ٣٫٢٠٧ef S ١١١٫٣ ٣٧٣٫٣ ٣٫٣٥٧d Control ١٠٥٫٨ ٢٨٠٫٠ ٢٫٦٤٧h Wadi Z ١٠٨٫٧ ٣٢٨٫٣ ٣٫٠٢٠g Elneel A ١١١٫٨ ٣٤١٫٧ ٣٫٠٦٣g S ١١١٫١ ٣٦١٫٧ ٣٫٢٥٧e Control ١٠٦٫٠ ٢٧١٫٧ ٢٫٥٦٣i Z ١٠٧٫٧ ٣٢٨٫٣ ٣٫٠٤٧g A ١١٠٫٥ ٣٣٦٫٧ ٣٫٠٥٧g S ١١٠٫٢ ٣٤٨٫٣ ٣٫١٦٣f Canadian Debiara Elneelain Mean values having different superscript letter in each column differ significantly at(P≤٠٫٠٥) using Duncan's Multiple Range Test(DMRT). Fig Effect (39): The effect of three Sudanese cultivars and Canadian Fig (٣٩) of improvers on specific volume of loaf bread made from wheat flour with and without improvers on loaf specific volume flour of Sudanese and Canadian wheat cultivars 4.5 3.5 3 2.5 2 1.5 1 0.5 Canadian Debaira Wadi Elneel Elneelain S A Z Control S A Z Control S A Z Control S A Z 0 Control Loaf breed specific volume (cm3 /gm) 4 ٤٫٩٫١٫٢ Flat bread diameter: Flat bread diameter of the three Sudanese cultivars and Canadian wheat flour with and without improvers was shown in Table (٨) and Fig. (٤٠). Diameter (cm) values of the four flours bread with and without improvers ranged from ١٤٫٨٠ to ١٢٫٧٧ cm. The Canadian wheat with A improvers gave a higher value, with no significant difference (P>٠٫٠٥) compared with Elneelain with A improver.While Debaira with S improver gave a lower value, with no significant difference compared with Wadi Elneel with S improver. Generally, Elneelain gained the higher values of diameter compared with the other two Sudanese cultivars. Treatment with A improver gave the best results compared with the other two improvers. ٤٫٩٫١٫٣ Flat bread thickness: Thickness of the bread of the three Sudanese cultivars and Canadian wheat flour with and without improvers was shown in Table (٨) and Fig. (٤١). Thickness (cm) values of the four flours bread with and without improvers ranged from ١٫٦١٣ to ٠٫٤٢٣٣ cm. Debaira with S improver gave the highest value. Whereas Elneelain without improvers gave the lowest value. Generally, Debaira gained the higher values of thickness compared with the other two Sudanese cultivars. Treatment with S improver gave the highest value compared with the other two improvers. Table (٨): Physical characteristics of flat breads made from the three Sudanese wheat cultivars and Canadian wheat flours with and without improvers. Cultivar Canadian Debiara Wadi Elneel Elneelain Improver Diameter Thickness (cm) (cm) Control ١٤٫٢٧b ٠٫٩٤٠٠bc Z ١٤٫٢١bc ١٫٠١٧bc A ١٤٫٨٠a ٠٫٦١٣٣fg S ١٣٫٨٩de ١٫٠٧٠b Control ١٣٫٢٧f ٠٫٧٨٠٠de Z ١٣٫٦٨e ١٫٠٦٧b A ١٣٫٩٣d ٠٫٩٣٣٣c S ١٢٫٧٧g ١٫٦١٣a Control ١٤٫٢١bc ٠٫٦٧٠٠ef Z ١٣٫٧٨de ٠٫٦٤٣٣f A ١٣٫٨٦de ٠٫٧٨٦٧de S ١٢٫٨٣g ٠٫٩٩٠٠bc Control ١٤٫٠٠cd ٠٫٤٢٣٣h Z ١٤٫٢٣b ٠٫٦٧٣٣ef A ١٤٫٦٧a ٠٫٥٠٠٠gh S ١٣٫١٣f ٠٫٨٩٠٠cd Mean values having different superscript letter in each column differ significantly at(P≤٠٫٠٥) using Duncan's Multiple Range Test(DMRT). Fig Effect of improvers on diameter of flat bread made from Fig(٤٠) (40): The effect of three Sudanese cultivars and Canadian wheat flour and withoutand improvers on flat breed diameter flourwith of Sudanese Canadian wheat cultivars 15 14 13.5 13 12.5 12 Canadian Debaira Wadi Elneel Elneelain S A Z Control S A Z Control S A Z Control S A Z 11.5 Control Flat breed diameter (cm ) 14.5 Fig (٤١) Effect of improvers on thickness of flat bread made from flour of Fig (41): The effect of three Sudanese cultivars and Canadian Sudanese and Canadian wheat cultivars wheat flour with and without improvers on flat breed thickness 1.8 1.6 1.2 1 0.8 0.6 0.4 0.2 Canadian Debaira Wadi Elneel Elneelain S A Z Control S A Z Control S A Z Control S A Z 0 Control Flat breed thickness (cm) 1.4 ٤٫٩٫٢ Sensory evaluation of loaf bread: ٤٫٩٫٢٫١ Aroma: The scores of aroma of loaf bread made from three Sudanese cultivars, and Canadian wheat flour with and without improvers are showed in Table (٩) and Fig. (٤٢). The aroma of bread scores ranged from ٨٫١ to ٤٫٢. The aroma score of breads made from the Canadian wheat without improvers gave a higher value, with no significant difference (P>٠٫٠٥) compared with bread made from the same cultivar with the three improvers. While the bread made from Elneelain without improvers gained lower value. The present results showed that Debaira cultivar gained higher scores of aroma among the local cultivars. Treatment with A improver gave the best result of aroma among the three improvers. ٤٫٩٫٢٫٢ Taste: The scores of taste of loaf bread made from the three Sudanese cultivars and Canadian wheat flours with and without improvers are shown in Table (٩) and Fig. (٤٣). The taste scores of the bread are found to be in the range of ٨٫٢ to ٤٫٢. The taste score of the bread made from the Canadian wheat with A improver gave the highest value, with no significant difference (P>٠٫٠٥) compared with the breads made from the same cultivar with the other two improvers and without improvers, and with breads made from Debaira cultivar with A and S improver and without improvers. Whereas the bread made from Elneelain without improvers gained the lowest value . Table (٩): Sensory evaluation of loaf bread made from the three Sudanese cultivars and Canadian wheat flours with and with out improvers Cultivar Improver Aroma Taste Control Canadian Debaira Wadi Elneel Elneelain Z A S Control Z A S Control Z A S Control Z A S ٨٫١a ٧٫٩ab ٨٫١a ٧٫٣abc ٧٫٠cd ٧٫٠cd ٧٫١cd ٦٫٨cd ٥٫٣fg ٥٫٣fg ٦٫٩cd ٦٫٢de ٤٫٢h ٤٫٥gh ٥٫٩ef ٥٫٣fg ٧٫٤abc ٧٫٨ab ٨٫٢a ٧٫٩a ٧٫٤abc ٧٫٠bcd ٧٫٨ab ٧٫٥abc ٥٫٢gh ٦٫٠fg ٦٫٩cde ٦٫٢def ٤٫٢i ٤٫٦hi ٦٫١ef ٥٫٨fg General Crumb Crumb Uniformity acceptability texture color a ab a ٨٫٣ ٧٫٨ ٨٫٢ ٨٫٤a ٧٫٨abc ٨٫١a ٨٫١ab ٨٫٥a ٨٫٣a ٧٫٢abc ٧٫٢bcd ٨٫٢ab ٨٫١ab ٨٫١a ٨٫١ab ٨٫٤a ٧٫٢cd ٧٫٤abc ٧٫٤abcd ٧٫٢cd ٧٫١cd ٧٫٤abc ٧٫٧abc ٧٫٨abc ٧٫٤bc ٧٫٧ab ٧٫٢bcde ٧٫٥bcd ٧٫٢cd ٧٫٥abc ٧٫٥abcd ٧٫٧abc ٥٫٣fgh ٥٫٤ef ٤٫٨g ٥٫٥efg ٥٫٩efg ٥٫٨de ٧٫٠cde ٦٫٠e ٧٫٢cd ٦٫٧cd ٧٫٠cde ٦٫٩d ٦٫٠ef ٦٫٧cd ٦٫٧def ٦٫١e ٤٫٧h ٤٫٦f ٤٫٤g ٤٫٣g ٥٫١gh ٥٫٤ef ٧٫٠cde ٥٫١f ٦٫٤de ٦٫٩bc ٦٫٣ef ٥٫٩e ٥٫٦efg ٥٫٩de ٥٫٩f ٥٫١f Mean values having different superscript letter in each column differ significantly at (P≤٠٫٠٥) using Duncan's Multiple Range Test (DMRT). Fig (٤٢) Effect of improvers on aroma of loaf bread made from flour of Fig (42): The effect of three Sudanese cultivars and Canadian Sudanese and Canadian cultivars wheat flour with and without improverswheat on loaf breed aroma 9 8 6 5 4 3 2 1 Canadian Debaira Wadi Elneel Elneelain S A Z Control S A Z Control S A Z Control S A Z 0 Control Aroma scores 7 Fig (٤٣) Effect of improvers on taste of loaf bread made from flour of Fig (43): The effect of three Sudanese cultivars and Canadian Sudanese and Canadian wheat cultivars wheat flour with and without improvers on loaf breed taste 9 8 6 5 4 3 2 1 Canadian Debaira Wadi Elneel Elneelain S A Z Control S A Z Control S A Z Control S A Z 0 Control Taste scores 7 Generally, the Canadian wheat gained higher scores of bread taste with low variation with Debaira followed by Wadi Elneel and then Elneelain cultivar. Treatment with A improver gave the best results of bread taste followed by S and then Z improver. ٤٫٩٫٢٫٣ Crumb texture: The crumb texture scores of loaf bread made from three Sudanese cultivars and Canadian wheat flours with and without improvers are shown in Table (٩) and Fig. (٤٤). The scores of bread crumb texture ranged from ٨٫٣ to ٤٫٧. A higher crumb texture was gained by bread made from the Canadian wheat without improvers, forming insignificant differences (P>٠٫٠٥) with breads made from the same cultivar with the three improvers. Whereas the bread made from Elneelain without improvers gained lower value. Generally, Debaira cultivar gained higher scores of crumb texture among Sudanese cultivars. Treatment with A improver gave the best results of crumb texture among the three improvers. ٤٫٩٫٢٫٤ Crumb color: The crumb color scores of loaf bread made from three Sudanese cultivars and Canadian wheat flours with and without improvers are shown in Table (٩) and Fig. (٤٥) The scores of bread crumb color are found to be in the range of ٨٫١ to ٤٫٦. The score of bread crumb color made from the Canadian wheat with S and Z improvers gained the highest value, showing insignificant differences (P>٠٫٠٥) with breads made from the same cultivar with A and without improvers, and with breads made from Debaira cultivar with and without improvers. While the bread made from Elneelain without improvers gave the lowest value. Fig Effect of improvers on crumbcultivars texture and of loaf bread wheat made from Fig(٤٤) (44): The effect of three Sudanese Canadian flour with and improvers on loaf breed texture flour ofwithout Sudanese and Canadian wheatcrumb cultivars 9 7 6 5 4 3 2 1 Canadian Debaira Wadi Elneel Elneelain S A Z Control S A Z Control S A Z Control S A Z 0 Control Crumb texture scores 8 Fig(٤٥) (45):Effect The effect of three Sudanese Fig of improvers on crumbcultivars color ofand loafCanadian bread made from flour wheat flour with and without improvers on loaf breed crumb color of Sudanese and Canadian wheat cultivars 9 7 6 5 4 3 2 1 Canadian Debaira Wadi Elneel Elneelain S A Z Control S A Z Control S A Z Control S A Z 0 Control Crumb color scores 8 From the results Debaira cultivar gave the highest scores of crumb color compared with the other two local cultivars. Treatment with A improver gained the best results of crumb color compared with the other improvers. ٤٫٩٫٢٫٥ Crumb cell uniformity: The crumb cell uniformity scores of loaf bread made from three Sudanese cultivars and Canadian wheat flours with and without improvers are shown in Table (٩) and Fig. (٤٦). The bread crumb cell uniformity scores ranged from ٨٫٢ to ٤٫٤. The uniformity score of bread made from the Canadian wheat without improvers gained a higher value, showing insignificant difference (P>٠٫٠٥) compared with breads made from the same cultivar and from Debaira cultivar without and with Z and S improvers. While the bread made from Elneelain without improvers gained a lower value, with no significant difference compared with breads made from Wadi Elneel without improvers. Generally, Debaira cultivar gained higher scores of crumb cell uniformity among the local cultivars.Treatment with S improver gave the best result of crumb cell uniformity compared with the other two improvers. ٤٫٩٫٢٫٦ General acceptability: The scores of general acceptability for breads made from three Sudanese cultivars and Canadian wheat flours with and without improvers are shown in Table (٩) and Fig. (٤٧). The scores of bread general acceptability are found to be in the range of ٨٫٥ to ٤٫٣. The general acceptability of bread made from the Canadian wheat with Z improver gave a higher value, with no significant different (P>٠٫٠٥) compared with breads made from the same cultivar with the other two improvers and without improver, and with breads made from Debaira cultivar with Z and S improvers. Whereas the bread made from Elneelain without improver gave a lower value. Generally, Debaira cultivar gained higher scores of general acceptability among the local cultivars, this may be due to its good bread making qualities, followed by Wadi Elneel and then Elneelain. Fig (٤٦) Effect of improvers on crumb cell uniformity of loaf bread made Fig (46): The effect of three Sudanese cultivars and Canadian wheat fromand flour of Sudanese andon Canadian wheat cultivars flour with without improvers loaf breed crumb cell uniformity 9 7 6 5 4 3 2 1 Canadian Debaira Wadi Elneel Elneelain S A Z Control S A Z Control S A Z Control S A Z 0 Control Crumb cell uniformity scores 8 FigFig (٤٧) Effect of improvers on general acceptability of loaf of bread made (47): The effect of breed improvers on the general acceptability loaf breed madeflour from three Sudaneseand cultivars and Canadian flour from of Sudanese Canadian wheat wheat cultivars 9 7 6 5 4 3 2 1 Canadian Debaira Wadi Elneel Elneelain S A Z Control S A Z Control S A Z Control S A Z 0 Control General acceptability scores 8 Plate (١): Debaira, Wadi Elneel, Elneelain and Canadian loaf bread without improvers K: Canadian, D: Debaira, W: Wadi Elneel, N: Elneelain. Plate (٢): Debaira, Wadi Elneel, Elneelain and Canadian loaf bread with Z improver K: Canadian, D: Debaira, W: Wadi Elneel, N: Elneelain. Plate (٣): Debaira, Wadi Elneel, Elneelain and Canadian loaf bread with S improver K: Canadian, D: Debaira, W: Wadi Elneel, N: Elneelain. Plate (٤): Debaira, Wadi Elneel, Elneelain and Canadian loaf bread with A improver K: Canadian, D: Debaira, W: Wadi Elneel, N: Elneelain. ٤٫٩٫٣ Sensory evaluation of flat bread: ٤٫٩٫٣٫١ Aroma: The aroma scores of flat bread made from three Sudanese cultivars and Canadian wheat flours with and without improvers are shown in Table (١٠) and Fig. (٤٨). The scores of bread aroma are found to be in the range of ٨٫٣ to ٤٫٩. The aroma score of bread made from Debaira with Z improver gained a higher value but with no significant difference (P>٠٫٠٥) compared with bread made from the same cultivar with S improver, and with bread made from Canadian wheat with A improver. While the aroma score of bread made from Debaira with A improver gained the lowest value. ٤٫٩٫٣٫٢ Taste: The taste scores of flat bread made from three Sudanese cultivars and Canadian wheat flours with and without improvers are shown in Table (١٠) and Fig. (٤٩). The scores of bread taste ranged from ٨٫٢ to ٤٫٩. The taste score of bread made from Debaira with S improver gained a higher value, showing insignificant difference (P>٠٫٠٥) compared with bread made from the same cultivar with Z improver, and with bread made from Canadian wheat with A improver. Whereas, taste of bread made from Elneelain without improvers gained the lowest value. Table (١٠): Sensory evaluation of flat bread made from the three Sudanese wheat cultivars and Canadian wheat flours with and with out improvers. Cultivar Canadian Improver Aroma Taste Wadi Elneel Elneelain General color acceptability Control ٥٫٩defg ٥٫٩def ٥٫٣cd ٦٫٢def Z ٥٫٤fgh ٥٫٧efg ٥٫٢cd ٥٫٣fg A ٨٫١a ٨٫٠a ٧٫٣ab ٨٫١a S ٧٫٠bc ٦٫٨bcd ٧٫٣ab ٧٫١bc ٥٫٩defg ٦٫١cdef ٥٫٦cd ٦٫٢def Control Debaira Crust Z ٨٫٣a ٧٫٥ab ٨٫٠a ٧٫٥ab A ٤٫٩h ٥٫٤efg ٣٫٨e ٤٫٣h S ٧٫٨ab ٨٫٢a ٧٫٧a ٨٫٠a Control ٦٫٣cdef ٧٫٠bc ٧٫٤ab ٧٫٥ab Z ٦٫٨ed ٦٫٢cdef ٦٫٨b ٦٫٦cde A ٦٫٦cd ٦٫٨bcd ٧٫٢ab ٦٫٩bcd S ٦٫٤cde ٦٫٠cdef ٥٫٦cd ٥٫٨efg Control ٥٫٢gh ٤٫٩g ٤٫٨d ٦٫٢def Z ٥٫٥efgh ٥٫٢fg ٥٫٥cd ٥٫١gh A ٥٫٥efgh ٦٫٠cdef ٥٫٨c ٦٫١def S ٦٫٢cdef ٥٫٨c ٥٫٩efg ٦٫٣cde Mean values having different superscript letter in each column differ significantly at(P≤٠٫٠٥) using Duncan's Multiple Range Test(DMRT). ١٠٩ Fig (٤٨) Effect of improvers on aroma of flat bread made from flour of Fig (48): The effect of three Sudanese cultivars and Canadian Sudanese Canadian wheat cultivars wheat flour with and and without improvers on flat breed aroma 9 8 6 5 4 3 2 1 Canadian Debaira Wadi Elneel Elneelain S A Z Control S A Z Control S A Z Control S A Z 0 Control Aroma scores 7 (٤٩) Effect on taste of flat bread made from flour of FigFig (49): The effectofofimprovers three Sudanese cultivars and Canadian wheat flour withSudanese and without flat breed taste andimprovers Canadianon wheat cultivars 9 8 6 5 4 3 2 1 Canadian Debaira Wadi Elneel Elneelain S A Z Control S A Z Control S A Z Control S A Z 0 Control Taste scores 7 ٤٫٩٫٣٫٣ Crust color: The crust color scores of flat bread made from three Sudanese cultivars and Canadian wheat flours with and without improvers are shown in the Table (١٠) and Fig. (٥٠). The scores of bread crust color are found to be in the range of ٨٫٠ to ٣٫٨. A higher crust color was gained by bread made from Debaira with Z improver, forming insignificant difference (P>٠٫٠٥) with bread made from the same cultivar with S improver, breads made from the Canadian wheat flour with A and S improvers and breads made from Wadi Elneel with A and without improvers. While crust color of bread made from Debaira with A improver gained the lowest value. . ٤٫٩٫٣٫٤ General acceptability: The scores of general acceptability for flat bread made from three Sudanese cultivars and Canadian wheat flours with and without improvers are shown in Table (١٠) and Fig. (٥١). The scores of general acceptability for breads ranged from ٨٫١ to ٤٫٣. The highest score of general acceptability was gained by bread made from the Canadian wheat with A improver, with no significant difference (P>٠٫٠٥) compared with breads made from Debaira with S and Z improver and bread made from Wadi Elneel without improver. Whereas the lowest score of general acceptability was gained by bread made from Debaira with A improver. Generally, the results showed the ability of Sudanese cultivars in making flat bread. Debaira gave higher values of general acceptability among local cultivars when treated with Z and S improvers . ١١٢ FigFig (50): The effect three Sudanese (٥٠) Effect of of improvers on crustcultivars color of and flat Canadian bread made from wheat flour with and without improvers on flat breed color flour of Sudanese and Canadian wheat cultivars 9 8 6 5 4 3 2 1 Canadian Debaira Wadi Elneel Elneelain S A Z Control S A Z Control S A Z Control S A Z 0 Control Color scores 7 Fig (٥١) (51):Effect The effect of three Sudanese cultivars and Canadian wheatmade Fig of improvers on general acceptability of flat bread flour with and without improvers on flat breed general acceptability from flour of Sudanese and Canadian wheat cultivars 9 7 6 5 4 3 2 1 Canadian Debaira Wadi Elneel Elneelain S A Z Control S A Z Control S A Z Control S A Z 0 Control General acceptability scores 8 Plate (٥): Debaira, Wadi Elneel, Elneelain and Canadian flat bread without improvers K: Canadian, D: Debaira, W: Wadi Elneel, N: Elneelain. Plate (٦): Debaira, Wadi Elneel, Elneelain and Canadian flat bread with Z improver K: Canadian, D: Debaira, W: Wadi Elneel, N: Elneelain. Plate (٧): Debaira, Wadi Elneel, Elneelain and Canadian flat bread with A improver K: Canadian, D: Debaira, W: Wadi Elneel, N: Elneelain. Plate (٨): Debaira, Wadi Elneel, Elneelain and Canadian flat bread with S improver K: Canadian, D: Debaira, W: Wadi Elneel, N: Elneelain. CHAPTER FIVE CONCLUSIONS AND RECOMMENDATIONS ٥٫١. Conclusions: From this work it could be concluded that: • The addition of improvers showed positive effect on rheological properties of the cultivars investigated. • Cultivar Debaira gave the best flour quality for bread-making compared with the other local cultivars investigated. • This study revealed the ability of producing good flat bread from Sudanese cultivars. • Sudanese Wheat cultivars investigated proved that they are of soft type. ٥٫٢. Recommendations: It is recommended that: • Further investigations are needed to breed high yielding with high quality and diseases resistant varieties of local wheat. • Investigations are also needed to produce suitable improvers to increase the bread making quality for the local wheat. • Further studies are recommended to produce better flat bread from Sudanese cultivars. • Using improver A in loaf bread and improver S in flat bread production . References A. A. C. C. (٢٠٠٠). Approved methods of American Association of Cereal Chem, ١٠th ed., St. Paul, MN., USA. Ageeb, O. A. A. (١٩٩٤). Agronomic aspects of wheat production in Sudan. In: Wheat in heat – stressed environment: Irrigated, dry areas and rice – wheat farming system, ed. Sannders, D. A. and Hettel, G. P. Mexico, D. F., CIMMYT. Ahmed, S. E. (١٩٩٥). Proximate composition and flour quality of wheat cultivars grown in the Sudan. M.Sc. Thesis, University of Khartoum. Al – Eid, S. M. (٢٠٠٠). Behavior of some bread improvers in Arabic, white pan bread and frankfurter rolls. U. of K. J. Agric. Sci. ٨ (٢), ١١٨-١٣٢. Allen, W. G. (١٩٩٩). Alternative oxidants as dough conditioners. Cereal Foods World ٤٤ (٩): ٦٤٢-٦٤٩. Anaka, K. T. and Tipples, S. L. (١٩٧٩). Relation between farinograph mixing curve and mixing requirement. J. Cereal Sci. ٢٣ (٢): ٢٩٦-٣٠١. Anon (١٩٨٧). Wheat facts. In: Official publications of the National Association of Wheat growers, ١٠: ٧. Anon (١٩٩٨). News letter, flour improvers, special edition, information for customers. AOAC (١٩٨٤). Official Method of Analysis ١٤th ed. Association. Agric. Chem. Washington D. C. Badi, S. M.; Elfaki, H. A. and Perten, H. (١٩٧٨). Evaluation of Sudanese wheat varieties. Sudan J. of Food Sci. and Techno., ١٠: ٥. Banwart, G. J. (٢٠٠٢). Basic food microbiology. Second edition CBS publishers and distributors. India. Barrett, F. F. (١٩٧٥). Enzyme uses in the milling and baking industries. In: Enzymes in Food Processing, ٢nd ed. G. Reed, ed, Academic press. New York. Bennion, M. (١٩٨٠). Introductory foods. Brigham young University, Macmillan publishing Co. ٧th ed. USA. Blackman, J. A. and Payne, P. I. (١٩٨٧). Wheat breeding, it’s scientific bases. (Lupton, F. G. H. ed.). Chapman and Hall. London. Bloksma, A. H. (١٩٧٢). Flour composition, dough rheology, and baking quality. Cereal Sci. Today ١٧: ٣٨٠-٣٨٦. Bloksma, A. H. (١٩٧٤). The chemical and rheological basis of oxidative flour improvement. In: Einfluss der reologie aud die lebensmitte lverarbeitug und die lebensmittel qualitat. Dechema – Monographien ٧٧, No. ١٥٢٤. Bloksma, A. H. (١٩٩٠a). Rheology of the bread making process. Cereal Foods World ٣٥: ٢٢٨. Bloksma, A. H. (١٩٩٠b). Dough structure, Dough Reology, and Baking Quality. Cereal Foods World ٣٥: ٢٣٧. Bloksma, A. H. and Bushuk, W. (١٩٨٨). Rheolgy and chemistry of dough. In: Wheat chemistry and technology, ٣rd ed. Y. Pomeranz, Ed., Am. Assoc. Cereal Chemists, St. Paul, MN. Bushuk, W. (١٩٦٦). Distribution of water in dough and bread. Baker’s. Dig. ٤٠ (٥): ٣٨. Bushuk, W. and Hlynka, I. (١٩٦٤). Water as aconstituent of flour, dough, and bread. Baker’s Dig. ٣٨ (٦): ٤٣. Bushuk, W. (١٩٨٦). Wheat chemistry and uses. Cereal Science Today ٣١: ٢١٨-٢٢٣ Cauvain, S. P. and Chamberlain, N. (١٩٨٨). The bread improving effect of fungal alpha amylase. Journal of Cereal Science ٨: ٢٣٩-٢٤٨. Chung, O. K. (١٩٨٦). Lipid – protein interaction in wheat flour, dough, gluten and protein fractions. Cereal Foods World ٣١: ٢٤٢. Collado, M. and Deleyn, I. (٢٠٠٠). Relationship between loaf volume and gas retention of dough during fermentation. Cereal Foods World. ٤٥: ٢١٤-٢١٨. D’Appolonia, B. L. and Kim, S. K. (١٩٧٦). Recent developments on wheat flour pentosans. Baker’ Dig. ٥٠ (٣): ٤٥-٤٩, ٥٣-٥٤. Danno, G. and Hoseney, R. C. (١٩٨٢). Effects of dough mixing and rheologically active compounds on relative viscosity of wheat proteins. Cereal Chem. ٥٩: ١٩٦. Dendy, D. A. V. (١٩٩٢). Composite flour present, and future, a review with special emphasis on the place of composite flour in semi Arid zones the utilization of sorghum and millets. Patanchara, A. P. ٥٠٢٣٢٤ ICRISAt, pp. ٦٧-٧٣. Egan, H.; Kirk, R. and Sawyer, (١٩٨١). Person’s chemical analysis of food. ٨th ed., Longman Scientific and technical, London. Elagib.E.A.A. (٢٠٠٢).Study of the proteins and baking quality of three Sudanese wheat cultivars.PhD.Thesis.University of Khartoum. Elahmadi, A. B. (١٩٩٤). Development of wheat germplasm tolerant to heat stress in Sudan. In: Wheat in heat – stressed environment: Irrigated, dry areas and rice – wheat farming system, ed. Sannders, D. A. and Hettel, G. P. Mexico, D. F., CIMMYT. Elton, G. A. H. and Fisher, N. (١٩٦٦). A technique for the study of the baking process and its application to the effect of fat on baking dough. J. Sci. Food and Agric. ١٧: ٢٥٠. Everson, E. H. (١٩٨٧). Wheat quality: breeders point of view. J. Cereal Foods World ٣٢: ٣٠٦-٣١٠. Faridi, H. A. and Rubenthaler, G. L. (١٩٨٤). Effect of various flow extractions, water absorption, baking temperature and shortening level on the physical properties and staling of pita breads. Cereal Foods World ٢٩: ٥٧٥-٥٧٦. Farvili, N.; Walker, C. E. and Qarooni, J. (١٩٩٥). Effects of emulsifiers on pita bread quality. Journal of Cereal Science ٢١: ٣٠١-٣٠٨. Faubion, J. M. and Hoseney, R. C. (١٩٩٠). The viscoelastic properties of wheat flour doughs. In: Dough rheology and baked product texture. H. faridi and J. M. Faubion, eds. AVI: New York. Ferrari, C. G.; Higashiuchi, K. and Podliska, J. A. (١٩٦٣). Flour maturing and bleaching with acyclic acetone peroxides. J.Cereal Chem. ٤٠: ٨٩-١٠١. Fitchett, C. S. and Frazier, P. J. (١٩٨٦). Action of oxidants and other improvers. In: Chemistry and physics of baking. J. M. V. Blanshard, P. J. Frazier, and T. Galliard. Burlington House: London. Frazier, P. J. and Daniels, N. W. R. (١٩٨٦). Protein lipid interactions in bread dough. In: Interaction of food components, G. G. Birch and M. G. Lindley, Eds., Elsevier Applied Sci. Publ., London. Gaines, C. S. (١٩٩٠). Influence of chemical and physical modification of soft wheat protein on sugar – snap cookie dough consistency, cookie size and hardness. J. Cereal Chem. ٦٧: ٧٣-٧٧. George, E. I. (١٩٧٣). Wheat production and utilization. The AVI publishing company INC. West port Connecticut, USA. Giesecke, A. G. (٢٠٠٠). Identifying factors affecting bromate residue levels in baked products: Preliminary studies. Cereal Foods World ٤٥: ١١١-١٢٠. Griswold, R. (١٩٦٢). The experimental study of foods. Indian University. Hoseney, R. C. (١٩٨٦). Principles of cereal science and technology. Am. Assoc. Cereal Chem. St. Paul. MN. Hoseney, R. C. and Rogers, D. E. (١٩٩٣). The formation and properties of wheat flour doughs. In: Dough Rheology and Baked Product Texture. Workshop, T NO. Wageningen, Netherlands. Hoseney, R. C.; Finney, K. F. and Pomeranz, Y. (١٩٧٠). Functional (bread making) and biochemical properties of wheat flour components. VI. Gliadin – lipid – glutenin interaction in wheat gluten. Cereal Chem. ٤٧: ١٣٥. Hoseney, R. C.; Finney, K. F.; Pomeranz, Y. and Shogren, M. D. (١٩٧١). Functional (bread making) and biochemical properties of wheat flour components. VIII. Starch. Cereal Chem. ٤٨: ١٩١. Hoseney, R. C.; Rao, H.; Faubion, J. and Sidhu, J. S. (١٩٨٠). Mixograph studies. IV. The mechanism by which lipoxygenase increases mixing tolerance. Cereal Chem. ٥٧: ١٦٣. Hoseney, R. C.; Wade, P. and Finley, J. W. (١٩٨٨). Soft wheat products. In: Wheat chemistry and technology. ٣rd ed. Vol. ٢. Y. Pomeranz, ed. Am. Assoc. Cereal Chem. St. Paul. MN. ICC (١٩٦٨). International Assoc. Cereal Chem. No. ١٠٧. Vienna. Austria. ICC (٢٠٠١). International Assoc. Cereal Chem. No. ١١٤/١ Vienna. Austria. Ishage, H. M. and Ageeb, O. A. (١٩٩١). The physiology of grain yield in wheat in an irrigated tropical environment ٢٧: ٧١-٧٧. JECFA(١٩٩٢).Joint FAO/WHO Expert Committee on Food Additives. Compendium of food additive specifications FNP٥٢ Add١. Johnson, J. A.; Miller, D. and Fryer H. C. (١٩٦٢). Acetone peroxides – a new bleaching and maturing agent for flour. Baker’s Dig. ٣٦ (٦): ٥٠-٥٥. Joiner, R. R. (١٩٦٢). Azodicarbonamide: New powdered agent for flour maturing. North – west. Miller ٢٦٧ (١٢): ٣٠. Junge, R. C. and Hoseney, R. C. (١٩٨١). A mechanism by which shortening and certain surfactants improve loaf volume in bread. Cereal Chem. ٥٨: ٤٠٨. Kaldy, M. S. and Rubenthaler, G. L. (١٩٨٧). Milling,baking and physical – chemical properties of selected soft white winter and spring wheats. Cereal Chem. ٦٤: ٣٠٢-٣٠٧. Kaldy, M. S.; kereliak, M. and Kozub, G. C. (١٩٩٣). Influence of wheat gluten components and flour lipid on soft white wheat quality J. Cereal Chem. ٧٠: ٧٧-٨٠. Kent, N. L. (١٩٨٣). Technology of cereal, third edition publication of British library cataloging. Kieffer, R. (٢٠٠٣). Die Elastizitat von Weizenteig – ein haufig uberschatztes Qualitatsmerkmal. Getreide Mehl Brot ٥٧ (٦), ٣٣٥-٣٣٩.(Cited in Popper, L. (٢٠٠٤). Dough rheology as function of flour treatment. ٢nd international muhlenchemie symposium on flour – food for life. Hamburg, ١٧-١٨june). Knightly, W. H. (١٩٧٣). The evolution of softeners and conditioners used in baked foods. Bakers Dig. ٤٧: ٦٤. Kulp, K. and Ponte, J. G. (١٩٨١). Staling of white pan bread, fundamental causes. CRC, Critical review in food science and nutrition. ١٥: ١-٤٨. Kuracina, T. A.;Lorenz, K. and Kulp, K. (١٩٨٧). Starch functionality as affected by amylases from different sources. Cereal Chem. ٦٤: ١٨٢-١٨٦. Kurokawa, Y.; Hayashi, Y.; Maekawa, A.; takahashi, R.; Kakubo, T. and Odashima, S. (١٩٨٣). J. Nat. Cancer Inst. ٧١: ٩٦٥. Lukow, O. M. and Mcvett, P. B. E. (١٩٩١). Effect of cultivar and environment on quality characteristics of spring wheat. J. Cereal Chem. ٦٨: ٥٩٧-٦٠١. Lyla, A. A. (٢٠٠٢). Pastry and bread with use baker’s yeast. University of Tanta. Egypt. MacRitchie, F. (١٩٨٧). Evaluation of contributions from wheat protein fractions to dough mixing and bread making. J. of Cereal Sci., ٦: ٢٥٩ (Cited in Bekes, F. and Gras, P. W. (١٩٩٩). Vitro studies on gluten protein functionality. J. of Cereal Foods World, ٤٤ (٨): ٥٨٠.). Maninder, K. and Jorgensen, O. B. (١٩٨٣). Interrelations of starch and fungal alpha – amylase in bread making. Starch ٣٥: ٤١٩٤٢٦. Mathewson, P. R. (٢٠٠٠). Enzymatic activity during bread baking. Cereal Foods World ٤٥: ٩٨. Matz, S. A. (١٩٦٨). Cookie and cracker technology. West port, Connecticut. The Avi publishing company, Inc. Meredith, P. (١٩٦٦). Dependence of water absorption of wheat flour on protein content and degree of starch granule damage. Newzealand J. Sci. ٩: ٣٢٤. Miller, B. S. and Johnson, J. A. (١٩٥٥). Fungal enzymes in baking. Baker’s Digest ٢٩: ٩٥-١٠٠, ١٦٦-١٦٧. Mohamed, E. A. (٢٠٠٠). Evaluation of four local wheat cultivars with special emphasis on protein fractions, M.Sc. Thesis, University of Khartoum. Morad, M. M. and D’Appolonia, B. L. (١٩٨٠). Effect of surfactants and baking procedure on total water – solubles and soluble starch in bread crumb. Cereal Chem ٥٦: ١٤١-١٤٤. Mustafa,K.M.(١٩٩٣) Technology of cereal and their products, third edition publication Academic bookshop.Cairo. NCFM (٢٠٠٣) North Cairo Flour Mills Company. Wheat flour (٧٢٪ extraction) internet, www north Cairo mills. Com/wheat.html. Novo enzyme information (١٩٧٤). Enzymes in the production of baked goods, (IB – number ٠٠٢ f –e). Orth, R. A. and Bushuk, W. (١٩٧٢). A comparative study of the proteins of wheats of divers baking qualities. Cereal Chem. ٤٩: ٢٦٨-٢٧٥. Perten, H. (١٩٩٥). Manual glutomatic system. The gluten index method (ICC standard methods No. ١٥٨, AACC method ٣٨١٢). Huddinge, Sweden. Perten, H. (١٩٩٦). Manual falling number ١٥٠٠, as a measure of alpha amylase activity. (ISO – standard No. ٣٠٩٣, ١٩٧٤), ICC standard No. ١٠٧١١ (١٩٩٥), and AACC method ٥٦-٨١B (١٩٩٢). Huddinge, Sweden. Peterson, C. J.; Graybosch, R. A.; Baezinger, P. S. and Grombacher, A. W.(١٩٩٢).Genotype and environment effect on quality characteristics of hard red winter wheat. Crop Sci., ٣٢:٩٨. Pomeranz, Y. (١٩٧١). Wheat chemistry and technology, ٢nd edition pp. ٥٦٠-٥٨٥. Am. Assoc. of Cereal Chem. St. Paul, Minnisota. Pomeranz, Y. (١٩٨٨). Wheat chemistry and technology, ٣rd ed., Am. Assoc. Cereal Chemists, St. Paul, MN, pages ٦٩-٩٠. Ponte, J. G.; Titcomb, S. T. and Cotton, R. H. (١٩٦٣). Some effects of oven temperature and malted barley level on bread making. Baker’s Digest ٣٧: ٤٤-٤٨. Popper, L. (٢٠٠٤). Dough rheology as function of flour treatment. ٢nd international muhlenchemie symposium on flour – food for life. Hamburg, ١٧-١٨june. Pratt, D. B. (١٩٧١). In wheat Chem. and Tech. Pomeranz, Y. (ed.) pp. ٢٠١-٢٢٥. Am. Associ. of Cereal Chem.. St. paul Minnisota.. Pyler, E. J. (١٩٧٣). Baking science and technology. Vol. ٢. Siebel publishing company. Chicago, ILL. Qarooni, J. (١٩٨٩). The hand book of Arabic bread production. Published by Kuwait flour mills and bakeries Co. (S. A. K.). Qarooni, J.; Orth, R. A. and Wootton, M. (١٩٨٧). A test baking technique for Arabic bread quality. Journal of Cereal Science ٦: ٦٩-٨٠. Qarooni, J.; Ponser, E. S. and Ponte, J. G. (١٩٩٣). Production of tannor bread with hard white and other U. S. wheats. Lebensm. Wiss U. technology ٢٦: ١٠٠-١٠٦. Roach, R. R. (١٩٨٩). Effect of neutral slats on dough and bread. M.Sc. Thesis, Kansas State University: Manhattan. Rubenthaler, G. and faridi, H. (١٩٨١). Breads produced from pacific north – west soft white wheat. ١. Five international breads. Baker’s Digest ٥٥, ١٩-٢٢. Rubenthaler, G.; Finney, K. F. and Pomeranz, Y. (١٩٦٥). Effects on loaf volume and bread characteristics of alpha – amylase from cereal, fungal, and bacterial sources. Food technology ١٩: ٢٣٩-٢٤١. Shuey, W. C. (١٩٧٥). Practical instruments for rheological measurements on wheat products. Cereal Chem. ٥٢: ٤٢. Sidhu, J. S.; Nordin, P. and Hoseney, R. C. (١٩٨٠) Mixograph studies. ١١١. Reaction of fumaric acid with gluten proteins during dough mixing. Cereal Chem. ٥٧: ١٥٩. Soulaka, A. B. and Morrison, W. R. (١٩٨٥). The bread baking quality of six wheat starches differing in composition and physical properties, J. Sci. Food Agricultural. ٣٦: ٧١٩. Spies, R. (١٩٩٠). Application of rheology in the bread industry. Page ٣٤٣-٣٥٩. in: Dough rheology and baked product texture. H. faridi and J. M. Faubion, eds. AVI: New York. Stauffer, C. E. (١٩٨٣). Dough conditioners. Cereal Foods World ٢٨: ٧٢٩-٧٣٠. Stear, C. E. (١٩٩٠). Handnd book of bread making technology. Elsevier science publishers Ltd, Essex, England. Tanaka, K. and Bushuk, W. (١٩٧٣). Changes in flour proteins during dough – mixing .I. solubility results. Cereal Chem. ٥٠: ٥٩٠. Tolman, S.; Paszezynska, B. and Czuchajowska, Z. (١٩٩٨). Handling properties of dough and bread volume as viewed by microtension and rheofermentometer parameters. (Abstract). J. of Cereal foods World, ٤٣ (٧): ٥٦٣. Tsen, C. C. (١٩٦٣). The reaction mechanism of azodicarbonamide in dough. Cereal Chem. ٤٠: ٦٣٨-٦٤٧. Tsen, C. C. (١٩٦٤). Comparative study on reaction of Iodate, Azodicarbonamide, and acetoneperoxide in simple chemical systems and in dough. Cereal Chem. ٤١: ٢٢-٣١. Tsen, C. C. and Weber, J. (١٩٨١). Dough properties and proff times of yeasted doughs affected by surfactants. Cereal Chem. ٥٨: ١٨٠-١٨١. Watson, K. S. and Walker, C. E. (١٩٨٦). The effect of sucrose esters on flour water dough mixing characteristics. Cereal Chem. ٦٣: ٦٢-٦٤. Weak, E. D.; Hoseney, R. C.; Seib, P. A. and Biag, M. (١٩٧٧). Mixograph studies, I. Effect of certain compounds on mixing properties. Cereal Chem. ٥٤: ٧٩٤-٨٠٢. Williams, J. (١٩٧٠). Brief notes on wheat and flour evaluation. J. of Food science and technology in Sudan ٢: ٣٨-٤٢. Williams, P.; El – Haramein, F. J.; Nakkoul, H. and Rihawi, S. (١٩٨٦). Crop quality evaluation methods and guidelines, publishers. ICARDA, Syria. Pp. ١-٣١. Wolf, W.; Weddon, D.; Loewe, R.and Lorenz, K. (١٩٧٩). National levels of nutrient in commercially milled wheat flours ١١١. Mineral analysis. Cereal Chem. ٥٧ (١): ٦٥-٦٩. Zeleny, L. (١٩٧١). In wheat chemistry and technology. (Pomeranz, Y, ed). ٢nd edition. Am. Assoc. of Cereal Chem., St. Paul, Minnesota. APPENDIXES Appendix (١): Flour Treatment Agent Maximum level in finished product L- Ascorbic acid and its sodium and potassium salt ٣٠٠mg/kg Azodicarbonamide for leavened bread ٤٥ mg/kg Chlorine in high ratio cakes ٢٥٠٠ mg/kg Chlorine dioxide for yeast raised bakery products ٣٠ mg/kg Benzoyl peroxide ٦٠ mg/kg L- Cysteine hydrochloride ٩٠ mg/kg Source: CODEX STAN ١٥٢-١٩٨٥(Rev.١-١٩٩٥). Appendix (٢): Panel test for loaf bread samples (Hedonic): Please examine the following samples of bread presented in front of you, and give values to attributes shown on the form sheet, taking: (٨-٩) as excellent, (٦-٧) as very good, (٤-٥) as good, (٢-٣) as fair, (١) as poor: Evaluation: Crumb Crumb Crumb cell General texture color uniformity acceptability Samples Aroma Taste K D W N Appendix (٣): Panel test for flat bread samples (Hedonic): Please examine the following samples of bread presented in front of you, and give values to attributes shown on the form sheet, taking: (٨-٩) as excellent, (٦-٧) as very good, (٤-٥) as good, (٢-٣) as fair, (١) as poor: Evaluation: Samples K D W N Aroma Taste Crust color General acceptability
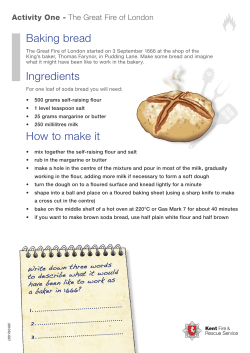


© Copyright 2026