
Apple Computers, Inc. (AAPL) Comprehensive Business Analysis Cody Schoenig
Apple Computers, Inc. (AAPL)
Comprehensive Business Analysis
Cody Schoenig
Matt Sundberg
Casey Pazoki
Daisy Torres
Hudson Marshall
1
Table of Contents
Executive Summary………………………………………….. 03
Business & Industry Analysis…………………………. 07
Industry Analysis………………………………………. 07
Five Forces Model……………………………………… 07
Key Success Factors………………………………….. 14
Competitive Strategy Analysis…………………….
17
Accounting Analysis………………………………………… 18
Accounting Analysis Steps………………………….
18
Manipulation Diagnostics………………….……….. 24
Ratio Analysis & Forecast Financials………………
34
Financial Ratio Analysis……………………………… 35
Cross Sectional Analysis…………………………….. 38
Financial Statement Forecasting Methodology 55
Valuation Analysis…………………………………………… 61
Method of Comparables…………………………….. 61
Discounted Free Cash Flow………………………… 64
Abnormal Earnings Growth…………………………
65
Residual Income……………………………………….
65
Long Run Residual Income…………………………
66
Credit Risk Analysis……………………………………
66
Appendix (A-J)……………………………………………..…. 68
Sources……………………………………………………………. 78
2
Executive Summary
Apple Computers, Inc.
Investment Recommendation:
Sell
Date of Valuation: 4/01/05
Overvalued
AAPL – NASDAQ
52 week price range
Revenue (2004)
Market Capitalization
$40.89
$12.75 - $45.44
33.54 B
30.45 B
Shares Outstanding
817.17M
Dividend Yield
3-month Avg. Daily Trading Volume
Percent Institutional Ownership
0%
31,109,500
75.19%
Book Value Per Share (mrq)
ROE (2004)
ROA (2004)
Est. 5 year EPS Growth Rate
$7.16
10.37%
6.63%
1.79%
Cost of Capital Estimates
Ke Estimated
5-Year Beta
3-Year Beta
2-Year Beta
Published Beta
Kd
WACC(bt)
Altman’s Z - Score
EPS Forecast
FYE 9/31
EPS
2004(A) 2005(E) 2006(E) 2007(E)
.37
.55
.81
1.14
Valuation Ratio Comparison
Trailing P/E
Forward P/E
M/B
Forward PEG
Ratio Based Valuations
P/E Trailing
P/E Forward
M/B
Dividend Yield
PEG Forward
Ford Epic Valuation
R2
Beta
Ke
.207
.296
.029
1.71
1.14
.71
1.857
9.22%
6.68%
5.39%
8.78%
Intrinsic Valuations
Discounted Dividends
Free Cash Flows
Residual Income
Abnormal Earning Growth
Long Run Residual Income Perp.
2.63%
5.26%
3.30
3
Act.
65.95
32.20
33.24
1.79
$15.61
$20.67
$37.16
N/A
$20.24
$16.22
N/A
$28.95
$23.22
$23.40
$20.84
Avg.
25.18
16.29
5.44
1.20
Recommendation – Overvalued Security
After a comprehensive evaluation of Apple Computers, Inc., our findings
suggest that the firm is overvalued and we recommend selling the stock. Even
though, Apple’s sales in 2004 grew 33% and are estimated by analysts to grow
25% in 2005, the company has experienced this growth from the iPod, and it is
yet to be seen whether or not they will be able to maintain this success. Also,
Apple only has a 2% market share in the personal computer market, and it is
crucial that they increase this percentage if they wish to be considered a more
serious player in the personal computer market.
The computer industry is very diverse, dynamic, capital intensive, and
highly competitive. Products offered range from mp3 players to peripherals and
personal computers. The high level of competition has forced firms to adopt a
cost leadership stance, and has drastically reduced profits. The main
competitors in the industry are Apple, Dell, Hewlett-Packard, and Gateway, all of
which, excluding Apple and Dell have struggled to turn a profit.
Industry Demand Drivers
The drivers for new growth in the industry historically has been achieved
through the introduction of innovative products and/or efficiently and cost
effectively producing existing products. Apple and Dell have each capitalized on
one of these methods and are currently experiencing the highest levels of
success within the industry. Other demand drivers typically have encompassed
increased speed, memory, usability, and stylish designs.
Growth in the personal computer market is expected to decrease in 2005
due to the lack of new product introductions, resulting from the highly developed
market. However, the portable music sector has experienced tremendous
growth and is forecasted to continue this trend in the near future.
4
Learning Organizations with a high investment in R&D and operating efficiencies
will be best positioned to create/capitalize on growth in the industry.
Apple is well positioned
As stated previously, Apple and Dell have most effectively utilized the
competitive strategies that allow firms in this industry to remain profitable.
Apple is well known for its differentiated and innovative products, and loyal
customer base. This coupled with the “halo” effect from iPod sales is projected
to increase overall market share and better position Apple to take away market
share from its competitors. Also, Apple devotes the highest percentage of its
sales to R&D which better positions itself to enjoy first mover advantage with the
introduction of new products.
Margin Expansion
Apple has the highest gross profit margin amongst its competitors due to
its higher prices, and is solely responsible for allowing Apple to stay afloat in the
personal computer market with a meager 2% market share. However, Apple’s
spare no expense philosophy in producing high quality differentiated goods
drastically reduces its ability to translate a larger portion of gross profit into net
profit. Apple has the highest operating expense ratio and the lowest net profit
margin amongst its competitors. If Apple is able to cut down on operating
expenses and utilize some of the benchmark strategies employed by Dell, they
will be able to translate more of their revenues into earnings per share.
Healthy Financials
Apple shows favorable numbers in terms of liquidity/operating efficiency
analysis. The company is both able to meet short-term obligations and has
steadily been recovering its receivables. Inventory turnover was lower in 2004
than in previous years; however, it is our opinion that this is a result of Apple
5
intentionally increasing its inventory levels precluding the release of new
products. Profitability analysis revealed overall good profitability on sales, but
they lack the ability to convert satisfactory levels of gross profit into net income.
Apple demonstrates a healthy capital structure and is able to take on large
amounts of cheap debt.
Valuation
Based on valuation models, Apple’s stock is currently overvalued. Our
most accurate models indicate that the firm’s intrinsic value is in the range of
$20-$24. It is our belief that even though the firm is headed in a positive
direction, and has very healthy financials, much of their market price is
composed expectations instead of actual performance. Earnings in 2004 were
$.37 per share ($.74 per share before the 2 for 1 stock split). Estimated
earnings in 2005 are $.55 per share. We believe that investors should place
Apple on a watch list, and that it may become a more attractive stock in the
future.
Other Positive Factors
Apple effectively paid off all its debt in 2004 and is completely equity
financed, and is the only firm within their sector that has been able to
accomplish this. Furthermore, the stock recently split and many analysts have
issued buy and strong buy recommendations while also upgrading to outperform
the market.
Risks
The dynamic nature of the computer industry is reason enough to assume
a high level of risk. Also, the state of the economy plays a huge factor in Apple’s
performance; given a dip in the economy, Apple would suffer greatly.
6
Industry Analysis
The computer industry includes a wide variety of products, from mp3
players and printers to personal computers and powerful servers. Companies
have trouble operating within the computer industry, namely due to the dynamic
nature of technology. Moore’s law, formulated by Gordon Moore in 1965, states
that the numbers of transistors per square inch on integrated circuits will double
every 18 months, and prices will be reduced. This means even the largest firms
must stay on their toes, as the industry is constantly changing and redefining its
parameters.
Apple Computer Inc. has recently made headlines by breaking into the
portable music market with its introduction of the Apple iPod and iTunes
software. Apple also carries a long line of computer products including personal
computers, computer accessories, servers, networking solutions, and software
packages. Currently capturing a market share of 65% among the portable music
market, and holding a profitable 2% of the personal computer market, Apple has
consistently kept its name in the industry.1,12 Apple has stayed afloat in the
industry by keeping an eye for aesthetics and creativity, coupled with user
friendly and innovative products.
Five Forces Model
Competitive Force 1: Rivalry among Existing Firms
The two main areas within the computer hardware industry in which apple
competes are the personal computer and portable music markets. The personal
computer market is fairly well developed and growth in this market will be
moderate. According to the Credit Suisse First Boston, it is estimated that
personal computer growth in 2005 will be approximately 8%, which is 3% lower
than 2004.7 There is a high degree of concentration in this market which is
controlled by a few very large competitors who have a great deal of capital
invested in the firms, namely, Dell, HP Compaq, Gateway, and Apple. Personal
7
computers are quickly becoming a commodities market due to virtually identical
products produced by the leading competitors. This has placed an increased
emphasis on competitive pricing, which has drastically reduced profit. This is
forcing companies to be cost leaders to maintain a reasonable profit margin.
Apple’s bread and butter has always been achieved through product
differentiation, and “in a market where everyone except Dell has struggled to
make money, Apple has long been highly profitable with only a 2% market
share.”12 In 2005, Dell and Apple are speculated to have the most potential to
increase market share in the PC market due to lack of new product introductions
by other firms and the anticipation of Microsoft Longhorn in 2006.7 If Apple is
able to increase its market share by a few percentage points, its profits and
ability to spend on marketing, and research and development (R&D) could allow
them to become a much more serious player. Switching costs for the customer
have been the main deterrent in Apple’s quest to attain a more sizeable market
share, due to their higher prices and perceived incompatibility with other
software.8
Recently, a fairly new and less developed market within the parameters of
the computer hardware industry has emerged through portable music, which
was a substantial portion of Apple’ revenue in 2005.5 This market provides a
great deal of opportunity and high growth potential for firms. Currently, Apple
dominates the portable music industry music market with an estimated 90% for
hard disk based players, and 65% of the total portable music market.9
This
advantage allows them to set and enforce the rules of competition. Apple has
capitalized on its product differentiation, and is charging two to three times the
market price of conventional mp3 players for its iPod (A price that consumers are
more willing to pay). Competitors are struggling to offer up a product that is a
technological/innovative equivalent to the iPod, and until they can produce one
that surpasses it, they will not be able to dethrone the portable music
juggernaut. Apple is in no danger of losing market share in the short term and
has continued to pour money into its R&D to support its long-term strategy.
8
Since the release of the iPod, Apple has released the iPod Mini and the iPod
Shuffle which has tightened its grip on all areas of the portable music market.
Switching costs for the consumer are low allowing customers to flow from
product to product based on price, but Apple will continue to rely on brand
identification, differentiation, and innovation to maintain a firm grip on market
share.
In both the personal computer and portable music markets, component
costs are large part of the total hardware costs, but through Apple’s product
differentiation and higher pricing they are able to counteract the price wars that
usually ensue under such conditions. Finally, there are little to no exit barriers in
either market, which could be advantageous in ousting some of Apple’s
competition in the future.
Competitive Force 2: Threat of New Entrants
Within the personal computer market there are a few well-established
companies that consume most of the market share. These companies are: Dell,
HP Compaq, and Gateway. There are large economies of scale in the personal
computer market and this limits new entrants. A company would need to have
access to an enormous amount of capital in order to effectively compete with the
few well-established market leaders.
The large economies of scale make it
nearly impossible for new start-up companies to gain any type of significant
market share. In the personal computer market there are basically two main
operating systems offered on personal computers: Microsoft’s Windows and
Apple’s Mac OS X. A new company would have to create competitive software
that is one step ahead of the rapidly changing technological advancements
within the computer software market. Another barrier that new entrants would
have to face are legal barriers; mainly in the form of patents. The main market
leaders have numerous patents on computer designs as well as technology,
which make it extremely difficult for new entrants to enter the market without
9
large amounts of start up capital to create new and innovative advancements in
technology.
Apple is the most dominant company in the portable music market. The
portable music market is relatively new, and as a result there are a fairly large
amount of competitors. The main competitors in the MP3 sector are: Apple, Rio,
Nike, Sony, Creative, Napster, and Dell. There is more of a threat of new
entrants in the MP3/Portable Music market than there is in the personal
computer market. While portable music hardware still requires significant capital
investment to develop and produce the hardware units, the portable music
websites (i.e. Napster, iTunes) have relatively small startup costs. This leaves
Apple susceptible to new entrants who could possible steal away a portion of its
iTunes market share.
Apple is enjoying the first mover advantage in the hardware side of the
market with their iPod.
While numerous portable music players have been
released within the last 5 years, Apple was the first to combine style, usability,
and large capacity into a single unit, and because of this they are enjoying the
first mover advantage with the introduction of the iPod. Even though the iPod is
most expensive portable music player on the market, it is highly sought after by
customers because of the ground breaking technologies it employs. Customers
are pleased with the quality of Apple products thus far and they continue to look
to Apple for future innovations (iPod mini, Shuffler, and accessories). Although
this creates an obstacle for new entrants, it is possible for them to establish
themselves within the market. Due to the potentially high growth rate of this
market, it is still profitable for companies to invest the capital involved in
breaking into the market. It will be essential for companies entering the portable
music market to innovate beyond the standard set by Apple. Even though the
main market leaders already have many patents protecting their technologies,
new entrants can develop pioneering technologies due to the relatively young
nature of the market.
10
Finally, Apple should be aware of the threat of a counter culture of
customers which shy away from Apple’s products due to their dominance in the
market.
This phenomenon is best represented by the counter culture that
developed with Microsoft that led some customers to Linux. A counter culture of
this sort has not yet asserted itself into the portable music market, and is of no
immediate threat.
Competitive Force 3: Threat of Substitute Products
On the personal computing side of Apple’s market are a number of
products from various competitors. Each of these competitors has a wide range
of computing systems designed for various types of users. Dell is marketing its
Dimension line of computers for desktop users and its Inspiron line for laptop
users. Both the Dimension and Inspiron lines differ in features and power to
provide varying selections for customers with diverse needs.2 The same can be
said of Hewlett-Packard’s Pavilion/Presario desktop and laptop PCs, as well as
Gateway’s 3200/5200/7200 series desktop computers and M210/M320/M520
series laptops.3,4 It would immediately seem that Apple has a wide array of
substitutes in the market, but the proprietary nature of Apple’s products sets
itself apart from its competitors.
While HP, Dell, and Gateway each use the
Microsoft Windows operating system and an Intel/AMD based CPU, Apple’s
computers use their own in-house OSX operating system and an IBM derived
Power processor CPU. This separates the computers in how they function, which
inevitably means the software packages and overall functionality differs greatly.
While Dell, HP, or Gateway could out perform Apple in both speed and in price,
Apple has set itself apart from these other computer manufacturers by keeping
itself unique in the market and gathering around itself a loyal group of users.
Regardless of this, Apple will have to continue to stay innovative and price
conscious as new and existing computer owners begin to make the decision of
whether their new computer is a PC or a Macintosh.
11
Within the portable music market, Apple’s hard-drive based MP3 player
has many possible substitutes within the market. Some examples include the
JetAudio iAudio U2, Creative Nomad, iRiver iFP-790, and Rio Forge. These MP3
players are similar to the iPod, but are flash-memory based, meaning they
typically hold less mp3s but consequently cost less. This doesn’t seem to be
making a substantial impact on Apple’s iPod sales as buyers are getting more
mp3 capacity per dollar using the iPod and do not have to worry about
upgrading their players with additional memory cards in the future. Apple has
responded to the flash-memory based market with its recent introduction of iPod
Shuffle. However, the iPod Shuffle is a new product and it has yet to be seen if
it can capture market share away from the flash-memory units already on the
market. Finally, portable CD players and radios are still on the market, though
they pose a very small threat to the iPod as they lack the ability of storing your
music in digital mp3 files.
Competitive Force 4: Bargaining Power of Buyers
Apple focuses on differentiating its products in both the personal
computer market and the portable music product. Both the Macintosh line of
products and the iPod have a signature style and innovative features that set
them apart from their competitors. This makes buyers less price sensitive when
it comes to buying the iPod and Macintosh, as it is very difficult to find a product
that has the same features or stylish look. If customers want to avoid Microsoft
software and Intel/AMD based PCs, the only alternative would be to purchase a
Macintosh computer, creating a niche market out of Apple and in turn making
buyers less sensitive to price.
Additionally, buyers of the iPod and Macintosh computers have low
relative bargaining power considering they would have to buy in very large
volumes. There is no “Wal-Mart” of electronic stores, so there is no way for
individual resellers such as Best Buy, Circuit City, or CompUSA (to name a few)
to bully Apple into lower prices. Apple also has 98 national and 4 international
12
retail stores, in addition to its own online store carrying the full line of apple
products.6 The internet is also a huge selling point for iPod and Macintosh
products via Amazon.com and Buy.com (to name a few) with the popularity and
benefits (tax free) of at-home shopping.6 Businesses have some relative
bargaining power when it comes to purchasing Macintosh computers in bulk for
office use, but home users have literally no control over Apple when it comes to
their pricing. On a final note, once Apple sells to the end user it has essentially
secured future sales of its hardware and software due to a lack of third party
options. This gives buyers even less relative bargaining power to shop for better
prices or alternatives for their software/hardware needs.
Competitive Force 5: Bargaining Power of Suppliers
Apple uses a large variety of suppliers for manufacture of its computers
and portable music players.
In most cases, Apple is not limited to a single
supplier for the various components used in the process of assembly for its
products. This leaves Apple’s suppliers with less bargaining power concerning
price in most cases.
Apple uses both NVIDIA and ATI for video cards in its
computers, so it has two choices concerning who to go to. This is the same for
its motherboards (ASUSTeK and Ambit Microsystems), Display units (Samsung,
Toshiba, International Display Technology), storage devices (Hitachi Global
Storage Technologies, Western Digital, Seagate), and CD/DVD drives (Samsung,
Hitachi Global, and LG. Phillips Co.).5 In most of the other parts in Apple’s
Macintosh computers and iPod the situation is the same, giving Apple power to
switch suppliers if needed. The only real exception to this is its current position
with IBM and its G series processors, as moving to a new processor would have
extremely high switching costs. A customized chip would have to be created to
replace the G series processor as PC and Macintosh computers have completely
different technologies concerning the CPU.
13
Key Success Factors
Core Strengths
Apple has numerous internal strengths that make it a successful and
competitive company. For one, Apple has a powerful footing in the personal
computer market by being “different” with its innovative style and ease of use.
Its operating system is developed in house, leaving it free from the tangles of
the dominant Microsoft operating systems. This gives apple a very large degree
of control over its product in the physical appearance, specifications, and overall
usability. Apple does all this while keeping its Macintosh computers compatible
with existing PC computers.
Additionally, Apple fosters a research intensive
office environment and is constantly releasing products with the current trends
and styles as seen through its latest iPod and Mac mini. This makes Apple one
of the biggest innovators in the computer and portable music industries, being
first to bring new and creative ideas to the market.
Core Weaknesses
Due to their research intensive nature, Apple has high R&D costs, which
means that Apple is far less cost effective in a very saturated market. While they
currently hold 90% of the portable music market, Apple is constantly relying on
innovation to keep it ahead, putting the company in a risky position if its R&D
does not come through.1 Moreover, Apple has a hard time selling the Mac
computer to many customers do to the perception that the Macintosh is
incompatible with other PCs and software. In other words, customers get scared
of an operating system that looks different then windows and assume it doesn’t
work the same. While this is not true, it hinders the ability of Apple to steal
away existing PC users to grow its market share.8 Finally, Apple has problems
with some customers due to the high prices of many of their products. While
this has not hindered their sales in the portable music market yet, it can be
traced to problems within their computer market sales.
14
Market Opportunities
Within the industries that Apple
competes
opportunities for increased market share and growth.
there
are
numerous
Since Apple is already
recognized as one of the main leaders in the portable music market they have
the ability to further increase their company image and quality
image reputation. This will allow Apple to maintain their already
the personal computer market Apple is expected to sustain
substantial market share gains in 2005 because customers are
awaiting the launch of Windows Longhorn for Microsoft.7 On the
portable music side of things, it is speculated that if Apple were to
iPod Shuffler Flash Player
Provided by Apple.com
well established clientele as well as attract new customers. Within
release a flash-memory based mp3 player that its music business
would be worth close to 5 billion by 2006.9 As a final point, many speculate that
Apple’s entire line of Macintosh computers will gain market share due to the halo
effect of the iPod.11
Market Threats
There are many potential threats that Apple faces everyday. The primary
threat that they face is the rapid advancement in technology. Since most people
judge the computer on the speed (GHz) of its CPU, Apple has had a hard time
with customers considering the Macintosh inferior in
computers have begun using 64bit technology as
opposed to the PC which is still primarily using 32bit
technology.6 This has given Apple a slight edge to their
speed problem. Therefore, Apple must make sure that
they stay up-to-date and on the cutting edge of
advancements and innovations.
Image property of Napster.com
speed to the PC. Although, recently the new Macintosh
One slip in their R&D
department and Apple could lose an enormous amount of their market share.
One final note is the threat of Napster, Apple’s primary competitor to its iTunes
15
music service. Napster has begun aggressively marketing its new service which
allows unlimited music downloads which are “rented” to the mp3 unit while the
subscription is active.
This service, costing only $14.95 a month, is the first
serious challenge to iTunes 99 cent per song download business strategy.13,6
Whether or not Napster will effectively unseat Apple is yet to be seen, but shows
the vulnerability of Apple’s portable music market share.
16
Competitive Strategy Analysis
In such a highly competitive industry where superior quality and brand
image are key success factors for a computer company, it is necessary for
computer companies to become cost leaders or differentiate themselves by
offering a unique product. Apple has become known as a computer company
that has innovative and stylish computers and music players. By highly investing
in research and development, providing a variety of products, and maintaining a
unique brand image, Apple has been able to create a sustainable competitive
advantage by differentiating its personal computers and portable digital music
players.
By spending 489 million dollars on research and development alone, Apple
has been able to develop innovative products that enable them to maintain a
loyal customer base.5 Apple is known for its unique and user friendly products
like the new MAC mini, the all in one design of the eMAC and the iPod which all
appeal to the “stylish consumer.”
Introducing PC’s in various colors and
distinctive monitors have given Apple a unique image. For example, competitors
have tried to mimic the iPod but the iPod consistently beats out the competition
because of its efficiency and stylish design.
Furthermore, the multi-colored apple logo has become an unmistakable
icon. Apple has been able to build up its image in the past couple of years by its
innovative products and popular designs. This has given Apple a comparable
advantage because the apple logo is now being associated with quality and
uniqueness.
17
Accounting Analysis
Step 1: Identifying Key Accounting Policies
As a leading competitor in the personal computer market and the
dominant firm in the portable music market, Apple has maintained and gained
market share time and time again through its focus on creativity, innovation, a
high investment in research and development (R&D) and brand image.
Apple is very limited by GAAP in accurately portraying key success
factors through the use of different accounting policies. As stated previously,
Apple invests heavily in R&D and brand image (advertising), 489 million and 206
million in 2005, respectively. However, in accordance with GAAP, they are forced
to expense the costs as they are incurred, and are unable to capitalize them.
Some latitude is given in capitalizing software R&D expenses pursuant to SFAS
No. 86, which states that development costs of computer software to be sold,
leased or otherwise marketed are subject to capitalization beginning when a
product's technological feasibility has been established. However, in 2005,
capitalization of software R&D amounted to less than one percent of R&D
expenditures.
Per Apple’s notes to consolidated financial statements, management
identifies key accounting policies and estimates as those related to revenue
recognition, allowance for doubtful accounts, inventory valuations and purchase
commitments, valuation of long lived assets including acquired intangibles,
warranty costs, and income taxes. These policies are deemed important because
they are critical in the representation of the firm’s financial standing and that
they require judgments and estimates regarding events that are uncertain.
However, the stances taken on these issues reflect industry norms, and are
stated very similarly by leading competitors in the respective markets.
18
Step 2: Assessment of Accounting Flexibility
Apple has very limited accounting flexibility in capturing its key success
factors concerning research and development, brand image, and marketing. The
only flexibility in their key success factors involves a small portion of its R&D
costs being capitalized. This leaves management with few accounting policies in
which they can be flexible, which causes accounting data to be less informative
regarding the true economy of the firm.
Flexible Accounting Policies
Accounting Policy
Degree of Flexibility
Research and Development*
Minimal
Brand Image (Advertising)*
None
Inventory Policies
Moderate
Estimation of Bad Debt
Moderate to High
Amortization of Goodwill and
Moderate to High
Intangibles
*Key Success Factor
Apple currently uses a straight-line method over the estimated useful lives
of assets concerning the depreciation of property, plant, and equipment, which
are 30 years for building, 2 to 5 years for equipment, and the shorter of lease
terms of 10 years for leasehold improvements. It is of importance to note that
Apple, as of first quarter of fiscal 2002, adopted SFAS No. 142, which required
that assets with indefinite useful lives no longer be amortized, but instead use an
impairment
test
annually
or
sooner
whenever
changes
or
events
in
circumstances indicate they may be impaired. Prior to 2002, Apple amortized its
goodwill and other intangibles using the straight-line method over its estimated
useful life. This essentially gives Apple a great deal of freedom concerning the
write-off of its goodwill assets, allowing subjective manipulation of the value of
its goodwill assets and the expenses incurred by writing them off. In fact, since
19
the 2002 conversion to SFAS No. 142 Apple has found no impairment from its
annual goodwill tests held on August 30th of each year.
As far as inventory is concerned, Apple uses the industry standard of FIFO
(First In, First Out) and provisions are made currently for the difference between
cost and market value if cost of inventories exceeds their market value. Under
the FIFO method, net income is typically overstated because the less expensive
inventory is sold off first, leaving the most recently acquired higher priced
inventory in the inventory account. The only flexibility that Apple has in terms of
inventory accounting policies would be to change to a different method, perhaps
in and effort to reduce income tax liability.
Apple currently uses a flexible variety of methods for estimating its
allowance for doubtful accounts. Stated in the 10k, Apple estimates bad debt by
“historical experience with bad debts, the general economic environment, the
financial condition of the Company's distribution channels, and the aging of such
receivables”.
With such a long list of conditions to base their analysis on,
Managers have a great deal of freedom when choosing an appropriate
allowance.
Finally, Apple identifies one of its key success factors as research and
development. Unfortunately for Apple, GAAP does not allow for most research
and development costs to be capitalized, and therefore they must be expensed
as incurred. However, Apple is able to capitalize the software development costs
for the development of some its software.
This allows flexibility in choosing
which points in the development cycles are to be capitalized. The total amount
capitalized was approximately $4.5 million according to the 10k footnotes.
20
Step 3: Accounting Strategies
Apple’s accounting policies are consistent with their main competitors Dell
and HP. They recognize revenue when persuasive evidence of an arrangement
exists, delivery has occurred, the sales price is fixed or determinable, and
collection is probable5. Apple, along with their competitors, also recognizes most
expenses when they are incurred. Further, per GAAP, research and development
costs are expensed as incurred. Apple, Dell, and HP use FIFO when accounting
for inventory.
This leads to a higher stated Net Income; however, in the
computer industry this is necessary due to technology prices deflating
considerably over time. The only main difference between Apple, HP, and Dell’s
accounting strategy is when accounting for depreciation of property, plant, and
equipment. Apple and Dell consistently use straight-line depreciation based on a
30 year time frame for the depreciation of buildings, and two to five years for
equipment. Where as HP uses straight-line depreciation based on a five to 40
year time frame depending on the type of asset5. When accounting for Goodwill
and Income taxes Apple, Dell, and HP comply with SFAS No. 142 and 109,
respectively.5
A common expense manipulation deals with the estimation of warranty
expense. Historically, Apple’s warranty expense has been two percent of net
sales. This percentage is within one point of their competitors and is well within
the norm of the industry.
Within Apple, the managers could face some incentive to use accounting
strategies to manage earnings as in many publicly traded companies.
Their
stock option plans allow all employees, not only managers, the option of
purchasing stock. Steven P. Jobs (C.E.O.) and the other top managers hold a
large amount of stock in the company.5 While this could raise an initial concern,
the managers overall lack of flexibility with regard to the accounting strategy
greatly reduces their ability to use their discretion or manage earnings.
21
Additionally, diagnostics raised no red flags concerning manipulation of revenues
or expenses by management.
Apple’s accounting policies have remained consistent and unchanged
throughout the past, and any changes they made were made throughout the
industry. There have been no significant fourth quarter adjustments to revenues
or estimates on their annual report (10-K). This indicates that there is not a
substantial amount of manipulation in quarterly reports in efforts to artificially
inflate revenues or deflate expenses.
Apple deals almost entirely in-house, and by not structuring any outside
business transactions revealing that they don’t have any outside operations
aimed at achieving certain accounting objectives. Apple’s lack of special purpose
entities or other “off balance sheet” accounting practices reveals that there is
less possibility of hiding any losses or other impairments by the firm’s structure.
Step 4: Quality of Disclosure
Apple
has
demonstrated
concerning its financial statements.
that
it
lacks
considerable
transparency
While the bare minimum of disclosure is
satisfied within the various statements filed with the SEC, it is apparent that
Apple does not like to be forthcoming about the details of its operations. This is
most evident through their use of consolidated financial statements, leaving
investors and analysts searching through the footnotes to find components of
certain accounts (ex. SG&A).
The Management Discussion and Analysis section of the annual report is
included in the 10-K and is fairly adequate, including an explanation of many of
the large research and development expenses incurred during the period.
However, the information conveyed is very broad, lacking specifics such as
products, innovations, or a direction to which shareholders can look for future
assurance of growth and profitability. However, Apple has completely neglected
22
to include a Letter to the Shareholders, reinforcing the lack of transparency in
the company’s financial statements.
One final note is the company policy regarding the disclosure of
information to the public.
Questions asked of management by this valuation
committee were left unanswered due to a company wide policy prohibiting the
disclosure of any extra information to the public in general. This clearly shows
management’s unwillingness to be available to analysts and the firm’s lack of a
good investor relations program.
While it is clear Apple is not transparent in their statements, there might
be a reason for their approach to minimal disclosure. Apple could be influenced
by competitive considerations, supported by the fact that one of Apple’s key
success factors is its research and development, and brand image. Management
may feel that the disclosure of certain information could give competitors
proprietary information regarding new product lines or research being done, and
aid competitors in their business decisions.
23
Step 5: Potential Red Flags
Sales Manipulation Diagnostics
Net Sales / Cash From Sales
2000
2001
2002
Apple Computers
Dell
Hewlett Packard
1.04
1.43
1.01
.92
.99
.96
1.02
.99
1.00
2003
2004
1.03
1.00
1.01
1.00
1.03
1.02
1.6
1.4
1.2
1
0.8
0.6
0.4
0.2
0
2000
2001
Apple Computers
2002
2003
Dell
2004
Hew lett Packard
The data above for Net Sales / Cash From Sales are relatively constant
over the last 5 years and raise no concern.
24
Sales Manipulation Diagnostics
Net Sales / Net Accounts Receivable
2000
2001
2002
2003
Apple Computers
Dell
Hewlett Packard
8.38
9.69
7.64
11.51
13.16
10.08
10.16
13.74
6.69
8.10
13.69
8.19
2004
10.69
11.4
7.81
16
14
12
10
8
6
4
2
0
2000
2001
Apple Computers
2002
Dell
2003
2004
Hew lett Packard
After analyzing the Net Sales / Net Accounts Receivable ratio, there is no
need for concern as the industry seems to follow no particular trend in
their numbers.
All of the above ratios stay within a given range
depending on the company.
25
Sales Manipulation Diagnostics
Net Sales / Unearned Revenue
2000
2001
2002
Apple Computers
Dell
Hewlett Packard
76.03
132.97
27.78
29.15
121.71
24.22
23.39
96.80
17.36
2003
2004
16.87
98.34
29.27
15.22
98.40*
27.01
*Estimated due to consolidation of Unearned Revenues and Warranty Liabilities
140
120
100
80
60
40
20
0
2000
2001
Apple Computers
2002
2003
Dell
2004
Hew lett Packard
The above analysis for Net Sales / Unearned Revenue shows no concern
as the ratio is moving in a downward trend.
26
Sales Manipulation Diagnostics
Net Sales / Warranty Liabilities
2000
2001
2002
2003
Apple Computers
Dell
Hewlett Packard
73.92
80.72
50.02
61.64
68.28
50.53
83.22
70.20
36.56
92.64
52.53
51.71
2004
78.85
52.59*
53.48
*Estimated due to consolidation of Unearned Revenues and Warranty Liabilities
100
90
80
70
60
50
40
30
20
10
0
2000
2001
Apple Computers
2002
2003
Dell
2004
Hew lett Packard
The ratio Net Sales / Warranty Liabilities has no particular trend line
associated with it, but the 2004 decrease causes no concern as it is
moving downward. However, there might be some concern that the rest
of the industry has flattened out and Apple is still changing.
27
Sales Manipulation Diagnostics
Net Sales / Inventory
2000
2001
2002
Apple Computers
Dell
Hewlett Packard
241.91
64.62
8.58
487.55
79.72
8.69
127.6
112.12
9.76
2003
2004
110.89
115.7
12.04
81.97
126.24
11.30
600
500
400
300
200
100
0
2000
2001
2002
Apple Computers
2003
Dell
2004
Hew lett Packard
Apple’s ratio for Net Sales / Inventory has changed drastically over the
last 5 years, and can be attributed to its growing sales. Apple is probably
bulking up in inventory in preparation for new releases such as the many
new announced iPod products.
We see this as no cause for concern,
especially considering the downward nature of the trend.
28
Core Expense Manipulation Diagnostics
Asset Turnover (Sales / Assets)
2000
2001
2002
Apple Computers
Dell
Hewlett Packard
1.17
2.20
1.44
.89
2.33
1.39
.91
2.01
.80
2003
2004
.91
2.29
.98
1.03
2.15
1.05
2.5
2
1.5
1
0.5
0
2000
2001
Apple Computers
2002
2003
Dell
2004
Hew lett Packard
The data above for Asset Turnover is relatively constant over the last 5
years.
The upward motion at the end of 2004 indicates no cause for
concern.
29
Core Expense Manipulation Diagnostics
Change in Cash Flows From Operations / Operating Income
2000
2001
2002
2003
2004
Apple Computers
Dell
Hewlett Packard
.43
6.87
2.97
.79
.67
.44
.27
.45
-1.17
-11.11
-.2
.16
1.97
.19
-.73
8
6
4
2
0
2000
2001
2002
2003
2004
-2
-4
-6
-8
-10
-12
-14
Apple Computers
Dell
Hew lett Packard
From looking at the Change in Cash Flows From Operations / Operating
Income, Apple’s numbers shows a relatively safe trend excluding its 2003
fiscal year. During 2003, Apple had an operating income (loss) of $(1)
million causing the sharp dip in the numbers. From 2003 to 2004 the
trend is both upwards and relative to its 2000-2002 numbers, leaving no
cause of concern.
30
Core Expense Manipulation Diagnostics
Total Accruals / Change in Sales
2000
2001
2002
Apple Computers
Dell
Hewlett Packard
.04
.18
.02
.08
.31
-.59
.06
-3.54
.559
2003
2004
.47
.33
.214
.32
.17
.232
1
0.5
0
2000
2001
2002
2003
2004
-0.5
-1
-1.5
-2
-2.5
-3
-3.5
-4
Apple Computers
Dell
Hew lett Packard
The above analysis of Total Accruals / Change of Sales shows a jump
upward in 2003, and then a relative drop in 2004. The volatile nature of
the data can be primarily attributed to an operating loss during 2003 and
then in a surge of sales during 2004. More sales is obviously going to
mean more accruals, so we see no need for concern regarding the above
data.
31
Core Expense Manipulation Diagnostics
Pension Expense / SG&A
2000
2001
2002
Apple Computers
Dell
Hewlett Packard
.01
.02
.02
.02
.01
.02
.02
.01
.04
2003
2004
.02
.01
.03
.02
.01
.04
0.045
0.04
0.035
0.03
0.025
0.02
0.015
0.01
0.005
0
2000
2001
Apple Computers
2002
2003
Dell
2004
Hew lett Packard
The numbers above are relatively constant over the last 5 years and raise
no concerns. Apple uses a defined contribution retirement plan, leaving
the liability on the shoulders of the employee and not the company. They
are not required to make estimates since they match employee
contributions that change every fiscal year.
32
Step 6: Undo Accounting Distortions
After a careful review of Apple’s financial statements and accounting
policies, along with an analytical dissection of the sales and core expense
manipulation diagnostics, we feel the available information has no accounting
distortions that must be corrected. Apple did have a few accounting policies by
which it could be flexible in its reports, but none of these were used to
exaggerate or understate any part of the financial statements.
33
Ratio Analysis and Forecast Financials
This section will include financial ratio analysis for Apple as well as
provide forecasted financial statements for the upcoming ten years. The ratios
will supply the overall profitability, liquidity (short-term solvency), and capital
structure (long-term solvency) for Apple. The major purpose of using financial
data in ratio form is making the results comparable across firms and over time by
controlling for size.
After computing the selected ratios, we will be able to
compare Apple to its top competitors within the technology industry, and against
the overall industry average.
Ultimately, these ratios will act as a guide in
assessing Apple's financial position and state of operations. This ratio analysis of
Apple’s past and present performance will also provide the foundation for making
forecasts of future performance14.
Analysis of these ratios is important to
numerous parties, but for our purposes, it will provide current and potential
investors valuable information not so easily derived or transparent in the financial
statements.
In addition to the standard fourteen ratios used for computing
profitability, liquidity, and capital structure we also included a Research and
Development turnover ratio, which will gauge Apple's utilization of one of its key
success factors.
This section will further provide investors with a realistic approximation of
Apple’s future performance as well as an accurate assessment of the previous
trends and oscillations within the industry. This information will give current and
perspective investors a cross-sectional comparison. By doing this investors will
be able to see exactly how Apple is performing in comparison to their
competition, and see how Apple is predicted to perform during the upcoming ten
years.
34
Trend Analysis
Sales Growth
Sustainable Growth Rate
Liquidity Analysis
Current Ratio
Quick Asset Ratio
Inventory Turnover
Days supply of inventory
Accounts Receivable Turnover
Days supply of receivables
Working Capital Turnover
Profitability Analysis
Gross Profit Margin
Operating Expense ratio
Net Profit Margin
Asset Turnover
Return on Assets
Return on Equity
2000
19.14%
2001
-32.82%
-.64%
2002
7.07%
1.59%
2003
8.10%
1.63%
2004
33.38%
5.44%
2.81
2.58
176.27
2.07
8.38
43.57
2.28
3.39
3.16
375.27
0.97
11.51
31.72
1.48
3.25
2.96
91.98
3.97
10.16
35.92
1.54
2.50
2.26
80.34
4.54
8.10
45.04
1.76
2.63
2.33
59.60
6.12
10.70
34.12
1.89
27.13%
20.59%
9.85%
1.17
11.55%
19.14%
23.03%
29.44%
-0.47%
0.89
-0.42%
-0.64%
27.92%
27.62%
1.13%
0.91
1.03%
1.59%
27.52%
27.53%
1.11%
0.91
1.01%
1.63%
27.29%
23.35%
3.33%
1.03
3.43%
5.44%
0.66
53
2.89
0.54
-2.25
.584
0.54
8.9
.28
0.61
12.5
.95
0.59
128.67
0
4.8%
8.0%
7.8%
7.6%
5.9%
Capital Structure Analysis
Debt to equity ratio
Times Interest Earned
Debt Service Margin
R&D Turnover
Liquidity / Operating Efficiency Analysis
The liquidity ratios will provide information indicating whether or
not Apple will be able to pay off short term obligations through the use of its
current assets. Apple is strong in terms of its basic liquidity analysis. Concerning
the Current and Quick Assets ratios, Apple has the means to meet its short term
obligations, and has consistently met the "golden standard" sought by banks. We
conclude that the firm's numbers are very satisfactory, and give them an overall
good short term solvency rating.
Operating efficiency (working capital management) ratios provide insight
35
into Apple' cash to cash cycle. More specifically, how efficiently Apple is able to
convert inventory into sales, sales into payment, and use working capital to
generate sales. Inventory turnover has been decreasing over time, which is not
a favorable trend, but is suspected to be due to the increase of demand, sales,
and new products launches.
Furthermore, accounts receivable turnover has
been fluctuating within reasonable means, showing no indication of a trend in
either direction. However, in 2004 they collected on accounts receivables much
more efficiently than in the previous year. The cash to cash cycle in 2004 was
approximately 40 days. Lastly, Working capital has been growing steadily since
2001, which is a favorable trend with more sales dollars being generated per
dollar of working capital. This is a good indication of growth and liquidity.
With the exception of inventory turnover, Apple shows favorable numbers
in terms of liquidity analysis.
The company is both able to meet short term
obligations and has been steadily recovering its receivables.
While inventory
could be a concern, it is our opinion that the ratio is a reflection of increased
sales and growing stockpiles of inventory precluding the release of new products.
Profitability Analysis
Profitability ratios will demonstrate Apple's ability to earn satisfactory
profits, so that investors and shareholders will continue to provide capital. Apple
is strong in terms of its profitability and trends indicate stability, and increased
efficiencies in some areas. Much of their success in the arena of profitability can
be credited to product differentiation and pricing strategy.
As mentioned
previously Apple is one of the few computer companies who have been profitable
of recent. The gross profit margin for Apple has been relatively steady since
2001, showing no concerns for an increased cost of goods.
The operating
expense ratio shows what portion of sales is used for operating expenses. The
ratio has been consistently declining, which is a favorable trend, suggesting that
smaller portions of sales are consumed by operating expenses.
Net profit margin demonstrates how much of each sales dollar is left over
36
after all expenses have been paid. Apple's ratio hit a low in 2001, but since
then, there has been an increasing trend in net profit margin.
Finally, Apple has been slowly increasing the ratios concerning asset
turnover, return on assets, and return on equity. These increases are favorable,
showing the companies ability to increase its earnings in proportion to the overall
investment in the company.
Capital Structure Analysis
Capital structure (gearing) ratios are used to assess the finance risk of a
business (long term solvency). Capital Structure refers to the different ways in
which a company raises the capital needed to establish and grow it business
activities.
Apple, per the ratio numbers above, has been moving towards a
capital structure that primarily uses equity as the means to finance operations.
In 2004, Apple paid off all long term debt, essentially making equity the sole
source of capital for the company. This allows the classification of Apple as low
geared and solvent (long term). This lends itself flexibility in acquiring long term
debt if required to finance future operations.
Other Observations
Some additional ratios were analyzed concerning apple and the industry to
better represent some of the key success factors identified in previous
assessments. R&D turnover is a very important number for Apple, as they have
stated through the 10-K their focus on creativity, and research and development.
The numbers above reflect this focus, as Apple has continually brought in a very
favorable ratio concerning its R&D costs relative to its overall sales.
37
Cross Sectional Analysis
The purpose of the cross sectional analysis is to add value to the meaning of the
ratios derived in the previous section. Analyzing the ratios independent from
competition and industry averages will provide very limited information to the
investor, and could result in erroneous decisions. In order to accurately gauge
the firm's financial position and operating performance they must be compared
to competitors and industry averages over the same periods of time. For
example, if Apple's gross profit margin declined steeply in one year, it may not
be a cause for concern if that decline reflected the status quo amongst other
competitors in the industry.
38
Sales Growth
Apple
Dell
HP
Gateway
Competitor Avg
2001
-32.8%
26.2%
-7.5%
-35.8%
-5.70%
2002
7.0%
-2.3%
25.0%
-29.8%
-2.37%
2003
8.1%
13.6%
29.0%
-18.4%
8.07%
2004
33.4%
17.1%
9.4%
7.3%
11.27%
40.00%
30.00%
20.00%
10.00%
0.00%
2001
2002
2003
2004
-10.00%
-20.00%
-30.00%
-40.00%
Apple
Dell
HP
Gatew ay
Competitor Avg
Sales growth is an excellent indicator of how well a company is performing in its
industry as well as its ability to capture new market share. A close look at the
competitor’s numbers show a battle in sales growth between Dell, HP, and
Gateway. It is of particular interest to note that strong gains in one company
usually resulted in a loss or smaller gain in a competitor. This can be credited to
these companies fighting over a market that is already primarily saturated.
Apple does not seem to be effected by the earnings of its competitors, as shown
in its steady growth from 2002 to present. This is a result of Apple’s computer
products capturing a niche market and its portable music products entering a
market experiencing rapid growth. While Apple’s numbers seem to be increasing
significantly for now, it is very possible that with the saturation of the portable
music market that Apple’s numbers could slump in the not so distant future.
39
Current Ratio
Apple
Dell
HP
Gateway
Competitor Avg
2000
2.81
1.00
1.61
1.25
1.29
2001
3.39
1.05
1.48
1.67
1.40
2002
3.25
1.43
1.53
2.08
1.68
2003
2.50
1.48
1.53
1.85
1.62
2004
2.63
1.03
1.51
1.37
1.30
4
3.5
3
2.5
2
1.5
1
0.5
0
2000
2001
Apple
Dell
2002
HP
2003
Gatew ay
2004
Competitor Avg
Over the past five year Apple’s current ratio has been declining. However,
their current ratio has remained considerably higher than their competitors, who
have all failed to meet the "golden standard". It is evident that even though
Apple’s current liabilities have been increasing their current assets remain strong
enough to cover them, and keep Apple’s current ratio higher than their
competition.
40
Quick Asset Ratio
Apple
Dell
HP
Gateway
Competitor Avg
2000
2.58
.96
1.37
1.07
1.13
2001
3.16
1.01
1.25
1.55
1.27
2002
2.96
1.38
1.15
1.99
1.51
2003
2.26
1.40
1.15
1.75
1.43
2004
2.33
.95
1.25
1.18
1.13
3.5
3
2.5
2
1.5
1
0.5
0
2000
2001
Apple
Dell
2002
HP
2003
Gatew ay
2004
Competitor Avg
As with their current ratio, Apple’s quick ratio has been declining over the
previous five years, but it has remained consistently higher than their
competitors and the industry average. It peaked in 2001 and has been declining
until 2003. However, the most recent year is shows an increase the ratio. This
is due to Apple's great success with its introduction of new innovative products
into the market, and is now experiencing an increase in their quick assets: cash,
accounts receivable, and securities.
41
Inventory Turnover
Apple
Dell
HP
Gateway
Competitor Avg
2000
176.27
94.95
8.85
17.03
40.28
2001
375.27
92.31
7.14
25.75
41.73
2002
91.98
63.61
6.39
40.62
36.87
2003
80.34
51.27
6.11
42.40
33.26
2004
59.60
126.74
11.3
23.94
53.99
400
350
300
250
200
150
100
50
0
2000
2001
Apple
Dell
2002
HP
2003
Gatew ay
2004
Competitor Avg
Apple’s inventory turnover has sharply declined since 2001.
A probable
explanation of the sharp decline experienced by the Apple can be associated with
the state of the economy at the time. Post September 11, 2001, the economy
was experiencing recession.
Apple who specializes in differentiated, higher
priced goods, was unable to convert inventory into sales, resulting in a longer
inventory turnover period and the large decline. Also the costs associated with
holding inventory will have increased the cost of goods sold. As the economy has
begun to pick up, Apples ratio has begun leveling off, and is more reflective of
the industry norms. However, it still is declining, albeit at a much slower rate.
This can be attributed to the increased demand for Apple products, and our
assumption is that they are deliberately increasing inventory levels in preparation
for new product launches.
42
Accounts Receivable Turnover
Apple
Dell
HP
Gateway
Competitor Avg
2000
8.38
13.69
8.19
10.67
10.85
2001
11.51
13.74
6.69
16.19
12.21
2002
10.16
13.16
10.08
21.09
14.78
2003
8.10
9.69
7.64
26.99
14.77
2004
10.70
11.4
3.7
17.62
10.91
30
25
20
15
10
5
0
2000
2001
Apple
Dell
2002
HP
2003
Gatew ay
2004
Competitor Avg
Over the past five years Apple’s accounts receivable turnover has been
fairly consistent with respect to how the industry has been performing. From
2002 to 2003 Apple was below the industry average, suggesting that competitors
were collecting on their accounts receivables faster. However, 2 out of the 3
competitors also experienced declines in their A/R turnover, and Gateway's high
increase in receivables turnover resulted in a less reflective industry average.
From 2003 to 2004 apple had the largest increase in improving their A/R
turnover, while Gateway suffered the largest decline in A/R turnover. Apple and
Dell, the two more profitable companies of recent have A/R turnover ratios
similar to the industry average in 2004, with day sales outstanding of 34 and 32,
respectively.
43
Working Capital Turnover
Apple
Dell
HP
Gateway
Competitor Avg
2000
2.28
N/A
4.72
13.18
8.95
2001
1.48
87.06
4.81
5.12
32.33
2002
1.54
10.82
6.16
4.11
7.03
2003
1.76
10.15
6.07
6.08
7.43
2004
1.89
-158
6
15.79
10.90
100
50
0
2000
2001
2002
2003
2004
-50
-100
-150
-200
Apple
Dell
HP
Gatew ay
Competitor Avg
Apple’s working capital turnover has been increasing at a small rate over
the past five years. They experienced a dip in 2001 due to the state of the
economy (decrease in sales), but have been climbing ever since. They have been
operating rather consistently, where as the industry has seemed to be extremely
volatile over the previous years. Apple’s 2004 numbers are favorable in terms of
the direction the trend of moving and the steady increase relative to years past.
While this number still below industry average, Apple has been continuing to pay
off liabilities (eliminate debt), which, coupled with growing sales, will mean
continued growth of this ratio in future fiscal years.
44
Gross Profit Margin
Apple
Dell
HP
Gateway
Competitor Avg
2000
27.13%
17.93%
26.57%
8.41%
17.64%
2001
23.03%
17.67%
26.86%
13.62%
19.38%
2002
27.92%
20.21%
26.46%
13.57%
20.08%
2003
27.52%
20.65%
28.76%
14.12%
21.18%
2004
27.29%
18.20%
24.70%
21.45%
21.45%
35.00%
30.00%
25.00%
20.00%
15.00%
10.00%
5.00%
0.00%
2000
2001
Apple
Dell
2002
HP
2003
Gatew ay
2004
Competitor Avg
Apple’s gross profit margin has been consistently around 27% during the past
five years with the exception of 2001, where it dropped to 23.03% due to the
decreased sales and increased costs of inventory. Overall Apple has enjoyed
higher profit margins as a result of their pricing strategy, not as a result of cost
control measures (materials, labor, and overhead). This is primarily a reflection
of its key success factors being geared towards creativity and innovation.
45
Operating Expense Ratio
Apple
Dell
HP
Gateway
Competitor Avg
2000
20.59%
9.90%
22.60%
24.91%
19.14%
2001
29.44%
11.93%
25.07%
28.76%
21.92%
2002
27.62%
11.85%
23.28%
25.83%
20.32%
2003
27.53%
11.70%
20.53%
34.05%
22.09%
2004
23.35%
10.13%
20.56%
21.45%
17.38%
40.00%
35.00%
30.00%
25.00%
20.00%
15.00%
10.00%
5.00%
0.00%
2000
2001
Apple
Dell
2002
HP
2003
Gatew ay
2004
Competitor Avg
Dell clearly has the upper hand in the area of operating expenses. They
are the masters of Just In Time manufacturing, which is responsible for their
very low operating expense ratio.
Apple has consistently had an operating
expense ratio higher than its competitors and that of the industry average.
Although this could be viewed as a bad sign, (excluding Dell) Apple deviates
from the ratios of its competitors only by a few percentage points in 2004. Also,
the effects of their increased operating expenses are somewhat counteracted
once again, by its pricing strategy. Over the last five years the trend amongst
Apple along with most of its competitors has been a decreasing ratio. If Apple
were to implement stricter cost control measures and decrease its overall
expenses, it could easily translate into Apple having the highest net profit
margins in the industry. (A portion of Apple’s elevated operating expenses can
be accredited to its high R&D costs, a key success factor for Apple).
46
Net Profit Margin
Apple
Dell
HP
Gateway
Competitor Avg
2000
9.85%
5.99%
3.48%
-15.55%
-2.03%
2001
-0.47%
4.00%
-1.60%
-15.13%
-4.24%
2002
1.13%
6.83%
.90%
-7.14%
0.20%
2003
1.11%
6.59%
7.56%
-16.96%
-0.94%
2004
3.33%
6.30%
5.15%
2.52%
4.66%
15.00%
10.00%
5.00%
0.00%
2000
2001
2002
2003
2004
-5.00%
- 10.00%
- 15.00%
-20.00%
Apple
Dell
HP
Gatew ay
Competitor Avg
Apple’s net profit margin has been increasing since 2001, and tripled from
2003 to 2004. Once again Dell's methodical control of expenses is illustrated
through their high net profit margin. Apple's high operating expenses results in
them having a lower net profit margin than most of its competitors. However, in
2004, Apple's operating expenses ratio was approximately 13 percentage points
higher than Dell's, yet there is only a 3 percentage point difference in their net
profit margin.
This is a direct result of Apple's superior gross profit margin.
Apple is in a growth phase, and is utilizing a philosophy of get big fast, and then
decrease operating expenses. Also, from 2003 to 2004, as net profit margins of
Apple's main competitors decreased, Apple's tripled.
47
Asset Turnover
Apple
Dell
HP
Gateway
Competitor Avg
2000
1.17
2.29
.98
2.06
1.78
2001
0.89
2.30
.80
1.68
1.59
2002
0.91
2.33
1.39
1.66
1.79
2003
0.91
2.20
1.44
1.99
1.88
2004
1.03
2.15
1.05
2.30
1.83
2.5
2
1.5
1
0.5
0
2000
2001
Apple
Dell
2002
HP
2003
Gatew ay
2004
Competitor Avg
Apple’s asset turnover is important as an increase in the ratio can directly effect
the maximum sustainable growth, yielding higher growth rates in the future.
While the ratio is growing slowly, which is a positive indicator, Apple has very
low numbers compared to the competitor average. Additionally, companies with
high profit margins tend to have low asset turnover, which can help explain why
Apple’s numbers are below industry norms.
48
Return on Assets
Apple
Dell
HP
Gateway
Competitor Avg
2000
11.55%
13.72%
3.40%
-32.04%
-4.97%
2001
-0.42%
9.21%
-1.28%
-25.38%
-5.82%
2002
1.03%
15.93%
1.25%
-11.86%
1.77%
2003
1.01%
14.52%
10.87%
-33.72%
-2.78%
2004
3.43%
13.50%
5.21%
5.78%
8.16%
20.00%
10.00%
0.00%
2000
2001
2002
2003
2004
- 10.00%
-20.00%
-30.00%
-40.00%
Apple
Dell
HP
Gatew ay
Competitor Avg
Apple’s return on assets ratio is an indication of the company’s struggle to
recover from a history of losses. The ratio itself shows how well Apple is utilizing
its assets after costs are figured in. Dell, the current cost leader in the industry,
has glowing numbers which represent what Apple should be striving to achieve
in this ratio. While the 2003 to 2004 change in numbers is a positive movement
for Apple, there is much work to be done in the cost side to improve this ratio up
to par with the likes of Dell.
49
Return on Equity
Apple
Dell
HP
Gateway
Competitor Avg
2000
19.14%
43.55%
6.73%
-231.65%
-60.46%
2001
-0.64%
26.54%
-2.49%
-71.30%
-15.75%
2002
1.59%
38.72%
2.98%
-23.88%
5.94%
2003
1.63%
31.39%
26.02%
-64.36%
-2.32%
2004
5.44%
45.10%
9.92%
10.14%
21.72%
100.00%
50.00%
0.00%
2000
2001
2002
2003
2004
-50.00%
- 100.00%
- 150.00%
-200.00%
-250.00%
Apple
Dell
HP
Gatew ay
Competitor Avg
Return on Equity shows how effectively a company is at using investors’
money.
Again, Dell has glowing numbers in this respect due to its cost
leadership, leading the industry with a 37.06% average over the last 5 fiscal
years. Apple is only a fraction of Dell’s numbers, with its highest recent return
on equity at 5.44%. While this could be perceived as dismal, Apple was able to
keep its ratio positive in many of the years the industry was suffering from major
losses. Overall, the positive movement in the last two years is a good indicator
of Apple’s business strategy moving forward with relative success.
50
Debt to Equity Ratio
Apple
Dell
HP
Gateway
Competitor Avg
2000
0.66
2.17
.98
6.23
3.13
2001
0.54
1.88
.95
1.54
1.46
2002
0.54
1.43
1.36
0.86
1.22
2003
0.61
1.16
1.39
0.79
1.11
2004
0.59
2.08
1.03
0.76
1.29
7
6
5
4
3
2
1
0
2000
2001
Apple
Dell
2002
HP
2003
Gatew ay
2004
Competitor Avg
Debt to equity ratio demonstrates the extent to which a firm’s capital
structure is financed through debt. Excessive use of debt will result in larger
ratios, indicating a higher risk due to a lack of overall solvency. Equity holders
are also threatened by larger ratios, as the firm will be obligated to pay higher
interest payments to debt owners rather than increasing shareholder wealth.
Apple’s numbers are relatively good as there is little debt compared to the overall
equity in the company. This means most of the company is financed through
equity. Apple significantly beats the competitor average in all recent years in its
debt to equity ratio. If necessary, Apple is allowed more flexibility in acquiring
more debt if needed to finance operations.
51
Times Interest Earned
Apple
Dell
HP
Gateway
Competitor Avg
2000
53
73.01
10.45
-72.72
27.62
2001
-2.25
68.96
-4.77
-491.25
-155.06
2002
8.9
179.06
N/A
-39.65
27.65
2003
12.5
267
N/A
N/A
67.56
2004
128.67
278.81
23.08
N/A
145.05
400
300
200
100
0
2000
2001
2002
2003
2004
-100
-200
-300
-400
-500
-600
Apple
Dell
HP
Gatew ay
Competitor Avg
Times Interest Earned ratio indicated the extent to which earnings are
available to meet interest payments on debt. Business that can keep current on
interest payments can possibly refinance principal and maintain the confidence of
creditors. Additionally, firms with a lower ratio are vulnerable to increases in
interest rates.
Dell sets the benchmark for other companies in the industry,
consistently keeping its TIE ratio very high. Apple’s numbers previous to 2004
were mediocre at best, but with its high and growing sales, Apple’s times interest
earned ratio is increasing and is expected to increase further.
Regardless of
ranking, Apple’s ability to cover interest payments is more than adequate as to
not raise any concern. With its latest ratio, creditor confidence in Apple should
be high and allow debt to be secured at lower-risk interest rates.
52
Debt Service Margin
Apple
Dell
HP
Competitor Avg
2000
2.89
7.73
2.38
5.06
2001
.584
8.24
1.49
4.87
2002
.28
7.30
3.04
5.17
2003
.95
6.99
5.07
6.03
2004
0
7.30
2.03
4.53
*Gateway excluded due to lack of sufficient financial data
9
8
7
6
5
4
3
2
1
0
2000
2001
Apple
2002
Dell
2003
HP
2004
Competitor Avg
Debt Service Margin is an indicator of how well a company can pay off its
short term notes payable. As seen above, the cash flows generated by Apple are
meek in terms of being able to pay off its long term obligations through the
years of 2001 to 2003. Dell, again, succeeds in leading the industry with a 7.51
average over the past 5 fiscal years.
While this could be of great concern,
showing a weakness in Apple’s ability to meet the current portion of its long term
obligations, its recent 2004 ratio indicated no notes payable on the books. This
is probably a result of Apple’s increasing use of equity to finance operations
instead of debt. While the lack of notes payable in 2004 leaves no negative
impact on Apple, the previous years show that Apple could have trouble paying
off its short term obligations if long term debt were acquired.
53
R&D Turnover
Apple
Dell
HP
Gateway
Competitor Avg
2000
4.8%
1.2%
.5%
N/A
.85%
2001
8.0%
1.1%
.6%
N/A
.85%
2002
7.8%
1.5%
.6%
N/A
1.05%
2003
7.6%
1.3%
.5%
N/A
.9%
2004
5.9%
1.1%
.4%
N/A
.75%
*Gateway reported having R&D expenses of less than 1% of net sales. No specific figures were given.
9.00%
8.00%
7.00%
6.00%
5.00%
4.00%
3.00%
2.00%
1.00%
0.00%
2000
2001
Apple
2002
Dell
2003
HP
2004
Competitor Avg
R&D Turnover is an important representation of Apple’s key success factor
as compared to its primary competitors.
emphasis Apple places in its R&D.
The numbers above illustrate the
Beating out every competitor in large
multiples, Apple proves in its numbers that it is a company devoted to its belief
in innovation. Apple has recently shown that its R&D philosophy can and will pay
off, as indicated by its 33% sales growth in 2004 due particularly to its
innovative and differentiated product launches.
While its R&D strategy is
working in the short term, high costs in this area have led to Apple’s higher
expense ratio and lower profit margins. It is the company’s belief that its high
investment in R&D will counteract the increased operating expenses through
increased revenues and high gross profit margins.
54
Forecast Methodology
See: Appendix A – D
Sales Growth:
The forecasting method for sales growth was a
combination of different elements. We considered the overall sustainable
growth rate of the company, which was very meager, along with its
growing asset turnover rate and sales boom following the release of the
iPod in 2004.
Additionally, information released in the Q1 2005 10-Q
showed 3.9 billion in sales and Q2 earnings estimated at 3.16 billion.
Using decreased estimates for Q3 and Q4 earnings, along with careful
analysis of the ratios mentioned above, it was concluded that there would
be a 25% growth in sales in 2005 followed by a decreased growth in the
following years down to 7% in 2014. The further out we forecast, the
less certain we can be about the accuracy.
The stability of the
environment is a key factor in determining the future sales growth, as
seen in the instability of Apple, among other competitors in the industry,
during the 2000-2001 economic recession. Apple is especially sensitive
due to the fact they specialize in higher cost goods.
Although Apple is currently engaged in selling in a relatively
untapped portable music market, it is felt that profits will begin to level off
within 2-4 years. This is the logic behind the drop to 16% sales growth in
2009 continuing into 2014. We feel this estimate best represents Apple’s
sales growth following the end of the portable music boom. While Apple
will lose significant growth when the portable music market becomes
saturated, the iPod halo effect is likely to carry customers to Apple’s other
products; generating future profits in goods other than the iPod.
55
Liquidity Analysis
An average of the current ratio for the past 5 years was used in
forecasting the next 10 years. This is accurate in the fact that the current
ratio has shown no historical trend in moving a particular direction. The
same methods were utilized in the computation of the quick asset ratio
forecast.
Operating Efficiency Analysis
For the operating efficiency ratios, some of the outlying numbers had to
be removed to facilitate an accurate forecast. The years 2000 and 2001
were removed in average calculations due to the boom and bust of the
economy related to those time periods. Additionally, the ratios analyzed
were not expected to grow over time, but instead settle at an average.
Therefore, a 3 year average was used on the inventory turnover, accounts
receivable turnover, and working capital turnover forecasts.
Profitability Analysis
Concerning the gross profit margin and operating expense ratios, it was
felt that they were best forecasted using a 5 year average. The numbers
in these ratios, overall, remained relatively constant and there is no
indication that they would subject to any major changes during the
forecasted years. This is assuming that Apple does not change its core
business strategy from differentiation to cost leadership. If such a change
were to occur, these ratios would change substantially.
Net profit margin was projected using the last available ratio in
2004. The logic encompassing this decision stems from the inability to
predict Apple’s future policies regarding cost control.
The 2004 ratio
seems to be a benchmark for future years. Apple’s 2004 performance is
reflective of what is believed to be the status quo for the foreseeable
future. The success of the iPod has shifted Apple into innovating new
56
products, not necessarily making existing products cheaper. This would
mean a relatively stable net profit margin in the future.
Asset turnover, return on equity, and return on assets were all
calculated using a 3 year average. This assumption was made in belief
that these ratios will go unchanged over time under the current operating
strategy Apple is employing.
ROE and ROA traditionally and over
extended periods of time are not very volatile.
Capital Structure Analysis
In general, these ratios are a direct result of corporate policy. Debt to
Equity was forecasted using a 5 year average due to the stability of the
numbers over the past 5 fiscal years. However, times interest earned and
debt service margin were not forecasted due to the fact they cannot be
accurately predicted because of their direct link to management decision
concerning capital structure. In 2004, Apple paid off all of its long term
debt, which suggests that the company desires operations and growth to
be financed by equity and not debt.
R&D Turnover
The amount of funding devoted to research and development is
determined by corporate policy rather than demand or sales volume.
However, historical data suggests that Apple devotes more to research
and development during periods of low sales growth. Per sales growth
forecasts, this would suggest that R&D would be estimated to be a lower
percentage of sales in future years due to high sales growth. R&D was
projected to be 5.35% in future years, which is an average of the two
years in which Apple experienced its highest sales growth.
While we
foresee this number changing slightly in the future, there is no indication
that future R&D costs would deviate far from the above average.
57
Forecast of Financial Statements
Income Statement (Appendix A)
Forecasting of the Income statement was done utilizing a combination of
the forecasting assumptions along with other mathematical methods. For
net sales, the forecasted sales growth was applied to each year following
2004. The gross profit was projected out to 2014 using the forecasted
gross profit margin from the forecasting assumptions. This then left the
cost of sales to be the difference between the net sales and gross profit
for each of the respective forecasted years.
Research and development was projected out using a 3% growth rate,
SG&A was projected using a 7% growth rate, and total operating
expenses was projected using a 13% growth rate. Each of these
projections was calculated by finding the average growth throughout the
5 year series (2000-2004).
Operating income and income before taxes were calculated by finding the
difference between the projected gross profit and total operating
expenses.
Provision for income taxes was calculated using the average percent taxed
in the previous years.
Net income was found by finding the sum of the relevant projections.
Balance Sheet (Appendix B)
Total current assets were projected to 2014 using a straight 85% growth
rate. All of the line items within current assets were projected using their
relative proportions found from the previous years.
Total assets were found using a straight growth rate calculated by finding
the average of the previous 5 years. Total non-current assets were then
calculated by finding the difference between total assets and total current
assets.
58
Total liabilities and stockholders equity were calculated using the debt to
equity and current ratio forecasted assumptions. The remaining line items
were then calculated using the sum and differences of these forecasts.
Statement of Cash Flows (Appendix C)
Cash flows from operations were found by using the projected operating
income from the income statement and applying a forecasted cash flow
from operations percentage from the forecasting assumptions sheet.
Cash flows from investment activities were found by finding the change in
the PP&E and other assets projected in the balance sheet.
Explanation to Numbers Not Forecasted
The various numbers in the balance sheet, income statement, and
statement of cash flows that were left unforecasted were done so due to
the inability to accurately forecast the numbers. An example would be
restructuring costs, which is clearly unable to be forecasted along with
being a very small percentage of the larger income statement elements.
Limitations to Forecasts
In determining these forecasts, historical data was used to extrapolate the
future.
The underlying assumption of all the techniques applied is that the
forces responsible in creating the past will continue to operate in the future.
This assumption is most valid in short and medium term forecasts, but becomes
less accurate in long term forecasting.
If Apple were to change its modus operandi regarding cost leadership and the
use of debt in financing future operations, profitability and capital structure
forecasted ratios will deviate greatly from the numbers current projected. While
there is no suggestion that Apple will change its policy regarding these issues
anytime soon, it is a significant weakness in the long term forecasts.
One final note is the volatile nature of the portable music industry. With
Apple garnering most of its growth and profits from its entrance and success in
the portable music industry, Apple will have to continue to maintain its leadership
59
in this market to continue the projected growth rates. Additionally, a downturn
in the economy could greatly hurt Apple’s overall forecasted sales growth. If
disposable income falls among the general population, Apple’s revenues will drop
significantly due to the nature of their products.
60
Valuations Analysis
Summary of Valuation Analysis
Forward P/E
$20.67
Trailing P/E
$15.61
Market to Book
$37.16
Discounted Free Cash Flows
$28.95
Abnormal Earnings Growth
$23.40
Residual Income
$23.22
Long Run Residual Income Perpetuity
$20.84
Discounted Dividends
N/A
The purpose of this section is to evaluate the overall value of Apple as
compared to its current stock price by utilizing various valuation models. Apple
will be analyzed using the method of comparables, abnormal earnings growth,
discounted free cash flows, residual income, and long run residual income
perpetuity models. By comparing the various models to the actual stock price, a
conclusion can be made regarding the nature of the stock (overvalued,
undervalued, or fairly-valued).
Method of Comparables Valuation
Method of comparables allows us to compute an industry average of
Apple’s direct competitors to determine a simple way of evaluating Apple’s
price per share.
Apple’s direct competitors include Gateway, Dell, and
Hewlett Packard.
61
Forward Price to Earnings
PPS
Dell
38.03
1.89
Forward P/E
Ratio
20.12
HP
21.71
1.7
12.78
3.99
6.2
15.96
Industry
Average P/E
16.28
Earnings Per
Share
1.27
Expected Share
Price
20.67
Gateway
Apple
EPS
Apple’s forward price to earnings shows a valued price per share of
$20.67 a share as compared to Apple’s actual price per share of $40.89. This
method shows a grossly over-valued market price.
Trailing Price to Earnings
PPS
EPS
Forward P/E
Ratio
Dell
38.03
1.19
31.96
HP
21.71
1.18
18.39
3.99
N/A
N/A
Industry
Average P/E
25.18
Earnings Per
Share
.62
Expected Share
Price
15.61
Gateway
Apple
Apple’s trailing price to earnings gave a valued price per share of $15.61,
which is substantially lower than Apple’s actual price of $40.89.
62
Market to Book
MARKET
PPS
BPS
Market to Book
Ratio
Dell
38.03
14.63
2.6
HP
21.71
1.66
13.08
3.99
6.2
0.64
Industry
Average M/B
5.44
Book Value
Per Share
6.83
Expected Share
Price
37.16
Gateway
Apple
Apple’s market to book valuation yielded a value of $37.16 which is closer
to their actual share value of $40.89, but it is still a lower valuation than the
market price.
We chose to include HP’s ratio because we did not want to
compute an industry average only using two companies.
Dividend to Price
Apple along with most of its main competitors follows the industry norms
and do not pay dividends. The only company in the industry that pays dividends
is Hewlett Packard.
Calculation of Cost of Equity and WACC
Cost of Equity and the Weighted Average Cost of Capital are fundamental
elements in determining the following valuation models.
To calculate the cost of equity we used the CAPM formula:
Rj=Rf+Bj(Rf-Rm)
In the equation, (Rf-Rm) is also stated as the market risk premium (MRP).
Rf (risk free rate) = .0321
Bj (Beta)= 1.14
MRP= .03
Rj= .06796
63
It was decided that a 3 year average would be used as the regression
analysis showed that it explained 29.6% of the market (which is higher than
the 2 or 5 year average). For the risk free rate we took the average of the 5year Treasury bill interest rates for the market. We chose this because
financial analysts recommend using a forecast of somewhere between 5 to 7
years. The beta is calculated by running a slope of the firm’s return and the
market risk premium. Finally, historical market risk premium was selected as
3% as supported by recent academic research.
WACC (before tax) = (Vd/Vf)(Kd) + (Ve/Vf)(Ke)
Apple has no long term debt obligations and the only liabilities on the
books consist of accounts payable and accrued expenses.
Since accounts
payable and accrued expenses have no determinable interest rate, we applied
the federal funds rate of 2.63%.
Cost of equity was determined to be
6.796% using the above CAPM formula.
Discounted Free Cash Flows Valuation: $28.95
The discounted free cash flows valuation model uses forecasted free cash
flows and WACC to determine the company’s intrinsic value on a per share basis.
Apple’s WACC is 5.26%. Using this method, our intrinsic value per share is
$28.95. Compared to our share price of $40.89, this method shows that Apple
has a significantly over-valued share price. This method is extremely sensitive to
changes in the growth rate.
64
Sensitivity Analysis
Growth
WACC
0
0.025
0.05
0.075
0.02
$82.48
N/A
N/A
N/A
0.04
$39.23
$93.23
N/A
N/A
0.0526
$28.95
$49.34
461.88
N/A
0.08
$17.90
$23.45
$38.25
201.01
0.1
$13.73
$16.57
$22.24
39.26
Abnormal Earnings Growth Valuation: $23.40
Abnormal Earnings Growth Valuation model incorporates the present value
of the investment opportunities of the dividends paid to the shareholders. Since
Apple pays no dividends the cumulative dividend earnings is equal to earnings
per share. Also, growth rate has no effect on the value per share because the
value of our perpetuity is zero. Using this method, our intrinsic value per share
is $23.40 which is substantially lower than the market price of $40.89.
Sensitivity Analysis
Growth
Ke
0
0.025
0.05
0.075
0.02
$112.22
$112.22
$112.22
$112.22
0.04
$48.50
$48.50
$48.50
$48.50
0.06796
$23.40
$23.40
$23.40
$23.40
0.08
$17.58
$17.58
$17.58
$17.58
0.1
$12.74
$12.74
$12.74
$12.74
*Growth does not matter since the perpetuity was zero
Residual Income Valuation: $23.22
In the residual income valuation model we use a stream of forecasted
residual income values (which is the difference between forecasted EPS and
normal income), a terminal value, and then discount them back to the present
year using the firm’s cost of equity. Using these techniques we derived an
65
intrinsic value of the firm of $23.22 per share, which is similar to the value
derived using the AEG method. In both cases, the models have indicated that
Apple is over-valued.
Sensitivity Analysis
0
Growth
0.025
0.05
0.075
0.02
$112.04
N/A
N/A
N/A
0.04
$48.33
$91.62
N/A
N/A
0.06796
$23.22
$26.62
39.51
N/A
0.08
$18.10
$19.23
$22.24
55.36
0.1
$12.57
$12.39
$12.03
10.94
Ke
Long Run Residual Income Perpetuity: $20.84
P = BVE + BVE [ (ROE – Ke)/(Ke – g) ]
The long run residual income perpetuity model is similar to the residual income
model except that it is a perpetuity. We used Apple’s book value of equity as of
FYE 2004 13.66, Ke of .06796, and ROE of .1037. Using this method we derived
a value per share of $20.84, which is consistent with the other models, in that it
states that Apple’s market price per share is very over-valued.
Credit Risk Analysis
Using Edward Altman’s Z-score analysis it is clear to say that Apple
Computers, Inc. is in no real danger of bankruptcy, since this model has proven
up to 72% accurate. Apple’s current Z-Score is a 3.4 and according to the model
the company is healthy with no potential threats.
Conclusion
From the information gathered from different valuation methods, we
conclude that Apple’s current stock price of $40.89 is overvalued and it is our
best estimate that the true price is in the range of $20-$24.
66
Appendix A:: Balance Sheet
FORECASTS
Apple Computers, Inc. 10-K Balance Sheet
2000
2001
2002
2003
2004
2005
2006
2007
2008
2009
2010
2011
2012
2013
2014
Cash and cash equivalents
$1,191.00 $2,310.00 $2,252.00 $3,396.00 $2,969.00
$3,035.02
$3,229.26
$3,435.94
$3,655.84
$3,889.81
$4,138.76
$4,403.64
$4,685.47
$4,985.34
$5,304.40
Short-term investments
$2,836.00 $2,026.00 $2,085.00 $1,170.00 $2,495.00
$5,737.44
$6,104.64
$6,495.34
$6,911.04
$7,353.35
$7,823.96
$8,324.69
$8,857.47
$9,424.35 $10,027.51
ASSETS
Current Assets
Total Cash, Equivalent, Investments
Accounts and notes receivable, net
Inventories
Deferred tax assets
Other current assets
Total Current Assets
Property, Plant and Equipment, net
Goodwill
Acquired intangible assets
Non-Current debt and equity investments
Other Assets
Total Non-Current Assets
Total Assets
$4,027.00 $4,336.00 $4,337.00 $4,566.00 $5,464.00
$953.00
$466.00
$565.00
$766.00
$774.00
$33.00
$11.00
$45.00
$56.00
$101.00
$58.83
$62.59
$66.60
$70.86
$75.40
$80.22
$85.36
$90.82
$96.63
$102.82
$162.00
$169.00
$166.00
$190.00
$231.00
$230.85
$245.63
$261.35
$278.08
$295.87
$314.81
$334.96
$356.39
$379.20
$403.47
$252.00
$161.00
$275.00
$309.00
$485.00
$7,280.75
$7,746.71
$8,242.50
$8,770.02
$9,331.30
$9,928.51 $10,563.93 $11,240.02 $11,959.39 $12,724.79
$885.38
$942.05
$1,002.34
$1,066.49
$1,134.74
$1,207.37
$5,427.00 $5,143.00 $5,388.00 $5,887.00 $7,055.00
$419.00
$564.00
$621.00
$669.00
$707.00
$.00
$128.00
$39.00
$85.00
$80.00
$1,284.64
$1,366.85
$1,454.33
$1,547.41
$.00
$76.00
$119.00
$24.00
$17.00
$171.00
$110.00
$131.00
$150.00
$191.00
$200.31
$213.13
$226.77
$241.28
$256.72
$273.15
$290.63
$309.23
$329.02
$350.08
$1,376.00
$878.00
$910.00
$928.00
$995.00
$1,284.84
$1,367.07
$1,454.56
$1,547.65
$1,646.70
$1,752.09
$1,864.22
$1,983.53
$2,110.48
$2,245.55
$6,803.00 $6,021.00 $6,298.00 $6,815.00 $8,050.00
$8,565.58
$9,113.78
$9,697.06 $10,317.67 $10,978.01 $11,680.60 $12,428.16 $13,223.56 $14,069.87 $14,970.34
$2,493.41
$2,652.98
$2,822.78
$3,003.43
$3,195.65
$3,400.17
$3,617.79
$3,849.32
$4,095.68
$4,357.80
$306.99
$320.55
$334.71
$349.50
$364.94
$381.07
$397.90
$415.48
$433.84
$453.00
$3,212.09
$3,417.67
$3,636.40
$3,869.13
$4,116.75
$4,380.22
$4,660.56
$4,958.83
$5,276.20
$5,613.88
$6,448.55
$6,861.25
$7,300.37
$7,767.60
$8,264.72
$8,793.67
$9,356.46
$786.00
LIABILITIES AND SHAREHOLDERS EQUITY
Current Liabilities
Accounts Payable
Accrued Expenses
Current Debt
Total Current Liabilities
$1,157.00
$801.00
$911.00 $1,154.00 $1,451.00
$776.00
$717.00
$747.00
$.00
$.00
$.00
$899.00 $1,229.00
$304.00
$.00
$1,933.00 $1,518.00 $1,658.00 $2,357.00 $2,680.00
Long-term debt
$300.00
$317.00
$316.00
$.00
$.00
Deferred tax liabilities and other non-current liabilities
$463.00
$266.00
$229.00
$235.00
$294.00
Total Long-Term Liabilities
$763.00
$583.00
$545.00
$235.00
$294.00
Total Liabilities
$2,696.00 $2,101.00 $2,203.00 $2,592.00 $2,974.00
SHAREHOLDERS EQUITY
Series A nonvoting convertible preferred
$76.00
Common Stock, no par value
$1,502.00 $1,693.00 $1,826.00 $1,926.00 $2,514.00
Deferred stock compensation
Retained Earnings
$2,285.00 $2,260.00 $2,325.00 $2,394.00 $2,670.00
Accumulated other comprehensive income (loss)
Total Shareholders Equity
$4,107.00 $3,920.00 $4,095.00 $4,223.00 $5,076.00
$5,353.49
$5,696.11
$6,060.66
Total Liabilities & Shareholders Equity
$6,803.00 $6,021.00 $6,298.00 $6,815.00 $8,050.00
$8,565.58
$9,113.78
$9,697.06 $10,317.67 $10,978.01 $11,680.60 $12,428.16 $13,223.56 $14,069.87 $14,970.34
$.00
$244.00
-$11.00
-$22.00
-$7.00
-$49.00
- 67 -
-$62.00
-$35.00
-$93.00
-$15.00
Appendix B:: Income Statement
Apple Computers, Inc.10-K Income Statement
Net sales
FORECASTS
2000
2001
2002
2003
2004
$7,983.00
$5,363.00
$5,742.00
$6,207.00
$8,279.00
2008
2009
2010
2011
2012
2013
2014
$10,348.75 $12,418.50 $14,902.20 $17,882.64
2005
2006
2007
$20,743.86
$24,062.88
$27,912.94
$29,866.85
$31,957.53
$34,194.55
$15,230.14
$17,666.97
$20,493.68
$21,928.24
$23,463.22
$25,105.64
$5,513.72
$6,395.91
$7,419.26
$7,938.61
$8,494.31
$9,088.91
Cost of sales
$5,817.00
$4,128.00
$4,139.00
$4,499.00
$6,020.00
$7,598.05
$9,117.66 $10,941.20 $13,129.43
Gross margin
$2,166.00
$1,235.00
$1,603.00
$1,708.00
$2,259.00
$2,750.70
$3,300.84
$3,961.00
$4,753.21
Operating expenses:
Research and development
Selling, general, and administrative
$380.00
$430.00
$446.00
$471.00
$489.00
$503.67
$518.78
$534.34
$550.37
$566.89
$583.89
$601.41
$619.45
$638.03
$657.18
$1,166.00
$1,138.00
$1,109.00
$1,212.00
$1,421.00
$1,520.47
$1,626.90
$1,740.79
$1,862.64
$1,993.03
$2,132.54
$2,281.82
$2,441.54
$2,612.45
$2,795.32
$8.00
$.00
$30.00
$26.00
$23.00
$.00
$11.00
$1.00
$.00
$.00
$90.00
$.00
$1,644.00
$1,579.00
$1,586.00
$1,709.00
$1,933.00
$2,184.29
$2,468.25
$2,789.12
$3,151.71
$3,561.43
$4,024.41
$4,547.59
$5,138.77
$5,806.81
$6,561.70
$522.00
-$344.00
$17.00
-$1.00
$326.00
$566.41
$832.59
$1,171.88
$1,601.50
$1,952.29
$2,371.50
$2,871.67
$2,799.84
$2,687.50
$2,527.21
$4.00
Special charges:
Restructuring costs
Purchased in-process R&D
Executive bonus
Total operating expenses
Operating income (loss)
Other income and expense:
Gain (loss) on non-curr. investments, net
$367.00
$88.00
-$42.00
$10.00
Unrealized loss on convertible securities
$.00
-$13.00
$.00
$.00
$.00
$203.00
$217.00
$112.00
$83.00
$53.00
$570.00
$292.00
$70.00
$93.00
$57.00
$1,092.00
-$52.00
$87.00
$92.00
$383.00
$566.41
$832.59
$1,171.88
$1,601.50
$1,952.29
$2,371.50
$2,871.67
$2,799.84
$2,687.50
$2,527.21
$158.59
$233.13
$328.13
$448.42
$546.64
$664.02
$804.07
$783.95
$752.50
$707.62
$407.81
$599.46
$843.76
$1,153.08
$1,405.65
$1,707.48
$2,067.60
$2,015.88
$1,935.00
$1,819.59
Interest and other income, net
Total other income and expense
Income before taxes
Provision for income taxes
$306.00
-$15.00
$22.00
$24.00
$107.00
Income before accounting changes
$786.00
-$37.00
$65.00
$68.00
$276.00
$.00
$12.00
$.00
$1.00
$.00
$786.00
-$25.00
$65.00
$69.00
$276.00
Cumulative effects of accounting
changes, net of income taxes
Net income
- 68 -
Appendix C:: Statement of Cash Flows
Apple Computers, Inc. 10-K Cash Flow
Cash and cash equivalents, beginning of the year
Operating Activities:
Net income
Cumulative effects of accounting changes, net of taxes
Adjustments to reconcile net income to cash generated
by operating activities:
Depreciation, amortization and accretion
Stock-based compensation expense
Non-cash restructuring
Provision for (benefit from) deferred income taxes
Loss on disposition of property, plant, and equipment
Gains on sales of short-term investments, net
(Gains) losses on non-current investments, net
Gain on forward purchase agreement
Purchased in-process research and development
Changes in operating assets and liabilities:
Accounts receivable
Inventories
Other current assets
Other assets
Accounts payable
Other liabilities
Cash generated by operating activities
Investing Activities:
Purchases of short-term investments
Proceeds from maturities of short-term investments
Proceeds from sales of short-term investments
Proceeds from sales of non-current investments
Purchases of property, plant, and equipment
Cash used for business acquisitions
Other
Cash generated by (used for) investing activites
Financing Activities:
Payment of long-term debt
Proceeds from issuance of common stock
Cash used for repurchase of common stock
Cash generated by financing activities
Increase (decrease) in cash and cash
equivalents
Cash and cash equivalents, end of the year
Supplemental cash flow disclosures:
Cash paid during the year for interest
Cash paid (received) for income taxes, net
Noncash transactions:
Issuance of common stock for conversion of Series A
preferred stock
Issuance of common stock in connection with
acquisition
FORECASTS
2000
$1,326,000,000
2001
$1,191,000,000
2002
2003
$2,310,000,000 $2,252,000,000
$786,000,000
$0
($25,000,000)
($12,000,000)
$65,000,000
$0
$69,000,000
($1,000,000)
$276,000,000
$0
$84,000,000
$102,000,000
$163,000,000
$10,000,000
($367,000,000)
($36,000,000)
$9,000,000
($88,000,000)
$114,000,000
$5,000,000
$8,000,000
($34,000,000)
$7,000,000
($7,000,000)
$42,000,000
$0
$113,000,000
$16,000,000
$12,000,000
($11,000,000)
$2,000,000
($21,000,000)
($10,000,000)
($6,000,000)
$150,000,000
$33,000,000
$5,000,000
$20,000,000
$7,000,000
($1,000,000)
($4,000,000)
$0
$0
$0
$13,000,000
$11,000,000
$1,000,000
$0
$0
($272,000,000)
($13,000,000)
($37,000,000)
$20,000,000
$318,000,000
$176,000,000
$868,000,000
$487,000,000
$22,000,000
$106,000,000
$12,000,000
($356,000,000)
($60,000,000)
$185,000,000
($99,000,000)
($34,000,000)
($114,000,000)
($11,000,000)
$110,000,000
$36,000,000
$89,000,000
($201,000,000)
($11,000,000)
($34,000,000)
($30,000,000)
$243,000,000
$159,000,000
$289,000,000
($8,000,000)
($45,000,000)
($176,000,000)
($39,000,000)
$297,000,000
$419,000,000
$934,000,000
($4,267,000,000)
$3,075,000,000
($4,268,000,000)
$4,811,000,000
($4,144,000,000) ($2,648,000,000) ($3,270,000,000)
$2,846,000,000 $2,446,000,000 $1,141,000,000
$256,000,000
$140,000,000
($142,000,000)
$0
($34,000,000)
($972,000,000)
$278,000,000
$339,000,000
($232,000,000)
$0
($36,000,000)
$892,000,000
$1,254,000,000 $1,116,000,000
$801,000,000
$25,000,000
$45,000,000
$5,000,000
($174,000,000) ($164,000,000)
($176,000,000)
($52,000,000)
$0
$0
($7,000,000)
$33,000,000
$11,000,000
($252,000,000) $828,000,000 ($1,488,000,000)
$85,000,000
($116,000,000)
($31,000,000)
($135,000,000)
$42,000,000
$0
$42,000,000
$1,119,000,000
$1,191,000,000
$2,310,000,000
$2,252,000,000
$3,396,000,000
$2,969,000,000
$20,000,000
$47,000,000
$20,000,000
$42,000,000
$20,000,000
$11,000,000
$20,000,000
$45,000,000
$10,000,000
($7,000,000)
$74,000,000
$76,000,000
$0
$66,000,000
$0
$0
$105,000,000
$53,000,000
$0
($26,000,000)
$105,000,000
$27,000,000
($58,000,000) $1,144,000,000
- 69 -
2004
$3,396,000,000
($300,000,000)
$427,000,000
$0
$127,000,000
($427,000,000)
2005
2006
2007
2008
2009
2010
2011
2012
2013
2014
$423,800,000
$396,485,425
$582,812,720
$820,319,401
$1,121,050,157
$976,145,712
$1,185,750,434
$1,435,836,695
$1,399,917,671
$1,343,748,730
($187,687,668)
($69,484,011)
($73,930,987)
($78,662,571)
($83,696,975)
($89,053,582)
($94,753,011)
($100,817,203)
($107,269,504)
($114,134,753)
Appendix D:: Forecasting Assumptions
Ratio Analysis Section
FORECASTS
2000
Sales Growth
Sustainable Growth Rate
19.14%
2001
2002
2003
2004
2005
2006
2007
2008
2009
2010
2011
2012
2013
2014
-32.82%
7.07%
8.10%
33.38%
25.00%
20.00%
20.00%
20.00%
16.00%
16.00%
16.00%
7.00%
7.00%
7.00%
-0.64%
1.59%
1.63%
5.44%
2.92
Liquidity Analysis
Current Ratio
2.81
3.39
3.25
2.50
2.63
2.92
2.92
2.92
2.92
2.92
2.92
2.92
2.92
2.92
Quick Asset Ratio
2.58
3.16
2.96
2.26
2.33
2.66
2.66
2.66
2.66
2.66
2.66
2.66
2.66
2.66
2.66
176.27
375.27
91.98
80.34
59.60
77.31
77.31
77.31
77.31
77.31
77.31
77.31
77.31
77.31
77.31
9.77
9.77
9.77
9.77
9.77
9.77
9.77
9.77
9.77
9.77
1.79
1.79
1.79
1.79
1.79
1.79
1.79
1.79
1.79
1.79
Inventory Turnover
Days supply of inventory
2.07
0.97
3.97
4.54
6.12
Accounts Receivable Turnover
8.38
11.51
10.16
8.10
10.70
Days supply of receivables
43.57
31.72
35.92
45.04
34.12
Working Capital Turnover
2.28
1.48
1.54
1.76
1.89
Profitability Analysis
Gross Profit Margin
27.13%
23.03%
27.92%
27.52%
27.29%
26.58%
26.58%
26.58%
26.58%
26.58%
26.58%
26.58%
26.58%
26.58%
26.58%
Operating Expense ratio
20.59%
29.44%
27.62%
27.53%
23.35%
25.71%
25.71%
25.71%
25.71%
25.71%
25.71%
25.71%
25.71%
25.71%
25.71%
9.85%
-0.47%
1.13%
1.11%
3.33%
1.86%
1.86%
1.86%
1.86%
1.86%
1.86%
1.86%
1.86%
1.86%
1.86%
1.17
0.89
0.91
0.91
1.03
0.95
0.95
0.95
0.95
0.95
0.95
0.95
0.95
0.95
0.95
Net Profit Margin
Asset Turnover
Return on Assets
11.55%
-0.42%
1.03%
1.01%
3.43%
1.82%
1.82%
1.82%
1.82%
1.82%
1.82%
1.82%
1.82%
1.82%
1.82%
Return on Equity
19.14%
-0.64%
1.59%
1.63%
5.44%
2.89%
2.89%
2.89%
2.89%
2.89%
2.89%
2.89%
2.89%
2.89%
2.89%
0.66
0.54
0.54
0.61
0.59
0.60
0.60
0.60
0.60
0.60
0.60
0.60
0.60
0.60
0.60
4.80%
8.00%
7.80%
7.60%
5.90%
5.35%
5.35%
5.35%
5.35%
5.35%
5.35%
5.35%
5.35%
5.35%
5.35%
Total Assets
Operating Cash Flow as % Op. Inc
79.49%
-11.49%
-355.77%
4.60%
102.30%
8.21%
314.13%
18.12%
243.86%
6.40%
130.00%
6.40%
70.00%
6.40%
70.00%
6.40%
70.00%
6.40%
70.00%
6.40%
50.00%
6.40%
50.00%
6.40%
50.00%
6.40%
50.00%
6.40%
50.00%
Total Current Assets
79.77%
85.42%
85.55%
86.38%
82.64%
85.00%
85.00%
85.00%
85.00%
85.00%
85.00%
85.00%
85.00%
85.00%
85.00%
Capital Structure Analysis
Debt to equity ratio
Times Interest Earned
Debt Service Margin
R&D Turnover
- 70 -
Appendix E:: Discounted Free Cash Flow Model
Apple Computer Industry
(Amounts in millions of dollars except per share data)
1
2
3
4
5
2005
2006
2007
2008
2009
$423.80
$396.49 $582.81
$820.32 $1,121.05
-$187.69
-$69.48 -$73.93
-$78.66
-$83.70
$236.11
$327.00 $508.88
$741.66 $1,037.35
0.950
0.903
0.857
0.815
0.774
$224.31
$295.14 $436.34
$604.16
$802.80
2004
Cash Flow from Operations
Cash Provided (Used) by Investing Activities
Free Cash Flow (to firm)
PV Factor
Present Value of Free Cash Flows
Total Present Value of Annual Cash Flows
Continuing (Terminal) Value (assume no growth)
Present Value of Continuing (Terminal) Value
Value of the Firm (end of 2004)
Book Value of Debt and Preferred Stock
Value of Equity (end of 2004)
Estimated Value per Share (09/31/04)
Estimated Value per Share (04/01/05)
6
2010
$976.15
-$89.05
$887.09
0.735
$652.21
7
2011
$1,185.75
-$94.75
$1,091.00
0.698
$762.04
8
9
10
2012
2013
2014
$1,435.84 $1,399.92 $1,343.75
-$100.82 -$107.27 -$114.13
$1,335.02 $1,292.65 $1,229.61
0.664
0.630
0.599
$885.89 $814.91 $736.44
$4,662.90
$24,575.06
$16,307.51
$20,970.41
$20,970.41
$28.22
$28.95
Sensitivity Analysis
Earnings Per Share
$0.62
Dividends per share
WACC
Book Value Per Share
Actual Price per share
g
WACC
$40.89
0
0.0526
- 71 -
0.02
0.04
0.0526
0.08
0.1
0
$82.48
$39.23
$28.95
$17.90
$13.73
g
0.025
0.05
0.075
$93.23
$49.34
$23.45
$16.57
461.88
$38.25
$22.24
201.01
39.26
Appendix F:: Abnormal Earnings Growth Model
1
2
2005
2006
2007
$0.55
$0.00
$0.00
Abnormal Earning Growth (AEG)
$0.81
$0.00
$0.00
$0.81
$0.59
$0.22
$1.14
$0.00
$0.00
$1.14
$0.86
$0.27
$1.55
$0.00
$0.00
$1.55
$1.21
$0.34
$1.89
$0.00
$0.00
$1.89
$1.66
$0.23
$2.30
$0.00
$0.00
$2.30
$2.02
$0.28
$2.78
$0.00
$0.00
$2.78
$2.45
$0.33
$2.71
$0.00
$0.00
$2.71
$2.97
($0.26)
$2.60
$0.00
$0.00
$2.60
$2.90
($0.29)
$2.45
$0.00
$0.00
$2.45
$2.78
($0.33)
PV Factor
0.936
0.877
0.821
0.769
0.720
0.674
0.631
0.591
0.553
$0.21
$0.24
$0.28
$0.18
$0.20
$0.22
($0.16)
($0.17)
($0.18)
2004
EPS
DPS
DPS invested at 17%
Cum-Dividend Earnings
Normal Earnings
PV of AEG
3
4
Forecast Years
2008
2009
5
6
2010
2011
Total PV of AEG
$0.00
PV of Terminal Value
Total PV of AEG
$1.54
0.06796
Average Perpetuity
Capitalization Rate (perpetuity)
g
pv
$22.64
fv
23.40
0.06796
0
09/31/04
04/01/05
Sensitivity Analysis
Ke
Actual Price per share
9
2013
2014
$0.00
Continuing (Terminal) Value
Ke
2012
8
$0.55
$0.99
Core EPS
Value Per Share
7
$20.88
- 72 -
0.02
0.04
0.06796
0.08
0.1
g
0
0.025
$112.22 $112.22
$48.50
$48.50
$23.40
$23.40
$17.58
$17.58
$12.74
$12.74
0.05
$112.22
$48.50
$23.40
$17.58
$12.74
0.075
$112.22
$48.50
$23.40
$17.58
$12.74
Perp
0
Appendix G:: Residual Income Model
2004
Beginning BE (per share)
Earnings Per Share
Dividends per share
Ending BE (per share)
Ke
"Normal" Income
Residual Income (RI)
13.66
0.06796
Present Value of RI
BV Equity (per share) 2004
Total PV of RI (end 2004)
Continuation (Terminal) Value
PV of Terminal Value (end 2004)
Estimated Value (09/31/2004)
Estimated Value (04/01/2005)
Actual Price per share
Growth
Net Income
Shares Outstanding
1
2
3
4
5
2005
13.66
$0.55
$0.00
14.21
2006
14.21
$0.81
$0.00
15.02
2007
15.02
$1.14
$0.00
16.15
2008
16.15
$1.55
$0.00
17.70
2009
17.70
$1.89
$0.00
19.59
0.93
(0.38)
0.97
(0.16)
1.02
0.11
1.10
0.45
1.20
0.69
1.33
0.97
1.49
1.29
(0.36)
(0.14)
0.09
0.35
0.50
0.65
0.82
13.66
3.15
10.93
5.66
$22.47
23.220
9
10
2013
27.39
$2.60
$0.00
29.99
2014
29.99
$2.45
$0.00
32.44
1.68
1.04
1.86
0.74
2.04
0.41
0.61
0.41
0.21
10.93
Sensitivity Analysis
0.02
0.04
0.06796
0.08
0.1
0
$112.04
$48.33
$23.22
$18.10
$12.57
$843.76 $1,153.08
$1,405.65
Ke
$40.89
0
$407.81
743,180,000
6
7
8
Forecast Years
2010
2011
2012
19.59
21.89
24.67
$2.30
$2.78
$2.71
$0.00
$0.00
$0.00
21.89
24.67
27.39
$599.46
- 73 -
g
0.025
0.05
0.075
$91.62
$26.62
39.51
$19.23 $22.24
$12.39 $12.03
55.36
10.94
$1,707.48 $2,067.60 $2,015.88 $1,935.00 $1,819.59
Appendix H:: Calculation of Cost of Equity
Estimated
Average Risk
Beta
R- Squared
Free Rate
1.71111
0.207471064
0.0409
Estimated Ke
Estimated Kd
3 year
1.141205
0.296197961
Estimated Ke
2 year
0.710647
0.02854379
Estimated Ke
Yahoo
Historical
Published Market Risk
Beta
Premium
1.857
0.03
9.22%
2.63%
0.0337
1.857
0.03
1.857
0.03
6.796%
0.0326
5.394%
- 74 -
Appendix I:: Pro-Forma Income Statement
Pro-Forma (Percent of Sales) Income Statement
2000
100%
73%
27%
2001
100%
77%
23%
2002
100%
72%
28%
2003
100%
72%
28%
2004
100%
73%
27%
5%
15%
8%
21%
8%
19%
8%
20%
6%
17%
0%
0%
1%
21%
7%
0%
0%
0%
29%
-6%
1%
0%
0%
28%
0%
0%
0%
0%
28%
0%
0%
0%
0%
23%
4%
5%
0%
3%
7%
14%
2%
0%
4%
5%
-1%
-1%
0%
2%
1%
2%
0%
0%
1%
1%
1%
0%
0%
1%
1%
5%
Provision for income taxes
Income before accounting changes
Cumulative effects of accounting
changes, net of income taxes
Net income
Earnings per common share before accounting changes:
Basic
Diluted
Earnings per common share:
Basic
Diluted
Shares used in computing earnings per share (in thousands):
Basic
Diluted
4%
10%
0%
0%
10%
0%
-1%
0%
0%
0%
0%
1%
0%
0%
1%
0%
1%
0%
0%
1%
1%
3%
0%
0%
3%
Pro-Forma (Percent Line Item Growth) Income Statement
2000
2001
2002
2003
2004
-33%
-29%
-43%
7%
0%
30%
8%
9%
7%
33%
34%
32%
13%
-2%
4%
-3%
6%
9%
4%
17%
-13%
-100%
-12%
-91%
-100%
-4%
-166%
0%
-105%
8%
-106%
13%
-32700%
-76%
-148%
-124%
-60%
7%
-49%
-105%
-48%
-76%
-267%
-26%
33%
6%
-36%
-39%
316%
-105%
-105%
-247%
-276%
9%
5%
346%
306%
-103%
-360%
6%
300%
Net sales
Cost of sales
Gross margin
Operating expenses:
Research and development
Selling, general, and administrative
Special charges:
Restructuring costs
Purchased in-process research and development
Executive bonus
Total operating expenses
Operating income (loss)
Other income and expense:
Gains (losses) on non-current investments, net
Unrealized loss on convertible securities
Interest and other income, net
Total other income and expense
Income (loss) before provision for income taxes
-100%
Provision for income taxes
Income before accounting changes
Cumulative effects of accounting
changes, net of income taxes
Net income
- 75 -
Appendix J:: Pro-Forma Balance Sheet
Apple Computers, Inc.10-K Percent (Asset, Liability, Equity) Balance Sheet
ASSETS
Current Assets
Cash and cash equivalents
Short-term investments
Total Cash, Equivalent, Investments
Accounts and notes receivable, net
Inventories
Deferred tax assets
Other current assets
Total Current Assets
Property, Plant and Equipment, net
Goodwill
Acquired intangible assets
Non-Current debt and equity investments
Other Assets
Total Non-Current Assets
Total Assets
LIABILITIES AND SHAREHOLDERS EQUITY
Current Liabilities
Accounts Payable
Accrued Expenses
Current Debt
Total Current Liabilities
Long-term debt
Deferred tax liabilities and other non-current
liabilities
Total Long-Term Liabilities
Total Liabilities
SHAREHOLDERS EQUITY
Series A nonvoting convertible preferred
Common Stock, no par value
Deferred stock compensation
Retained Earnings
Accumulated other comprehensive income (loss)
Total Shareholders Equity
2000
2001
2002
2003
2004
17.51%
41.69%
59.19%
14.01%
0.49%
2.38%
3.70%
79.77%
0.00%
6.16%
0.00%
0.00%
11.55%
2.51%
20.23%
0.00%
100.00%
38.37%
33.65%
72.01%
7.74%
0.18%
2.81%
2.67%
85.42%
0.00%
9.37%
2.13%
1.26%
0.00%
1.83%
14.58%
0.00%
100.00%
35.76%
33.11%
68.86%
8.97%
0.71%
2.64%
4.37%
85.55%
0.00%
9.86%
0.62%
1.89%
0.00%
2.08%
14.45%
0.00%
100.00%
49.83%
17.17%
67.00%
11.24%
0.82%
2.79%
4.53%
86.38%
0.00%
9.82%
1.25%
0.35%
0.00%
2.20%
13.62%
0.00%
100.00%
36.88%
30.99%
67.88%
9.61%
1.25%
2.87%
6.02%
87.64%
0.00%
8.78%
0.99%
0.21%
0.00%
2.37%
12.36%
0.00%
100.00%
42.92%
28.78%
0.00%
71.70%
11.13%
38.12%
34.13%
0.00%
72.25%
15.09%
41.35%
33.91%
0.00%
75.26%
14.34%
44.52%
34.68%
11.73%
90.93%
0.00%
48.79%
41.32%
0.00%
90.11%
0.00%
17.17%
28.30%
12.66%
27.75%
10.39%
24.74%
9.07%
9.07%
9.89%
9.89%
100.00%
100.00%
100.00%
100.00%
100.00%
1.85%
36.57%
0.00%
55.64%
5.94%
100.00%
0.00%
43.19%
-0.28%
57.65%
-0.56%
100.00%
0.00%
44.59%
-0.17%
56.78%
-1.20%
100.00%
0.00%
45.61%
-1.47%
56.69%
-0.83%
100.00%
0.00%
49.53%
-1.83%
52.60%
-0.30%
100.00%
Total Liabilities & Shareholders Equity
- 76 -
Sources
1
http://www.jsonline.com/bym/tech/news/jan05/291790.asp
2
www.dell.com
3
www.hpq.com
4
www.gateway.com
5
www.sec.gov
6
www.apple.com
7
http://www.forbes.com/markets/2005/01/21/0121automarketscan05.html
8
Nelson, Brad. Personal Interview. 04 February 2005.
Personal Interview on Campus. Brad Nelson is an Apple Representative.
9
http://www.comp-buyer.co.uk/buyer/news/67579/apple-rivals-claim-itunes-is-doomed.html
10
http://en.wikipedia.org/wiki/Moore's_law
11
http://www.macobserver.com/stockwatch/2004/12/23.1.shtml
12
http://www.macminute.com/2005/01/21/mini-market-share/
13
http://www.napster.com
- 77 -
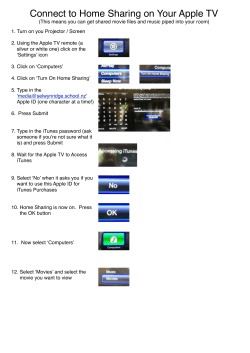


© Copyright 2026