
Part 1 - nick g. glumac
Climate Implications of
Thermodynamic Power Cycles
ME 300 Thermodynamics 2015
Many Power cycles produce
“Greenhouse Gases” (GHGs)
• Typically the bottom
line in power and
transportation cycles
is “efficiency”
• BUT, if GHGs are a
problem, then amount
of GHGs produced
per kW-hr becomes a
factor
Coal vs. Natural Gas
• Coal is mostly carbon (about 5% H by
weight)
– C2H + O2 → 2CO2 + ½ H2O
• ~35,000 kJ/kg & 10,000 kJ/kg CO2
• Natural gas is mostly methane (CH4)
– CH4 + 2O2 → CO2 + 2H2O
• 50,000 kJ/kg & 18,000 kJ/kg CO2
More Factors – Coal vs. Gas
Coal
• Uses Rankine cycle –
less efficient
• Sulfur emissions – acid
rain
• Mercury emissions
• Well established and
cheap.
• Huge supplies
• New technologies
emerging to collect
(sequester CO2)
Natural Gas
• Some is released and
some flared during mining
• Ridiculously huge
supplies emerging
• Uses efficient Brayton
cycle, easy to do
combined cycles
• NUMBERS ARE
CHANGING BUT
CONVERGING. Natural
gas emits about 50%
less CO2 per kW-hr.
GHGs and
Energy
• GHG emissions can be
affected by the energy
mix we use
• Now, energy mix is
decided purely by
economics
• If there is an alternate
criterion, we need to
be able to quantify
cause and effect in a
predictive fashion.
Outline: I. Non-disputed Factual Material
• Science of GHG Warming
– How do GHGs warm the planet
• CO2 balance in the atmosphere
– Sources and sinks and human influence
• Earth’s temperature history
– How does temperature vary w/o humans
• Conclusions
– What almost all parties agree on.
Outline: II. Current CAGW Paradigm
• List of concepts that parties who believe AGW is
a critical problem argue
– Analysis of each of these: evidence for, and counterarguments
• Critical analysis of models used – are they
predictive?
• Human factors that lead to alarmism
– Evidence for alarmism and groupthink in the climate
debate
– Funding bias
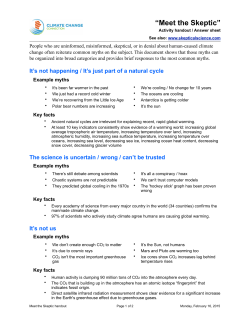
Outline III: Misconceptions that fuel
climate skepticism
• Commonly heard arguments that don’t
withstand rigorous scientific scrutiny
• Human/political factors that lead to
skepticism
• Healthy, scientific skepticism vs. pseudoskepticism
Outline IV: What Can We Do?
• What if we do
nothing?
– Population trends
– Possible effects of a
warmer world
– GHG emission trends
– Peak oil and coal
– Adaptation
• Conservation
– Efficiency in heating,
lighting, transportation
• Renewables
– Solar, wind, tidal
• Changing the energy
mix
– More nuclear, natural
gas; less coal
• Carbon capture
– Local capture (at the
plant)
– Air capture
– Sequestration
Basic Theory Behind the
Greenhouse Effect
Role of the Atmosphere
The Net Result
Energy Balance on the Earth
Direct Effect of CO2 on Surface
Temperature
• Most of the physics are well
understood enough to generate a
fair estimate of surface temperature
change for a doubling of CO2
without feedbacks
• This is called “no feedback climate
sensitivity”
• The value is about 1 °C. See refs.
• Current level is ~400 ppm, rising at
about 2 ppm/yr.
– Probably at least 100 years for a
doubling
Atmospheric Content
•
Water is the most active GHG, comprising 97% of the IR greenhouse effect
•
Human influence on atmospheric composition is probably undeniable.
•
The direct effect of human-induced GHG changes is in the remaining 3%
•
CO2, CH4 and other IR-active gases are more abundant in the atmosphere.
Methane
• CH4 is much more active than CO2, and has also
increased recently.
Where is the recent added CO2 & CH4
coming from?
• Recent (last 150 years) rises in GHGs are
strongly linked to human emissions:
– Detailed accounting using estimates of carbon
usage agrees with rise
– Isotopic studies support the hypothesis that
new CO2 is due to burning not natural
processes.
•
Stuiver, M., Burk, R. L. and Quay, P. D. 1984. 13C/12C ratios and the transfer of biospheric carbon to the atmosphere. J.
Geophys. Res. 89, 11,731-11,748.
Francey, R.J., Allison, C.E., Etheridge, D.M., Trudinger, C.M., Enting, I.G., Leuenberger, M., Langenfelds, R.L., Michel, E.,
Steele, L.P., 1999. A 1000-year high precision record of d13Cin atmospheric CO2. Tellus 51B, 170–193.
Quay, P.D., B. Tilbrook, C.S. Wong. Oceanic uptake of fossil fuel CO2: carbon-13 evidence. Science 256 (1992), 74-79
Historical Global Temperature
• Average temperature
changes over time
• Average temperature
changes much less
than daily variations
and geographical
variations
• Long term cycles are
fairly regular
Temperature Fluctuates
CO2 Fluctuates as well
They’re
correlated
Temperature leads CO2
historically, but there’s some
evidence that the CO2 then
amplifies temperature rise
Natural Temperature Fluctuations
• Temperature fluctuates naturally on scales on
many timescales, including decadal and 100-yr
scales.
• Fluctuations are not well understood and are not
predictable. Some sources:
–
–
–
–
Atlantic and Pacific multidecadal oscillation
El Nino and La Nina effects
Milankovitch orbital cycles
Solar cycles
Facts most scientists agree on
• GHG warming is grounded in well-established, non-controversial
physics
• Doubling of CO2 concentration (~100 years), will, by itself, increase
the earth’s temperature ~1K. Feedbacks (positive and negative)
would change this number.
• Emissions from industrialization have increased the concentration of
CO2 in the atmosphere and continue to do so
• The earth’s temperature fluctuates by itself on several timescales.
• Natural temperature fluctuations are large and poorly understood.
We cannot predict them with any certainty.
CAGW: Catastrophic
Anthropogenic Global Warming
• In addition to the undisputed facts, proponents
of the CAGW theory believe:
– The recent warming of the earth is unprecedented
– This warming is overwhelmingly due to CO2 emissions
– Strong positive feedbacks greatly amplify the “no feedback”
sensitivity to generate more warming
• Furthermore, most would say.
– A warmer world will be more dangerous
– The problem can be solved by collective action
– The benefits of such action outweigh costs
Issues with Temperature
• Temperature varies
temporally and spatially.
• Determining an average
global temperature is
difficult
• Determining what the
average global
temperature was in the
past is even more difficult
• We’re concerned now
with trends in the range of
a few tenths of a degree
Celsius
– We must be very accurate
in temperature
measurement.
• The uncertainty in the
global “average”
temperature is very close
to the size of the trend
we’re measuring.
Temperature Measurement
Complications
• Incomplete coverage
– US is ok, rest of the world, not so much.
• Urban heat island effects
• Site specific issues
– Ground coverage, instrument design, nearby
industry, etc.
• Loss of sites
Temperature Adjustments
• To account for some of these affects,
temperature data is typically “adjusted” by
agencies tracking global temperature.
• NASA is the most commonly cited reference for
global temperature data. Its adjustments:
– Are of the same order as the trend that is being
resolved
– Enhance the warming trend by lowering temperatures
before 1970 and raising them after it.
• Not all agencies adjust data this way.
Trends and Size of NASA
“Adjustments”
Ocean Temps (unadjusted) vs. Land Temps
-Urban Heat Island effects cannot account for all of the warming.
NOAA Land Temperatures (Global)
2.0
2.0
1.5
1.5
1.0
1.0
Deg C Anomaly
Deg C. Anomaly
Ocean Temperatures (Global)
0.5
0.0
-0.5
1980
0.5
0.0
1985
1990
1995
Year
2000
2005
2010
-0.5
1980
1985
1990
1995
Year
2000
2005
2010
Satellite measurements of lower atmosphere and
ocean measurements are most reliable
Unprecedented?
• A key question is whether the warming over the
last century is ‘unprecedented’ in recent history.
• It was previously commonly assumed that there
was a “Medieval Warm Period” MWP in which
temperatures rose quickly as well and stayed as
high or higher than today.
• If so, then GHGs were not responsible for that
rise, and so may not be responsible for the
recent rise.
Textbook Temperature History Profile from
1990
• Predicting past temperature is not easy, though
there are means to make inferences.
– Uncertainties remain high
• Past consensus:
New “Consensus”
“Hockey Stick” issues
• Statistical approach is biased towards the HS shape
• The statistical techniques used to generate the HS have been
criticized by several independent panels including the National
Academy of Science and a UK panel investigating the “Climategate”
emails.
• Several proxies used have demonstrated problems, yet are used
anyways b/c they give the desired results.
• Supposed “independent” validations of HS shape are based upon a
subset of the same proxies, so are not “independent” in any way.
• Handling the same data with different assumptions gives vastly
different results.
From Dr. Edward Wegman,
National Academy of Sciences committee
reviewing the Hockey Stick
• There is a tightly knit group of individuals
who passionately believe in their thesis.
However, our perception is that this group
has a self-reinforcing feedback
mechanism and, moreover, the work has
been sufficiently politicized that they can
hardly reassess their public positions
without losing credibility
Other proxy reconstructions
show a marked MWP
Temperature Changes – with our
without mankind’s influence
Final Notes on Past Trends
• There has been an
attempt to cast the MWP
as a myth and/or regional
phenomenon.
• Because proxy
reconstructions are so full
of uncertainty, those
attempts cannot be
considered to provide
definitive or even
plausible proof.
• It is clear that in Medieval
Times, some regions of
the world (esp. northern
hemisphere) were much
hotter for extended
periods than today.
• Lack of good proxy data
makes it hard to say
whether this was regional
or global.
From BBC Phil Jones Interview on
“Climategate” Issues
Q: There is a debate over whether the Medieval Warm Period (MWP) was global or not. If it were
to be conclusively shown that it was a global phenomenon, would you accept that this
would undermine the premise that mean surface atmospheric temperatures during the
latter part of the 20th Century were unprecedented?
A: There is much debate over whether the Medieval Warm Period was global in extent or not. The
MWP is most clearly expressed in parts of North America, the North Atlantic and Europe and parts
of Asia. For it to be global in extent the MWP would need to be seen clearly in more records from
the tropical regions and the Southern Hemisphere. There are very few palaeoclimatic records for
these latter two regions.
Of course, if the MWP was shown to be global in extent and as warm or warmer than today (based on
an equivalent coverage over the NH and SH) then obviously the late-20th century warmth would
not be unprecedented. On the other hand, if the MWP was global, but was less warm that today,
then current warmth would be unprecedented.
We know from the instrumental temperature record that the two hemispheres do not always follow one
another. We cannot, therefore, make the assumption that temperatures in the global average will
be similar to those in the northern hemisphere.
•
Phil Jones is the former head of the Climate Research Unit in the UK which provided the most widely cited global
temperature reconstructions. He has been one of the strongest and most recognized AGW proponents. He
stepped down as head of CRU during the “Climategate” investigation.
Has CO2 Caused Recent
Warming?
CAGW argument:
YES! Because
without including
CO2 effects in our
models, we can’t
accurately model
past temperature
changes.
Climate Models
• Correlation is not causation
• Climate models must determine that GHGs are
the cause of warming – there is no direct test.
• Current climate models are extremely detailed
and complex, containing a tremendous amount
of physics.
• Climate models have successfully modeled past
trends when the relevant data is input.
• BUT…..
BUT……
•
Climate models have thousands of adjustable parameters
•
No climate model has ever successfully pre-dicted the global temperature
over a period of even a few years.
•
Critical atmospheric physics including the role of clouds and humidity is
poorly understood (IPCCs own admission), and yet these factors dominate
predictions.
•
Solar physics issues may also be critically important, and are clearly not
completely understood.
•
Models have made some important predictions that are not consistent with
measurements regarding the signature of GHG-based warming.
•
Climate model development is dominated by a group of like-minded
individuals and is thus keenly susceptible to “groupthink” problems.
An Exercise in Models & Fits
• Let’s try to predict Google’s stock price
Google Stock Price ($)
620
600
580
560
540
520
500
0
1
2
3
4
5
Day
6
7
8
9
10
5th Order Polynomial - Exact fit to data ("post-diction")
Google Stock Price ($)
620
600
580
560
540
520
500
0
1
2
3
4
5
Day
6
7
8
9
10
Actual Day 7 Data - nowhere near model "prediction"
Google Stock Price ($)
620
600
580
560
540
520
500
0
1
2
3
4
5
Day
6
7
8
9
10
No Problem! Use 6th order polynomial - regains exact fit.
Google Stock Price ($)
620
600
580
560
540
520
500
0
1
2
3
4
5
Day
6
7
8
9
10
Next day - Again it's not correct.
Google Stock Price ($)
620
600
580
560
540
520
500
0
1
2
3
4
5
Day
6
7
8
9
10
Moral of the story
• Given even a few adjustable parameters,
one can model past behavior very
precisely (post-dict), without:
– Having any correct physics
– Generating any pre-dictive capability
• Just because your “model” shows
agreement with past data is not sufficient
to show that it is physically correct.
Compare Two Scenarios
• Propose to replace a stadium
roof with glass top
• Want to predict the final score
of Sunday’s football game.
• Can we predict the effect on
internal temperature & heating
requirements?
• Can we generate a model to
do it?
• Very complex problem. No
analytical solution. But
physics are well known and
can be computationally
modeled w/o adjustable
parameters.
• Yes, that science is “settled.”
• No, despite decades of
research, correlations,
statistics, analysis. It’s still too
complex.
• This, too, is “science.” Players
are governed by the laws of
physics. But the problem is
far from “settled.”
Model Predictions
The six plots show predicted temperature
changes due to:
a) the Sun
b) volcanic activity
c) anthropogenic CO2 and other
greenhouse gasses
d) anthropogenic ozone
e) anthropogenic sulphate aerosol
particles
f) all the above forcings combined
Reality
vs.
Models
More Comparison: Observation vs.
Models (1979-2004 Data)
Most Recent Analysis
•
Environ. Res. Lett. 7 (2012) 044018 (8pp) doi:10.1088/1748-9326/7/4/044018, Discrepancies in tropical upper
tropospheric warming between atmospheric circulation models and satellites, Stephen Po-Chedley and Qiang Fu
“We have demonstrated that
GCMs typically exhibit greater
tropical upper to lower-middle
tropospheric amplification
compared to satellite-borne deep
layer temperature observations
for both coupled historical
simulations and simulations
constrained with historical SSTs.”
Ocean Heat Content – A critical test
Most Famous “Prediction” James Hansen 1988
• 3 scenarios:
– A:Worst case: CO2 production
rate increases 1.5%/yr
– B: CO2 increase constant
– C: Best case: CO2 rise is
stopped in 2000
• Actually, it was worse than
“worst case”; 2.5% increase,
yet rise was lower than “best
case.”
Long term vs. Short term trends
There’s a recent model/reality
divergence – the “Pause”
Level of “agreement” depends on
where you start your comparison
Source: American
Meteorological Society
& WSJ – both mostly
skeptical
Other sources
1.0
0.8
0.6
0.4
0.2
0.0
-0.2
-0.4
-0.6
-0.8
1980
1990
2000
2010
From skepticalscience.com: a non-skeptical alarmist site. Smoothes data,
chooses optimal starting date, uses most extreme low range of the IPCC
prediction
Better depiction
Today’s most critical climate issue:
sensitivity & feedback
• Detailed heat transfer analysis of GHG trapping by CO2 predicts a
doubling of CO2 concentration yields a temperature increase of
close to 1 °C – if no other effects are considered.
– This number is not in active dispute
– If this is the sum total of warming, there is minimal concern of consequences
• Future warming relies on the climate feedback being positive –
higher temperatures lead to less heat loss, driving temperatures
even higher.
– Negative feedback: higher temps lead to more heat loss, mitigating
further rises.
• This is expressed as a sensitivity of the climate to a doubling of CO2
in degrees C. I.e. a sensitivity of 2 °C means that if we double CO2
concentration, the global temp rises 2 °C.
– Strong positive feedbacks give ~3 - 5°C
– Neutral or negative feedbacks 0 - 1 °C
Groupthink Syndrome
Irving L. Janis Groupthink: Psychological Studies of Policy Decisions and Fiascoes
•
1. Overestimate of the group’s power and morality, including “an
unquestioned belief in the group’s inherent morality, inclining the members
to ignore the ethical or moral consequences of their actions.”
•
2. Closed-mindedness, including a refusal to consider alternative
explanations and stereotyped negative views of those who aren’t part of the
group’s consensus. The group takes on a “win-lose fighting stance” toward
alternative views.
•
3. Pressure toward uniformity, including
–
–
–
“a shared illusion of unanimity concerning judgments conforming to the majority view”;
“direct pressure on any member who expresses strong arguments against any of the group’s
stereotypes”;
“the emergence of self-appointed mind-guards … who protect the group from adverse
information that might shatter their shared complacency about the effectiveness and morality
of their decisions.”
Modeling Arctic Ice
• "We see a tipping point
occurring right before our
eyes," Hansen said during his
appearance at the National
Press Club. "The Arctic is the
first tipping point and it's
occurring exactly the way we
said it would."
• Really? At right are the
predictions made in 2008 of 16
mainstream climate modelers
for the 2009 Arctic Ice
minimum. All overpredicted
the ice melt. It’s not just that
they were wrong, they were all
wrong in the alarmist direction.
Professor Robert Watson,
Chairman of IPCC 1997-2002
• Quote from February 2010 regarding errors in
the IPCC reports:
• "The mistakes all appear to have gone in the
direction of making it seem like climate change
is more serious by overstating the impact. That
is worrying. The IPCC needs to look at this trend
in the errors and ask why it happened."
Quotes from the CAGW Camp
•
“The data doesn’t matter. We’re not basing our recommendations on the data.
We’re basing them on the climate models.” — …Prof. Chris Folland, Hadley
Centre for Climate Prediction and Research
•
“The models are convenient fictions that provide something very useful.” —
…Dr David Frame, Climate modeler, Oxford University
•
“It doesn’t matter what is true, it only matters what people believe is true.” —
…Paul Watson, Cofounder of Greenpeace
•
“Unless we announce disasters no one will listen.” — …Sir John Houghton, First
chairman of IPCC
•
“No matter if the science of global warming is all phony…climate change
provides the greatest opportunity to bringabout justice and equality in the
world.” — ..Christine Stewart, former Canadian Minister of the Environment
•
•
•
•
•
•
Quote by Jim Sibbison, environmental journalist, former public relations
official for the Environmental Protection Agency: "We routinely wrote scare
stories...Our press reports were more or less true...We were out to whip the public
into a frenzy about the environment.“
Quote by emeritus professor Daniel Botkin: "The only way to get our society to
truly change is to frighten people with the possibility of a catastrophe.“
Quote by Stephen Schneider, Stanford Univ., environmentalist: "That, of course,
entails getting loads of media coverage. So we have to offer up scary scenarios,
make simplified, dramatic statements, and make little mention of any doubts we might
have."
Quote by Sir John Houghton, lead editor of first three IPCC reports: “If we want
a good environmental policy in the future we’ll have to have a disaster.”
Quote by Timothy Wirth, U.S./UN functionary, former elected Democrat
Senator: “We’ve got to ride the global-warming issue. Even if the theory of global
warming is wrong, we will be doing the right thing in terms of economic policy and
environmental policy.”
Quote by Richard Benedick, former U.S./UN bureaucrat: "A global climate treaty
must be implemented even if there is no scientific evidence to back the greenhouse
effect."


© Copyright 2026