
North Carolina Logistics Initiative Transportation Model East Carolina University Greenville, NC
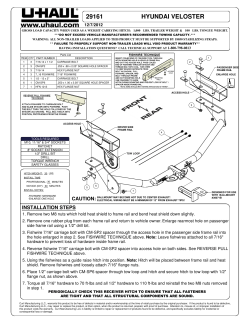
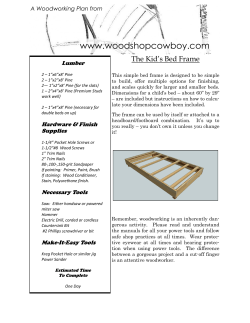
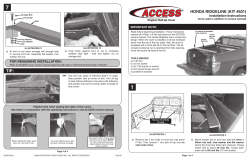
North Carolina Logistics Initiative Transportation Model East Carolina University Greenville, NC Professor Mark Angolia, Distribution and Logistics Program East Carolina University, Greenville, NC Dr. Richard Monroe, Distribution and Logistics Program East Carolina University, Greenville, NC Dr. Leslie Pagliari, Associate Dean, College of Technology and Computer Science East Carolina University, Greenville, NC NCLI Transportation Model 1. Intent and Purpose This section provides a percentage comparison estimate for rail mileage/cost and carbon footprint impact for transportation of equipment returning from overseas for reset and storage. 2. Background The Marine Corps returns material and equipment from overseas to Blount Island at the Port of Jacksonville, FL and then forwards freight to the Marine Corps Logistics Base (MCLB) in Albany, GA for reset and repair. Equipment can then be sent to prepositioning points or the base in Camp Lejeune, NC. The Army returns material and equipment from overseas to the Port of Charleston, SC and then forwards freight to in the Anniston Army Depot in Anniston, AL for reset and repair. Equipment can then be sent to pre-positioning points or the base in Ft. Bragg, NC. 3. Equipment Move Assumptions 3.1 All Army material is taken through the Port of Charleston, SC. 3.2 All Marine equipment is taken through the Port of Jacksonville, FL 3.3 Material is conveyed as Ro-Ro, bulk, or container shipments. 3.4 Rail movement is by flat car; motor carriage by full truckload quantities/rates 3.5 No intermodal moves are required. 3.6 Port and staging costs at each port studied would be approximately equal, and therefore do not impact the model and were not included. 3.7 Cost of transport for military equipment is rated using the Standard Transportation Commodity Code (STCC) 3548420 Military Freight. 4. Model Assumptions 4.1 Flat cars will vary from 60 – 70 feet in length 4.2 Flat car maximum load will vary from 85 – 100 tons 4.3 Rail costs are estimated based on 45 tons of freight per flat car based on vehicle configurations and size negatively impacting loading density and flat car weight capacity utilization. 4.4 Rail carrier switching fees = $250 per car 4.5 Price range based on 25 – 50 ton rate CSX rate and/or the Norfolk Southern mileage/rate estimator 4.6 CSX rail will be available from Castle Hayne, NC to Wallace, NC 4.7 Motor carriage based on 20 ton max cargo, not hazmat or oversize/overweight. 5. Model Limitations The model will only provide percentage of cost and carbon footprint reductions. 5.1 Publicly available rates are always negotiated to lower actual transportation costs. As actual costs cannot be obtained, the public rates are used to determine percentage of change at a fixed frame of reference 5.2 Carbon footprint is determined by mode of transport and weight carried. As actual tonnage of move is not available, fixed weights are used for comparison Page 2 of 19 N NCLI Trannsportationn Model Traansportation Model Overview w Porrt of Entryy C Charleston, SC Jaccksonville, FL L Moreh head City, NC C Wilm mington, NC Resset Facilityy Albany, GA An nniston, AL Kinston n, NC Militaary Locatiion Camp C Lejeunee F Bragg Ft. Trransit distance o Rail miiles are actual when w using CS SX from point to point o Rail miiles are estimatted for NS or local carriers baased on highway miles approoximately rail routing gs, which do noot always follow w shortest mottor route o Motor mileage uses major m highways and metro byy-passes wheneever possible Trransit cost o CSX co osts are rated on o net cargo weeight o NS cossts are irrespecttive of net carggo weight o CSX Rail R carriage ratted using Standdard Transporttation Commerrcial Code (STC CC) 3548420 Militarry Freight o Motor costs are ratedd using full trucck load quantityy rates R Carrier seleection Rail o Movem ments were based on most effficient logisticss distance and costs c when alteernative carrierrs were av vailable o Rail sw witching locatioons were as deffined using CS SX to NS locatiions Current fuel surcharges C o Based on o data availabble as of Octobber 2011. R Carrier tran Rail nsit time based on CSX 4Q20010 data o Averag ge travel speed of 21 mph o Averag ge terminal delay for AL/NC//GA switching points of 32 hours h Motor Carrier trravel time M o Based on o single driveer hours of servvice of Januaryy 2011 11 hour maxximum drive tim me after 10 connsecutive off duty d hours o Estimaated average truuck speed for southeast s US off 55 mph Page 3 of 19 NCLI Transportation Model 6. Carbon Calculations Both CSX and Norfolk Southern have carbon calculators based on freight weight and miles. Since the calculations are a constant based on miles, the percent reduction of carbon will be on a 1:1 relationship for any change in either rail or truck mileage. Pounds of CO2 per Ton-Mile 0.054 0.198 Mode of Transport Rail Truck http://www.nscorp.com/nscorphtml/future/carbon%20footprint0407-2.html http://www.csx.com/index.cfm/customers/tools/carbon-calculator/ Port Capability Comparison Port Direct Rail Loading Container Terminals Break Bulk Terminals Bulk Cargo Charleston, SC Jacksonville, FL Morehead City, NC Wilmington, NC CSX CSX NS CSX X X X X X X X X X X X X Heavy Lift Cargo X X http://www.port-of-charleston.com/charleston/inland/railconnections.asp http://www.jaxport.com/cargo/facilities/blount-island http://www.ncports.com/port_of_morehead_city_facilities.htm http://www.ncports.com/port_of_wilmington_facilities.htm Military Contacts at CSX http://www.csx.com/index.cfm/customers/commodities/military/ Page 4 of 19 RORO X X X X NCLI Transportation Model Rail Freight Analysis Methodology Publicly available tools are used to define distance and cost between the current ports of entry for the Army and Marines, with transportation to their respective east coast reset facilities and Ft. Bragg and Camp Lejeune in North Carolina. Alternatives are provided using Morehead City and Wilmington, NC for port of entry, with a centrally located reset facility in Kinston, NC. The rail model is based exclusively on movements by flat car for military freight with no intermodal moves. Costs are based upon rail transportation and switching costs using publicly available pricing from CSX Transportation and Norfolk Southern. Cost was developed using the CSX Price Look-Up tool, available for non-customer access. This tool provides cost per 100# at various cargo net weights and standard transportation carrier codes (STCC), for non-interline moves on CSX. The tool allows for point of origin and destination, providing rail mileage and fuel surcharge. The information was used as the basis for the CSX cost model data using a military freight STCC 3548420. The CSX Price Look-Up tool would not cost inter-line moves/through rates, i.e. moves that started on CSX and ended on a non CSX carrier. Therefore, costing was based on rail cost model “rule 11”, in which pricing is provided by each carrier as they move freight from point to point using their proprietary rail. The estimate used CSX direct price where available, and the NS table for subsequent point to point moves. In addition, a $250 fee was assessed for switch points when the carrier changed. For a comparison and model validity check, costs were also calculated using a Norfolk Southern (NS) rate table. This NS table showed rates for mileage ranges, for military freight transported on heavy duty flat cars. The table was for empty flat car moves, and as such was irrespective of cargo weight. To maintain model to model integrity, the car switching fee was included, as well as the CSX model fuel surcharge fees. The average rail car travels at approximately 21 miles per hour, after spending an average of 32 hours in a terminal waiting to be hooked up to a locomotive, to be hauled to another terminal, based on CSX performance reporting for Q4 2010. Rail car speeds are an average for all types of rail cars. Terminal transfer times are based on data available for Alabama, Georgia, and North Carolina. http://shipcsx.com/public/ec.shipcsxpublic/Main?module=public.pricing http://www.nscorp.com/mktgpublic/publicprices http://www.railroadpm.org/ http://www.railroadpm.org/home/RPM/Performance%20Reports/CSX.aspx Page 5 of 19 NCLI Transportation Model Rail Service Availability by Location Location CSX Norfolk Transportation Southern Port n/a Available Port Available n/a Army Reset Movements Port Available Available Reset Depot n/a Available 1 Base Available n/a Marine Corps Reset Movements Port Available Available2 Reset Depot n/a n/a3 Base n/a Available4 Description Morehead City, NC Wilmington, NC Charleston, SC Anniston, AL Fort Bragg, NC Jacksonville, FL Albany, GA Camp Lejeune, NC Other GFRR CPLJ 1 CSX transfers to Cape Fear RR (CF) at Fayetteville, NC 2 CSX direct load at Blount Island, FL and transfers to NS in Jacksonville, FL 3 NS ends at Sparks, GA and transfers to Georgia Florida RR (GFRR) 4 NS ends at Havelock, NC and transfers to Camp Lejeune RR (CPLJ) Typical Equipment and Weights Vehicle Max GVW (tons) Length (feet) Per Rail Flat Car Total Tons LAV Light Armored Vehicle 14 22 3 42 MTVR Medium Tactical Vehicle Replacement 15 27 2 30 MRAP Mine Resistant Ambush Vehicle 29 29 2 58 http://www.army-technology.com/projects/rg33-mrap/ http://www.oshkoshdefense.com/products/6/mtvr# Page 6 of 19 NCLI Transportation Model Army Reset Logistics: Option 1A – Use Wilmington, NC as Port of Entry Total Transportation Rail CSX NS Transit Route Miles Cost Model Cost Model Hours Charleston, SC – Anniston, AL – 885 $ 9,992 $ 6,385 106 Ft. Bragg, NC Wilmington, NC – Kinston, NC – 297 $ 7,902 $ 3,972 78 Ft. Bragg, NC Percent Reduction 66% 21% 38% 26% # of CO2 2,151 722 66% The table above defines the baseline distance and costs for movements of a single train flat car carrying an estimated load of 45 short tons (90,000 #), for the entry at the Port of Charleston, SC and transport to Anniston, AL for reset. This would yield an approximate 66% reduction in rail miles and pounds of CO2 from the baseline. Transit time is reduced by approximately 26%, and the corresponding cost reduction ranges between 21% for estimated “point to point”, and 38% for estimated “through rate” costing. The baseline freight movement from Charleston, SC was routed to Atlanta via CSX, and transferred to NS for the final movement into Anniston. The post-reset routing to Ft. Bragg was to Columbia, SC via NS, and then transfer to CSX. The comparison shows cargo coming into the Port of Wilmington, NC and moving directly by CSX rail to a reset facility in Kinston, NC and then to Fort Bragg. Army Reset Logistics: Option 2A – Use Morehead City as Port of Entry Total Transportation Rail CSX NS Transit Route Miles Cost Model Cost Model Hours Morehead City, NC – Kinston, NC – 225 $ 5,431 $ 3,542 43 Fort Bragg, NC Percent Reduction 75% 46% 45% 60% # of CO2 547 75% As an alternative, option 2A shows cargo coming into the Port of Morehead City, NC and moving to Kinston, NC via NS for reset. The post reset move to Fort Bragg is via NS and then CSX. This would yield an approximate 75% reduction in rail miles and pounds of CO2 from the baseline. Transit time is reduced by approximately 60%, and the corresponding cost reduction ranges between 45% based on estimated “through rate”, and 46% for estimated “point to point” costing. Page 7 of 19 NCLI Transportation Model Marine Corps Reset Logistics: Option 1M – Use Morehead City as Port of Entry Total Transportation Rail CSX NS # of Transit Route Miles Cost Model Cost Model CO2 Hours Jacksonville, FL – Albany, GA – 908 $ 13,017 $ 7,291 171 2,206 Camp Lejeune, NC Morehead City, NC – Kinston, NC – 154 $ 4,600 $ 3,174 39 374 Camp Lejeune, NC Percent Reduction 83% 65% 56% 77% 83% The table above defines the baseline distance and costs for movements of a single train flat car carrying an estimated load of 45 short tons (90,000 #), for the entry at Blount Island at the Port of Jacksonville, FL and transport to the Marine Corps Logistics Base (MCLB) in Anniston, AL for reset. This would yield an approximate 83% reduction in rail miles and pounds of CO2 from the baseline. Transit time is reduced by approximately 77%, and the corresponding cost reduction ranges between 56% based on estimated “through rate”, and 65% for estimated “point to point” costing. The baseline freight movement from Jacksonville, FL was routed to Georgia, southeast of Anniston, and transferred to the Georgia Florida Rail Road (GFRR), which services the Marine Corps Logistics Base (MCLB) from the south. The post-reset routing to Ft. Bragg was GFRR to a CSX line in Thomasville, GA for transit to Goldsboro, NC to NS, where it is conveyed by Havelock, and finally transferred to the Camp Lejeune Rail Road (CPLJ) for delivery. The comparison shows cargo coming into the Port of Morehead City, NC and moving by NS to Kinston, NC for reset. The post-reset routing is NS to Havelock, NC and transferring to CPLJ RR to Camp Lejeune. Marine Corps Reset Logistics: Option 2M – Use Wilmington, NC as Port of Entry Total Transportation Rail CSX NS # of Transit CO2 Route Miles Cost Model Cost Model Hours Wilmington, NC – Kinston, NC – 227 $ 7,072 $ 3,543 75 552 Camp Lejeune, NC Percent Reduction 75% 46% 51% 56% 75% As an alternative, option 2M shows cargo coming into the Port of Wilmington, NC and moving to Kinston, NC via a proposed link between Castle Hayne and Wallace, NC. Post reset move to Camp Lejeune is via CSX to Goldsboro, NS to Havelock, and CPLJ RR to Camp Lejeune. This would yield an approximate 75% reduction in rail miles and pounds of CO2 from the baseline. Transit time is reduced by approximately 56%, and the corresponding cost reduction ranges between 46% for estimated “point to point”, and 51% for estimated “through rate” costing. Page 8 of 19 NCLI Transportation Model Additional Army Base Movements by Rail Transportation Miles Mileage Port of To / From Charleston Ft. Drum, NY 1,633 Ft. Campbell, 537 KY Ft. Stewart, 618 GA Port of Wilmington 996 Mileage Reduction 637 Percent Reduction 39% # of CO2 Reduction / TL 1,548 978 (441) (82%) (1,072) 564 54 9% 131 Reduction (hours) 30 (53) 3 Percent Reduction 21% (59%) 2% Total Time in Transit Transit Time Port of To / From Charleston Ft. Drum, NY 141 Ft. Campbell, KY 90 Ft. Stewart, GA 125 Total Estimated Cost Estimated Cost Port of To / From Charleston Ft. Drum, NY $10,802 Ft. Campbell, KY $ 7,831 Ft. Stewart, GA $ 7,897 Port of Wilmington 111 143 123 Port of Wilmington $ 8,356 $ 9,326 $ 7,860 Savings per Rail Car $ 2,446 ($ 1,495) $ 37 Percent Savings 23% (19%) 0% The above estimates compare movement of Army equipment from their baseline movement from the Port of Charleston, SC, to Anniston, Alabama and then on to three separate bases in Georgia, Kentucky, and New York. The Port of Wilmington was used as a baseline for comparison. The move to Ft. Drum, NY carried the most benefit, while the moves to Ft. Campbell and Ft. Steward do not represent an opportunity. Page 9 of 19 NCLI Transportation Model Truck Freight Analysis Methodology Motor carrier mileage and rates were based on legal loading and size movements of “freight all kinds” (FAK) shipments for current eastern seaboard and North Carolina port. A baseline using existing Army and Marine port of entry to existing reset facilities was created, and compared to a reset facility in Kinston, NC from a “generic” NC port to simplify the comparison. The generic NC port used an “average” distance of 80 miles from port reset in Kinston, NC. This was developed since the distance from the Port of Morehead City to Kinston is 71 miles, and Port of Wilmington to Kinston is 89 miles. The range of shipments, and average 80 mile distance, fall into a standard short haul (minimum) cost rate for full truck load moves. This allowed for a simplified estimating process. Actual mileage and costs estimates were obtained from a major 3PL company for movement of FAK from Jacksonville, FL, Charleston, SC and Wilmington, NC to all military installations in NC. These rates provided either an actual or a foundation to estimate other moves in the model. In addition, rates were determined using a publicly available tool for freight cost estimation. Mileage and costs from each source were compared and an average rate was developed using the two sources, with the exception of short haul fees within NC, in which case the 3PL actual rates were used. Transit time was calculated based on a single driver, which correlates to the cost estimate methodology. Using a single over the road driver, a motor carrier may only drive 11 hours, and then take a mandate rest period of 10 hours. Therefore, transit time in the model account for rest periods. Note that rest periods may be eliminated by two driver teams, but this is not used. The average speed for travel is 55 mph based on Department of Transportation data mph for the eastern US corridors relating to this study. The DOT buffer indexes for reliability were not factored in, which discounts late delivery due to unforeseen traffic delays. CO2 estimates were developed for a standard 30,000 pound load, using the standard pounds per ton-mile estimator provided through Norfolk Southern rail road. http://www.globalshippingcosts.com/calc/index.php?type_cargo=land http://www.fmcsa.dot.gov/rules-regulations/topics/hos/index.htm http://www.ops.fhwa.dot.gov/freight/freight_analysis/perform_meas/fpmtraveltime/ http://www.ops.fhwa.dot.gov/freight/freight_analysis/state_info/north_carolina/nc.htm Page 10 of 19 NCLI Transportation Model Army Motor Carriage Analysis Transportation Miles Mileage Port of NC Port To / From Charleston of Entry Ft. Bragg, NC 890 169 Ft. Drum, NY 1,514 823 Ft. Campbell, KY 705 755 Ft. Stewart, GA 747 456 Total Time in Transit Transit Time Port of To / From Charleston Ft. Bragg, NC 26.2 Ft. Drum, NY 47.5 Ft. Campbell, KY 22.8 Ft. Stewart, GA 23.6 Total Estimated Cost Estimated Cost Port of To / From Charleston Ft. Bragg, NC $ 3,340 Ft. Drum, NY $ 5,525 Ft. Campbell, KY $ 2,529 Ft. Stewart, GA $ 2,653 Mileage Reduction 721 691 (50) 291 NC Port of Entry 3.1 25.0 23.7 8.3 NC Port of Entry $ 846 $ 3,141 $ 2,869 $ 1,836 Percent Reduction 81% 46% (7%) 39% # of CO2 Reduction / TL 2,141 2,052 (149) 864 Reduction (hours) 23.1 22.6 (0.9) 15.3 Savings per Truck Load $ 2,494 $ 2,384 $ (341) $ 817 Percent Reduction 88% 47% (4%) 65% Percent Savings 75% 43% (13%) 31% The tables above compare baseline distance and cost for legal loading weight truck transportation for Army equipment. The comparison is between port of entry at Charleston, SC to the current reset facility in Anniston, AL, and port of entry in North Carolina to a reset facility in Kinston, NC. Mileage and cost is then added to each Army base from the respective reset facilities. The largest improvement is to Ft. Bragg, NC with an approximate 81% reduction in truck miles and pounds of CO2 from the baseline. The corresponding transit time reduction is approximately 88%, with an approximate 75% cost reduction, based on full truckload pricing. The moves to Ft. Drum, NY and Ft. Stewart, GA carried the most benefit, while the move to Ft. Campbell, KY does not represent an opportunity. Page 11 of 19 NCLI Transportation Model Marine Corps Motor Carriage Analysis Transportation Miles Mileage Port of To / From Jacksonville Camp 760 Lejeune, NC NC Port of Entry Mileage Reduction Percent Reduction # of CO2 Reduction / TL 132 628 83% 1,865 Total Time in Transit Transit Time Port of To / From Jacksonville Camp Lejeune, NC 23.8 Total Estimated Cost Estimated Cost Port of To / From Jacksonville Camp Lejeune, NC $ 2,739 NC Port of Entry 2.4 NC Port of Entry $ 774 Reduction (hours) 21.4 Percent Reduction 90% Savings per TL $ 1,965 Percent Reduction 72% The tables above compare baseline distance and cost for legal loading weight truck transportation for Marine equipment. The comparison is between port of entry at Jacksonville, FL to the current reset facility in Albany, GA, and port of entry in North Carolina to a reset facility in Kinston, NC. Mileage and cost is then added to provide transportation to Camp Lejeune. From the baseline, there is an approximate 83% reduction in truck miles and pounds of CO2 from the baseline. The corresponding transit time reduction is approximately 90%, with a cost reduction of approximately 72%, based on full truckload pricing. Page 12 of 19 NCLI Transportation Model Travel Time: Reset Facility to Military Location Army Motor Transit Time Comparison: Reset to Military Location Anniston, AL Kinston, NC Hours Percent To / From (hours) (hours) Reduction Reduction Ft. Bragg, NC 8.6 1.6 7.0 81% Ft. Drum, NY 29.9 23.5 6.4 21% Ft. Campbell, KY 5.2 22.3 (17.1) (327%) Ft. Stewart, GA 6.0 6.8 (0.9) (14%) Army Rail Transit Time Comparison: Reset to Military Location Anniston, AL Kinston, NC Hours Percent To / From (hours) (hours) Reduction Reduction Ft. Bragg, NC 55.3 39.3 16.0 29% Ft. Drum, NY 90.9 73.9 17.0 19% Ft. Campbell, KY 47.8 105.0 (57.2) (120%) Ft. Stewart, GA 83.6 85.3 (1.7) (2%) Marine Corps Transit Time Comparison: Reset to Military Location Transit Time Albany, GA Kinston, NC Reduction Percent Mode To / From (hours) (hours) (hours) Reduction Motor Camp Lejeune, NC 9.7 0.9 8.8 90% Rail Camp Lejeune, NC 129.1 37.2 91.9 71% The above tables summarize the transit times from the reset facilities to their associated military destinations. The tables can be used for comparison along with the total transit times to determine where the largest net benefit is derived. Moves originating and ending within North Carolina show the most benefits it both total and post reset transit time. The next most beneficial is the movement to Ft. Drum, NY based on its northern US location. The benefit for servicing Ft. Stewart, GA is primarily the reduction for movement from port of entry to reset. The baseline post reset distance/transit times are approximately the same as a Kinston, NC reset and transit to Ft. Stewart, GA. The total transit distance/time to Ft. Campbell, KY is essentially the same, but post reset movement from NC is extremely disadvantaged due to the proximity of Anniston, Al to Ft. Campbell, KY. Page 13 of 19 N NCLI Trannsportationn Model http:///www.bytraain.org/quickklinks/pdf/ncc_railmap_10.pdf Page 14 of 19 N NCLI Trannsportationn Model http:///sccommercce.com/sites//default/filess/document__directory/Raail_Plan__Souuth_Carolina_ _State_Rail__Plan_2008__Part_3_Exiisting_System m_Wilbur_S Smith_Assocc iates__2009.pdf P Page 15 of 19 N NCLI Trannsportationn Model http:///www.dot.sttate.ga.us/maps/Documeents/railroadd/Georgia_Raail_Map_2004.pdf P Page 16 of 19 N NCLI Trannsportationn Model http://ww ww.dot.state.ffl.us/rail/pubblications.shttm Page 17 of 19 NCLI Transportation Model http://www.dot.state.al.us/images/RailMapF.pdf Page 18 of 19 NCLI Transportation Model CSX to Norfolk Southern Switching Points by State AL AL AL AL AL AL AL AL AL AL AL AL AL AL AL AL AL AL AL Autauga Creek Autauga Dtc Bell Street Bessemer Birmingham Birmingham TOFC Caictf Calera Coosa Pines Decatur Ensley Lemoyne Mobile Montgomery Montgomery TOFC Opelika Sibert Os South Birmingham Stevenson FL FL FL FL FL FL FL FL FL Edgewood Grand Junction Os Jacksonvil Acorn St Jacksonvil Moncrief Jacksonville Jacksonville Fec Jacksonville TOFC Jacksonvl Market St Lake City GA GA GA GA GA GA GA GA GA GA GA GA GA GA GA GA Atlanta Augusta Augusta Aei 02 Augusta Yard Cp Augusta Yard Limite Broad Street Dtc Brunswick Cordele Gainesville Harrisonville Jesup Madison Old Yard Savannah South Jesup Valdosta NC NC NC NC NC NC NC NC NC NC NC NC NC NC NC Charl TOFC Charlotte Durham Fayetteville Goldsboro Greenville High Point Lee Creek Lexington North Wilson Raleigh Selma Wadesboro Wilson Winston Salem SC SC SC SC SC SC SC SC SC SC SC Berkeley Catawba Charleston Charleston Coop Yd Charleston TOFC Columbia Giant Newberry Orangeburg Spartanburg Spartanburg Wye Cp VA VA VA VA VA VA VA VA VA VA VA VA VA VA VA Franklin Franklin Dd Glasgow Hopewell Lynchburg Norfolk Petersburg Portsmouth TOFC Richmond Richmond Acca Richmond Fulton Richmond TDSI Richmond TOFC Suffolk Waynesboro Page 19 of 19


© Copyright 2026