
Part 1 Ten highlights in health statistics
World Health Statistics
2008
Part 1
Ten highlights in
health statistics
7
World Health Statistics
2008
P r o gres s to wa rds M DG 5:
m ater n al m ortal ity
The target for monitoring progress towards Millennium Development Goal 5 (MDG 5) (improve maternal health) is to
reduce the maternal mortality ratio in all countries so that by 2015 it is one quarter of its 1990 level. This indicator is
often described as the most seriously “off track” of all the health-related MDG indicators. The most recent interagency
estimates developed by technical experts from academic institutions and international agencies (WHO, UNICEF, UNFPA
and the World Bank) provide updated data on maternal mortality, while acknowledging the large uncertainty in these
estimates because there are few or no data available for most high-mortality countries.1
Pregnancy and childbirth are still dangerous for most women
The latest estimate is that 536 000 women died in 2005 as
a result of complications of pregnancy and childbirth, and
that 400 mothers died for every 100 000 live births (this
is the “maternal mortality ratio”, the main indicator of the
safety of pregnancy and childbirth). The maternal mortality
ratio was 9 in developed countries, 450 in developing
countries and 900 in sub-Saharan Africa. This means that
99% of the women who died in pregnancy and childbirth
were from developing countries. Slightly more than half
of these deaths occurred in sub-Saharan Africa and about a
third in southern Asia: together these regions accounted for
over 85% of maternal deaths worldwide.
MATERNAL MORTALITY RATIO PER 100 000 LIVE BIRTHS, 2005
< 15
15 – 199
200 – 499
500 – 999
≥ 1000
Data not available
Maternal mortality is declining too slowly
Meeting the MDG target for maternal mortality requires
a decline in the maternal mortality ratio of around 5.5%
each year. No region in the world has achieved this result.
8
Globally, the maternal mortality ratio showed a total fall of
5.4% in the 15 years between 1990 and 2005, an average
reduction of 0.4% each year.
World HealtH StatiSticS
2008
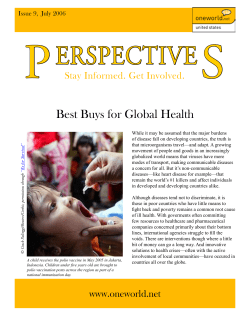
(A) MATERNAL MORTALITY RATIO BY REgION, 1990 ANd 2005; (B) SOuRCES OF MATERNAL MORTALITY dATA
IN 2005 (PERCENTAgE OF gLOBAL BIRTHS COVEREd BY EACH dATA SOuRCE)
1000
Ratio per 100 000 live births
900
800
1990
National civil
registration
2005
No national data
700
600
14%
25%
500
400
300
200
Special studies
and other sources
100
0
Develo ped
regio ns
CIS
co untries
No rthern
Latin
A frica
A merica &
the Caribbean
A sia
Oceania
SubSaharan
A frica
32%
13%
Sample civil
registration
16%
Household surveys
(A)
(B)
In sub-Saharan Africa, where most deaths occur and the
risk for individual women is very high, there was hardly
any improvement between 1990 and 2005. Nevertheless,
significant progress was made in eastern and south-eastern
Asia, Latin America and the Caribbean, northern Africa
and Oceania. In eastern Asia, where the largest decline was
recorded, the maternal mortality ratio fell by more than
40% between 1990 and 2005.
Understanding the data and estimates
The uncertainty surrounding these estimates is very
wide: the number of maternal deaths globally could be
as low as 220 000 or as high as 870 000 and the global
maternal mortality ratio could be as low as 220 or as
high as 650 per 100 000 live births.
Counting maternal deaths accurately requires a system
for recording deaths among women of reproductive
age and a system for identifying and recording the
cause of death. Estimating the maternal mortality
ratio requires a system for counting the number of
live births as well. At present, only one in eight of
the world’s births occurs in countries where births
and deaths are counted and where causes of death are
identified and recorded accurately. Most countries use
surveys of a limited sample of households to produce
maternal mortality statistics but, although there
are a number of different survey methods, all have
important weaknesses. A quarter of the world’s births
take place in countries where there are no complete
civil registration systems at all.
The maternal mortality estimates for countries
without good systems of civil registration are in some
cases corrected statistics and in other cases predicted
statistics. Corrected statistics are based on survey data,
adjusted in various ways to deal with missing data,
bias and different data collection methods. Predicted
statistics are presented for around one third of countries
with no recent, nationally representative surveys.
Predicted maternal mortality estimates are generated
by a statistical model, built up from observations in 73
developing countries for which good data are available.
Because of the uncertainty surrounding estimates
derived from statistical modelling, predicted values
are not appropriate for monitoring trends.
Only a few countries have empirical data on maternal
mortality for more than one year, and these are mostly
middle-income countries and countries with initial
maternal mortality ratios below 200 deaths per
100 000 live births. The trend estimates described
here have been derived using statistical techniques
that make the most efficient use of incomplete data.
The limitations of the available data mean that it is
only possible to generate trend estimates at the global
and regional levels.
9
World Health Statistics
2008
C o v e ra ge g a p a n d in equ ity in
m at e rn al, n eon atal a n d child
hea lth in terven tions
Coverage, defined as the percentage of people receiving a specific intervention among those who need it, is a key
health system output and an essential indicator for monitoring health service performance.2 Using data available from
Demographic and Health Surveys (DHS) and UNICEF’s Multiple Indicator Cluster Surveys (MICS), a new study conducted
in the context of the Maternal, Newborn and Child Survival Countdown examines gaps in coverage in maternal, neonatal
and child health interventions (services that are essential to reach Millennium Development Goals (MDG) 4 and 5) and
patterns of inequality in 54 countries that represent more than 90% of maternal and child deaths worldwide each year.3
Gaps in coverage range from 20% to over 70%
The coverage gap is an aggregate index of the difference
between observed and “ideal” or universal coverage in
four intervention areas: family planning, maternal and
neonatal care, immunization, and treatment of sick
children. Estimates from the most recent surveys showed
that the mean overall gap across all 54 countries was
43%, with values for individual countries ranging from
more than 70% in Chad and Ethiopia to less than 20%
in Peru and Turkmenistan. In 18 of the 54 countries,
the gap was 50% or more; it was between 30% and 49%
in 29 countries and less than 30% in the remaining
7 countries.
Coverage gap observed in latest (around 2005) and earliest (prior to 2000) periods,
by country
/DWHVW\HDU
3HUX
(J\SW
3KLOLSSLQHV
,QGRQHVLD
(DUOLHVW\HDU
0RURFFR
7DMLNLVWDQ
0DODZL
8QLWHG5HSXEOLFRI7DQ]DQLD
/HVRWKR
%ROLYLD
*DPELD
,QGLD
&DPERGLD
%DQJODGHVK
0R]DPELTXH
&{WHG¶,YRLUH
1HSDO
%HQLQ
8JDQGD
0DGDJDVFDU
&DPHURRQ
*XDWHPDOD
5ZDQGD
6LHUUD/HRQH
*XLQHD%LVVDX
7RJR
%XUNLQD)DVR
&HQWUDO$IULFDQ5HSXEOLF
(ULWUHD
*XLQHD
1LJHU
0DOL
1LJHULD
(WKLRSLD
&RYHUDJHJDS
10
World Health Statistics
2008
Gradual but slow progress in most countries
In the 40 countries that had been subject to at least
two surveys since 1990, the coverage gap fell in all
except four – Chad, Kenya, Zambia and Zimbabwe –
where it increased. On average, the gap fell by about
0.9 percentage points per year. Only in Cambodia
(2000–2005), Mozambique (1997–2003) and Nepal
(2000–2005) was the decline more than 2 percentage
points per year. Analysis of change by intervention area
showed that collectively, in countries where a positive
trend was recorded, the largest contribution to the
decline in the coverage gap came from immunization
(33%), closely followed by maternal and neonatal care
(30%), family planning (20%) and treatment of sick
children (17%).
Up to three times larger gaps among the poor
There are large within-country differences in the coverage
gap between the poorest and wealthiest population
quintiles. In India and the Philippines, the wealthiest
groups are three times more likely to receive care than
the poorest. In terms of absolute difference, Nigeria has
the largest inequity in coverage: the difference between
maximum and actual coverage is 45 percentage points
larger for the poorest than for the best-off population
quintile. Some countries, including the formerly
socialist republics Azerbaijan and Turkmenistan,
have remarkably small differences by wealth quintile.
Inequalities between population groups are particularly
high for maternal and neonatal care, which includes
antenatal care and the presence of a skilled attendant at
delivery. For these interventions, the coverage gap for
the poorest and best-off quintiles differs by 33.9%. The
difference is smallest for the treatment of sick children
and family planning.
(A) COVERAGE GAP FOR THE POOREST AND BEST-OFF QUINTILES, BY COUNTRY; (B) COVERAGE GAP FOR
THE POOREST AND BEST-OFF QUINTILES, BY INTERVENTION AREA
&KDG
3RRUHVW
TXLQWLOH
%HVWRII
TXLQWLOH
(WKLRSLD
1LJHULD
'HPRFUDWLF5HSXEOLFRIWKH&RQJR
70
+DLWL
60
Coverage gap (%)
(ULWUHD
*KDQD
%DQJODGHVK
0R]DPELTXH
.HQ\D
&DPERGLD
,QGLD
H
=LPEDEZ
30
0
7XUNPHQLVWDQ
40
10
(J\SW
3HUX
50
20
,QGRQHVLD
3KLOLSSLQHV
%UD]LO
Poorest quintile
Best-off quintile
Family planning
Immunization
Maternal and
neonatal care
Intervention areas
Treatment of
sick children
&RYHUDJHJDS
(A)
(B)
11
World HealtH StatiSticS
2008
Understanding the data and estimates
The coverage gap index is a summary measure of the
difference between maximum and actual coverage for
key interventions. It has been constructed to reflect
a range of essential public health interventions that
draw on different health system delivery strategies.
Such a summary measure is useful because a general
picture cannot easily be obtained from looking at a
large number of indicators. Nevertheless, the aggregate
index is not intended to replace existing measures for
the coverage of individual interventions.
Ideally, a summary measure would include a set of
interventions with the largest impact on health and
mortality. The components of the coverage gap could
then be weighted according to potential health gains.
At present, long-term reliable and comparable data
(from 1990) are available only for the areas of family
planning, maternal and neonatal care, immunization,
and treatment of sick children. For each of these areas,
between one and three specific indicators were selected
for the analysis. These included: need for family
planning satisfied; antenatal care use; skilled birth
attendant; coverage with BCG, measles and DPT3
vaccination; and treatment for diarrhoeal disease and
suspected pneumonia. A broader set of interventions
12
would provide a more complete picture of coverage
trends, but is currently not available. Future analyses
should include a broader set of interventions in the field
of maternal, neonatal and child health (e.g. insecticidetreated bednets or vitamin A supplementation) and
also adult health (e.g. antiretroviral therapy coverage,
mammography screening).
All coverage indicators for maternal, neonatal and
child health rely on household survey data. This allows
computation of gaps by background characteristics
such as wealth, education or place of residence, which
would not have been possible with clinical data.
Coverage statistics from household surveys rely on
the accuracy of responses from respondents and this
could affect especially the assessment of treatment of
childhood illness, as there may well be variations in the
accuracy of reporting of symptoms by socioeconomic
status. Asset indices also present some limitations
owing to the fact that different choices of assets for the
construction of the index can result in changes in the
classification of households. Despite these limitations,
however, the coverage gap measure consistently
demonstrates wide coverage gaps and consistent trends
over time in most Countdown study countries.
World Health Statistics
2008
m
esti ates are revised
down wards
AIDS
HIV
/
HIV/AIDS is one of the most urgent threats to global public health. Most of the infections with HIV and deaths due to
the disease could be prevented if people everywhere had access to good services for preventing and treating HIV infection.
Estimates of the size and course of the HIV epidemic are updated every year by UNAIDS and WHO.4 In 2007, improved
survey data and advances in estimation methodologies led to substantially revised estimates of numbers of people living
with HIV, of HIV-related deaths and of new infections worldwide.
The number of people living with HIV continues to rise but is lower
than previously estimated
The number of people living with HIV worldwide in 2007
was estimated at 33.2 million; there may be as few as 30.6
million or as many as 36.1 million. The latest estimates
cannot be compared directly with estimates published in
previous years. The new data and improved methods used
in 2007 also led to a substantial revision of the estimates
for 2006 and before. For instance, the new best estimate for
2006 is now 32 million and not 39.5 million as published
in 2006. For 2000, UNAIDS and WHO now estimate
that 27.6 million people were infected, compared with
36.1 million estimated at that time.
(A) NUMBER OF PEOPLE LIVING WITH HIV: PREVIOUS AND CURRENT ESTIMATES, 2000–2007;
(B) PREVALENCE OF HIV INFECTION AMONG ADULTS, 1990–2007: COMPARING SUB-SAHARAN AFRICA
AND THE GLOBAL AVERAGE
43
Previous estimate
Current best estimate
7
Sub-Saharan Africa
Global
39
6
37
5
35
33
Prevalence (%)
Number of people infected (millions)
41
Upper bound
31
Lower bound
4
3
29
2
27
1
25
2000
2001
2002
2003
2004
2005
2006
2007
Year
0
1990
1995
Year
2000
2005
(A)
(B)
Sub-Saharan Africa continues to be the region most
affected by HIV/AIDS. In 2007, one in every three
people in the world living with HIV lived in subSaharan Africa, a total of 22.5 million. Although other
regions are less severely affected, 4 million people in
south and south-east Asia and 1.6 million in eastern
Europe and central Asia were living with HIV/AIDS.
13
World HealtH StatiSticS
2008
While total numbers of people living with HIV have risen, overall
prevalence has not changed
Although the total number of people living with HIV
has increased significantly over the years, the proportion
infected has not changed since the end of the 1990s. In
fact, the number of people who become infected every
day (over 6800) is greater than the number who die
of the disease (around 6000). Worldwide, 0.8% of the
adult population (aged 15–49 years) is estimated to be
infected with HIV, with a range of 0.7–0.9%.
In sub-Saharan Africa, the estimated proportion of the
population infected has actually fallen steadily since
2000. Current data indicate that HIV prevalence reached
a peak of nearly 6% around 2000 and fell to about 5% in
2007. This reflects significant changes in high-risk forms
of behaviour in a number of countries but is also a result
of the maturity of the pandemic, especially in sub-Saharan
Africa where HIV first took hold among the general
population.
Understanding the data and estimates
HIV infection is detected by testing for HIV
antibodies in the blood, although in practice only a
small proportion of people ever have an HIV test. This
is particularly true in developing countries, where
access to health care services is limited. For many
years, scientists trying to estimate HIV prevalence had
to rely on tests carried out on the blood of pregnant
women attending antenatal care in clinics equipped
to test for HIV. There are many problems in relying
on this approach. Not all women attend for antenatal
care and not all antenatal clinics have the ability to
test for HIV, although in some cases tests are done at
central level. In general, both antenatal care attendance
and availability of antibody testing are higher in
urban than in rural areas. In addition, bias can arise
because pregnant women are not representative of
the population at risk of HIV infection, especially in
settings where HIV is largely confined to high-risk
groups such as sex workers or men who have sex with
men. In some settings, HIV testing of groups at high
risk of infection has been used to estimate overall
prevalence, but these estimates will be accurate only if
infection outside the high-risk groups is low.
More recently, it has been possible to introduce antibody
testing into household surveys that have large samples
of the population selected at random. This gives a
more unbiased estimate of the overall prevalence of
HIV infection, provided survey participation rates are
high. Since 2001, 30 countries in sub-Saharan Africa,
Asia and the Caribbean have included HIV testing
in household surveys. It was found that prevalence
estimates from surveys are generally lower than those
calculated on the basis of pregnant women or highrisk groups. The most dramatic example of this was in
India: in the National Family Health Survey, 100 000
adults from all over the country were tested for HIV
and 0.28% were found to be infected, half the level
generated by the earlier methods. This has resulted
in a significantly lower estimate of the number of
14
people living with HIV in India. Overall, 70% of
the downward adjustment in 2007 is accounted for
by new figures for just six countries: Angola, India,
Kenya, Mozambique, Nigeria and Zimbabwe.
There have also been improvements to the methods
used for estimating HIV prevalence in countries
without survey-based data. For example, it is now
clear that pregnant women attending antenatal clinics
in major cities are more likely to be infected with HIV
than adults in general. Therefore, reliance on testing
women in urban antenatal clinics tends to overestimate
the prevalence of HIV. The new estimates have been
adjusted to reflect this.
Estimating mortality due to AIDS is difficult in
developing countries, where most deaths occur but
where systems for counting deaths and recording cause
of death are weak or nonexistent.
Currently, new infection rates and deaths due to
HIV/AIDS are estimated from the application of
statistical models using data on HIV prevalence,
average time between HIV infection and death in
the absence of treatment, and survival rates of people
receiving treatment. In the absence of antiretroviral
treatment, the net median survival time after infection
with HIV is now estimated to be 11 years, instead of
the previously estimated 9 years. These changes are
based on recent information generated by longitudinal
research studies. For the same level of prevalence, this
longer average survival period has resulted in lower
estimates of new infections and deaths due to AIDS.
The contribution of the number of people on
antiretroviral treatment to the total number of people
living with HIV/AIDS is still small. In the future,
however, as more people benefit from treatment and
live longer with HIV infection, this will increasingly
affect the number of people in the world living with
HIV/AIDS.
World Health Statistics
2008
P r o g r e s s in the fight against
ma lar ia
Malaria is endemic in many of the world’s poorest countries. The MDG target aims to have halted and begun to reverse
the incidence of the disease by 2015. Indicators for monitoring progress include the proportion of the population in
risk areas using effective prevention and treatment measures, and the incidence and death rates associated with malaria.
In Africa, where 80% of the global burden of malaria occurs,5 new data from household surveys and research analysis
based on surveillance data allow one to assess changes in intervention coverage in the fight against malaria in the region.
Nevertheless, further efforts are needed to accurately monitor progress towards the MDG target and evaluate the intensified
efforts against malaria.6 Most countries in the region still lack good standard measurement tools.
Use of insecticide-treated nets has increased substantially
Insecticide-treated nets (ITNs) are a cheap and highly
effective way of reducing the burden of malaria. They
prevent malaria transmission and reduce the need for
treatment, thus lessening pressure on health services
and averting deaths, especially in young children. In the
majority of the 21 African countries with data from at least
two national surveys, the proportion of children sleeping
under ITNs increased five to ten times within five years.
These observed increases reflect trends in the production
of nets and in resources available for their procurement,
which have both increased substantially in the past five
years.7
Percentage of children sleeping under ITNs in selected African countries: previous year
(around 2000) and latest year (around 2005)
Sao Tome and Principe
Gambia
Guinea-Bissau
Togo
Zambia
Malawi
Ghana
Benin
United Republic of Tanzania
Central African Republic
Rwanda
Cameroon
Uganda
Burkina Faso
Burundi
Senegal
Niger
Côte d’Ivoire
Democratic Republic of the Congo
Sierra Leone
Kenya
0
10
Previous year
20
30
40
Latest year
50
60
Children sleeping under ITNs (%)
15
World Health Statistics
2008
The poor do not benefit as much from malaria intervention coverage
Intervention indicators at national level often hide
important within-country disparities. A malaria indicator
survey (MIS) from Zambia, a country with endemic
malaria, showed that children living in the wealthiest
households are better protected by bednets; they have a
lower chance of carrying the malaria parasite, and when
they fall sick they are more likely to be treated with
antimalarial medication. Similarly, pregnant women
living in better-off households are more likely to receive
intermittent preventive treatment than their poorer
counterparts. The pattern is not consistent across Africa,
however; in Eritrea and Gabon, for instance, there is no
difference in bednet use between different geographical
or income groups, while in Ghana the direction of the
relationship is unclear.8,9
Coverage of malaria interventions by wealth status: Zambia MIS 2006
/HDVWSRRUTXLQWLOH
3RRUHVWTXLQWLOH
3HUFHQWDJH
+RXVHKROGVWKDWKDG
UHVLGXDOVSUD\LQWKH
SUHYLRXVPRQWKV
&KLOGUHQXQGHUZKR
VOHSWXQGHUDEHGQHW
WKHSUHYLRXVQLJKW
&KLOGUHQXQGHUZLWK
IHYHUZKRWRRNDQ
DQWLPDODULDOGUXJ
3UHJQDQWZRPHQZKR
WRRNDSURSK\ODFWLF
DQWLPDODULDOGUXJ
&KLOGUHQXQGHU
ZLWKRXWPDODULDO
SDUDVLWHV
Studies are increasingly showing the impact of control measures
A recent study in Zanzibar showed that, following
deployment of antimalarial combined therapy, malariaassociated morbidity and mortality decreased dramatically:
crude under-five mortality decreased by 52% while infant
and child mortality declined by 33% and 71%, respectively.10
Similarly, in Eritrea, following implementation of multiple
intervention coverage, malaria morbidity and case fatality
fell by 84% and 40%, respectively.8,11
16
A more recent review of data from selected clinics in Rwanda
suggested a similarly large impact, whereby death rates
and malaria cases in children under five fell by about 66%
and 64%, respectively.12 The trend observed from inpatient
records was consistent with outpatient laboratory reports
obtained for all ages. The proportion of positive cases among
those suspected of having malaria (slide positivity rate)
declined sharply over time, from a high of about 50% in
September 2002 to below 20% five years later.
World HealtH StatiSticS
2008
PERCENTAgE OF OuTPATIENTS IN RWANdA WITH LABORATORY-CONFIRMEd MALARIA AMONg THOSE
SuSPECTEd OF HAVINg THE dISEASE, BY YEAR ANd MONTH, jANuARY 2002–dECEMBER 2007
60
50
40
30
20
Slide positivity rate
70
10
be
2005
2003
Year
em
2007
2006
2004
D
ec
Month
r
Ju
ne
Ja
nu
ar
y
0
2002
Understanding the data and estimates
MDG goal 6 for malaria requires the measurement of
two indicators: prevalence and mortality rate. Measuring
trends in these indicators requires health information
systems that produce timely and comparable
population-level statistics, complete surveillance
systems with well-functioning laboratories, and civil
registration systems with notification and assignment
of cause of death. In resource-poor settings, such
systems are either nonexistent or seriously inadequate.
As a result, analyses in high-burden countries are
based on multiple sources, mainly household surveys
and surveillance data from health facilities.
Malaria modules in health surveys or special malaria
indicator surveys are important sources of information
on levels and, when data are available for more than one
time period, on trends in intervention coverage. Some
malaria indicator surveys include biomarkers such as
malaria and anaemia prevalence. Intervention indicators
covered in such surveys include data on: ownership and
use of ITNs; exposure to indoor residual spraying against
mosquitoes; use of intermittent preventive antimalarial
therapy during pregnancy; and treatment practices for
children with suspected malaria. The last indicator is
often based on questions about fever in the previous
two weeks and the kind of drugs, if any, used to treat
the fever. Such recall data have several pitfalls, however:
mothers’ reports on fever in their children may not be
accurate; the child may have a fever but not malaria; and
recall of the type of medicines given is often poor and
may vary according to the socioeconomic background of
the respondent.
Surveillance reports from health facilities are the main
source of data on malaria morbidity and mortality in
Africa. Data routinely collected through surveillance
systems include the number of suspected malaria
cases, the number of laboratory-confirmed malaria
cases, and admissions to and deaths in health facilities.
In general, health facility data on malaria case rates
have to be interpreted with great caution for a number
of reasons. First, the term “prevalence” referring to
“parasitic infection” may not be directly relevant in
settings where malaria is endemic and transmission
rates are stable, because the majority of people in
such settings will have parasitic infection but will be
asymptomatic, and few have a laboratory confirmation
of the diagnosis. Second, patients seeking care are
more likely to have the disease, which means that the
slide positivity rate cannot be taken as reflecting the
actual prevalence in the population. Third, data on
trends in malaria cases and deaths in clinics have to be
interpreted carefully, because changes in the quality of
recording and reporting practices as well as changes in
the system of diagnosis could affect observed trends
over time. For instance, by using “clinical malaria”
cases in the analysis, the above-mentioned studies risk
including an unknown proportion of other diseases
that are diagnosed as malaria. It should also be noted
that not all those with severe malaria may seek care in
formal facilities, and some may die at home. Moreover,
for all studies, the data on intervention, malaria
morbidity and mortality are limited to a five-year
period or less, which may be too short to generalize
on long-term trends. Because of all these issues, it
is standard practice to adjust the reported data for
possible confounders and biases before they are used
for the purpose of MDG monitoring.6
17
World Health Statistics
2008
toba
o
cc
m
c
R
e d u in g deaths f ro
Tobacco use is the single largest cause of preventable death in the world today. The WHO report on the global tobacco epidemic,
200813 provides a comprehensive analysis, based on data from 135 countries, of patterns of tobacco use, the deaths that
result and the measures to reduce deaths.
Tobacco use is a risk factor for six of the eight leading causes of death
Tobacco kills a third to a half of all those who use it. On
average, every user of tobacco loses 15 years of life. Total
tobacco-attributable deaths from ischaemic heart disease,
cerebrovascular disease (stroke), chronic obstructive
pulmonary disease and other diseases are projected to rise
from 5.4 million in 2004 to 8.3 million in 2030, almost
10% of all deaths worldwide. More than 80% of these
deaths will occur in developing countries.
The eight leading causes of death worldwide and deaths attributable to tobacco use, 2005
'HDWKVPLOOLRQV
2WKHUWREDFFRFDXVHG
GLVHDVHV
,VFKDHPLF &HUHEURYDVFXODU /RZHU
KHDUW
GLVHDVH
UHVSLUDWRU\
GLVHDVH
LQIHFWLRQV
&KURQLF
REVWUXFWLYH
SXOPRQDU\
GLVHDVH
+,9$,'6
'LDUUKRHDO
GLVHDVHV
7XEHUFXORVLV
7UDFKHD
7REDFFRXVH
EURQFKXVOXQJ
FDQFHUV
+DWFKHGDUHDVLQGLFDWHSURSRUWLRQVRIGHDWKVWKDWDUHUHODWHGWRWREDFFRXVHDQGDUHFRORXUHGDFFRUGLQJWRWKHFROXPQRIWKHUHVSHFWLYHFDXVHRIGHDWK
,QFOXGHVPRXWKDQGRURSKDU\QJHDOFDQFHUVRHVRSKDJHDOFDQFHUVWRPDFKFDQFHUOLYHUFDQFHURWKHUFDQFHUVFDUGLRYDVFXODUGLVHDVHVRWKHUWKDQ
LVFKDHPLFKHDUWGLVHDVHDQGFHUHEURYDVFXODUGLVHDVHGLDEHWHVPHOOLWXVDVZHOODVGLJHVWLYHGLVHDVHV
Tobacco use is high in many countries
Tobacco use is highly prevalent in many countries.
According to estimates for 2005, 22% of adults worldwide
currently smoke tobacco. Some 36% of men smoke
compared to 8% of women.
Over a third of adult men and women in eastern and central
Europe currently smoke tobacco. Adult smoking prevalence
18
is also high in south-east Asia and northern and western
parts of Europe. However, nearly two thirds of the world’s
smokers live in just 10 countries: Bangladesh, Brazil, China,
Germany, India, Indonesia, Japan, the Russian Federation,
Turkey and the United States, which collectively comprise
about 58% of the global population.
World Health Statistics
2008
PERCENTAGE OF Tobacco use among adults, 2005
≤ 14.6
14.7 – 22.5
22.6 – 28.5
28.6 – 36.5
> 36.5
Data not available
The state of tobacco control policies in the world, 2005
100
Percentage of countries (number of countries inside bars)
15
21
18
14
90
22
80
70
No data
42
35
77
95
No policy
54
Minimal policies
65
60
Moderate policies
50
61
58
40
33
Complete policies
71
30
77
45
20
35
55
10
0
23
16
Smoke-free
environments
9
5
Cessation
programmes
Health
warnings
20
4
Advertising
bans
Taxation
* Note that for taxation, “No policy” implies an exise tax rate 25% or less. For smoke-free policy,
“No policy” means no smoke-free legislation or no smoke-free legislation covering either health
care or educational facilities.
19
World HealtH StatiSticS
2008
Efforts to control tobacco use reach only 5% of the world’s population
WHO recommends five policies for controlling tobacco
use: smoke-free environments; support programmes for
tobacco users who wish to stop; health warnings on tobacco
packs; bans on the advertising, promotion and sponsorship
of tobacco; and higher taxation of tobacco.
About half of all countries in the world implement none
of these five recommended policies, despite the fact that
tobacco control measures are cost-effective and proven.
Moreover, not more than 5% of the world’s population is
fully covered by any one of these measures.
Understanding the data and estimates
Data on the prevalence of smoking are obtained by
asking questions on tobacco use in population surveys.
However, such surveys differ widely in quality and
coverage, particularly with regard to representation
of all age groups. Some surveys cover only cigarette
smoking while others include the use of other tobacco
products such as pipes, cigars and chewing tobacco.
Some surveys count only daily users while others
include occasional users. There are international
standards for conducting surveys of tobacco use, but
not all countries are able to provide data meeting these
standards.
For the 2008 report, data were used from 135 countries
that satisfied international standards, taking into
account the date of the survey, the extent to which
it was representative of the general population, the
definition of smoking used and whether all age groups
were sampled. Eighteen countries provided data that
did not meet international standards, either because the
information was too old or because the survey methods
were not comparable. No data were available for
41 countries.
One common problem in comparing tobacco use
20
in different countries and at different times is that
changes in the age structure of the population can
affect tobacco use. It is important to avoid attributing
to government policy changes that are simply due
to changes in the population structure. To make
meaningful comparisons between countries and over
time, estimates of the prevalence of tobacco use need
to be age-standardized; this was achieved in the 2008
report by using the WHO standard population.
Data on the implementation of tobacco control
policies were collected from country focal points for
the WHO Tobacco Free Initiative. A standard set of
criteria is used to identify five local experts familiar
with their country’s policies. For the 2008 report, these
experts answered 32 questions about their country’s
tobacco control policies and practice. Although the
questionnaires used are standardized, self-assessment
of performance by the countries themselves may
introduce some reporting biases, although the level
and direction are difficult to quantify. The data do,
however, present a compelling picture of how much
still needs to be done to implement tobacco control
policies.
World Health Statistics
2008
c
c
B
reas t an e r :
m ortal i ty an d s creen ing
Globally, cancer is one of the top ten leading causes of death.5 It is estimated that 7.4 million people died of cancer in
2004 and, if current trends continue, 83.2 million more will have died by 2015. Among women, breast cancer is the most
common cause of cancer mortality, accounting for 16% of cancer deaths in adult women.
There is evidence that early detection through mammography screening and adequate follow-up of women with a
positive result could significantly reduce mortality from breast cancer.14,15 The World Health Survey provides the first
and a unique opportunity to examine the prevalence of screening in a broad range of countries comprising two thirds of
the world’s population.
Less than a quarter of women had breast cancer screening
At present, breast cancer, along with cervical, colorectal
and possibly oral cancers, is the only type for which
early screening has been shown to reduce mortality from
the disease.16 There is sufficient evidence to show that
mammography screening among women aged 50–69 years
could reduce mortality from breast cancer by 15–25%.15
Percentage of women aged 50–69 years screened by mammography
in the three years preceding the World Health Survey (2000–2003)
<5
5 – 14.9
15 – 49.9
≥ 50
Data not available
21
World Health Statistics
2008
Data from the surveys indicate that screening is almost
universal in Finland, Luxemburg, the Netherlands and
Sweden, with 85% or more women aged 50–69 years
having had mammography in the previous three years. This
observation is consistent with recent findings on cancer
screening in the region.15 By contrast, screening prevalence
is extremely low in most low-income countries, being
less than 5% in 2000–2003. Overall, in the 66 countries
surveyed, only 22% of women aged 50–69 years had had a
mammogram in the previous three years.
Even in countries where screening is common, there are huge
di fferences according to wealth status
Estimates from the surveys show that the prevalence of
mammography varies significantly by wealth. In the
25 Member States of the WHO European Region
surveyed, where breast screening is generally higher than
in low-income countries, screening among women in
the lowest wealth quintile was lower than among their
wealthier counterparts.
In the Russian Federation, women in the wealthiest group
are seven times more likely to have had a mammogram
than women in the poorest group. By contrast, in
countries such as Austria, Belgium and the Netherlands,
women in the lowest income quintile are as likely to
have had mammography as their wealthier counterparts.
This is also the case in countries such as Kazakhstan and
Portugal, although overall prevalence of screening in these
two countries is relatively low.
BREAST SCREENING IN SELECTED MEMBER STATES OF THE WHO EUROPEAN REGION,
BY WEALTH STATUS
Israel
Poorest quintile
Best-off quintile
France
Finland
Sweden
Luxembourg
Netherlands
United Kingdom
Germany
Spain
Italy
Slovakia
Hungary
Austria
Czech Republic
Belgium
Estonia
Greece
Croatia
Portugal
Ireland
Russian Federation
Latvia
Ukraine
Kazakhstan
Bosnia and Herzegovina
0
10
20
30
40
50
60
70
Women screened by mammography (%)
22
80
90
100
World HealtH StatiSticS
2008
Lifetime risk of dying from breast
cancer: 1 in 30 in high-income
countries
dEATHS FROM BREAST CANCER AS A PERCENTAgE
OF TOTAL dEATHS, BY INCOME gROuP
16
14
High-income
Upper/middle-income
Lower/middle-income
Low-income
12
Percentage of total deaths
Breast cancer is a major cause of death among adult women
in much of the world. Using data from the 2004 Global
Burden of Disease (GBD),5 lifetime risk of dying from
breast cancer is estimated at about 33 per thousand among
women in high-income countries compared with 25 per
thousand in upper/middle-income countries and less
than 15 per thousand in low- and lower/middle-income
countries. These higher rates in wealthier countries reflect
a combination of factors, including increasing longevity
and a lower risk of dying from other causes, higher
exposure to breast cancer risk factors such as overweight
and hormone replacement therapy, and lower protective
factors such as breastfeeding practices and fertility. Among
women in their late 30s in high-income countries, about
10% of deaths are due to breast cancer; this proportion
rises to 14% among women in their 50s.
10
8
6
4
2
0
25–29
30–34
35–39
40–44
45–49
50–54
Age group (years)
Understanding the data and estimates
Monitoring trends in breast cancer screening requires
the use of data from various sources, the two main
ones being facility service records and household
surveys. The prevalence data are derived from the
World Health Survey conducted by WHO during
2003–2004 in 66 Member States comprising two
thirds of the world’s population.17 This makes it the
largest single database ever assembled for estimating
proportions of the population screened for breast
cancer. Nevertheless, the retrospective nature of the
data and the long reference period used for collecting
the required information mean that recall biases are
likely to affect the results.
Women who are less educated and in the low-income
group may also lack or have limited knowledge about
the procedure. This also means that the responses for
these women could potentially be biased downwards.
However, the differences observed between low- and
high-income countries and between the upper- and
lower-income quintiles in the latter group of countries
are so large that the bias is unlikely to alter the overall
conclusions. In addition, many low-income countries
have no national policy on breast screening and very
few facilities with the necessary equipment; this is also
consistent with the lower estimates reported for these
countries.
The key source of information on cancer mortality
in the 2004 GBD database, the main source of data
used for estimating breast cancer mortality by income
group, is cancer registry and death registration data
containing information on distribution of cause of
death; these however were available only for a limited
number of countries. A statistical model, further
adjusted by epidemiological evidence from registries,
verbal autopsy studies and disease surveillance systems,
was used to generate the needed estimates in countries
with inadequate or limited data. For this reason,
estimates of the effect of breast cancer on mortality
reported for low- and lower/middle-income countries
should be treated with great caution, as the relevant
data are largely absent in these countries.
23
World Health Statistics
2008
p
E
m
m
c
c
p
mp
D
i v e r g e n t trends in ortali ty
s l o w down i
ro ve en ts in
l i fe ex e ta n y in uro e
Half a century ago, a child born in Europe could expect to live for about 66 years, a life expectancy at birth that was the
highest of any region in the world except North America.18 By contrast, average life expectancy at birth 50 years ago
was 38 years in sub-Saharan Africa, 41 years in Asia, 45 years in the Middle East, 51 years in Latin America and the
Caribbean and 60 years in Oceania. Over the following 50 years, average life expectancy at birth improved all over the
world, increasing by almost 27 years in Asia, 23 years in the Middle East, 21 years in Latin America, 14 years in Oceania
and 11 years in sub-Saharan Africa. The smallest increase was in Europe, where life expectancy increased by only 8 years,
albeit starting from a higher baseline than in most other regions. Analysis of death registration data suggests that the
reason for the relative stagnation in life expectancy in Europe as a whole lies in the very slow pace of change in some parts
of the continent of Europe.
Eastern Europe has seen only modest increases in life expectancy
and about 9 years in northern Europe. Over the same
period, life expectancy in eastern Europe increased from
64.2 years in 1950 to 67.8 years in 2005, representing an
increase of only about 4 years.
In 2005, life expectancy at birth for both sexes was 78.6
years in northern, southern and western Europe. Compared
to the level in 1950, this represented an increase of over 15
years in southern Europe, some 11 years in western Europe
Life expectancy at birth in Europe, 1950–2005
0DOH
)HPDOH
/LIHH[SHFWDQF\DWELUWK\HDUV
(XURSHDQFRXQWULHV
(DVWHUQ
1RUWKHUQ
:HVWHUQ
6RXWKHUQ
<HDU
24
World Health Statistics
2008
Excess mortality in ea stern
Eu rope occurs mainly in
adult men
Excess mortality is due to
no ncommunicable diseases and
injuries
In 2005, the male population in eastern Europe was
outlived by its counterparts in other parts of Europe
by an average of 13.3 years. Of the total deficit in life
expectancy, approximately 8.7 years (65%) was due to
excess mortality in the 15–59-year age group; a further
3.5 years’ difference was due to excess mortality among
men aged 60 years or over.
The single most important contributor to excess
mortality in eastern Europe is cardiovascular diseases.
Among males, almost 50% of the excess mortality was
due to cardiovascular diseases, with a further 20% due
to injuries. Excess mortality due to infections and cancer
contributed 13% and 10% of the difference, respectively,
while other causes contributed 5%. For females, almost
80% of the difference in life expectancy was due to excess
mortality from cardiovascular diseases, followed by deaths
from injuries, cancer and infections, each contributing
between 3% and 8%.
For women, the picture is rather different. Although
women living in eastern Europe were outlived by their
counterparts elsewhere in the region by 7.9 years, this
was largely a result of higher mortality in older ages
(contributing well over 50%), with excess mortality in the
15–59-year age group accounting for the remaining 35%
of the difference. For both males and females, mortality
under the age of 15 contributed only around 10% of the
overall difference in life expectancy at birth between the
regions.
(A) Relative contribution of different age groups and (B) causes to the deficit in life
expectancy in eastern Europe compared to the rest of THE CONTINENT OF Europe
12
10
85+
80–84
75–79
70–74
65–69
60–64
55–59
50–54
45–49
40–44
35–39
30–34
25–29
20–24
15–19
10–14
5–9
1–4
0
8
6
4
2
0
Female
Male
14
Others
Injuries
Relative contribution to excess mortality (years)
Relative contribution to excess mortality (years)
14
12
Cardiovascular
Cancers
Infection
10
8
6
4
2
0
Male
Female
-2
(A)
(B)
25
World HealtH StatiSticS
2008
Understanding the data and estimates
Analysis of mortality statistics over time and by
cause of death requires a well-functioning system of
registering deaths coupled with medical certification
of cause of death. Such systems exist in almost all
European countries. Data are reported regularly by
Member States to WHO, which collates the data
using consistent standard procedures. The cause of
death information is generally coded according to the
latest (tenth) revision of the International statistical
classification of diseases and related health problems
(ICD-10). Four countries still use the earlier version,
ICD-9; for the purposes of analysis, the data for these
countries have been mapped to the corresponding
ICD-10 codes.
One of the major limitations of death registration
data relates to coverage error, so it is common practice
to assess coverage before data are used for further
26
processing. WHO calculates coverage by dividing
the total deaths reported from the civil registration
system by the total deaths estimated by WHO for the
same year. The data for the countries included in the
study are of good quality, with coverage rates of 90%
or more.
The underlying data come from individual countries,
which may apply different medical concepts,
diagnostic practices and interpretation of rules for
determining the underlying causes of death. In
addition, there may be variation in coding practices
by coders when the information on death certificates is
ambiguous or incomplete. As a result, there is likely to
be some inherent bias in the data. These problems will
be accentuated in data for earlier periods, and must
be borne in mind in interpreting cause of death data
across countries and over time.
World Health Statistics
2008
M o n i t o r in g dis eas e o u tbreaks:
m e ni ngo c o ccal m en i n g i ti s i n Afric a
Meningococcal meningitis is a bacterial infection of the meninges, the thin lining that surrounds the brain and spinal
cord. Meningitis occurs sporadically and in small outbreaks worldwide, but the highest activity is concentrated in
sub-Saharan Africa, in an area determined by its environmental conditions, called the “meningitis belt”. In this belt,
which covers 21 countries and where about 350 million people live, the highest disease morbidity is recorded during
the dry season. To avert the burden of the disease and the deaths resulting from it, timely and reliable epidemiological
surveillance is very important; only then can an immediate response with reactive vaccination be mounted.
Almost 55 000 cases and 4000 deaths reported in 2007
Epidemics of meningococcal meningitis have hit
the African meningitis belt in periodic waves. The
last major wave occurred in 1996/1997 and affected
more than 220 000 people in 17 countries. This was
followed by several years of low disease incidence in
the belt until 2006, when the epidemic season saw
yet another marked rise in meningitis rates across the
region. This trend increased further in 2007. During
2007, 54 676 suspected cases of meningitis and 4062
deaths were reported from the belt countries. However,
49% of all cases were reported from just one country:
Burkina Faso. The case fatality rate for 2007 of 7.4%
was significantly lower than that for 2006 (8.5%).
Suspected meningitis cases and meningitis deaths in THE MENINGITIS BELT 1965–2007
&DVHV
'HDWKV
&DVHV
'HDWKV
<HDUV
Although there is a general belief that the epidemics come
in cycles of 10–14 years, these tend to vary from country
to country and are moderated by several factors, including
the spread of new strains, the extent and frequency
of previous vaccination campaigns, and climatic and
environmental factors.
27
World HealtH StatiSticS
2008
Districts are the primary unit for surveillance and response
The WHO strategy focuses on reactive vaccination to
halt the outbreak and effective case management through
antibiotic treatment to reduce the lethality of the disease.
For this to be effective, a system of early detection and
rapid laboratory confirmation is required. This would then
help to determine predefined alert and epidemic thresholds
and distinguish between a seasonal rise and an emerging
epidemic. For instance, for a population of more than
30 000, the epidemic threshold is an incidence of 15
cases per 100 000 population per week. In 2006–2007,
a number of districts in Burkina Faso and the Sudan crossed
the epidemic threshold determined for the region.
dISTRICTS IN THE AFRICAN EPIdEMIC BELT IN WHICH THE EPIdEMIC THRESHOLd WAS CROSSEd, 2006–2007
Sudan
Burkina faso
Niger
Chad
Ethiopia
Côte d'Ivoire
Ghana
Nigeria
Togo
Benin
Uganda
Central African Republic
Epidemic districts
Democratic Republic
of the Congo
Understanding the data and estimates
For most acute outbreak diseases, it is difficult to
estimate the population attack and mortality rates. The
ability to detect and report all cases depends on the
intensity of surveillance. Enhanced epidemic meningitis
surveillance requires systematic weekly collection,
compilation and analysis of epidemiological data as well
as the adequate collection, transportation and analysis
of laboratory specimens. If there is an improvement or
deterioration in the surveillance system, then a change
in the number of reported cases and deaths is likely to
be a reflection of surveillance practices and not of the
true course of the epidemic.
Outbreak data are not always directly comparable
owing to the use of different systems. Some countries,
such as Burkina Faso, Mali and Niger, have greater
experience with enhanced surveillance and generally
examine a larger proportion of samples in the laboratory.
Even then, some indicators should be used to assess
the quality of the laboratory tests and its suitability
for surveillance. For instance, a large proportion of
negative samples should be viewed as an indication
28
that the samples may have been contaminated, or
could suggest poor storage and transport or poorly
functioning laboratory tests.
Case fatality rates – the proportion of meningitis patients
who die – are also difficult to compare as the number
of cases detected varies between populations and years.
In some years, case fatality rates may be high because
of a particularly virulent type of the meningococcus.
Mortality numbers and rates should also be interpreted
with caution as many deaths may go undetected or the
cause of death may be wrongly identified.
During epidemics, standardized treatment is applied
and thus laboratory confirmation is not aimed at
guiding case management in this context. Laboratory
confirmation of the first suspected cases is sufficient to
identify the pathogen responsible for the epidemic in
the district and for mass vaccination to be started with
the appropriate vaccine. In this case, the high incidence
due to the epidemic does not indicate the need for an
increased collection of cerebrospinal fluid samples.
World Health Statistics
2008
F u t u r e t r e n d s in g lobal mortality:
ma j o r s hi f t s i n cau s e of d eath p atter ns
The original Global Burden of Disease (GBD) Study was published in 1991 to provide a comprehensive assessment
of disease burden for 107 diseases and injuries and 10 selected risk factors for the world and 8 major regions.5 Since
then, WHO has regularly published updates of the GBD in its World Health Reports. These updates draw on WHO’s
extensive databases on levels of child and adult mortality and on causes of death in Member States that have useable death
registration data, together with data from surveillance systems and epidemiological studies. They provide internally
consistent estimates for a total of 135 diseases and injuries, for 8 age groups and 14 subregions of the 6 WHO regions.
The most recent update5 goes further and takes into account the latest projections by UNAIDS and WHO for HIV
prevalence and mortality, as well as updated World Bank forecasts for economic growth. The resulting estimates suggest
a massive shift in the distribution of deaths over the coming 25 years.
Noncommunicable conditions will cause over three quarters of all
deaths in 2030
As populations age in middle- and low-income countries
over the next 25 years, the proportion of deaths due to
noncommunicable diseases will rise significantly. Globally,
deaths from cancer will increase from 7.4 million in 2004
to 11.8 million in 2030, and deaths from cardiovascular
diseases will rise from 17.1 million to 23.4 million in
the same period. Deaths due to road traffic accidents will
increase from 1.3 million in 2004 to 2.4 million in 2030,
primarily owing to increased motor vehicle ownership
and use associated with economic growth in low- and
middle-income countries. By 2030, deaths due to cancer,
cardiovascular diseases and traffic accidents will collectively
account for 56% of the projected 67 million deaths due to
all causes.
This increase in deaths from noncommunicable diseases
will be accompanied by large declines in mortality
for the main communicable, maternal, perinatal and
nutritional causes, including HIV infection, tuberculosis
and malaria. However, deaths worldwide from HIV/
AIDS are expected to rise from 2.2 million in 2008 to
a maximum of 2.4 million in 2012 before declining to
1.2 million in 2030.
Projected deaths by cause for high-, middle- and low-income countries
35
30
Intentional injuries
Other unintentional
injuries
Road traffic accidents
Other noncommunicable
diseases
25
Cancers
Deaths (millions)
Cardiovascular disease
20
15
Maternal, perinatal
and nutritional conditions
Other infectious
diseases
HIV, TB and malaria
10
5
0
2004
2015
High income
2030
2004
2015
2030
Middle income
2004
2015
2030
Low income
29
World Health Statistics
2008
The top 20 causes of death in 2030
It is predicted that the four leading causes of death
in the world in 2030 will be ischaemic heart disease,
cerebrovascular disease (stroke), chronic obstructive
pulmonary disease (COPD) and lower respiratory
infections (mainly pneumonia). Much of the increase in
COPD is associated with projected increases in tobacco
use. On the other hand, road traffic accidents will emerge
as the fifth leading cause of death in 2030, rising from
its position as the ninth leading cause in 2004.
Although deaths due to HIV/AIDS are projected to fall
by 2030, it will remain the tenth leading cause of death
worldwide. Deaths due to other communicable diseases
are projected to decline at a faster rate: tuberculosis will
fall to No. 20 and diarrhoeal diseases to No. 23 in the list
of leading causes.
Leading causes of death, 2004 and 2030 compared
2030
2004
Disease or injury
Ischaemic heart disease
Cerebrovascular disease
Lower respiratory infections
Chronic obstructive pulm onary diseas e
Diarrhoeal diseases
HIV/AIDS
Tuberculosis
Trachea, bronchus, lung cancer s
Road traffic accidents
Prematurity and low birth weight
Neonatal infections and othe r*
Diabetes mellitus
Malaria
Hypertensive heart disease
Birth asphyxia and birth trauma
Self-inflicted injuries
Stomach cancer
Cirrhosis of the liver
Nephritis and nephrosis
Colon and rectum cancers
Violence
Breast cancer
Oesophagus cancer
Alzheimer and other dementias
Deaths
(%)
Rank
12.2
9.7
7.0
5.1
3.6
3.5
2.5
2.3
2.2
2.0
1.9
1.9
1.7
1.7
1.5
1.4
1.4
1.3
1.3
1.1
1
2
3
4
5
6
7
8
9
10
11
12
13
14
15
16
17
18
19
20
1
2
3
4
5
6
7
8
9
10
11
12
13
14
15
16
17
18
19
20
14.2
12.1
8.6
3.8
3.6
3.4
3.3
2.1
1.9
1.8
1.6
1.5
1.4
1.4
1.3
1.2
1.2
1.2
1.1
1.0
1.0
0.9
0.9
0.8
22
23
24
25
21
22
23
29
41
1.0
0.9
0.9
0.7
0.4
Rank
* Comprises severe neonatal infections and other, noninfectious causes arising in the perinatal period.
30
Deaths
(%)
Disease or injury
Ischaemic heart disease
Cerebrovascular disease
Chronic obstructive pulm onary diseas e
Lower respiratory infections
Road traffic accidents
Trachea, bronchus, lung cancer s
Diabetes mellitus
Hypertensive heart disease
Stomach cancer
HIV/AIDS
Nephritis and nephrosis
Self-inflicted injuries
Liver cancer
Colon and rectum cancer s
Oesophagus cancer
Violence
Alzheimer and other dementias
Cirrhosis of the live r
Breast cancer
Tuberculosis
Neonatal infections and other*
Prematurity and low birth weight
Diarrhoeal dis eases
Birth asphyxia and birth trauma
Malaria
World HealtH StatiSticS
2008
Understanding the data and estimates
WHO’s updated mortality projections are based on
historically observed relationships between trends in
economic and social development and cause-specific
mortality. This update uses the same projection
methods for 2002 as previously published,19 based
on updated GBD estimates for 2004,5 together
with updated projections of HIV deaths prepared
by UNAIDS and WHO20 and updated forecasts of
economic growth published by the World Bank.21
Apart from the incorporation of new epidemiological
data for specific causes, the updated GBD estimates
for 2004 incorporate more recent death registration
data for many countries, new African mortality data
using verbal autopsy methods to assign cause of death,
and improved methods for estimating causes of child
deaths in countries without good death registration
data. For these reasons, and also because of revisions
to the United Nations population estimates, the GBD
estimates for 2004 are not directly comparable with
the previous estimates for 2002.
The projections were made based on the assumption
of “business as usual”, which does not specifically take
account of possible changes in major risk factors (with
the exception of tobacco use and, to a limited extent,
overweight and obesity). If such behavioural risk
factors do not decline with economic development and
strengthened health systems in developing countries,
these projections may in fact underestimate future
mortality in low- and middle-income countries.
In addition, there were 78 countries without useable
death registration data. For these countries, cause
of death models based on all-cause mortality levels
(excluding HIV, war and natural disasters), gross
national income per capita, and region were applied at
country level for estimating the proportion of deaths in
broad cause groups (communicable, noncommunicable
and injury) by age and sex. Specific causes were further
adjusted on the basis of epidemiological evidence from
population registries, verbal autopsy studies, disease
surveillance systems and existing WHO databases.
Notwithstanding these shortcomings, it is estimated
that the projected reduction in deaths worldwide due
to communicable diseases and maternal and perinatal
conditions between 2004 and 2030 will mostly result
from epidemiological change, offset to some extent by
population growth. Population ageing will have little
effect.
Demographic changes will lead to substantially more
deaths from noncommunicable diseases in all regions,
even though age/sex-specific death rates are projected
to decline for most causes other than lung cancer. The
impact of population ageing is generally much more
important than that of population growth.
31
World Health Statistics
2008
R e d u c in g i mp overis h m en t And
cata s t r oph ic hea lth ca re s pen ding
Many countries rely heavily on out-of-pocket payments (OOPs) by patients to finance their health care systems. OOPs
include fees for services levied by public and/or private providers (officially or unofficially) and co-payments where insurance
does not cover the full cost of care. This arrangement prevents some people, especially poorer families, from receiving the
care they need. In some cases, OOPs can be high enough to cause financial catastrophe and impoverishment, especially
when there is severe illness or major injury.22 In 2005, the Member States of WHO endorsed a resolution on “Sustainable
health financing, universal coverage and social health insurance”, calling on countries to develop health financing systems
that ensure that people have access to health care without risking financial catastrophe or impoverishment. A new study,
based on surveys conducted in 89 countries covering nearly 90% of the world’s population, provides for the first time a
global estimate of the scale and distribution of catastrophic health care spending and indicates how the problem can be
reduced.23
150 million people suffer catastrophic health care costs each year
From the 89 countries included in this study, each year
an average of 2.3% of households experience financial
catastrophe due to health care costs, corresponding to over
150 million people worldwide. More than 100 million
people are impoverished because they must pay for health
care.
Catastrophic health care spending occurs in countries at all
levels of development. Nevertheless, the problem is more
frequent and more severe in middle-income countries, and
most frequent and most severe in low-income countries.
CATASTROPHIC HEALTH EXPENDITURE AND IMPOVERISHMENT
DUE TO OUT-OF-POCKET HEALTH EXPENDITURE, by who region
People impoverished
Eastern Mediterranean
People suffering catastrophic
health expenditure
Africa
Europe
South-East Asia
Americas
Western Pacific
0
30
60
90
Number of people (millions)
Out-of-pocket payments are the main cause of catastrophic spending
Catastrophic spending and impoverishment are strongly
associated with the use of OOPs to finance health care.
Fewer households are affected by financial catastrophe
where there is less reliance on OOPs. In systems where
OOPs make up less than 15% of total spending on health
32
care, fewer households tend to face financial catastrophe
due to the cost of health care. Other factors, such as the
availability of health services and income inequality, do
play a role but OOPs for health care are the main factor.
World HealtH StatiSticS
2008
Percentage of houheholds with catastrophic
expenditure on health care (logarithmic scale)
THE RELATIONSHIP BETWEEN CATASTROPHIC ExPENdITuRE ANd OuT-OF-POCKET
PAYMENTS FOR HEALTH CARE
15
8
OECD countries
Other countries
3
1
.3
.1
.03
.01
3
5
8
14
22
37
61
100
Out-of-pocket expenditure as a percentage of total
expenditure on health care (logarithmic scale)
Moving away from OOPs to some form of prepayment
scheme is the key to reducing financial catastrophe
from health care costs. Prepayment can take the form
of taxation, with health care costs paid for by the
government or through publicly or privately managed
insurance premiums. Either can be effective, and
countries may choose their own approach, taking into
account their current institutional structures, culture
and traditions, and stage of economic development.
Understanding the data and estimates
The data are derived from household surveys that
collect information on household spending, including
spending on health care. Currently, data are available
from 116 surveys covering 89 countries. In most cases,
information on frequent expenses was collected for
the previous month, and information on spending on
durable goods or large items such as hospitalization
was collected for the previous 6 or 12 months. How
households were selected, and exactly how the questions
were asked, varied among the surveys, but all the surveys
were recent and the countries included account for 90%
of the world’s population.
To estimate the incidence, one first needs to define a
threshold for financial catastrophe. The study defined
catastrophic spending as health care payments reaching
or exceeding 40% of a household’s capacity to pay in
any year. The household’s capacity to pay is defined
as its non-food spending, and commitment of 40% of
non-subsistence spending to a single item is generally
associated with significant financial stress.
The results probably underestimate the risk of
catastrophic health care spending because only actual
OOPs for health care were included. Costs incurred
by those who need services but cannot afford them,
transport costs and loss of income due to illness were
not considered.
33
World Health Statistics
2008
2.
Bryce J et al. Reducing child mortality: can public health deliver? Lancet, 2003, 362:159–164.
3.
Countdown 2008 Equity Analysis Group. Mind the gap: equity and trends in coverage of maternal, newborn and
child health services in 54 Countdown countries. Lancet, 2008, 371:1289–1267.
An update of the global burden of disease in 2004. Geneva, World Health Organization (forthcoming).
6.
Rowe AK et al. Evaluating the impact of malaria control efforts on mortality in sub-Saharan Africa. Tropical
Medicine and International Health, 2007, 12:1524–1539.
Malaria & children: progress in intervention coverage. New York, United Nations Children’s Fund, 2007.
8.
Nyarango PM et al. A steep decline of malaria morbidity trends in Eritrea between 2000 and 2004: the effect of
combination of control methods. Malaria Journal, 2006, 5:33, doi: 10.1186/1475–2875–5–33.
7.
5.
AIDS epidemic update: December 2007. Geneva, UNAIDS and WHO, 2007.
4.
c
Maternal mortality in 2005. Estimates developed by WHO, UNICEF, UNFPA, and The World Bank. Geneva, World
Health Organization, 2007.
1.
R
ef eren e s
Gwatkin DR et al. Socio-economic differences in health, nutrition, and population within developing countries. Washington,
DC, World Bank, 2007.
9.
Bhattarai A et al. Impact of artemisinin-based combination therapy and insecticide-treated nets on malaria burden
in Zanzibar. PLoS Medicine, 2007, 4:1784–1790.
10.
Graves P et al. Effectivness of malaria control during changing climate conditions in Eritrea, 1998–2003. Tropical
Medicine and International Health, 2008, 13:218–228.
11.
WHO report on the global tobacco epidemic, 2008: the MPOWER package. Geneva, World Health Organization, 2008.
14.
Breast cancer screening. Lyon, International Agency for Research on Cancer, 2002 (Handbooks on Cancer Prevention,
Vol. 10).
13.
15.
Coleman M et al., eds. Responding to the challenge of cancer in Europe. Ljubljana, Institute of Public Health, 2008.
16.
Sankaranarayanan R et al. A critical assessment of screening methods for cervical neoplasia. International Journal of
Gynaecology and Obstetrics, 2005, 89:S4–S12.
Impact of long-lasting insecticidal-treated nets (LLINs) and artemisinin-based combination therapies (ACTs) measured
using surveillance data, in four African countries: Preliminary report based on four country visits. Geneva, World Health
Organization, 2007.
12.
Üstun TB et al. Quality assurance in surveys: standards, guidelines and procedures. In: Household sample surveys in
developing and transition countries. New York, United Nations, 2005.
17.
World mortality report 2007 [CD-ROM Edition]. New York, United Nations, Department of Economic and Social
Affairs, Population Division, 2007.
18.
19.
Financial resources required to achieve universal access to HIV prevention, treatment, care and support. Methodological Annex
II. Revised projections of the number of people in need of ART. Geneva, UNAIDS, 2007.
21.
Global economic prospects 2008. Washington, DC, World Bank, 2008.
22.
Xu K et al. Designing health financing systems to reduce catastrophic health expenditure. Geneva, World Health
Organization, 2005 (Technical Briefs for Policy-Makers, No. 2).
20.
Mathers CD, Loncar D. Projections of global mortality and burden of disease from 2002 to 2030. PLoS Medicine [online
journal], 2006, 3(11):e442 (http://medicine.plosjournals.org/perlserv/?request=get-document&doi=10.1371/journal.
pmed.0030442, accessed 29 March 2008).
23.
34
Xu K et al. Protecting households from catastrophic health spending. Health Affairs, 2007, 26:972–983.


© Copyright 2026