
Public Report on an Evaluation of 3 fingerprint
Code: IDTL-FDC-01 Revision: 1.1 Date: 11/05/2015 Page 1 / 139 PUBLIC REPORT COVER PERFORMANCE TESTING EVALUATION REPORT OF RESULTS Copy No.: 1 CREATED BY: Dr. Belen Saavedra Date: 09/05/2015 Fernandez REVIEWED BY: APPROVED BY: Dr. Raul Sanchez-Reillo Dr. Raul Sanchez-Reillo Date: 11/05/2015 Date: 11/05/2015 Code: IDTL-FDC-01 Revision: 1.1 Date: 11/05/2015 Page 2 / 139 PUBLIC REPORT REVISION HISTORY REVISION HISTORY Revision Date Description 0.1 20/04/2015 First Draft 1.0 09/05/2015 Final Draft 1.1 11/05/2015 Release PUBLIC REPORT Code: IDTL-FDC-01 Revision: 1.1 Date: 11/05/2015 Page 3 / 139 CONTENTS TABLE OF CONTENTS 1. INTRODUCTION.......................................................................... 6 INTRODUCTION .......................................................................... 6 ORGANIZATION OF THE DOCUMENT ....................................... 7 IDTESTINGLAB ............................................................................ 7 2. FINGERPRINT SENSORS .......................................................... 9 NB-3010-U Fingerprint sensor (NXT) ............................................ 9 FPC1011F3 fingerprint sensor (FPC)............................................ 9 UPEK EikonTouch 510 fingerprint sensor (UPK) ........................ 10 3. DATABASE COLLECTION PROCEDURES .............................. 11 ENVIRONMENT ......................................................................... 11 DATABASE COLLECTION PROCEDURES ............................... 13 ESTABLISHMENT OF THE GROUND TRUTH .......................... 18 4. COMPOSITION OF THE DATABASE ....................................... 19 COMPOSITION OF THE DATABASE ........................................ 19 5. QUALITY ANALYSIS ................................................................. 22 NFIQ DISTRIBUTION ................................................................. 22 QUALITY FAILURES .................................................................. 23 6. PERFORMANCE ANALYSIS ..................................................... 25 PERFORMANCE RESULTS FOR NBIS ALGORITHM ............... 25 PERFORMANCE RESULTS FOR NEUROTECHNOLOGY ALGORITHM .............................................................................. 35 7. CROPPED DATABASES ........................................................... 45 CROPPING APPROACH............................................................ 45 PUBLIC REPORT Code: IDTL-FDC-01 Revision: 1.1 Date: 11/05/2015 Page 4 / 139 CONTENTS COMPOSITION OF THE CROPPED DATABASES .................... 47 8. QUALITY ANALYSIS OF THE CROPPED DATABASES .......... 51 QUALITY ANALYSIS .................................................................. 51 9. PERFORMANCE ANALISIS FULL SIZE VS. CROPPED IMAGES ............................................................................................... 54 INTRODUCTION ........................................................................ 54 PERFORMANCE RESULTS FOR NBIS ..................................... 55 PERFORMANCE RESULTS FOR NEUROTECHNOLOGY ........ 71 10. PERFORMANCE ANALYSIS CROPPED VS. CROPPED IMAGES ............................................................................................... 88 INTRODUCTION ........................................................................ 88 PERFORMANCE RESULTS FOR NBIS ..................................... 89 PERFORMANCE RESULTS FOR NEUROTECHNOLOGY ...... 107 11. ANALYSIS OF THE RESULTS OBTAINED ............................. 126 INTRODUCTION ...................................................................... 126 COMPARISON AMONG SENSORS ACCORDING TO THE QUALITY OF THE SAMPLES CAPTURED .............................. 126 PERFORMANCE ALGORITHM-SENSOR PAIRS .................... 127 PERFORMANCE OF ALGORITHMS ........................................ 128 IMPACT OF REDUCED AREA ................................................. 128 INTEROPERABILITY BETWEEN FULL SIZE AND REDUCED AREA ..................................................................... 129 LESSONS LEARNED ............................................................... 130 REFERENCES................................................................................... 131 ANNEX A: Additional performance curves using NBIS algorithm Full vs. Cropped comparisons ............................................................ 132 A.1. DET curve including all cropped sizes ...................................... 132 A.2. ROC curve including all cropped sizes...................................... 133 PUBLIC REPORT Code: IDTL-FDC-01 Revision: 1.1 Date: 11/05/2015 Page 5 / 139 CONTENTS ANNEX B: Additional performance curves using Neurotechnology algorithm Full vs. Cropped comparisons ................ 134 DET curve including all cropped sizes ...................................... 134 Roc curve including all cropped sizes ....................................... 135 ANNEX C: Additional performance curves using NBIS algorithm ...... 136 C.1. DET curve including all cropped sizes ...................................... 136 C.2. ROC curve including all cropped sizes...................................... 137 ANNEX D: Additional performance curves using Neurotechnology algorithm ................................................................ 138 D.1. DET curve including all cropped sizes ...................................... 138 D.2. Roc curve including all cropped sizes ....................................... 139 PUBLIC REPORT Code: IDTL-FDC-01 Revision: 1.1 Date: 11/05/2015 Page 6 / 139 1. INTRODUCTION INTRODUCTION This report presents the results of performance testing of three fingerprint sensors: one active thermal (NB-3010-U Fingerprint sensor) and two active capacitive sensors (FPC1011F3 and UPEK Eikon Touch 510). Performance testing has been conducted following the ISO/IEC 19795 Biometric testing and reporting standard requirements [1]. In particular, different technology evaluations have been carried out with different purposes. First, the performance of the different sensors has been measured based on comparisons of the images captured by them. In addition, these images have been cropped for modelling three possible reduce sizes of the active area of the sensors: 12x12mm2, 10x10mm2 and 8x8mm2. Considering these cropped images, performance testing has been conducted targeting two kind of comparisons: full size vs. cropped size images and cropped size vs. cropped size images, being the first the enrolment image and the second the verification samples. For these evaluations, a database has been specifically collected composed by total of 589 users who have provided more than 100,000 fingerprints. Moreover, all the aforementioned evaluations have been executed using two different algorithms, the public algorithm provided by NIST [2] (called NBIS throughout this document) and the commercial algorithm developed by Neurotechnology [3] (called NEU throughout this document). This report describes, in detail, the characteristics of the sensors analysed, the collection of the database for the evaluations and the results achieved per each sensor and algorithm. In particular the results attached are: Performance results when processing the full size database: o Quality analysis using NFIQ quality score [4] o Error rates o Throughput rates Performance results when processing the cropped databases considering two kind of comparisons: o Quality analysis using NFIQ quality score [4] o Full sizes vs. Cropped size images Error rates Throughput rates o Cropped size vs. Cropped size images Error rates Throughput rates The document provides an analysis and discussion on the results obtained, comparing each of the technologies at each of the evaluations carried out. PUBLIC REPORT Code: IDTL-FDC-01 Revision: 1.1 Date: 11/05/2015 Page 7 / 139 ORGANIZATION OF THE DOCUMENT Considering the objectives aforementioned, this document is organized in the following set of sections: 1. This section, stating an introduction to the report, which will be finished with an introduction to the laboratory that has conducted the test. 2. The following section will describe the sensors used during the evaluation 3. The description of the database collection, its procedures and specifications 4. A detailed view on the composition of the database, including the demographics of the users taking part as test crew 5. The analysis on the quality of the samples acquired 6. The results obtained by carrying out a performance testing on the database collected, including error rates and throughput rates 7. The method to crop the collected images as to obtain a set of databases with images of 8x8, 10x10 and 12x12. 8. The quality analysis of the cropped subsets obtained. 9. The performance achieved when cropped images are compared to the biometric references created with the full size images 10. The performance achieved when comparing cropped images of the same size 11. The overall discussion on the results obtained, driving conclusions and lessons learned IDTESTINGLAB IDTestingLab is an evaluation laboratory belonging to Carlos III University of Madrid (UC3M). UC3M (http://www.uc3m.es) is one of most prestigious technical Universities in Spain. Due to its public, non-profit nature, the exploitation and dissemination strategies of UC3M largely coincide on its main objective, which is to use research results to advance and progress scientific knowledge. Exploitation of research achievements is carried out along two activities: educational in which existing and well established knowledge and methods are diffused among the attendants of the University lectures and activities, and research into advancements and extensions of the understanding of scientific disciplines. To this end, UC3M relies on a pool of expert human resources and its reputation, which is based on past achievements, helping to attract the top choice of prospective students and research associates. Research at Carlos III University of Madrid has always been one of the basic pillars of the University’s activities, both to improve teaching and to generate new knowledge and new lines of research. Within UC3M, the Electronics Technology Dpt. has 5 Research Groups. Among them, the University Group for Identification Technologies (GUTI – PUBLIC REPORT Code: IDTL-FDC-01 Revision: 1.1 Date: 11/05/2015 Page 8 / 139 http://www.guti.uc3m.es) has a great experience in Biometrics, Smart Cards and Security in Identification Systems. In detail, GUTI's expertise in its R&D lines is: Smart Cards, from R&D to final applications (active since 1989). Biometrics, having large experience in different biometric modalities such as hand geometry, iris recognition, fingerprint, vascular system and handwritten signature (active since 1994). Match-on-Card Technology, achieving the first ever Match-on-Card solution in 1999. Security Infrastructures, developing their own PKI using smart cards in 1997. Their work in all these lines has leaded to hold the Secretariat in the Spanish Mirror Subcommittee in Biometrics (AEN/CTN71/SC37) and the Chair in the Spanish Mirror Subcommittee in Identification Cards (AEN/CTN71/SC17). They are also experts in SC27. As a result of this work, UC3M opened IDTestingLab (http://idtestinglab.uc3m.es) as an Evaluation Laboratory for Identification Technologies. IDTestingLab is equipped with all relevant instruments to perform technology and scenario evaluations, and its personnel are trained to carry out operational evaluation as soon as a customer requests that kind of work. This laboratory has carried out several tests, both by Industry request and by R&D project requirements. For those test, a variety of tools have been developed, as well as building scenarios for end-to-end evaluations (scenario evaluations). Several innovative methodologies have already been designed and developed, amongst which are a methodology to measure the environmental condition influence on biometric systems (which has led to the development of ISO/IEC 29197), and a methodology for measuring the influence of usability in the performance of biometrics. Contact details: IDTestingLab Carlos III University of Madrid; Scientific Park Avda. Gregorio Peces Barba, 1. Laboratory 1.0.B.08 E-28919 - Leganés (Madrid) - SPAIN Tel: +34 91 624 40 35, +34 609 766 222 e-mail: [email protected], [email protected] Code: IDTL-FDC-01 Revision: 1.1 Date: 11/05/2015 Page 9 / 139 PUBLIC REPORT FINGERPRINT SENSORS 2. FINGERPRINT SENSORS This section describes the characteristics of the fingerprint sensors under evaluation. NB-3010-U Fingerprint sensor (NXT) This sensor uses thermal technology to obtain the images of the fingerprint. When a finger is in contact with the sensor area, the heat of the finger is transferred to the sensitive surface. The characteristic of this sensor are given in Table 1. Also, an image of this sensor can be seen in Figure 1. For the readability of this report, this sensor will be mentioned by the acronym NXT. Table 1. NXT sensor characteristics Sensor resolution 385 dpi Image Capture Area 11.9 x 16.9 mm Fingerprint image size 180 x 256 pixels Figure 1. NXT fingerprint sensor FPC1011F3 fingerprint sensor (FPC) This sensor uses active capacitive technology to obtain the images of the fingerprint. When a finger is in contact with the sensor area, a weak electrical charges is sent via the finger. Using these charges the sensor measures the capacitance pattern across the surface. The characteristics of this sensor are provided in Table 2. Moreover, an image of this sensor is shown in Figure 2. For the readability of this report, this sensor will be mentioned by the acronym FPC. Code: IDTL-FDC-01 Revision: 1.1 Date: 11/05/2015 Page 10 / 139 PUBLIC REPORT FINGERPRINT SENSORS Table 2. FPC sensor characteristics Sensor resolution 363 dpi Image Capture Area 10.6 x 14 mm Fingerprint image size 152 x 200 pixels Figure 2. FPC fingerprint sensor UPEK EikonTouch 510 fingerprint sensor (UPK) This sensor uses the capacitive technology, similar to the previous device. The characteristics of this sensor are given in Table 3. Also, Figure 3 shows an image of this sensor. For the readability of this report, this sensor will be mentioned by the acronym UPK. Table 3. UPK sensor characteristics Sensor resolution 508 dpi Image Capture Area 12.8 x 18.0 mm Fingerprint image size 192 x 270 pixels Figure 3. UPK fingerprint sensor PUBLIC REPORT Code: IDTL-FDC-01 Revision: 1.1 Date: 11/05/2015 Page 11 / 139 DATABASE COLLECTION PROCEDURES 3. DATABASE COLLECTION PROCEDURES The objectives of the data collection is to obtain a large dataset of fingerprint images using the three sensors under test. This process shall be done in similar conditions for all the sensors to be able to compare results. The following sections detail how this process was conducted and the requirements defined. ENVIRONMENT Environmental conditions The database collection has been conducted indoors in a laboratory. The temperature of this place is around 26ºC and the relative humidity is around 35%. In addition, the illumination of this laboratory is fluorescent light, installed at the ceiling. Database collection configuration For the purpose of the database collection, two stations have been dedicated. Each station includes the following elements: a PC which has connected the three fingerprint sensors. two chairs, one for the test subject and the other for the operator that control the overall process. A photograph of one station can be seen in Figure 4. PUBLIC REPORT Code: IDTL-FDC-01 Revision: 1.1 Date: 11/05/2015 Page 12 / 139 DATABASE COLLECTION PROCEDURES Figure 4. Database collection station In addition, a general view of the database collection can be seen in Figure 5. In the middle of the two stations there are office supplies to sign and classify data protection forms and the delivery receipts of the incentives. Figure 5. Layout of the database collection PUBLIC REPORT Code: IDTL-FDC-01 Revision: 1.1 Date: 11/05/2015 Page 13 / 139 DATABASE COLLECTION PROCEDURES DATABASE COLLECTION PROCEDURES The database collection is carried out in two different days with a separation of 15 days at least. During the first day, test subjects must come to the laboratory and conduct the following procedures: 1. 2. 3. 4. Listen to the general instructions about the whole process Provide personal data for enrolment Sign the acceptance form in accordance to data protection laws Listen to instructions about how to present a finger to the sensor correctly and which sensor to use at each time 5. Carry out the enrolment process. This process is detailed in section 3.2.1. 6. Carry out the 1st acquisition process (1st visit). This process is detailed in section 3.2.2. During the second visit (at least 15 days after the first one), test subjects must come to the laboratory and conduct the following procedures: 1. Listen to a short reminder about how to present a finger to the sensor correctly 2. Carry out the 2nd acquisition process. This process will be detailed in section 3.2.2. 3. Receive the incentive gained by cooperating in the experience. For conducting all these steps, an application has been developed to indicate the next steps to be developed in order to correctly collect all the fingers. This application is used by an operator who guides the test subjects during all the process. The next paragraphs describe how this application works for enrolment and acquisitions processes. Enrolment Enrolment is the process in which six fingers of one test subject are collected (i.e. thumb, index and middle fingers of both hands). In order to consider that one finger has been successfully enrolled, one image of this finger shall be correctly acquired and then a second image of the same finger that is also correctly acquired shall be compared to the first image and this comparison shall be successful (i.e. above a certain threshold). For achieving this goal, for each finger test subjects have two transactions composed by three attempts. If after this number of attempts, the test subject does not successfully accomplish the aforementioned process, a Failure To Enrol (FTE) is raised for the corresponding finger in this sensor. An image is correctly acquired is the quality score of the image is equal or less than 3 and the operator considers that the fingerprint image contains an PUBLIC REPORT Code: IDTL-FDC-01 Revision: 1.1 Date: 11/05/2015 Page 14 / 139 DATABASE COLLECTION PROCEDURES appropriate fingerprint image. The quality assessment algorithm used has been the NFIQ algorithm provided by NIST. A screenshot of this application for the enrolment process is shown in Figure 6. Figure 6. Screenshot of the database collection application for enrolment For enrolment, this application works as follows: Firstly, the application shows the operator how fingerprint sensors shall be ordered (See Figure 7). This order is selected randomly. Each time that this process is executed, sensors are placed in different order to avoid the influence of habituation on the results. PUBLIC REPORT Code: IDTL-FDC-01 Revision: 1.1 Date: 11/05/2015 Page 15 / 139 DATABASE COLLECTION PROCEDURES Figure 7. Screenshot of the sensor order for the process Then, when the operator placed the sensors in the right order, the enrolment process stars. The finger to present and the sensor are shown to the operator and test subjects. The test subject has a total of 30 seconds to provide an image. If not, a timeout error happens and a new attempt is required. When the image is captured, this image is displayed together with its NFIQ score. If the NFIQ is higher than 3, the image is discarded automatically by the application and a new attempt is required. If not the operator has the possibility to discard it. It everything is correct, a second image is required. For this second image the operator does not has the possibility to discard it. If the NFIQ is equal or less than 3, the image is directly compared to the previous image. If the result of the comparison is successful, this finger has been enrolled and a new enrolment of other finger or in other sensor is required. If the comparison fails, a new window appears (See Figure 8) and the operator has the opportunity to check what happened. Also, he can decide if the second image is discarded and ask for a new attempt or if the enrolment is discarded completely, starting it again. The process of enrolment can be repeated if the number of transactions and attempts have not overcome the above mentioned limits. Operators have been trained to act in a consistent manner for discarding samples and deciding repeating the enrolment. Figure 8. Screenshot that shows the operator after a wrong comparison PUBLIC REPORT Code: IDTL-FDC-01 Revision: 1.1 Date: 11/05/2015 Page 16 / 139 DATABASE COLLECTION PROCEDURES The sequence of enrolment begin by one finger of one hand. This is selected randomly. This finger is enrolled in all the sensors following the order decided at the beginning and the procedures above mentioned. When that finger is enrolled in all the sensors, then a new finger of this hand is required. When all the fingers (i.e. thumb, index and middle fingers) of this hand have been enrolled, the fingers of the other hand are requested to be presented. Considering this process, fingerprint images are classified as follows: 'DESOP' that means that the image has been discarded by the operator. 'FTP' that means that the image has a NFIQ higher than 3, or any other kind of processing error has occurred. 'CI' that means that the image has been compared to the previous image but the comparison fails or there is no reference to compare this sample. Successful enrolled images for which any code is used. When all six fingers of that user has been attempted to enrol in the system by all three sensors, the enrolment phase is considered finished, and the 1st acquisition process is started. Acquisition Acquisition is the process in which six images of each of the different fingers (i.e. thumb, index and middle fingers of both hands) are collected. In order to consider that the image of one finger has been successfully collected, the image of this finger shall be correctly acquired and then, successfully compared to the image captured at the enrolment process for this finger (see section 3.3). For doing it, test subjects have one transaction composed of three attempts. If after this number of attempts, the test subject does not successfully accomplish the aforementioned process, a Failure To Acquire (FTA) error is claimed for the corresponding finger in this sensor. In this case, an image is correctly acquired if the quality score of the image is equal or less than 4. The operator does not have the chance to discard any image. A screenshot of the database collection application for the acquisition process is shown in Figure 9. PUBLIC REPORT Code: IDTL-FDC-01 Revision: 1.1 Date: 11/05/2015 Page 17 / 139 DATABASE COLLECTION PROCEDURES Figure 9. Screenshot of the database collection application for acquisition For acquisition, this application works as follows: Firstly, the application shows the operator how fingerprint sensors shall be ordered (See Figure 7) in a similar way to the enrolment process (this order is again randomly calculated to avoid habituation effects). Then, when the operator placed the sensors in the right order, the enrolment process stars. The finger to present and the sensor are shown to the operator and the test subject. The test subject has a total of 30 seconds to provide an image. If not, a timeout error happens and a new attempt is required. If the NFIQ is higher than 4, the image is discarded automatically by the application and a new attempt is required. If not, the captured image is directly compared to the previous image. If the result of the comparison is successful, this finger has been acquired and the process continues (either a new acquisition of the same finger, changing the sensor, or changing the finger). If the comparison fails, a new attempt is required. The process of acquisition can be repeated per one finger in one sensor till the number of attempts is not run out for it. Then, the sensor is changed till a total of 6 acquisition transactions have been conducted in all the sensors. The sequence of acquisition begin by one finger of one hand. This is selected randomly to avoid habituation. This finger is acquired in all the sensors following the order decided at the beginning. When that finger is acquired in all the sensors six times (or trying to be acquired but a Failure To Acquire error happen), then a new finger of this hand is required. When all the fingers (i.e. thumb, index and middle fingers) of this hand have been acquired, the fingers of the other hand are requested to be presented. PUBLIC REPORT Code: IDTL-FDC-01 Revision: 1.1 Date: 11/05/2015 Page 18 / 139 DATABASE COLLECTION PROCEDURES Considering this process, fingerprint images are classified as follows: 'FTP' that means that the image has a NFIQ higher than 4 or any other kind of processing error occurred. 'CI' that means that the image has been compared to the image obtained at the enrolment phase but the comparison fails. 'FTE' that means that the image has not been compared to any image due to the fact that a Failure To Enrol (FTE) happens and no image can be considered as a good reference to be compared. Successful acquired images for which no additional code is used. ESTABLISHMENT OF THE GROUND TRUTH The collection of such a large database implies a lengthy process and the need of human supervision. Even using trained operators, the possibility of test subjects changing fingers or hands, or even placing the finger wrongly in the sensor is high. The acquisition of samples that may be wrongly labelled may derive in wrong calculations and erroneous performance rates. Therefore, the acquisition process has installed a mechanism to assure the ground truth, minimizing the impact to the database collection, but avoiding mislabelling of the samples acquired. Such mechanism has been based on the execution of a comparison algorithm with a certain threshold. This is a very important piece of information, as the application of such threshold has an impact on the scores obtained. In few words, mated comparisons (also known as mated) will never present a comparison score below the threshold, as such cases have been discarded during the acquisition process. This presents a serious impact to the FMR (False Match Rate), as the FMR for scores below the threshold will be 0. In order to minimize such impact, the threshold chosen has been relaxed enough, as to avoid most of the mislabelling, but not forcing a 0 FMR for a large set of threshold, which will impact seriously on the overall performance result. In addition, as such a mechanism is based on a comparison algorithm, and the evaluation has two evaluation algorithms, the threshold for the second algorithm has also been applied off-line. Therefore, the results won’t be biased by the performance of one of the algorithms. The thresholds chosen for the ground truth determination have been 20 for the NBIS algorithm, and 45 for the NEU (i.e. Neurotechnology) algorithm. PUBLIC REPORT Code: IDTL-FDC-01 Revision: 1.1 Date: 11/05/2015 Page 19 / 139 QUALITY ANALYSIS 4. COMPOSITION OF THE DATABASE This section describes which information contains the database at the current status. Firstly, the demographic characteristics of the users who have provided the image for this report are given. Then, a report about the number of images and the results obtained for at the acquisition process are explained. COMPOSITION OF THE DATABASE Users The content of the database is composed by fingerprint images provided by a total amount of users of 589 individuals. These people has the following characteristics: Gender distribution o Males: 336 individuals (57.05 %) o Females: 253 individuals (42.95 %) Age distribution o Less than 30 years old: 496 individuals (84.21 %) o Between 30 to 50 years old: 59 individuals (10.02 %) o More than 50 years old: 34 individuals (5.77 %) Technical knowledge distribution o Habituated to IT products: 563 individuals (95.59 %) o Non-habituated to IT products: 26 individuals (4.41 %) Biometric system habituation distribution o Habituated to biometric products: 204 individuals (34.635 %) o Non-habituated to biometric products: 385 individuals (65.365 %) PUBLIC REPORT Code: IDTL-FDC-01 Revision: 1.1 Date: 11/05/2015 Page 20 / 139 QUALITY ANALYSIS Visits Considering this test crew, the frequency between visits can be seen in Figure 10. A total of 589 test subjects have conducted the first visit whereas 553 have already completed the captured process. Frequency between vistis 120 Number of test subjects 100 80 60 40 20 0 0 20 40 60 80 Days between visits 100 120 Figure 10. Days between visits FINGERPRINT IMAGES The number of fingerprint images that currently includes the database for 589 users are a total of 188216 images. NXT = 64354 images FPC = 65100 images UPK = 58762 images Nevertheless, some of them have been discarded by the operator using visual inspection. Therefore, the number of fingerprint images that have been used for the performance analysis are a total of 186593 images. NXT = 63493 images FPC = 64613 images UPK = 58487 images PUBLIC REPORT Code: IDTL-FDC-01 Revision: 1.1 Date: 11/05/2015 Page 21 / 139 PART I PERFORMANCE ANALISIS REPORT ORIGINAL DATABASE Code: IDTL-FDC-01 Revision: 1.1 Date: 11/05/2015 Page 22 / 139 PUBLIC REPORT QUALITY ANALYSIS 5. QUALITY ANALYSIS This section shows the quality analysis results of the database captured for the three sensors. The quality analysis has been done using the NFIQ quality score provided by NIST [4]. This score measures the quality of a fingerprint image obtaining a value between 1 and 5. NFIQ = 1 means that the quality of the image is very good whereas NFIQ = 5 means that the quality of the image is very bad. NFIQ DISTRIBUTION The NFIQ distribution has been separated based on the enrolment and capturing processes due to different quality threshold were selected for each process. The quality threshold for enrolment was NFIQ <=3 and the quality threshold for the capturing process was NFIQ <=4. Images that have higher NFIQ than the specified thresholds were considered errors. Enrolment NFIQ distribution Figure 11 shows the NFIQ distribution for enrolment. In spite of the enrolment policy that only images that obtain an NFIQ > = 3 were accepted, the distribution graphic provides data for values between 1 and 5. NFIQ Distribution for enrolment 6000 NXT FPC UPK Number of images 5000 4000 3000 2000 1000 0 1 2 3 4 5 NFIQ Figure 11. NFIQ Distribution for enrolment Code: IDTL-FDC-01 Revision: 1.1 Date: 11/05/2015 Page 23 / 139 PUBLIC REPORT QUALITY ANALYSIS Acquisition NFIQ distribution Figure 12 shows the distribution of NFIQ for the acquisition process. This distribution includes all images that have been captured at this process regardless of any error that could be happen later, when images are compared to its corresponding biometric reference. 4 3.5 NFIQ Distribution for acquiring x 10 NXT FPC UPK 3 Number of images 2.5 2 1.5 1 0.5 0 1 2 3 4 5 NFIQ Figure 12. NFIQ Distribution for capturing process QUALITY FAILURES Taking into account the enrolment and capturing policies explained in sections 3.2.1 and 3.2.2 respectively, quality errors that happen due to quality thresholds are shown in Table 4 for enrolment and in Table 5 for the acquisition processes. The quality threshold for enrolment is NFIQ <=3 and the quality threshold for the acquisition process is NFIQ <=4. Images that have higher NFIQ are considered errors. It is important to note that these errors are common for the two algorithms that have been analysed. PUBLIC REPORT Code: IDTL-FDC-01 Revision: 1.1 Date: 11/05/2015 Page 24 / 139 QUALITY ANALYSIS Table 4. Quality failures obtained during the enrolment process NXT FPC UPK Quality errors (NFIQ >3) 2252 3797 2313 Total number of enrolment images 9205 10418 8973 Quality error rate for enrolment 24.46 % 36.44 % 25.77 % Table 5. Quality failures obtained during the capturing process NXT FPC UPK Quality errors (NFIQ >4) 6614 10183 6232 Total number of acquisition images 54288 54195 49514 Quality error rate for capturing 12.18 % 18.79 % 12.58 % PUBLIC REPORT Code: IDTL-FDC-01 Revision: 1.1 Date: 11/05/2015 Page 25 / 139 PERFORMANCE ANALYSIS 6. PERFORMANCE ANALYSIS This section explains performance results when processing the database of the full size images using two algorithms: NBIS and Neurotechnology. In particular, error rates and throughput rates will be shown. Regarding error rates, these metrics are given separately for enrolment (FTE error) and acquisition process (FTA error). For the comparison process the following curves will be shown: Distribution curves per each fingerprint sensor FNMR vs. FMR curves per each fingerprint sensor ROC curves for the three fingerprint sensors DET curves for the three fingerprint sensors Additional rates: EER, FMR100, FMR1000,FMR10000 It is important to note that most of these curves and results have been done adapting the software provided by Biosecure Tool [5] for calculating this kind of results. In relation to throughput rates, the metrics that have been obtained have been the following: Enrolment time, which has been calculated considering the time that takes to obtain the biometric references. Acquisition time, which has been calculated considering the time that takes to obtain the biometric probes. Mated comparison time, which is the time that takes to compare a biometric probe to the biometric reference of the same user, same finger. Non-mated comparison time, which is the time that takes to compare a biometric probe to the biometric reference that do not belong of the same user. PERFORMANCE RESULTS FOR NBIS ALGORITHM Error rates for NBIS 6.1.1.1. Enrolment and acquisition results FTE and FTA errors that have happened for the different fingerprint sensors when for generating the biometric references and probes for later comparisons are given in Table 6 and Table 7. These errors may happen due to the enrolment and capturing processes have not been successfully completed according the Code: IDTL-FDC-01 Revision: 1.1 Date: 11/05/2015 Page 26 / 139 PUBLIC REPORT PERFORMANCE ANALYSIS procedures explained in sections 3.2.1 and 3.2.2. In this case, the algorithm applied for enrolling and acquiring the samples has been NBIS. Table 6. FTE errors using NBIS algorithm NXT FPC UPK Number of correct templates 3,217 2,826 3,116 FTE errors 317 708 418 Total number of enrolment transactions 3,534 3,534 3,534 FTE rate 8.97 % 20.03 % 11.82 % Table 7. FTA errors using NBIS algorithm NXT FPC UPK Number of correct samples 34,251 26,333 34,012 FTA in Visits 6,527 10,068 6,174 FTP in Visits 32 8 0 CI 11,217 12,575 6,837 FTA errors 17,776 22,651 13,011 Total number of acquisition attempts 52,027 48,984 47,023 FTA rate 34.17 % 46.24 % 27.66 % It is important to highlight that the FTA rate has been obtained considering the number of attempts. However, the number of attempts have been different depending on the fingerprint sensor. PUBLIC REPORT Code: IDTL-FDC-01 Revision: 1.1 Date: 11/05/2015 Page 27 / 139 PERFORMANCE ANALYSIS 6.1.1.2. Comparison results Comparisons results are provided in the following subsections. The number of comparisons used to obtain these metrics per each fingerprint sensors are given in Table 8. Table 8. Number of comparisons conducted using NBIS NXT FPC UPK Mated comparisons 34,251 26,333 34,012 Non-mated comparisons 110,151,216 74,390,725 105,947,381 Distribution curves for NXT sensor Figure 13. Distribution curves for NXT sensor using NBIS algorithm PUBLIC REPORT Code: IDTL-FDC-01 Revision: 1.1 Date: 11/05/2015 Page 28 / 139 PERFORMANCE ANALYSIS FMR vs FNMR graph for NXT sensor (a) (b) Figure 14. FMR vs. FNMR curves for NXT sensor using NBIS algorithm (a) Complete graph (b) Zoom of the relevant area Distribution curves for FPC sensor Figure 15. Distribution curves for FPC sensor using NBIS algorithm PUBLIC REPORT Code: IDTL-FDC-01 Revision: 1.1 Date: 11/05/2015 Page 29 / 139 PERFORMANCE ANALYSIS FMR vs FNMR graph for FPC sensor (a) (b) Figure 16. FMR vs FNMR curves for FPC sensor using NBIS algorithm (a) Complete graph (b) Zoom of the relevant area Distribution curves for UPK sensor Figure 17. Distribution curves for UPK sensor using NBIS algorithm PUBLIC REPORT Code: IDTL-FDC-01 Revision: 1.1 Date: 11/05/2015 Page 30 / 139 PERFORMANCE ANALYSIS FMR vs FNMR graph for UPK sensor (a) (b) Figure 18. FMR vs FNMR curves for UPK sensor using NBIS algorithm (a) Complete graph (b) Zoom of the relevant area DET curves Figure 19. DET curves for the fingerprint sensors using NBIS algorithm Code: IDTL-FDC-01 Revision: 1.1 Date: 11/05/2015 Page 31 / 139 PUBLIC REPORT PERFORMANCE ANALYSIS ROC curves Figure 20. ROC Curves using NBIS algorithm Additional rates In addition to previous sections, Table 9 provides relevant error rates for the different sensors. Table 9. Additional error rates for NBIS Error rate NXT FPC UPK EER 3.88 % 0.60 % 4.26 % 19.21 % < 0.01 % 18.24 % 43.99 15.62 % 38.09 % 62.01 % 37.67 % 55.88 % FMR100 (the lowest FNMR for FMR<=1%) FMR1000 (the lowest FNMR for FMR<=0.1%) FMR10000 (the lowest FNMR for FMR<=0.01%) The lack of precisión in providing this rate is due to the sample rejection by the automatic ground truth checking mechanism during the capturing process. PUBLIC REPORT Code: IDTL-FDC-01 Revision: 1.1 Date: 11/05/2015 Page 32 / 139 PERFORMANCE ANALYSIS Throughput rates for NBIS This subsection shows throughput rates for the processes that have been conducted during the evaluation considering the NBIS algorithm. The application used to process and compare fingerprint images has been developed using Microsoft Visual Studio, .NET framework 4.5 and C# 32 bits. Moreover, time measurements for obtaining features extraction vectors at enrolment and acquisition processes have been calculated using different machines: Machine 1: a laptop with a processor Intel core i7-3517U @ 1.9 GHz (up to 2.4GHz) and a RAM memory of 4GB. This PC has installed Windows 8.1 Professional 2013. This machine was used for processing images captured with NXT and UPK fingerprint sensors. Machine 2: a PC with a processor Intel Core 2 Duo E8500 @ 3'16 GHz and a RAM memory of 4 GB. This PC has installed Windows 7 Professional 2009, Service Pack 1 This machine was used for processing images captured with FPC fingerprint sensor. 6.1.2.1. Enrolment results Table 10 shows the time in milliseconds that takes to obtain the biometric references for the images captured with each fingerprint sensor respectively. Table 10. Throughput rates results for enrolment using NBIS algorithm Enrolment NXT FPC UPK Arithmetic mean 169.60 ms 149.83 ms 320.32 ms Standard deviation ± 99.41 ms ± 53.84 ms ± 135.64 ms Minimum 69 ms 98 ms 160 ms Maximum 1,594 ms 584 ms 2,770 ms Number of enrolments 3,217 2,826 3,116 PUBLIC REPORT Code: IDTL-FDC-01 Revision: 1.1 Date: 11/05/2015 Page 33 / 139 PERFORMANCE ANALYSIS 6.1.2.2. Acquisition results Table 11 shows the time in milliseconds that takes to obtain the biometric probes for the images captured with each fingerprint sensor respectively. Table 11. Throughput rates results for acquisition using NBIS algorithm Acquisition NXT FPC UPK Arithmetic mean 48.18 ms 52.73 ms 184.24 ms Standard deviation ± 9.65 ms ± 5.08 ms ± 96.02 ms Minimum 12 ms 26 ms 92 ms Maximum 322 ms 96 ms 1,262 ms Number of acquisitions 47,729 44,119 43,340 6.1.2.3. Comparison results Next tables provided the time in milliseconds that takes to compare the biometric references to biometric probes for the images captured with each fingerprint sensor respectively. Specifically, Table 12 shows measurements obtained for mated comparisons and Table 13 for non-mated comparisons. Table 12. Throughput rates results for mated comparisons using NBIS algorithm Mated Comparisons NXT FPC UPK Arithmetic mean 33.67 ms 11.69 ms 31.68 ms Standard deviation ± 48.15 ms ± 26.31 ms ± 48.87 ms Minimum 0 ms 0 ms 0 ms Maximum 801 ms 412 ms 1,182 ms Number of comparisons 34,251 26,333 34,012 PUBLIC REPORT Code: IDTL-FDC-01 Revision: 1.1 Date: 11/05/2015 Page 34 / 139 PERFORMANCE ANALYSIS Table 13. Throughput rates results for non-mated comparisons using NBIS algorithm Non-mated Comparisons NXT FPC UPK Arithmetic mean 2.92 ms 0.48 ms 3.97 ms Standard deviation ± 9.11 ms ± 3.17 ms ± 11.4 ms Minimum 0 ms 0 ms 0 ms Maximum 1,213 ms 522 ms 1,256 ms Number of comparisons 110,151,216 74,390,725 105,947,381 Code: IDTL-FDC-01 Revision: 1.1 Date: 11/05/2015 Page 35 / 139 PUBLIC REPORT PERFORMANCE ANALYSIS PERFORMANCE RESULTS FOR NEUROTECHNOLOGY ALGORITHM Error rates for Neurotechnology 6.2.1.1. Enrolment and acquisition results FTE and FTA errors that have happened for the different fingerprint sensors when for generating the biometric references and probes for later comparisons are given in Table 14 and Table 15. These errors may happen due to the enrolment and capturing processes have not been successfully completed according the procedures explained in sections 3.2.1 and 3.2.2. In this case, the algorithm applied for enrolling and acquiring the samples has been Neurotechnology. Table 14. FTE errors using Neurotechnology algorithm NXT FPC UPK Number of correct templates 3,230 2,903 3,131 FTE errors 304 631 403 Total number of enrolment attempts 3,534 3,534 3,534 FTE rate 8.60 % 17.85 % 11.40 % Table 15. FTA errors using Neurotechnology algorithm NXT FPC UPK Number of correct samples 43,264 37,128 40,032 FTA in Visits 6,571 10,068 9,071 FTP in Visits 1,655 959 502 CI real 1,118 1,903 1,023 FTA errors 9,344 12,930 10,596 Total number of acquisition attempts 52,608 50,058 50,628 FTA rate 17.76 % 25.83 % 20.93 % PUBLIC REPORT Code: IDTL-FDC-01 Revision: 1.1 Date: 11/05/2015 Page 36 / 139 PERFORMANCE ANALYSIS 6.2.1.2. Comparison results Comparisons results are provided in the following subsections. The number of comparisons used to obtain these metrics per each fingerprint sensors are given in Table 16. Table 16. Number of comparisons conducted using Neurotechnology NXT FPC UPK Mated comparisons 43,262 37,128 40,032 Non-mated comparisons 139,680,082 107,742,554 125,118,621 Distribution curves for NXT sensor Figure 21. Distribution curves for NXT sensor using Neurotechnology algorithm Code: IDTL-FDC-01 Revision: 1.1 Date: 11/05/2015 Page 37 / 139 PUBLIC REPORT PERFORMANCE ANALYSIS FMR vs FNMR graph for NXT sensor (a) (b) Figure 22. FMR vs. FNMR curves for NXT sensor using Neurotechnology algorithm (a) Complete graph (b) Zoom of the relevant area Distribution curves for FPC sensor Figure 23. Distribution curves for FPC sensor using Neurotechnology algorithm PUBLIC REPORT Code: IDTL-FDC-01 Revision: 1.1 Date: 11/05/2015 Page 38 / 139 PERFORMANCE ANALYSIS FMR vs FNMR graph for FPC sensor (a) (b) Figure 24. FMR vs FNMR curves for FPC sensor using Neurotechnology algorithm (a) Complete graph (b) Zoom of the relevant area Distribution curves for UPK sensor Figure 25. Distribution curves for UPK sensor using Neurotechnology algorithm Code: IDTL-FDC-01 Revision: 1.1 Date: 11/05/2015 Page 39 / 139 PUBLIC REPORT PERFORMANCE ANALYSIS FMR vs FNMR graph for UPK sensor (a) (b) Figure 26. FMR vs FNMR curves for UPK sensor using Neurotechnology algorithm (a) Complete graph (b) Zoom of the relevant area DET curves Figure 27. DET curves for the fingerprint sensors using Neurotechnology algorithm Code: IDTL-FDC-01 Revision: 1.1 Date: 11/05/2015 Page 40 / 139 PUBLIC REPORT PERFORMANCE ANALYSIS ROC curves Figure 28. ROC Curves using Neurotechnology algorithm Additional rates In addition to previous sections, Table 17 provides relevant error rates for the different sensors. Table 17. Additional error rates for Neurotechnology Error rate NXT FPC UPK EER 0.0639 % 0.0925 % 0.0616% <0.01%* <0.01%* <0.01%* <0.01 %* <0.01%* <0.01%* 0.628 % 1.54 % 0.42 % FMR100 (the lowest FNMR for FMR<=1%) FMR1000 (the lowest FNMR for FMR<=0.1%) FMR10000 (the lowest FNMR for FMR<=0.01%) * The lack of precisión in providing this rate is due to the sample rejection by the automatic ground truth checking mechanism during the capturing process. PUBLIC REPORT Code: IDTL-FDC-01 Revision: 1.1 Date: 11/05/2015 Page 41 / 139 PERFORMANCE ANALYSIS Throughput rates for Neurotechnology This subsection shows throughput rates for the processes that have been conducted during the evaluation considering the Neurotechnology algorithm. The application used to process and compare fingerprint images has been developed using Microsoft Visual Studio, .NET framework 4.5 and C# 32 bits. Moreover, time measurements for obtaining features extraction vectors at enrolment and acquisition processes have been calculated using different machines: Machine 1: a laptop with a processor Intel core i7-3517U @ 1.9 GHz (up to 2.4GHz) and a RAM memory of 4GB. This PC has installed Windows 8.1 Professional 2013. This machine was used for processing images captured with NXT and UPK fingerprint sensors. Machine 2: a PC with a processor Intel Core 2 Duo E8500 @ 3'16 GHz and a RAM memory of 4 GB. This PC has installed Windows 7 Professional 2009, Service Pack 1 This machine was used for processing images captured with FPC fingerprint sensor. 6.2.2.1. Enrolment results Table 18 shows the time in milliseconds that takes to obtain the biometric references for the images captured with each fingerprint sensor respectively. Table 18. Throughput rates results for enrolment using Neurotechnology algorithm Enrolment NXT FPC UPK Arithmetic mean 2,219 ms 2,200 ms 2,215 ms Standard deviation ± 94.28 ms ± 136.25 ms ± 56.04 ms Minimum 521 ms 230 ms 778 ms Maximum 4,452 ms 4,463 ms 3,340 ms Number of enrolments 3,230 2,903 3,131 PUBLIC REPORT Code: IDTL-FDC-01 Revision: 1.1 Date: 11/05/2015 Page 42 / 139 PERFORMANCE ANALYSIS 6.2.2.2. Acquisition results Table 19 shows the time in milliseconds that takes to obtain the biometric probes for the images captured with each fingerprint sensor respectively. Table 19. Throughput rates results for acquisition using Neurotechnology algorithm Acquisition NXT FPC UPK Arithmetic mean 1,101 ms 1,043 ms 1,090 ms Standard deviation ± 66.75 ms ± 36.12 ms ± 84.04 ms Minimum 78 ms 239 ms 165 ms Maximum 1,416 ms 1,187 ms 1,530 ms Number of acquisitions 46,431 43,168 44,531 6.2.2.3. Comparison results Next tables provided the time in milliseconds that takes to compare the biometric references to biometric probes for the images captured with each fingerprint sensor respectively. Specifically, Table 20 shows measurements obtained for mated comparisons and Table 21 for non-mated comparisons. Table 20. Throughput rates results for mated comparisons using Neurotechnology algorithm Mated Comparisons NXT FPC UPK Arithmetic mean 2.17 ms 1.07 ms 1.55 ms Standard deviation ± 1.81 ms ± 1.157 ms ± 0.17 ms Minimum 0 ms 0 ms 0 ms Maximum 20 ms 32 ms 22 ms Number of comparisons 43,262 37,128 40,032 PUBLIC REPORT Code: IDTL-FDC-01 Revision: 1.1 Date: 11/05/2015 Page 43 / 139 PERFORMANCE ANALYSIS Table 21. Throughput rates results for non-mated comparisons using Neurotechnology algorithm Non-mated Comparisons NXT FPC UPK Arithmetic mean 2.20 ms 0.86 ms 2.00 ms Standard deviation ± 1.96 ms ± 0.55 ms ± 1.65 ms Minimum 0 ms 0 ms 0 ms Maximum 2,396 ms 70 ms 95 ms Number of comparisons 139,680,082 107,742,554 125,118,621 PUBLIC REPORT Code: IDTL-FDC-01 Revision: 1.1 Date: 11/05/2015 Page 44 / 139 PART II PERFORMANCE ANALISIS REPORT CROPPED DATABASES PUBLIC REPORT Code: IDTL-FDC-01 Revision: 1.1 Date: 11/05/2015 Page 45 / 139 CROPPED DATABASES 7. CROPPED DATABASES This section describes the approach for generating cropped images using the images collected by different fingerprint sensors: NB-3010-U sensor, FPC1011F3 sensor and Upek Eikon Touch 510 sensor. This method have been done based on three sizes that are going to be studied: 12x12 mm2 10x10 mm2 8x8 mm2 Firstly, the approach to obtain the images will be explained. Then an example of the cropped images for the different sizes per each fingerprint sensor will be shown. CROPPING APPROACH There are several approaches to obtain a cropped images depending on the selection of the centre of the cropped image: 1. Select the centre considering the centre of the ROI (region of interest). 2. Select the centre considering the centre of the original image. 3. Select a random centre considering a limited area. All of them have been illustrated in Figure 29. However, not all the methods models the expected behaviour of the users. The first method reduces the active area but it is based on the idea that a user always place the finger in the same position of the sensor. This is not realistic, especially for small sensors, in which it is difficult to place the centre of the fingerprint on the centre of the active area. Figure 29. Different approaches for cropping the original image PUBLIC REPORT Code: IDTL-FDC-01 Revision: 1.1 Date: 11/05/2015 Page 46 / 139 CROPPED DATABASES The second method has the same problem of the first method. The variability of the fingerprint placement is insufficiently, considering the variability that has been observed for small sensors. Finally, the third method is the more realistic method because it is based on the idea that a user tries to place the fingerprint on the centre of the active area but there is a variability due to the difficulty to find it in small sensors. Therefore, this is the method that have been used for cropping the images. Figure 30. Area for selecting the centre of the cropped image In particular, this method consists on selecting the centre of the cropped image considering a random position in a limited area as it is shown in Figure 30. The limited area has been chosen based on the 10x10 mm2 size and the possible variations considering this size. The possibilities considering the 12x12 mm2 size entail a low variability of the user placement and considering the 8x8 mm 2 size entail a high variability of the user placement (see Figure 31). 12x12 10x10 Figure 31. Selection of the limited area 8x8 PUBLIC REPORT Code: IDTL-FDC-01 Revision: 1.1 Date: 11/05/2015 Page 47 / 139 CROPPED DATABASES Once the centre has been randomly selected in the original image, then this image is cut according to the different sizes. The results are shown in Figure 32 Figure 32. Approach to generate the different sizes for the cropped images COMPOSITION OF THE CROPPED DATABASES Regarding to images, the number of fingerprint images that compose the cropped database depend on the number of samples that have overcome the ground truth mechanism (see section 3.3) for each of the sensor and algorithm. Therefore the number of images for each of the cropped databases is lower than the ones for the original database. For NXT fingerprint sensor: NXT Full size = 64613 images Cropped NXT- NBIS = 40466 images Cropped NXT- Neurotechnology = 50587 images For FPC fingerprint sensor: FPC Full size = 63493 images Cropped FPC- NBIS = 32133 images Cropped FPC- Neurotechnology = 43638 images For FPC fingerprint sensor: UPK Full size = 58487 images Cropped UPK- NBIS = 42871 images Cropped UPK- Neurotechnology = 42871images It is important to note that, due to the fact that the original image of the FPC sensor is 10,6 x 14,0, the cropped database referred as FPC 12x12 has, in fact, images of 10,6 x 12,0. Code: IDTL-FDC-01 Revision: 1.1 Date: 11/05/2015 Page 48 / 139 PUBLIC REPORT CROPPED IMAGES GENERATION NXT Cropped images NXT 12x17 mm2 NXT 12x12 mm2 NXT 10x10 mm2 NXT 8x8 mm2 180x256 pixels 180x180 pixels 150x150 pixels 120x120 pixels Code: IDTL-FDC-01 Revision: 1.1 Date: 11/05/2015 Page 49 / 139 PUBLIC REPORT CROPPED IMAGES GENERATION FPC Cropped images FPC 10.6x14 mm2 152x200 pixels 2 FPC 12x12 mm2 152x172 pixels 2 FPC10x10 mm2 FPC 8x8 mm2 143x143 pixels 114x114 pixels As it can be seen, the FPC 12x12 images are in fact 10,6x12,0, as the original image obtained from the sensor is 10,6 x 14,0 Code: IDTL-FDC-01 Revision: 1.1 Date: 11/05/2015 Page 50 / 139 PUBLIC REPORT CROPPED IMAGES GENERATION UPK Cropped images UPK 12.8x18 mm2 UPK 12x12 mm2 UPK 10x10 mm2 UPK 8x8 mm2 192x270 pixels 180x180 pixels 150x150 pixels 120x120 pixels PUBLIC REPORT Code: IDTL-FDC-01 Revision: 1.1 Date: 11/05/2015 Page 51 / 139 QUALITY ANALYSIS OF THE CROPPED DATABASE 8. QUALITY ANALYSIS OF THE CROPPED DATABASES This section shows the quality analysis results of the cropped databases generated from the full-size database. This analysis includes the total number of images that have been reported in the previous section for NBIS algorithm considering the different sizes. In a similar way to the full size database, this quality analysis has been done using the NFIQ quality score provided by NIST [4]. QUALITY ANALYSIS NFIQ Distribution for NXT sensor Figure 33. NFIQ Distribution using NXT sensor PUBLIC REPORT Code: IDTL-FDC-01 Revision: 1.1 Date: 11/05/2015 Page 52 / 139 QUALITY ANALYSIS OF THE CROPPED DATABASE NFIQ Distribution for FPC sensor Figure 34. NFIQ Distribution for enrolment using FPC sensor NFIQ Distribution Figure 35. NFIQ Distribution for enrolment using UPK sensor PUBLIC REPORT Code: IDTL-FDC-01 Revision: 1.1 Date: 11/05/2015 Page 53 / 139 PART II-A PERFORMANCE ANALISIS REPORT FULL SIZES IMAGES vs. CROPPED SIZES IMAGES PUBLIC REPORT Code: IDTL-FDC-01 Revision: 1.1 Date: 11/05/2015 Page 54 / 139 PERFORMANCE ANALISIS FULL SIZE VS. CROPPED IMAGES 9. PERFORMANCE ANALISIS FULL SIZE VS. CROPPED IMAGES INTRODUCTION This section explains performance analysis results considering the different algorithms: NBIS and Neurotechnology. In particular, error rates and throughput rates will be shown. Regarding error rates, these metrics are given separately for enrolment (FTE error) and acquisition process (FTA error) and then, for the comparison process. For the comparison process the following curves will be shown: ROC curves for the three fingerprint sensors DET curves for the three fingerprint sensors Additional rates: EER, FMR100, FMR1000,FMR10000 In addition, the following curves will be provided in the annexes: Distribution curves per each fingerprint sensor FNMR vs. FMR curves per each fingerprint sensor In relation to throughput rates, the metrics that have been obtained have been the following: Enrolment time, which has been calculated considering the time that takes to obtain the biometric references. Acquisition time, which has been calculated considering the time that takes to obtain the biometric probes. Mated comparison time, which is the time that takes to compare a biometric probe to the biometric reference of the same user, same finger. Non-mated comparison time, which is the time that takes to compare a biometric probe to the biometric reference that do not belong of the same user. An important issue to consider is that the quality check and ground truth mechanism was applied in the full size database, and those images not concealing with those requirements have been discarded for the cropped images analysis. In other terms, this means that the ground truth mechanism is not applied again during this tests, and therefore, the FTA cases detected are additional to the ones of the full-size case. In order not to confuse the reader, we will consider Failure to Process (FTP) rates, instead of the FTA rates, knowing that the number of cases in a real scenario should be the sum of both the FTA and FTP cases. PUBLIC REPORT Code: IDTL-FDC-01 Revision: 1.1 Date: 11/05/2015 Page 55 / 139 PERFORMANCE ANALISIS FULL SIZE VS. CROPPED IMAGES PERFORMANCE RESULTS FOR NBIS Performance results for NBIS - NXT 9.2.1.1. Error rates for NBIS – NXT Enrolment and acquisition results For enrolment, results are similar to those obtained for the original database (See section 6.1.1.1). A total 3,217 correct templates have been generated and 317 FTE errors have happened. Therefore, the FTE rate for NXT sensor using NBIS algorithm has been 8.97 %. FTP errors that have happened correspond to those errors to generate the features vector from the cropped images. These error are given in Table 22. Table 22. FTP errors for NBIS - NXT NXT_12x12 NXT_10x10 NXT_8x8 Number of correct samples 33,508 33,507 33,495 FTP errors 0 1 13 Total number of acquisition attempts 33,508 33,508 33,508 FTP rate 0.00 % 0.0029 % 0.0038 % Comparison results Comparisons results are provided in the following subsections. The number of comparisons used to obtain these metrics per each fingerprint sensors are given in Table 23. Code: IDTL-FDC-01 Revision: 1.1 Date: 11/05/2015 Page 56 / 139 PUBLIC REPORT PERFORMANCE ANALISIS FULL SIZE VS. CROPPED IMAGES Table 23. Number of comparisons conducted using NBIS - NXT NXT NXT_12x12 NXT_10x10 NXT_8x8 Mated comparisons 34,251 33,508 33,507 33,495 Non-mated comparisons 110,151,216 107,761,728 107,758,512 107,719,920 DET curves Figure 36. DET curves for the fingerprint sensors using NBIS – NXT Code: IDTL-FDC-01 Revision: 1.1 Date: 11/05/2015 Page 57 / 139 PUBLIC REPORT PERFORMANCE ANALISIS FULL SIZE VS. CROPPED IMAGES ROC curves Figure 37. ROC Curves using NBIS – NXT Additional rates In addition to previous sections, Table 24 provides relevant error rates for the different sensors. Table 24. Additional error rates for NBIS - NXT Error rate NXT NXT_12x12 NXT_10x10 NXT_8x8 EER 3.88 % 12.43 % 20.49 % 36.47 % 19.21 % 38.19 % 51.82 % 73.73 % 43.99 % 58.92 % 70.21 % 85.78 % 62.01 % 74.43 % 83.22 % 93.13 % FMR100 (the lowest FNMR for FMR<=1%) FMR1000 (the lowest FNMR for FMR<=0.1%) FMR10000 (the lowest FNMR for FMR<=0.01%) PUBLIC REPORT Code: IDTL-FDC-01 Revision: 1.1 Date: 11/05/2015 Page 58 / 139 PERFORMANCE ANALISIS FULL SIZE VS. CROPPED IMAGES 9.2.1.2. Throughput rates for NBIS - NXT This subsection shows throughput rates for the processes that have been conducted during the evaluation considering the NBIS algorithm and the NXT fingerprint sensor. The application used to process and compare fingerprint images has been developed using Microsoft Visual Studio, .NET framework 4.5 and C# 32 bits. Moreover, time measurements for the different processes have been calculated using different machines: Machine 1: a laptop with a processor Intel core i7-3517U @ 1.9 GHz (up to 2.4GHz) and a RAM memory of 4GB. This PC has installed Windows 8.1 Professional 2013. This machine was used for extracting the feature vectors of the original database and for making comparisons. Machine 2: a laptop with a processor Intel Core i7-5500U @ 2.40 GHz and a RAM memory of 8 GB. This PC has installed Windows 8.1 Professional 2013. This machine was used for extracting the feature vectors of the cropped databases. Enrolment results Time measurements to obtain biometric references for NXT using NBIS algorithm are the following: Arithmetic mean: 169.60 ms Standard deviation: ± 99.41 ms Minimum: 69 ms Maximum: 1,594 ms Acquisition results Table 25 shows the time in milliseconds that takes to obtain the biometric probes for the images captured with each fingerprint sensor respectively. Code: IDTL-FDC-01 Revision: 1.1 Date: 11/05/2015 Page 59 / 139 PUBLIC REPORT PERFORMANCE ANALISIS FULL SIZE VS. CROPPED IMAGES Table 25. Throughput rates results for acquisition using NBIS - NXT Acquisition NXT NXT_12x12 NXT_10x10 NXT_8x8 Arithmetic mean 48.18 ms 37.48 ms 32.03 ms 19.72 ms Standard deviation ± 9.65 ms ± 9.16 ms ± 8.11 ms ± 5.11 ms Minimum 12 ms 14 ms 10 ms 6 ms Maximum 322 ms 79 ms 68 ms 45 ms Number of acquisitions 47,729 33,508 33,507 33,495 Comparison results Next tables provided the time in milliseconds that takes to compare the biometric references to biometric probes for the images captured with each fingerprint sensor respectively. Specifically, Table 26 shows measurements obtained for mated comparisons and Table 27 for non-mated comparisons. Table 26. Throughput rates results for mated comparisons using NBIS - NXT Mated comparisons NXT NXT_12x12 NXT_10x10 NXT_8x8 Arithmetic mean 33.67 ms 27.63 ms 3.62 ms 0.42 ms Standard deviation ± 48.15 ms ± 49.59 ms ± 13.83 ms ± 2.91 ms Minimum 0 ms 0 ms 0 ms 0 ms Maximum 801 ms 943 ms 571 ms 199 ms Number of comparisons 34,251 33,508 33,507 33,495 Code: IDTL-FDC-01 Revision: 1.1 Date: 11/05/2015 Page 60 / 139 PUBLIC REPORT PERFORMANCE ANALISIS FULL SIZE VS. CROPPED IMAGES Table 27. Throughput rates results for non-mated comparisons using NBIS NXT Non-mated comparisons NXT NXT_12x12 NXT_10x10 NXT_8x8 Arithmetic mean 2.92 ms 3.57 ms 0.61 ms 0.19 ms Standard deviation ± 9.11 ms ± 11.14 ms ± 3.04 ms ± 0.59 ms Minimum 0 ms 0 ms 0 ms 0 ms Maximum 1,213 ms 2,828 ms 1,252 ms 527 ms Number of comparisons 110,151,216 107,761,728 107,761,728 107,719,920 Code: IDTL-FDC-01 Revision: 1.1 Date: 11/05/2015 Page 61 / 139 PUBLIC REPORT PERFORMANCE ANALISIS FULL SIZE VS. CROPPED IMAGES Performance results for NBIS - FPC 9.2.2.1. Error rates for NBIS - FPC Enrolment and acquisition results For enrolment, results are similar to those obtained for the original database (See section 6.1.1.1). A total 2,826 correct templates have been generated and 708 FTE errors have happened. Therefore, the FTE rate for FPC sensor using NBIS algorithm has been 20.03 %. FTP errors that have happened correspond to those errors to generate the features vector from the cropped images. These error are given in Table 28. Table 28. FTP errors for NBIS - FPC FPC_12x12 FPC_10x10 FPC_8x8 Number of correct samples 25,512 25,512 25,511 FTP errors 0 0 1 Total number of acquisition attempts 25,512 25,512 25,512 FTP rate 0.00 % 0.00 % 0.0039 % Comparison results Comparisons results are provided in the following subsections. The number of comparisons used to obtain these metrics per each fingerprint sensors are given in Table 29. Table 29. Number of comparisons conducted using NBIS - FPC FPC FPC_12x12 FPC_10x10 FPC_8x8 Mated comparisons 26,333 25,512 25,512 25,511 Non-mated comparisons 74,390,725 72,071,400 72,071,400 72,068,575 PUBLIC REPORT Code: IDTL-FDC-01 Revision: 1.1 Date: 11/05/2015 Page 62 / 139 PERFORMANCE ANALISIS FULL SIZE VS. CROPPED IMAGES DET curves Figure 38. DET curves for the fingerprint sensors using NBIS – FPC ROC curves Figure 39. ROC Curves using NBIS – FPC Code: IDTL-FDC-01 Revision: 1.1 Date: 11/05/2015 Page 63 / 139 PUBLIC REPORT PERFORMANCE ANALISIS FULL SIZE VS. CROPPED IMAGES Additional rates In addition to previous sections, Table 30 provides relevant error rates for the different sensors. Table 30. Additional error rates for NBIS - FPC Error rate FPC FPC_12x12 FPC_10x10 FPC_8x8 EER 0.60 % 4.72 % 10.88 % 22.62 % <0.01% 11.54 % 27.30 % 49.50 % 15.62 % 28.02 % 45.37 % 66.87 % 37.67 % 46.05 % 64.35 % 80.67 % FMR100 (the lowest FNMR for FMR<=1%) FMR1000 (the lowest FNMR for FMR<=0.1%) FMR10000 (the lowest FNMR for FMR<=0.01%) 9.2.2.2. Throughput rates for NBIS - FPC This subsection shows throughput rates for the processes that have been conducted during the evaluation considering the NBIS algorithm and the FPC fingerprint sensor. The application used to process and compare fingerprint images has been developed using Microsoft Visual Studio, .NET framework 4.5 and C# 32 bits. Moreover, time measurements for the different processes have been calculated using different machines: Machine 1: a PC with a processor Intel Core 2 Duo E8500 @ 3.16 GHz and a RAM memory of 4GB. This PC has installed Windows 7 Professional 2009, SP1. This machine was used for extracting the feature vectors of the original database. Machine 2: a laptop with a processor Intel Core i7-5500U @ 2.40 GHz and a RAM memory of 8 GB. This PC has installed Windows 8.1 Professional 2013. This machine was used for extracting the feature vectors of the cropped databases and for making comparisons. The lack of precisión in providing this rate is due to the sample rejection by the automatic ground truth checking mechanism during the capturing process. PUBLIC REPORT Code: IDTL-FDC-01 Revision: 1.1 Date: 11/05/2015 Page 64 / 139 PERFORMANCE ANALISIS FULL SIZE VS. CROPPED IMAGES Enrolment results Time measurements to obtain biometric references for FPC using NBIS algorithm are the following: Arithmetic mean: 169.60 ms Standard deviation: ± 99.41 ms Minimum: 69 ms Maximum: 1,594 ms Acquisition results Table 31 shows the time in milliseconds that takes to obtain the biometric probes for the images captured with each fingerprint sensor respectively. Table 31. Throughput rates results for acquisition using NBIS - FPC Acquisition FPC FPC_12x12 FPC_10x10 FPC_8x8 Arithmetic mean 52.73 ms 43.88 ms 38.92 ms 29.07 ms Standard deviation ± 5.08 ms ± 6.78 ms ± 6.26 ms ± 3.82 ms Minimum 26 ms 29 ms 22 ms 16 ms Maximum 96 ms 71 ms 62 ms 49 ms Number of acquisitions 44,119 25,512 22,512 22,511 Comparison results Next tables provided the time in milliseconds that takes to compare the biometric references to biometric probes for the images captured with each fingerprint sensor respectively. Specifically, Table 32 shows measurements obtained for mated comparisons and Table 33 for non-mated comparisons. Code: IDTL-FDC-01 Revision: 1.1 Date: 11/05/2015 Page 65 / 139 PUBLIC REPORT PERFORMANCE ANALISIS FULL SIZE VS. CROPPED IMAGES Table 32. Throughput rates results for mated comparisons using NBIS - FPC Mated comparisons FPC FPC_12x12 FPC_10x10 FPC_8x8 Arithmetic mean 11.69 ms 8.31 ms 2.39 ms 0.20 ms Standard deviation ± 26.31 ms ± 22.12 ms ± 10.89 ms ± 1.64 ms Minimum 0 ms 0 ms 0 ms 0 ms Maximum 412 ms 327 ms 752 ms 128 ms Number of comparisons 26,333 25,512 25,512 25,511 Table 33. Throughput rates results for non-mated comparisons using NBIS FPC Nonmated comparisons FPC FPC_12x12 FPC_10x10 FPC_8x8 Arithmetic mean 0.48 ms 0.32 ms 0.08 ms 0.006 ms Standard deviation ± 3.17 ms ± 2.52 ms ± 1.07 ms ± 0.182 ms Minimum 0 ms 0 ms 0 ms 0 ms Maximum 522 ms 787 ms 438 ms 238 ms Number of comparisons 74,390,725 72,071,400 72,071,400 72,068,575 Code: IDTL-FDC-01 Revision: 1.1 Date: 11/05/2015 Page 66 / 139 PUBLIC REPORT PERFORMANCE ANALISIS FULL SIZE VS. CROPPED IMAGES Performance results for NBIS - UPK 9.2.3.1. Error rates for NBIS - UPK Enrolment and acquisition results For enrolment, results are similar to those obtained for the original database (See section 6.1.1.1). A total 3,116 correct templates have been generated and 418 FTE errors have happened. Therefore, the FTE rate for UPK sensor using NBIS algorithm has been 11.82 %. FTP errors that have happened correspond to those errors to generate the features vector from the cropped images. These error are given in Table 34. Table 34. FTP errors for NBIS – UPK UPK_12x12 UPK_10x10 UPK_8x8 Number of correct samples 33,720 33,718 33,689 FTP 0 2 31 Total number of acquisition attempts 33,720 33,720 33,720 FTP rate 0.00 % 0.005 % 0.092 % Comparison results Comparisons results are provided in the following subsections. The number of comparisons used to obtain these metrics per each fingerprint sensors are given in Table 35. Table 35. Number of comparisons conducted using NBIS - UPK UPK UPK_12x12 UPK_10x10 UPK_8x8 Mated comparisons 34,012 33,720 33,718 33,689 Non-mated comparisons 105,947,381 102,799,756 102,793,524 102,703,182 PUBLIC REPORT Code: IDTL-FDC-01 Revision: 1.1 Date: 11/05/2015 Page 67 / 139 PERFORMANCE ANALISIS FULL SIZE VS. CROPPED IMAGES DET curves Figure 40. DET curves for the fingerprint sensors using NBIS – UPK ROC curves Figure 41. ROC Curves using NBIS – UPK Code: IDTL-FDC-01 Revision: 1.1 Date: 11/05/2015 Page 68 / 139 PUBLIC REPORT PERFORMANCE ANALISIS FULL SIZE VS. CROPPED IMAGES Additional rates In addition to previous sections, Table 36 provides relevant error rates for the different sensors. Table 36. Additional error rates for NBIS - UPK Error rate UPK UPK_12x12 UPK_10x10 UPK_8x8 EER 4.26 % 12.62 % 19.15 % 34.46 % 18.24 % 34.87 % 47.12 % 65.11 % 38.09 % 54.94 % 68.95 % 79.18 % 55.88 % 69.47 % 81.13 % 90.21 % FMR100 (the lowest FNMR for FMR<=1%) FMR1000 (the lowest FNMR for FMR<=0.1%) FMR10000 (the lowest FNMR for FMR<=0.01%) 9.2.3.2. Throughput rates for NBIS - UPK This subsection shows throughput rates for the processes that have been conducted during the evaluation considering the NBIS algorithm and the UPK fingerprint sensor. The application used to process and compare fingerprint images has been developed using Microsoft Visual Studio, .NET framework 4.5 and C# 32 bits. Moreover, time measurements for the different processes have been calculated using different machines: Machine 1: a PC with a processor Intel Core 2Duo E6750 @ 2.67 GHz and a RAM memory of 4 GB. This PC has installed Windows 7 Ultimate 2009, SP1. This machine was used for extracting the feature vectors of the original database. Machine 2: a PC with a processor Intel Core 2Duo E6750 @ 2.67 GHz and a RAM memory of 4GB. This PC has installed Windows 8.1 Professional 2013. This machine was used for extracting the feature vectors of the cropped databases and for making the comparisons of the full vs. 8x8 mm2 and some of the full vs. 12x12 mm2 feature vectors. Machine 3: a laptop with a processor Intel Core i7-5500U @ 2’40 GHz and a RAM memory of 8 GB. This PC has installed Windows 8.1 Professional 2013. This machine was used making the comparisons of the full vs. 10x10 mm2 and some of the full vs. 12x12 mm2 feature vectors. PUBLIC REPORT Code: IDTL-FDC-01 Revision: 1.1 Date: 11/05/2015 Page 69 / 139 PERFORMANCE ANALISIS FULL SIZE VS. CROPPED IMAGES Enrolment results Time measurements to obtain biometric references for UPK using NBIS algorithm are the following: Arithmetic mean: 320.32 ms Standard deviation: ± 135.64 ms Minimum: 160 ms Maximum: 2,770 ms Acquisition results Table 37 shows the time in milliseconds that takes to obtain the biometric probes for the images captured with each fingerprint sensor respectively. Table 37. Throughput rates results for acquisition using NBIS - UPK Acquisition UPK UPK_12x12 UPK_10x10 UPK_8x8 Arithmetic mean 31.68 ms 103.08 ms 86.77 ms 32.61 ms Standard deviation ± 48.87 ms ± 100.22 ms ± 133.44 ms ± 2.16 ms Minimum 0 ms 41 ms 27 ms 12 ms Maximum 1,182 ms 9,990 ms 12,732 ms 66 ms Number of acquisitions 34,012 33,720 33,718 33,689 Comparison results Next tables provided the time in milliseconds that takes to compare the biometric references to biometric probes for the images captured with each fingerprint sensor respectively. Specifically, Table 38 shows measurements obtained for mated comparisons and Table 38 for non-mated comparisons. Code: IDTL-FDC-01 Revision: 1.1 Date: 11/05/2015 Page 70 / 139 PUBLIC REPORT PERFORMANCE ANALISIS FULL SIZE VS. CROPPED IMAGES Table 38. Throughput rates results for mated comparisons using NBIS - UPK Mated comparisons UPK UPK_12x12 UPK_10x10 UPK_8x8 Arithmetic mean 31.68 ms 18.47 ms 2.51 ms 0.187 ms Standard deviation ± 48.87 ms ± 37.64 ms ± 10.74 ms ± 1.781 ms Minimum 0 ms 0 ms 0 ms 0 ms Maximum 1,182 ms 634 ms 917 ms 189 ms Number of comparisons 34,012 33,720 33,718 33,689 Table 39. Throughput rates results for non-mated comparisons using NBIS UPK Nonmated comparisons UPK UPK_12x12 UPK_10x10 UPK_8x8 Arithmetic mean 3.97 ms 2.59 ms 0.48 ms 0.072 ms Standard deviation ± 11.4 ms ± 8.95 ms ± 2.54 ms ± 0.39 ms Minimum 0 ms 0 ms 0 ms 0 ms Maximum 1,256 ms 8,103 ms 1,135 ms 332 ms Number of comparisons 105,947,381 102,799,756 102,793,524 102,703,182 PUBLIC REPORT Code: IDTL-FDC-01 Revision: 1.1 Date: 11/05/2015 Page 71 / 139 PERFORMANCE ANALISIS FULL SIZE VS. CROPPED IMAGES PERFORMANCE RESULTS FOR NEUROTECHNOLOGY Performance results for Neurotechnology - NXT 9.3.1.1. Error rates for Neurotechnology – NXT Enrolment and acquisition results For enrolment, results are similar to those obtained for the original database (See section 6.2.1.1). A total 3,230 correct templates have been generated and 304 FTE errors have happened. Therefore, the FTE rate for NXT sensor using Neurotechnology algorithm has been 8.60 %. FTP errors that have happened correspond to those errors to generate the features vector from the cropped images. These error are given in Table 40. Table 40. FTP errors for Neurotechnology - NXT NXT_12x12 NXT_10x10 NXT_8x8 Number of correct samples 39,326 30,079 11,651 FTP errors 4,303 13,550 31,978 Total number of acquisition attempts 43,629 43,629 43,629 FTP rate 9.86 % 31.06 % 73.29 % Comparison results Comparisons results are provided in the following subsections. The number of comparisons used to obtain these metrics per each fingerprint sensors are given in Table 41. Code: IDTL-FDC-01 Revision: 1.1 Date: 11/05/2015 Page 72 / 139 PUBLIC REPORT PERFORMANCE ANALISIS FULL SIZE VS. CROPPED IMAGES Table 41. Number of comparisons conducted using Neurotechnology - NXT NXT NXT_12x12 NXT_10x10 NXT_8x8 Mated comparisons 43,262 39,315 30,077 11,650 Non-mated comparisons 139,680,082 126,983,665 97,125,093 37,621,080 DET curves Figure 42. DET curves for the fingerprint sensors using Neurotechnology - NXT PUBLIC REPORT Code: IDTL-FDC-01 Revision: 1.1 Date: 11/05/2015 Page 73 / 139 PERFORMANCE ANALISIS FULL SIZE VS. CROPPED IMAGES ROC curves Figure 43. ROC Curves using Neurotechnology – NXT Additional rates In addition to previous sections, Table 42 provides relevant error rates for the different sensors. Table 42. Additional error rates for Neurotechnology - NXT Error rate NXT NXT_12x12 NXT_10x10 NXT_8x8 EER 0.0639 % 1.47 % 2.85 % 5.97 % <0.01% 1.51 % 3.15 % 6.91 % <0.01%* 2.14 % 4.17 % 8.74 % 0.628 % 3.17 % 5.89 % 11.43 % FMR100 (the lowest FNMR for FMR<=1%) FMR1000 (the lowest FNMR for FMR<=0.1%) FMR10000 (the lowest FNMR for FMR<=0.01%) The lack of precisión in providing this rate is due to the sample rejection by the automatic ground truth checking mechanism during the capturing process. PUBLIC REPORT Code: IDTL-FDC-01 Revision: 1.1 Date: 11/05/2015 Page 74 / 139 PERFORMANCE ANALISIS FULL SIZE VS. CROPPED IMAGES 9.3.1.2. Throughput rates for Neurotechnology - NXT This subsection shows throughput rates for the processes that have been conducted during the evaluation considering the Neurotechnology algorithm and the NXT fingerprint sensor. The application used to process and compare fingerprint images has been developed using Microsoft Visual Studio, .NET framework 4.5 and C# 32 bits. Moreover, time measurements for the different processes have been calculated using different machines: Machine 1: a laptop with a processor Intel core i7-3517U @ 1.9 GHz (up to 2.4GHz) and a RAM memory of 4GB. This PC has installed Windows 8.1 Professional 2013. This machine was used for extracting the feature vectors of the original database and the 8x8 and 12x12 mm2 cropped databases. Also, it was used for making the comparisons of the original database and the full vs. 12x12 mm2 feature vectors. Machine 2: a laptop with a processor Intel Core i7-5500U @ 2’40 GHz and a RAM memory of 8 GB. This PC has installed Windows 8.1 Professional 2013. This machine was used for extracting the feature vectors of the 10x10 mm2 database and for making the comparisons of the full vs. 10x10 mm2 feature vectors. Machine 3: a PC with a processor Intel Core i7-4790 @ 3.60 GHz and a RAM memory of 12GB. This PC has installed Windows 8.1, 2013. This machine was used for making the comparisons of the full vs. 8x8 mm2 feature vectors. Enrolment results Time measurements to obtain biometric references for NXT using Neurotechnology algorithm are the following: Arithmetic mean: 2,219 ms Standard deviation: ±94.28 ms Minimum: 521 ms Maximum: 4,452 ms Acquisition results Table 43 shows the time in milliseconds that takes to obtain the biometric probes for the images captured with each fingerprint sensor respectively. Code: IDTL-FDC-01 Revision: 1.1 Date: 11/05/2015 Page 75 / 139 PUBLIC REPORT PERFORMANCE ANALISIS FULL SIZE VS. CROPPED IMAGES Table 43. Throughput rates results for acquisition using Neurotechnology - NXT Acquisition NXT NXT_12x12 NXT_10x10 NXT_8x8 Arithmetic mean 1,101 ms 1,449 ms 1,106 ms 1,603 ms Standard deviation ± 66.75 ms ± 516.97 ms ± 16.60 ms ± 551.99 ms Minimum 78 ms 119 ms 52 ms 410 ms Maximum 1416 ms 2,513 ms 1,220 ms 2,355 ms Number of acquisitions 46,431 39,326 30,079 11,651 Comparison results Next tables provided the time in milliseconds that takes to compare the biometric references to biometric probes for the images captured with each fingerprint sensor respectively. Specifically, Table 44 shows measurements obtained for mated comparisons and Table 45 for non-mated comparisons. Table 44. Throughput rates results for mated comparisons using Neurotechnology NXT Mated comparisons NXT NXT_12x12 NXT_10x10 NXT_8x8 Arithmetic mean 2.17 ms 1.41 ms 1.04 ms 0.09 ms Standard deviation ± 1.81 ms ± 0.79 ms ± 4.13 ms ± 0.30 ms Minimum 0 ms 0 ms 0 ms 0 ms Maximum 20 ms 10 ms 228 ms 11 ms Number of comparisons 43,262 39,315 30,077 11,650 Code: IDTL-FDC-01 Revision: 1.1 Date: 11/05/2015 Page 76 / 139 PUBLIC REPORT PERFORMANCE ANALISIS FULL SIZE VS. CROPPED IMAGES Table 45. Throughput rates results for non-mated comparisons using Neurotechnology - NXT Nonmated comparisons NXT NXT_12x12 NXT_10x10 NXT_8x8 Arithmetic mean 2.20 ms 1.20 ms 0.83 ms 0.019 ms Standard deviation ± 1.96 ms ± 0.66 ms ± 3.65 ms ± 0.32 ms Minimum 0 ms 0 ms 0 ms 0 ms Maximum 23,96 ms 24 ms 412 ms 11 ms Number of comparisons 139,680,082 126,983,665 97,125,093 37,621,080 Code: IDTL-FDC-01 Revision: 1.1 Date: 11/05/2015 Page 77 / 139 PUBLIC REPORT PERFORMANCE ANALISIS FULL SIZE VS. CROPPED IMAGES Performance results for Neurotechnology - FPC 9.3.2.1. Error rates for Neurotechnology - FPC Enrolment and acquisition results For enrolment, results are similar to those obtained for the original database (See section 6.2.1.1). A total 2,903 correct templates have been generated and 631 FTE errors have happened. Therefore, the FTE rate for FPC sensor using Neurotechnology algorithm has been 17.85 %. FTP errors that have happened correspond to those errors to generate the features vector from the cropped images. These error are given in Table 46. Table 46. FTP errors for Neurotechnology - FPC FPC _12x12 FPC _10x10 FPC _8x8 Number of correct samples 37,017 37,017 3,7017 FTP errors 0 0 0 Total number of acquisition attempts 37,017 37,017 37,017 FTP rate 0% 0% 0% Comparison results Comparisons results are provided in the following subsections. The number of comparisons used to obtain these metrics per each fingerprint sensors are given in Table 47. Table 47. Number of comparisons conducted using Neurotechnology - FPC FPC FPC_12x12 FPC_10x10 FPC_8x8 Mated comparisons 37,128 36,733 36,571 36,733 Non-mated comparisons 107,742,554 107,423,618 107,000,449 107,423,618 PUBLIC REPORT Code: IDTL-FDC-01 Revision: 1.1 Date: 11/05/2015 Page 78 / 139 PERFORMANCE ANALISIS FULL SIZE VS. CROPPED IMAGES DET curves Figure 44. DET curves for the fingerprint sensors using Neurotechnology – FPC ROC curves Figure 45. ROC Curves using Neurotechnology – FPC PUBLIC REPORT Code: IDTL-FDC-01 Revision: 1.1 Date: 11/05/2015 Page 79 / 139 PERFORMANCE ANALISIS FULL SIZE VS. CROPPED IMAGES Additional rates In addition to previous sections, Table 48 provides relevant error rates for the different sensors. Table 48. Additional error rates for Neurotechnology - FPC Error rate FPC FPC_12x12 FPC_10x10 FPC_8x8 EER 0.0925 % 1.96 % 2.80 % 16.04 % <0.01% 2.04 % 2.97 % 19.53 % <0.01%* 2.61 % 3.53 % 22.67 % 1.54 % 3.95 % 4.75 % 27.03 % FMR100 (the lowest FNMR for FMR<=1%) FMR1000 (the lowest FNMR for FMR<=0.1%) FMR10000 (the lowest FNMR for FMR<=0.01%) 9.3.2.2. Throughput rates for Neurotechnology - FPC This subsection shows throughput rates for the processes that have been conducted during the evaluation considering the NBIS algorithm and the FPC fingerprint sensor. The application used to process and compare fingerprint images has been developed using Microsoft Visual Studio, .NET framework 4.5 and C# 32 bits. Moreover, time measurements for the different processes have been calculated using different machines: Machine 1: a PC with a processor Intel Core 2Duo E8500 @ 3.16 GHz and a RAM memory of 4 GB. This PC has installed Windows 7 Professional 2009, SP1. This machine was used for extracting the features vectors and for making some comparisons of the original database. Machine 2: a laptop with a processor Intel core i7-3517U @ 1.9 GHz and a RAM memory of 4 GB. This PC has installed Windows 8.1 Professional 2013. This machine was used for making the rest of comparisons of the original database. The lack of precisión in providing this rate is due to the sample rejection by the automatic ground truth checking mechanism during the capturing process. Code: IDTL-FDC-01 Revision: 1.1 Date: 11/05/2015 Page 80 / 139 PUBLIC REPORT PERFORMANCE ANALISIS FULL SIZE VS. CROPPED IMAGES Machine 3: a laptop with a processor Intel Core i7-5500U @ 2’40 GHz and a RAM memory of 8 GB. This PC has installed Windows 8.1 Professional 2013. This machine was used for extracting the feature vectors of the all cropped databases and for making comparisons of the full vs. 8x8 mm2 and the full vs. 10x10 mm2 feature vectors. Machine 4: a PC with a processor Intel Core i7-4790 @ 3.60 GHz and a RAM memory of 12 GB. This PC has installed Windows 8.1, 2013. This machine was used for making the comparisons of the full vs. 12x12 mm2 feature vectors. Enrolment results Time measurements to obtain biometric references for FPC using Neurotechnology algorithm are the following: Arithmetic mean: 2,200 ms Standard deviation: ±136.25 ms Minimum: 230 ms Maximum: 4,463 ms Acquisition results Table 49 shows the time in milliseconds that takes to obtain the biometric probes for the images captured with each fingerprint sensor respectively. Table 49. Throughput rates results for acquisition using Neurotechnology - FPC Acquisition FPC FPC_12x12 FPC_10x10 FPC_8x8 Arithmetic mean 1,043 ms 3,325 ms 3,325 ms 3,274 ms Standard deviation ± 36.12 ms ± 13.29 ms ± 39.61 ms ± 334.6 ms Minimum 239 ms 3,202 ms 2,194 ms 1,080 ms Maximum 1,187 ms 3,410 ms 3,394 ms 3,395 ms Number of acquisitions 43,168 37,017 370,17 37,017 Code: IDTL-FDC-01 Revision: 1.1 Date: 11/05/2015 Page 81 / 139 PUBLIC REPORT PERFORMANCE ANALISIS FULL SIZE VS. CROPPED IMAGES Comparison results Next tables provided the time in milliseconds that takes to compare the biometric references to biometric probes for the images captured with each fingerprint sensor respectively. Specifically, Table 50 shows measurements obtained for mated comparisons and Table 51 for non-mated comparisons. Table 50. Throughput rates results for mated comparisons using Neurotechnology FPC Mated comparisons FPC FPC_12x12 FPC_10x10 FPC_8x8 Arithmetic mean 1.07 ms 0.14 ms 0.85 ms 0.25 ms Standard deviation ± 1.157 ms ±1.147 ms ± 0.73 ms ± 4.08 ms Minimum 0 ms 0 ms 0 ms 0 ms Maximum 32 ms 210 ms 39 ms 294 ms Number of comparisons 37,128 36,733 36,571 36,733 Table 51. Throughput rates results for Non-mated comparisons using Neurotechnology - FPC Nonmated comparisons FPC FPC_12x12 FPC_10x10 FPC_8x8 Arithmetic mean 0.86 ms 0.036 ms 0.73 ms 0.19 ms Standard deviation ± 0.55 ms ± 0.55 ms ± 0.80 ms ± 4.61 ms Minimum 0 ms 0 ms 0 ms 0 ms Maximum 70 ms 1,142 ms 869 ms 1,429 ms Number of comparisons 107,742,554 107,423,618 107,000,449 107,423,618 Code: IDTL-FDC-01 Revision: 1.1 Date: 11/05/2015 Page 82 / 139 PUBLIC REPORT PERFORMANCE ANALISIS FULL SIZE VS. CROPPED IMAGES Performance results for Neurotechnology - UPK 9.3.3.1. Error rates for Neurotechnology - UPK Enrolment and acquisition results For enrolment, results are similar to those obtained for the original database (See section 6.2.1.1). A total 3,131 correct templates have been generated and 403 FTE errors have happened. Therefore, the FTE rate for UPK sensor using Neurotechnology algorithm has been 11.40 %. FTP errors that have happened correspond to those errors to generate the features vector from the cropped images. These error are given in Table 52. Table 52. FTP errors for Neurotechnology – UPK UPK _12x12 UPK _10x10 UPK _8x8 Number of correct samples 33,861 36,211 11,537 FTP errors 2,350 0 24,674 Total number of acquisition attempts 36,211 36,211 36,211 FTP rate 6.49 % 0.00 % 68.14 % Comparison results Comparisons results are provided in the following subsections. The number of comparisons used to obtain these metrics per each fingerprint sensors are given in Table 53. Table 53. Number of comparisons conducted using Neurotechnology - UPK UPK UPK_12x12 UPK_10x10 UPK_8x8 Mated comparisons 40,032 31,828 34,023 10,772 Non-mated comparisons 125,118,621 105,986,963 113,687,507 36,111,575 PUBLIC REPORT Code: IDTL-FDC-01 Revision: 1.1 Date: 11/05/2015 Page 83 / 139 PERFORMANCE ANALISIS FULL SIZE VS. CROPPED IMAGES DET curves Figure 46. DET curves for the fingerprint sensors using Neurotechnology – UPK ROC curves Figure 47. ROC Curves using Neurotechnology – UPK PUBLIC REPORT Code: IDTL-FDC-01 Revision: 1.1 Date: 11/05/2015 Page 84 / 139 PERFORMANCE ANALISIS FULL SIZE VS. CROPPED IMAGES Additional rates In addition to previous sections, Table 54 provides relevant error rates for the different sensors. Table 54. Additional error rates for Neurotechnology - UPK Error rate UPK UPK_12x12 UPK_10x10 UPK_8x8 EER 0.0616% 0.90 % 3.70 % 4.48 % <0.01% 0.86 % 4.06 % 5.106 % <0.01%* 1.16 % 5.09 % 6.32 % 0.42 % 1.58 % 6.72 % 8.31 % FMR100 (the lowest FNMR for FMR<=1%) FMR1000 (the lowest FNMR for FMR<=0.1%) FMR10000 (the lowest FNMR for FMR<=0.01%) 9.3.3.2. Throughput rates for Neurotechnology - UPK This subsection shows throughput rates for the processes that have been conducted during the evaluation considering the NBIS algorithm and the UPK fingerprint sensor. The application used to process and compare fingerprint images has been developed using Microsoft Visual Studio, .NET framework 4.5 and C# 32 bits. Moreover, time measurements for the different processes have been calculated using different machines: Machine 1: a PC with a processor Intel Core 2Duo E6750@ 2.66 GHz and a RAM memory of 4 GB. This PC has installed Windows 7 Ultimate, 2009. This machine was used for extracting the feature vectors and making comparisons of the original database. Also, it was used extracting the feature vectors of the 8x8 mm2 database and for making comparisons of the full vs. 8x8 mm2 and some of the full vs. 10x10 mm2 feature vectors. Machine 2: a PC with a processor Intel Core i7-4790 @ 3.60 GHz and a RAM memory of 12 GB. This PC has installed Windows 8.1, 2013. This machine was used for extracting the feature vectors of the 10x10 mm2 and 12x12 mm2 cropped databases and for making comparisons of the full vs. 12x2 mm2 feature vectors. The lack of precisión in providing this rate is due to the sample rejection by the automatic ground truth checking mechanism during the capturing process. PUBLIC REPORT Code: IDTL-FDC-01 Revision: 1.1 Date: 11/05/2015 Page 85 / 139 PERFORMANCE ANALISIS FULL SIZE VS. CROPPED IMAGES Machine 3: a laptop with a processor Intel core i7-3517U @ 1.9 GHz and a RAM memory of 4 GB. This PC has installed Windows 8.1 Professional 2013. This machine was used for making the rest of comparisons of the full vs. 10x10 mm2 feature vectors. Enrolment results Time measurements to obtain biometric references for UPK using Neurotechnology algorithm are the following: Arithmetic mean: 2,215 ms Standard deviation: ± 56.04 ms Minimum: 778 ms Maximum: 3,340 ms Acquisition results Table 55 shows the time in milliseconds that takes to obtain the biometric probes for the images captured with each fingerprint sensor respectively. Table 55. Throughput rates results for acquisition using Neurotechnology - UPK Acquisition UPK UPK_12x12 UPK_10x10 UPK_8x8 Arithmetic mean 1,090 ms 1,105 ms 1,106 ms 1,102 ms Standard deviation ± 84.04 ms ± 13.01 ms ± 9.76 ms ± 26.37 ms Minimum 165 ms 885 ms 615 ms 60 ms Maximum 1,530 ms 1,153 ms 1,143 ms 1,261 ms Number of acquisitions 44,531 33,861 36,211 11,537 Comparison results Next tables provided the time in milliseconds that takes to compare the biometric references to biometric probes for the images captured with each fingerprint sensor respectively. Specifically, Table 56 shows measurements obtained for mated comparisons and Table 57 for non-mated comparisons. Code: IDTL-FDC-01 Revision: 1.1 Date: 11/05/2015 Page 86 / 139 PUBLIC REPORT PERFORMANCE ANALISIS FULL SIZE VS. CROPPED IMAGES Table 56. Throughput rates results for mated comparisons using Neurotechnology UPK Mated comparisons UPK UPK_12x12 UPK_10x10 UPK_8x8 Arithmetic mean 2.00 ms 0.36 ms 0.87 ms 0.89 ms Standard deviation ± 1.65 ms ± 0.5 ms ± 1.52 ms ± 0.527 ms Minimum 0 ms 0 ms 0 ms 0 ms Maximum 95 ms 17 ms 198 ms 26 ms Number of comparisons 125,118,621 31,828 34,023 10,772 Table 57. Throughput rates results for non-mated comparisons using Neurotechnology - UPK Nonmated comparisons UPK UPK_12x12 UPK_10x10 UPK_8x8 Arithmetic mean 2.00 ms 0.19 ms 0.73 ms 0.59 ms Standard deviation ± 1.65 ms ± 0.39 ms ± 1.51 ms ± 0.72 ms Minimum 0 ms 0 ms 0 ms 0 ms Maximum 95 ms 28 ms 2526 ms 785 ms Number of comparisons 125,118,621 105,986,963 113,687,507 36,111,575 PUBLIC REPORT Code: IDTL-FDC-01 Revision: 1.1 Date: 11/05/2015 Page 87 / 139 PART II-B PERFORMANCE ANALISIS REPORT CROPPED SIZES IMAGES vs. CROPPED SIZES IMAGES PUBLIC REPORT Code: IDTL-FDC-01 Revision: 1.1 Date: 11/05/2015 Page 88 / 139 PERFORMANCE ANALISIS CROPPED IMAGES VS. CROPPED IMAGES 10. PERFORMANCE ANALYSIS CROPPED VS. CROPPED IMAGES INTRODUCTION This section explains performance analysis results considering the different algorithms: NBIS and Neurotechnology. In particular, error rates and throughput rates will be shown. Regarding error rates, these metrics are given separately for enrolment (FTE error) and acquisition process (FTA error) and then, for the comparison process. For the comparison process the following curves will be shown: ROC curves for the three fingerprint sensors DET curves for the three fingerprint sensors Additional rates: EER, FMR100, FMR1000,FMR10000 In addition, the following curves will be provided in the annexes: Distribution curves per each fingerprint sensor FNMR vs. FMR curves per each fingerprint sensor In relation to throughput rates, the metrics that have been obtained have been the following: Enrolment time, which has been calculated considering the time that takes to obtain the biometric references. Acquisition time, which has been calculated considering the time that takes to obtain the biometric probes. Mated comparison time, which is the time that takes to compare a biometric probe to the biometric reference of the same user, same finger. Non-mated comparison time, which is the time that takes to compare a biometric probe to the biometric reference that do not belong of the same user. As in the case of the full-size vs. cropped comparisons, an important issue to consider is that the quality check and ground truth mechanism was applied in the full size database, and those images not concealing with those requirements have been discarded for the cropped images analysis. In other terms, this means that the ground truth mechanism is not applied again during this tests, and therefore, the FTA cases detected are additional to the ones of the full-size case. In order not to confuse the reader, we will consider Failure to Process (FTP) rates, instead of the FTA rates, knowing that the number of cases in a real scenario should be the sum of both the FTA and FTP cases. Code: IDTL-FDC-01 Revision: 1.1 Date: 11/05/2015 Page 89 / 139 PUBLIC REPORT PERFORMANCE ANALISIS CROPPED IMAGES VS. CROPPED IMAGES PERFORMANCE RESULTS FOR NBIS Performance results for NBIS - NXT Error rates for NBIS – NXT 10.2.1.1. Enrolment and acquisition results FTE and FTP errors that have happened for the different fingerprint sensors when for generating the biometric references and probes for later comparisons are given in Table 58 and Table 59. In this case, the algorithm applied for enrolling and acquiring the samples has been NBIS. Table 58. FTE errors for NBIS - NXT NXT NXT_12x12 NXT_10x10 NXT_8x8 Number of correct templates 3,217 2,558 914 62 FTE errors 317 976 2,620 3,472 Total number of enrolment transactions 3,534 3,534 3,534 3,534 FTE rate 8.97 % 27.61 % 74.13 % 98.24 % Table 59. FTP errors for NBIS - NXT NXT_12x12 NXT_10x10 NXT_8x8 Number of correct samples 27,073 9,714 655 FTP errors 0 1 13 Total number of acquisition attempts 27,073 9,715 668 FTP rate 0.00 % 0.01 % 1.94 % Code: IDTL-FDC-01 Revision: 1.1 Date: 11/05/2015 Page 90 / 139 PUBLIC REPORT PERFORMANCE ANALISIS CROPPED IMAGES VS. CROPPED IMAGES Comparison results Comparisons results are provided in the following subsections. The number of comparisons used to obtain these metrics per each fingerprint sensors are given in Table 60. Table 60. Number of comparisons conducted using NBIS - NXT NXT NXT_12x12 NXT_10x10 NXT_8x8 Mated comparisons 34,251 27,073 9,714 655 Non-mated comparisons 110,151,216 69,225,661 8,868,882 39,955 DET curves Figure 48. DET curves for the fingerprint sensors using NBIS – NXT Code: IDTL-FDC-01 Revision: 1.1 Date: 11/05/2015 Page 91 / 139 PUBLIC REPORT PERFORMANCE ANALISIS CROPPED IMAGES VS. CROPPED IMAGES ROC curves Figure 49. ROC Curves using NBIS – NXT Additional rates In addition to previous sections, Table 61 provides relevant error rates for the different sensors. Table 61. Additional error rates for NBIS - NXT Error rate NXT NXT_12x12 NXT_10x10 NXT_8x8 EER 3.88 % 18.89 % 31.62 % 47.17 % 19.21 % 49.60 % 67.10 % 81.22 % 43.99 69.48 % 80.57 % 90.07 % 62.01 % 81.87 % 89.20 % 96.33 % FMR100 (the lowest FNMR for FMR<=1%) FMR1000 (the lowest FNMR for FMR<=0.1%) FMR10000 (the lowest FNMR for FMR<=0.01%) Code: IDTL-FDC-01 Revision: 1.1 Date: 11/05/2015 Page 92 / 139 PUBLIC REPORT PERFORMANCE ANALISIS CROPPED IMAGES VS. CROPPED IMAGES 10.2.1.2. Throughput rates for NBIS - NXT This subsection shows throughput rates for the processes that have been conducted during the evaluation considering the NBIS algorithm and the NXT fingerprint sensor. The application used to process and compare fingerprint images has been developed using Microsoft Visual Studio, .NET framework 4.5 and C# 32 bits. Moreover, time measurements for the different processes have been calculated using different machines: Machine 1: a laptop with a processor Intel core i7-3517U @ 1.9 GHz (up to 2.4GHz) and a RAM memory of 4GB. This PC has installed Windows 8.1 Professional 2013. This machine was used for extracting the feature vectors and for making comparisons of the original database. Machine 2: a laptop with a processor Intel Core i7-5500U @ 2.40 GHz and a RAM memory of 8 GB. This PC has installed Windows 8.1 Professional 2013. This machine was used for extracting the feature vectors and for making comparisons of the cropped databases. Enrolment results Table 62 shows the time in milliseconds that takes to obtain the biometric references for the images captured with each fingerprint sensor respectively. Table 62. Throughput rates results for enrolment using NBIS - NXT Enrolment NXT NXT_12x12 NXT_10x10 NXT_8x8 Arithmetic mean 169.60 ms 163.85 ms 85.29 ms 47.74 ms Standard deviation ± 99.41 ms ± 80.08 ms ± 35.38 ms ± 9.78 ms Minimum 69 ms 63 ms 46 ms 32 ms Maximum 1,594 ms 830 ms 437 ms 72 ms Number of enrolments 3,217 2,558 914 62 PUBLIC REPORT Code: IDTL-FDC-01 Revision: 1.1 Date: 11/05/2015 Page 93 / 139 PERFORMANCE ANALISIS CROPPED IMAGES VS. CROPPED IMAGES Acquisition results Table 63 shows the time in milliseconds that takes to obtain the biometric probes for the images captured with each fingerprint sensor respectively. Table 63. Throughput rates results for acquisition using NBIS - NXT Acquisition NXT NXT_12x12 NXT_10x10 NXT_8x8 Arithmetic mean 48.18 ms 37.48 ms 32.03 ms 19.72 ms Standard deviation ± 9.65 ms ± 9.16 ms ± 8.11 ms ± 5.11 ms Minimum 12 ms 14 ms 10 ms 6 ms Maximum 322 ms 79 ms 68 ms 45 ms Number of acquisitions 47,729 33,494 33,507 33,495 Comparison results Next tables provided the time in milliseconds that takes to compare the biometric references to biometric probes for the images captured with each fingerprint sensor respectively. Specifically, Table 64shows measurements obtained for mated comparisons and Table 65 Table 65 for non-mated comparisons. Code: IDTL-FDC-01 Revision: 1.1 Date: 11/05/2015 Page 94 / 139 PUBLIC REPORT PERFORMANCE ANALISIS CROPPED IMAGES VS. CROPPED IMAGES Table 64. Throughput rates results for mated comparisons using NBIS - NXT Mated comparisons NXT NXT_12x12 NXT_10x10 NXT_8x8 Arithmetic mean 33.67 ms 21.56 ms 3.27 ms 0.126 ms Standard deviation ± 48.15 ms ± 40.12 ms ± 13.36 ms ± 1.26 ms Minimum 0 ms 0 ms 0 ms 0 ms Maximum 801 ms 997 ms 199 ms 28 ms Number of comparisons 34,251 27,073 9,714 655 Table 65. Throughput rates results for non-mated comparisons using NBIS NXT Nonmated comparisons NXT NXT_12x12 NXT_10x10 NXT_8x8 Arithmetic mean 2.92 ms 2.97 ms 0.30 ms 0.004 ms Standard deviation ± 9.11 ms ± 10.35 ms ± 2.93 ms ± 0.11 ms Minimum 0 ms 0 ms 0 ms 0 ms Maximum 1,213 ms 2,274 ms 469 ms 28 ms Number of comparisons 110,151,216 69,225,661 8,868,882 39,955 Code: IDTL-FDC-01 Revision: 1.1 Date: 11/05/2015 Page 95 / 139 PUBLIC REPORT PERFORMANCE ANALISIS CROPPED IMAGES VS. CROPPED IMAGES Performance results for NBIS - FPC 10.2.2.1. Error rates for NBIS - FPC Enrolment and acquisition results FTE and FTP errors that have happened for the different fingerprint sensors when for generating the biometric references and probes for later comparisons are given in Table 66 and Table 67. These errors may happen due to the enrolment and capturing processes have not been successfully completed. In this case, the algorithm applied for enrolling and acquiring the samples has been NBIS. Table 66. FTE errors for NBIS - FPC FPC FPC_12x12 FPC_10x10 FPC_8x8 Number of correct templates 2,826 1,119 11,79 191 FTE errors 708 2,415 2,355 3,343 Total number of enrolment transactions 3,534 3,534 3,534 3,534 FTE rate 20.03 % 68.33 % 66.64 % 94.59 % Table 67. FTP errors for NBIS - FPC FPC_12x12 FPC_10x10 FPC_8x8 Number of correct samples 22,408 11,397 1,940 FTP errors 0 0 1 Total number of acquisition attempts 22,408 11,397 1,941 FTP rate 0.00 % 0.00 % 0.051 % Code: IDTL-FDC-01 Revision: 1.1 Date: 11/05/2015 Page 96 / 139 PUBLIC REPORT PERFORMANCE ANALISIS CROPPED IMAGES VS. CROPPED IMAGES Comparison results Comparisons results are provided in the following subsections. The number of comparisons used to obtain these metrics per each fingerprint sensors are given in Table 68. Table 68. Number of comparisons conducted using NBIS - FPC FPC FPC_12x12 FPC_10x10 FPC_8x8 Mated comparisons 26,333 22,408 11,397 1,940 Non-mated comparisons 74,390,725 54,092,912 13,425,666 368,600 DET curves Figure 50. DET curves for the fingerprint sensors using NBIS – FPC Code: IDTL-FDC-01 Revision: 1.1 Date: 11/05/2015 Page 97 / 139 PUBLIC REPORT PERFORMANCE ANALISIS CROPPED IMAGES VS. CROPPED IMAGES ROC curves Figure 51. ROC Curves using NBIS – FPC Additional rates In addition to previous sections, Table 69 provides relevant error rates for the different sensors. Table 69. Additional error rates for NBIS - FPC Error rate FPC FPC_12x12 FPC_10x10 FPC_8x8 EER 0.60 % 7.79 % 19.02 % 27.82 % <0.01% 19.70 % 40.95 % 53.35 % 15.62 % 37.38 % 59.53 % 70.92 % 37.67 % 54.19 % 75.18 % 87.47 % FMR100 (the lowest FNMR for FMR<=1%) FMR1000 (the lowest FNMR for FMR<=0.1%) FMR10000 (the lowest FNMR for FMR<=0.01%) The lack of precisión in providing this rate is due to the sample rejection by the automatic ground truth checking mechanism during the capturing process. Code: IDTL-FDC-01 Revision: 1.1 Date: 11/05/2015 Page 98 / 139 PUBLIC REPORT PERFORMANCE ANALISIS CROPPED IMAGES VS. CROPPED IMAGES 10.2.2.2. Throughput rates for NBIS - FPC This subsection shows throughput rates for the processes that have been conducted during the evaluation considering the NBIS algorithm and the FPC fingerprint sensor. The application used to process and compare fingerprint images has been developed using Microsoft Visual Studio, .NET framework 4.5 and C# 32 bits. Moreover, time measurements for the different processes have been calculated using different machines: Machine 1: a PC with a processor Intel Core 2 Duo E8500 @ 3.16 GHz and a RAM memory of 4GB. This PC has installed Windows 7 Professional 2009, SP1. This machine was used for extracting the feature vectors and for making comparisons of the original database. Machine 2: a laptop with a processor Intel Core i7-5500U @ 2.40 GHz and a RAM memory of 8 GB. This PC has installed Windows 8.1 Professional 2013. This machine was used for extracting the feature vectors and for making comparisons of the cropped databases. Enrolment results Table 70 shows the time in milliseconds that takes to obtain the biometric references for the images captured with each fingerprint sensor respectively. Table 70. Throughput rates results for enrolment using NBIS - FPC Enrolment FPC FPC_12x12 FPC_10x10 FPC_8x8 Arithmetic mean 149.83 ms 113.17 ms 91.31 ms 62.75 ms Standard deviation ± 53.84 ms ± 42.84 ms ± 25.40 ms ± 11.55 ms Minimum 98 ms 63 ms 51 ms 41 ms Maximum 584 ms 546 ms 384 ms 126 ms Number of enrolments 2,826 2,415 1,179 191 PUBLIC REPORT Code: IDTL-FDC-01 Revision: 1.1 Date: 11/05/2015 Page 99 / 139 PERFORMANCE ANALISIS CROPPED IMAGES VS. CROPPED IMAGES Acquisition results The following table shows the time in milliseconds that takes to obtain the biometric probes for the images captured with each fingerprint sensor respectively. Table 71. Throughput rates results for acquisition using NBIS - FPC Acquisition FPC FPC_12x12 FPC_10x10 FPC_8x8 Arithmetic mean 52.73 ms 43.88 ms 38.92 ms 29.07 ms Standard deviation ± 5.08 ms ± 6.78 ms ± 6.26 ms ± 3.82 ms Minimum 26 ms 29 ms 22 ms 16 ms Maximum 96 ms 71 ms 62 ms 49 ms Number of acquisitions 44,119 25,512 22,512 22,511 Comparison results Next tables provided the time in milliseconds that takes to compare the biometric references to biometric probes for the images captured with each fingerprint sensor respectively. Specifically, Table 72 shows measurements obtained for mated comparisons and Table 73 for non-mated comparisons. Code: IDTL-FDC-01 Revision: 1.1 Date: 11/05/2015 Page 100 / 139 PUBLIC REPORT PERFORMANCE ANALISIS CROPPED IMAGES VS. CROPPED IMAGES Table 72. Throughput rates results for mated comparisons using NBIS - FPC Mated comparisons FPC FPC_12x12 FPC_10x10 FPC_8x8 Arithmetic mean 11.69 ms 7.01 ms 1.93 ms 0.21 ms Standard deviation ± 26.31 ms ± 20.51 ms ± 9.88 ms ± 1.72 ms Minimum 0 ms 0 ms 0 ms 0 ms Maximum 412 ms 373 ms 330 ms 35 ms Number of comparisons 26,333 22,408 11,397 1,940 Table 73. Throughput rates results for non-mated comparisons using NBIS FPC Nonmated comparisons FPC FPC_12x12 FPC_10x10 FPC_8x8 Arithmetic mean 0.48 ms 0.29 ms 0.56 ms 0.002 ms Standard deviation ± 3.17 ms ± 2.43 ms ± 0.97 ms ± 0.13 ms Minimum 0 ms 0 ms 0 ms 0 ms Maximum 522 ms 582 ms 430 ms 29 ms Number of comparisons 74,390,725 54,092,912 13,425,666 368,600 Code: IDTL-FDC-01 Revision: 1.1 Date: 11/05/2015 Page 101 / 139 PUBLIC REPORT PERFORMANCE ANALISIS CROPPED IMAGES VS. CROPPED IMAGES Performance results for NBIS - UPK 10.2.3.1. Error rates for NBIS - UPK Enrolment and acquisition results FTE and FTP errors that have happened for the different fingerprint sensors when for generating the biometric references and probes for later comparisons are given in Table 74 and Table 75. In this case, the algorithm applied for enrolling and acquiring the samples has been NBIS. Table 74. FTE errors for NBIS - UPK UPK UPK _12x12 UPK _10x10 UPK _8x8 Number of correct templates 3,116 2334 852 56 FTE errors 418 1200 2,682 3,478 Total number of enrolment transactions 3,534 3,534 3,534 3,534 FTE rate 11.82 % 33.95 % 75.89 % 98.41 % Table 75. FTP errors for NBIS – UPK UPK _12x12 UPK _10x10 UPK _8x8 Number of correct samples 25,616 9,470 632 FTP errors 0 2 31 Total number of acquisition attempts 25,616 9,472 663 FTP rate 0.00 % 0.02 % 4.67 % Code: IDTL-FDC-01 Revision: 1.1 Date: 11/05/2015 Page 102 / 139 PUBLIC REPORT PERFORMANCE ANALISIS CROPPED IMAGES VS. CROPPED IMAGES Comparison results Comparisons results are provided in the following subsections. The number of comparisons used to obtain these metrics per each fingerprint sensors are given in Table 76. Table 76. Number of comparisons conducted using NBIS - UPK UPK UPK_12x12 UPK_10x10 UPK_8x8 Mated comparisons 34,012 25,616 9,470 632 Non-mated comparisons 105,947,381 59,762,128 8,058,970 34,760 DET curves Figure 52. DET curves for the fingerprint sensors using NBIS – UPK Code: IDTL-FDC-01 Revision: 1.1 Date: 11/05/2015 Page 103 / 139 PUBLIC REPORT PERFORMANCE ANALISIS CROPPED IMAGES VS. CROPPED IMAGES ROC curves Figure 53. ROC Curves using NBIS – UPK Additional rates In addition to previous sections, Table 77 provides relevant error rates for the different sensors. Table 77. Additional error rates for NBIS - UPK Error rate UPK UPK_12x12 UPK_10x10 UPK_8x8 EER 4.26 % 20.23 % 32.16 % 47.94 % 18.24 % 50 % 64.66 % 75.15 % 38.09 % 66.41 % 80.11 % 84.65 % 55.88 % 78.81 % 89.08 % 89.08 % FMR100 (the lowest FNMR for FMR<=1%) FMR1000 (the lowest FNMR for FMR<=0.1%) FMR10000 (the lowest FNMR for FMR<=0.01%) Code: IDTL-FDC-01 Revision: 1.1 Date: 11/05/2015 Page 104 / 139 PUBLIC REPORT PERFORMANCE ANALISIS CROPPED IMAGES VS. CROPPED IMAGES 10.2.3.2. Throughput rates for NBIS - UPK This subsection shows throughput rates for the processes that have been conducted during the evaluation considering the NBIS algorithm and the UPK fingerprint sensor. The application used to process and compare fingerprint images has been developed using Microsoft Visual Studio, .NET framework 4.5 and C# 32 bits. Moreover, time measurements for the different processes have been calculated using different machines: Machine 1: a PC with a processor Intel Core 2Duo E6750 @ 2.67 GHz and a RAM memory of 4 GB. This PC has installed Windows 7 Ultimate 2009, SP1. This machine was used for extracting the feature vectors and making comparisons of the original database. Machine 2: a PC with a processor Intel Core 2Duo E6750 @ 2.67 GHz and a RAM memory of 4 GB. This PC has installed Windows 8.1 Professional 2013. This machine was used for extracting the feature vectors and for making the comparisons of the cropped databases. Enrolment results Table 78 shows the time in milliseconds that takes to obtain the biometric references for the images captured with each fingerprint sensor respectively. Table 78. Throughput rates results for enrolment using NBIS - UPK Enrolment UPK UPK_12x12 UPK_10x10 UPK_8x8 Arithmetic mean 320.32 ms 349.13 ms 161.84 ms 78.07 ms Standard deviation ± 135.64 ms ± 510.80 ms ± 59.72 ms ± 14.14 ms Minimum 160 ms 121 ms 100 ms 67 ms Maximum 2,770 ms 16,870 ms 752 ms 153 ms Number of enrolments 3,116 2,334 852 56 PUBLIC REPORT Code: IDTL-FDC-01 Revision: 1.1 Date: 11/05/2015 Page 105 / 139 PERFORMANCE ANALISIS CROPPED IMAGES VS. CROPPED IMAGES Acquisition results Table 79 shows the time in milliseconds that takes to obtain the biometric probes for the images captured with each fingerprint sensor respectively. Table 79. Throughput rates results for acquisition using NBIS - UPK Acquisition UPK UPK_12x12 UPK_10x10 UPK_8x8 Arithmetic mean 184.24 ms 103.08 ms 86.77 ms 32.61 ms Standard deviation ± 96.02 ms ± 100.22 ms ± 133.44 ms ± 2.16 ms Minimum 92 ms 41 ms 27 ms 12 ms Maximum 1,262 ms 9,990 ms 12,732 ms 66 ms Number of acquisitions 43,340 36,211 36,209 36,180 Comparison results Next tables provided the time in milliseconds that takes to compare the biometric references to biometric probes for the images captured with each fingerprint sensor respectively. Specifically, Table 80 shows measurements obtained for mated comparisons and Table 81 for non-mated comparisons. Code: IDTL-FDC-01 Revision: 1.1 Date: 11/05/2015 Page 106 / 139 PUBLIC REPORT PERFORMANCE ANALISIS CROPPED IMAGES VS. CROPPED IMAGES Table 80. Throughput rates results for mated comparisons using NBIS - UPK Mated comparisons UPK UPK_12x12 UPK_10x10 UPK_8x8 Arithmetic mean 31.68 ms 22.17 ms 3.41 ms 0.106 ms Standard deviation ± 48.87 ms ± 45.37 ms ± 17.03 ms ± 1.198 ms Minimum 0 ms 0 ms 0 ms 0 ms Maximum 1,182 ms 782 ms 654 ms 26 ms Number of comparisons 34,012 25,616 9,470 632 Table 81. Throughput rates results for non-mated comparisons using NBIS UPK Nonmated comparisons UPK UPK_12x12 UPK_10x10 UPK_8x8 Arithmetic mean 3.97 ms 3.67 ms 0.44 ms 0.004 ms Standard deviation ± 11.4 ms ± 13.07 ms ± 5.25 ms ± 0.14 ms Minimum 0 ms 0 ms 0 ms 0 ms Maximum 1,256 ms 4,720 ms 4,750 ms 26 ms Number of comparisons 105,947,381 59,762,128 8,058,970 34,760 Code: IDTL-FDC-01 Revision: 1.1 Date: 11/05/2015 Page 107 / 139 PUBLIC REPORT PERFORMANCE ANALISIS CROPPED IMAGES VS. CROPPED IMAGES PERFORMANCE RESULTS FOR NEUROTECHNOLOGY Performance results for Neurotechnology - NXT Error rates for Neurotechnology – NXT 10.3.1.1. Enrolment and acquisition results FTE and FTP errors that have happened for the different fingerprint sensors when for generating the biometric references and probes for later comparisons are given in Table 82 and Table 83. In this case, the algorithm applied for enrolling and acquiring the samples has been Neurotechnology. Table 82. FTE errors for Neurotechnology - NXT NXT NXT_12x12 NXT_10x10 NXT_8x8 Number of correct templates 3,230 2,906 1,892 425 FTE errors 304 628 1642 3109 Total number of enrolment transactions 3,534 3,534 3,534 3,534 FTE rate 8.60 % 17.77 % 46.46 % 87.97 % Table 83. FTP errors for Neurotechnology - NXT NXT_12x12 NXT_10x10 NXT_8x8 Number of correct samples 36,097 19,837 2,653 FTP errors 4,303 13,550 31,978 Total number of acquisition attempts 40,400 33,387 34,631 FTP rate 10.65 % 40.58 % 92.34 % Code: IDTL-FDC-01 Revision: 1.1 Date: 11/05/2015 Page 108 / 139 PUBLIC REPORT PERFORMANCE ANALISIS CROPPED IMAGES VS. CROPPED IMAGES Comparison results Comparisons results are provided in the following subsections. The number of comparisons used to obtain these metrics per each fingerprint sensors are given in Table 84. Table 84. Number of comparisons conducted using Neurotechnology - NXT NXT NXT_12x12 NXT_10x10 NXT_8x8 Mated comparisons 43,262 36,097 19,837 2,653 Non-mated comparisons 139,680,082 104,861,785 37,511,767 1,124,872 DET curves Figure 54. DET curves for the fingerprint sensors using Neurotechnology - NXT PUBLIC REPORT Code: IDTL-FDC-01 Revision: 1.1 Date: 11/05/2015 Page 109 / 139 PERFORMANCE ANALISIS CROPPED IMAGES VS. CROPPED IMAGES ROC curves Figure 55. ROC Curves using Neurotechnology – NXT Additional rates In addition to previous sections, Table 85 provides relevant error rates for the different sensors. Table 85. Additional error rates for Neurotechnology - NXT Error rate NXT NXT_12x12 NXT_10x10 NXT_8x8 EER 0.0639 % 4.89 % 12.43 % 19.42 % <0.01% 5.63 % 15.75 % 27.25 % <0.01%* 7.09 % 19.23 % 32.07 % 0.628 % 9.04 % 22.99 % 38.44 % FMR100 (the lowest FNMR for FMR<=1%) FMR1000 (the lowest FNMR for FMR<=0.1%) FMR10000 (the lowest FNMR for FMR<=0.01%) The lack of precisión in providing this rate is due to the sample rejection by the automatic ground truth checking mechanism during the capturing process. PUBLIC REPORT Code: IDTL-FDC-01 Revision: 1.1 Date: 11/05/2015 Page 110 / 139 PERFORMANCE ANALISIS CROPPED IMAGES VS. CROPPED IMAGES 10.3.1.2. Throughput rates for Neurotechnology - NXT This subsection shows throughput rates for the processes that have been conducted during the evaluation considering the Neurotechnology algorithm and the NXT fingerprint sensor. The application used to process and compare fingerprint images has been developed using Microsoft Visual Studio, .NET framework 4.5 and C# 32 bits. Moreover, time measurements for the different processes have been calculated using different machines: Machine 1: a laptop with a processor Intel core i7-3517U @ 1.9 GHz (up to 2.4 GHz) and a RAM memory of 4GB. This PC has installed Windows 8.1 Professional 2013. This machine was used for extracting the feature vectors of the original database the 8x8 and 12x12 mm2 databases. Also, it was used for making the comparisons of the original database and the 12x12 vs. 12x12 mm2 feature vectors. Machine 2: a laptop with a processor Intel Core i7-5500U @ 2’40 GHz and a RAM memory of 8 GB. This PC has installed Windows 8.1 Professional 2013. This machine was used for extracting the feature vectors of the 10x10 mm2 database and for making the comparisons of the 10x10 vs. 10x10 mm2 feature vectors. Machine 3: a PC with a processor Intel Core i7-4790 @ 3.60 GHz and a RAM memory of 12 GB. This PC has installed Windows 8.1, 2013. This machine was used for making the comparisons of the 8x8 vs. 8x8 mm2 feature vectors. Enrolment results Table 86 shows the time in milliseconds that takes to obtain the biometric references for the images captured with each fingerprint sensor respectively. Code: IDTL-FDC-01 Revision: 1.1 Date: 11/05/2015 Page 111 / 139 PUBLIC REPORT PERFORMANCE ANALISIS CROPPED IMAGES VS. CROPPED IMAGES Table 86. Throughput rates results for enrolment using Neurotechnology - NXT Enrolment NXT NXT_12x12 NXT_10x10 NXT_8x8 Arithmetic mean 2,219 ms 4,461 ms 2,235 ms 2,236 ms Standard deviation ± 1101 ms ± 249.85 ms ± 172.60 ms ± 170.56 ms Minimum 521 ms 4197 ms 208 ms 1,058 ms Maximum 4,452 ms 9,029 ms 4,452 ms 4,435 ms Number of enrolments 3,230 2,906 1,892 425 Acquisition results Table 87 shows the time in milliseconds that takes to obtain the biometric probes for the images captured with each fingerprint sensor respectively. Table 87. Throughput rates results for acquisition using Neurotechnology - NXT Acquisition NXT NXT_12x12 NXT_10x10 NXT_8x8 Arithmetic mean 1,101 ms 1,449 ms 1,106 ms 1,603 ms Standard deviation ± 66.75 ms ± 516.97 ms ± 16.60 ms ± 551.99 ms Minimum 78 ms 119 ms 52 ms 410 ms Maximum 1,416 ms 2,513 ms 1,220 ms 2,355 ms Number of acquisitions 46,431 39,32 30,079 11,651 Code: IDTL-FDC-01 Revision: 1.1 Date: 11/05/2015 Page 112 / 139 PUBLIC REPORT PERFORMANCE ANALISIS CROPPED IMAGES VS. CROPPED IMAGES Comparison results Next tables provided the time in milliseconds that takes to compare the biometric references to biometric probes for the images captured with each fingerprint sensor respectively. Specifically, Table 88 shows measurements obtained for mated comparisons and Table 89 for non-mated comparisons. Table 88. Throughput rates results for mated comparisons using Neurotechnology NXT Mated comparisons NXT NXT_12x12 NXT_10x10 NXT_8x8 Arithmetic mean 2.17 ms 0.99 ms 0.29 ms 0.0007 ms Standard deviation ± 1.81 ms ± 0.52 ms ± 0.48 ms ± 0.027 ms Minimum 0 ms 0 ms 0 ms 0 ms Maximum 20 ms 5 ms 14 ms 1 ms Number of comparisons 43,262 36,097 19,837 2,653 Table 89. Throughput rates results for non-mated comparisons using Neurotechnology - NXT Nonmated comparisons NXT NXT_12x12 NXT_10x10 NXT_8x8 Arithmetic mean 2.20 ms 0.84 ms 0.18 ms 0.001 ms Standard deviation ± 1.96 ms ± 0.46 ms ± 0.73 ms ± 0.04 ms Minimum 0 ms 0 ms 0 ms 0 ms Maximum 2,396 ms 17 ms 1157 ms 9 ms Number of comparisons 139,680,082 104,861,785 37,511,767 1,124,872 Code: IDTL-FDC-01 Revision: 1.1 Date: 11/05/2015 Page 113 / 139 PUBLIC REPORT PERFORMANCE ANALISIS CROPPED IMAGES VS. CROPPED IMAGES Performance results for Neurotechnology - FPC 10.3.2.1. Error rates for Neurotechnology - FPC Enrolment and acquisition results FTE and FTP errors that have happened for the different fingerprint sensors when for generating the biometric references and probes for later comparisons are given in Table 90 and Table 91. In this case, the algorithm applied for enrolling and acquiring the samples has been Neurotechnology. Table 90. FTE errors for Neurotechnology - FPC FPC FPC _12x12 FPC _10x10 FPC _8x8 Number of correct templates 2,903 2,911 2,735 1,251 FTE errors 631 623 799 1,089 Total number of enrolment transactions 3,534 3,534 3,534 3,534 FTE rate 17.85 % 17.63 % 22.61 % 30.81 % Table 91. FTP errors for Neurotechnology - FPC FPC _12x12 FPC _10x10 FPC _8x8 Number of correct samples 36,529 34,696 15,903 FTP errors 0 0 0 Total number of acquisition attempts 36,529 34,696 15,903 FTP rate 0.00 % 0.00 % 0.00 % Code: IDTL-FDC-01 Revision: 1.1 Date: 11/05/2015 Page 114 / 139 PUBLIC REPORT PERFORMANCE ANALISIS CROPPED IMAGES VS. CROPPED IMAGES Comparison results Comparisons results are provided in the following subsections. The number of comparisons used to obtain these metrics per each fingerprint sensors are given in Table 92. Table 92. Number of comparisons conducted using Neurotechnology - FPC FPC FPC_12x12 FPC_10x10 FPC_8x8 Mated comparisons 37,128 36,529 34,696 15,903 Non-mated comparisons 107,742,554 106,299,390 94,858,864 19,878,750 DET curves Figure 56. DET curves for the fingerprint sensors using Neurotechnology – FPC PUBLIC REPORT Code: IDTL-FDC-01 Revision: 1.1 Date: 11/05/2015 Page 115 / 139 PERFORMANCE ANALISIS CROPPED IMAGES VS. CROPPED IMAGES ROC curves Figure 57. ROC Curves using Neurotechnology – FPC Additional rates In addition to previous sections, Table 93 provides relevant error rates for the different sensors. Table 93. Additional error rates for Neurotechnology - FPC Error rate FPC FPC_12x12 FPC_10x10 FPC_8x8 EER 0.0925 % 3.49 % 13.48 % 31.96 % <0.01% 3.91 % 16.70 % 44.11 % <0.01*% 4.99 % 19.775 % 49.64 % 1.54 % 6.86 % 23.53 % 56.05 % FMR100 (the lowest FNMR for FMR<=1%) FMR1000 (the lowest FNMR for FMR<=0.1%) FMR10000 (the lowest FNMR for FMR<=0.01%) The lack of precisión in providing this rate is due to the sample rejection by the automatic ground truth checking mechanism during the capturing process. Code: IDTL-FDC-01 Revision: 1.1 Date: 11/05/2015 Page 116 / 139 PUBLIC REPORT PERFORMANCE ANALISIS CROPPED IMAGES VS. CROPPED IMAGES 10.3.2.2. Throughput rates for Neurotechnology - FPC This subsection shows throughput rates for the processes that have been conducted during the evaluation considering the NBIS algorithm and the FPC fingerprint sensor. The application used to process and compare fingerprint images has been developed using Microsoft Visual Studio, .NET framework 4.5 and C# 32 bits. Moreover, time measurements for the different processes have been calculated using different machines: Machine 1: a PC with a processor Intel core 2Duo E8500 @ 3.16 GHz and a RAM memory of 4 GB which has installed Windows 7 Professional 2007. This machine was used for extracting the feature vectors and making some comparisons of the original database. Machine 2: a laptop with a processor Intel core i7-3517U @ 1.9 GHz and a RAM memory of 4 GB. This PC has installed Windows 8.1 Professional, 2013. This machine was used for making some comparisons of the original database. Machine 3: a laptop with a processor Intel Core i7-5500U @ 2’40 GHz and a RAM memory of 8 GB. This PC has installed Windows 8.1 Professional 2013. This machine was used for extracting the feature vectors and for making comparisons of the all cropped databases. Enrolment results Table 94 shows the time in milliseconds that takes to obtain the biometric references for the images captured with each fingerprint sensor respectively. Table 94. Throughput rates results for enrolment using Neurotechnology - FPC Enrolment FPC FPC_12x12 FPC_10x10 FPC_8x8 Arithmetic mean 2,200 ms 6,416 ms 6,449 ms 6,726 ms Standard deviation ± 136.25 ms ± 711.22 ms ± 776.20 ms ± 553.28 ms Minimum 230 ms 4,397 ms 44,06 ms 6,618 ms Maximum 4,463 ms 9,985 ms 10,000 ms 13,324 ms Number of enrolments 2,903 2,911 2,735 1,251 Code: IDTL-FDC-01 Revision: 1.1 Date: 11/05/2015 Page 117 / 139 PUBLIC REPORT PERFORMANCE ANALISIS CROPPED IMAGES VS. CROPPED IMAGES Acquisition results Table 95 shows the time in milliseconds that takes to obtain the biometric probes for the images captured with each fingerprint sensor respectively. Table 95. Throughput rates results for acquisition using Neurotechnology - FPC Acquisition FPC FPC_12x12 FPC_10x10 FPC_8x8 Arithmetic mean 1043 ms 3,325 ms 3,325 ms 3,274 ms Standard deviation ± 36.12 ms ± 13.29 ms ± 39.61 ms ± 334.6 ms Minimum 239 ms 3,202 ms 2,194 ms 1,080 ms Maximum 1,187 ms 3,410 ms 3,394 ms 3,395 ms Number of acquisitions 43,168 37,017 37,017 37,017 Comparison results Next tables provided the time in milliseconds that takes to compare the biometric references to biometric probes for the images captured with each fingerprint sensor respectively. Specifically, Table 96 shows measurements obtained for mated comparisons and Table 97 for non-mated comparisons. Code: IDTL-FDC-01 Revision: 1.1 Date: 11/05/2015 Page 118 / 139 PUBLIC REPORT PERFORMANCE ANALISIS CROPPED IMAGES VS. CROPPED IMAGES Table 96. Throughput Neurotechnology - FPC rates results for mated comparisons using Mated comparisons FPC FPC_12x12 FPC_10x10 FPC_8x8 Arithmetic mean 1.07 ms 0.63 ms 0.45 ms 0.07 ms Standard deviation ± 1.157 ms ± 2.60 ms ± 2.62 ms ± 2.02 ms Minimum 0 ms 0 ms 0 ms 0 ms Maximum 32 ms 263 ms 198 ms 111 ms Number of comparisons 37,128 36,529 34,696 15,903 Table 97. Throughput rates results for non-mated comparisons using Neurotechnology - FPC Nonmated comparisons FPC FPC_12x12 FPC_10x10 FPC_8x8 Arithmetic mean 0.86 ms 0.48 ms 0.28 ms 0.047 ms Standard deviation ± 0.55 ms ± 2.56 ms ± 2.16 ms ± 1.69 ms Minimum 0 ms 0 ms 0 ms 0 ms Maximum 70 ms 1,354 ms 1,519 ms 1,415 ms Number of comparisons 107,742,554 106,299,390 94,858,864 19,878,750 Code: IDTL-FDC-01 Revision: 1.1 Date: 11/05/2015 Page 119 / 139 PUBLIC REPORT PERFORMANCE ANALISIS CROPPED IMAGES VS. CROPPED IMAGES Performance results for Neurotechnology - UPK 10.3.3.1. Error rates for Neurotechnology - UPK Enrolment and acquisition results FTE and FTP errors that have happened for the different fingerprint sensors when for generating the biometric references and probes for later comparisons are given in Table 98 and Table 99. In this case, the algorithm applied for enrolling and acquiring the samples has been Neurotechnology. Table 98. FTE errors for Neurotechnology - UPK UPK UPK _12x12 UPK _10x10 UPK _8x8 Number of correct templates 3,131 2,795 2,593 390 FTE errors 403 739 941 3,144 Total number of enrolment transactions 3,534 3,534 3,534 3,534 FTE rate 11.40 % 20.91 % 26.62 % 88.96 % Table 99. FTP errors for Neurotechnology – UPK UPK _12x12 UPK _10x10 UPK _8x8 Number of correct samples 29,103 28,249 2,226 FTP errors 2,350 0 24,674 Total number of acquisition attempts 31,453 28,249 26,900 FTP rate 7.47 % 0.00 % 91.72 % Code: IDTL-FDC-01 Revision: 1.1 Date: 11/05/2015 Page 120 / 139 PUBLIC REPORT PERFORMANCE ANALISIS CROPPED IMAGES VS. CROPPED IMAGES Comparison results Comparisons results are provided in the following subsections. The number of comparisons used to obtain these metrics per each fingerprint sensors are given in Table 100. Table 100. Number of comparisons conducted using Neurotechnology - UPK UPK UPK_12x12 UPK_10x10 UPK_8x8 Mated comparisons 40,032 29,103 28,249 2,226 Non-mated comparisons 125,118,621 81,313,782 73,221,408 865,914 DET curves Figure 58. DET curves for the fingerprint sensors using Neurotechnology – UPK PUBLIC REPORT Code: IDTL-FDC-01 Revision: 1.1 Date: 11/05/2015 Page 121 / 139 PERFORMANCE ANALISIS CROPPED IMAGES VS. CROPPED IMAGES ROC curves Figure 59. ROC Curves using Neurotechnology – UPK Additional rates In addition to previous sections, Table 101 provides relevant error rates for the different sensors. Table 101. Additional error rates for Neurotechnology - UPK Error rate UPK UPK_12x12 UPK_10x10 UPK_8x8 EER 0.0616% 4.38 % 16.58 % 20.02 % <0.01% 5.00 % 21.25 % 27.04 % <0.01%* 6.08 % 24.50 % 32.75 % 0.42 % 7.56 % 28.56 % 37.69 % FMR100 (the lowest FNMR for FMR<=1%) FMR1000 (the lowest FNMR for FMR<=0.1%) FMR10000 (the lowest FNMR for FMR<=0.01%) The lack of precisión in providing this rate is due to the sample rejection by the automatic ground truth checking mechanism during the capturing process. Code: IDTL-FDC-01 Revision: 1.1 Date: 11/05/2015 Page 122 / 139 PUBLIC REPORT PERFORMANCE ANALISIS CROPPED IMAGES VS. CROPPED IMAGES 10.3.3.2. Throughput rates for Neurotechnology - UPK This subsection shows throughput rates for the processes that have been conducted during the evaluation considering the NBIS algorithm and the UPK fingerprint sensor. The application used to process and compare fingerprint images has been developed using Microsoft Visual Studio, .NET framework 4.5 and C# 32 bits. Moreover, time measurements for the different processes have been calculated using different machines: Machine 1: a PC with a processor Intel Core 2Duo E6750 @ 2.66 GHz and a RAM memory of 4 GB. This PC has installed Windows 7 Ultimate, 2009. This machine was used for extracting the feature vectors and making comparisons of the original database. Also, it was used extracting the feature vectors of the 8x8 mm2 database and for making comparisons of the 8x8 vs. 8x8 mm2 feature vectors. Machine 2: a PC with a processor Intel Core i7-4790 @ 3.60 GHz and a RAM memory of 12GB. This PC has installed Windows 8.1, 2013. This machine was used for extracting the feature vectors and for making comparisons of the 10x10 mm2 and 12x12 mm2 databases. Enrolment results Table 102 shows the time in milliseconds that takes to obtain the biometric references for the images captured with each fingerprint sensor respectively. Table 102. Throughput rates results for enrolment using Neurotechnology - UPK Enrolment UPK UPK_12x12 UPK_10x10 UPK_8x8 Arithmetic mean 2,215 ms 2,223 ms 2,222 ms 2,250 ms Standard deviation ± 56.04 ms ± 90.67 ms ± 103.20 ms ± 195.86 ms Minimum 778 ms 117 ms 406 ms 2014 ms Maximum 3,340 ms 4452 ms 4,435 ms 4,456 ms Number of enrolments 3,131 2,795 2,593 390 PUBLIC REPORT Code: IDTL-FDC-01 Revision: 1.1 Date: 11/05/2015 Page 123 / 139 PERFORMANCE ANALISIS CROPPED IMAGES VS. CROPPED IMAGES Acquisition results Table 103 shows the time in milliseconds that takes to obtain the biometric probes for the images captured with each fingerprint sensor respectively. Table 103. Throughput rates results for acquisition using Neurotechnology - UPK Acquisition UPK UPK_12x12 UPK_10x10 UPK_8x8 Arithmetic mean 1,090 ms 1,105 ms 1,106 ms 1,102 ms Standard deviation ± 84.04 ms ± 13.01 ms ± 9.76 ms ± 26.37 ms Minimum 165 ms 885 ms 615 ms 60 ms Maximum 1,530 ms 1,153 ms 1,143 ms 1,261 ms Number of acquisitions 44,531 33,861 36,211 11,537 Comparison results Next tables provided the time in milliseconds that takes to compare the biometric references to biometric probes for the images captured with each fingerprint sensor respectively. Specifically, Table 104 shows measurements obtained for mated comparisons and Table 105 for non-mated comparisons. Code: IDTL-FDC-01 Revision: 1.1 Date: 11/05/2015 Page 124 / 139 PUBLIC REPORT PERFORMANCE ANALISIS CROPPED IMAGES VS. CROPPED IMAGES Table 104. Throughput rates results for Mated comparisons using Neurotechnology UPK Mated comparisons UPK UPK_12x12 UPK_10x10 UPK_8x8 Arithmetic mean 1.55 ms 0.16 ms 0.007 ms 0.61 ms Standard deviation ± 0.17 ms ± 0.37 ms ± 0.08 ms ± 2.03 ms Minimum 0 ms 0 ms 0 ms 0 ms Maximum 22 ms 2 ms 2 ms 69 ms Number of comparisons 40,032 29,103 28,249 2,226 Table 105. Throughput rates results for Non-mated comparisons using Neurotechnology - UPK Nonmated comparisons UPK UPK_12x12 UPK_10x10 UPK_8x8 Arithmetic mean 2.00 ms 0.06 ms 0.0021 ms 0.53 ms Standard deviation ± 1.65 ms ± 0.24 ms ± 0.067 ms ± 1.56 ms Minimum 0 ms 0 ms 0 ms 0 ms Maximum 95 ms 26 ms 89 ms 170 ms Number of comparisons 125,118,621 81,313,782 73,221,408 865,914 PUBLIC REPORT Code: IDTL-FDC-01 Revision: 1.1 Date: 11/05/2015 Page 125 / 139 PART III ANALYSIS OF THE RESULTS OBTAINED PUBLIC REPORT Code: IDTL-FDC-01 Revision: 1.1 Date: 11/05/2015 Page 126 / 139 ANALYSIS OF THE RESULTS OBTAINED 11. ANALYSIS OF THE RESULTS OBTAINED INTRODUCTION This final part provides the analysis of the results and main conclusions obtained from the figures calculated. These conclusions are sorted in sections as to analyse individually each aspect considered of interest. COMPARISON AMONG SENSORS ACCORDING TO THE QUALITY OF THE SAMPLES CAPTURED According to NFIQ, the number of samples overcoming the enrolment threshold is higher for UPK and NXT than for FPC, which presents a high rate of NFIQ=5. Considering those samples overcoming the enrolment quality threshold, the thermal sensor present more NFIQ=1 and NFIQ=2 samples, while the two capacitor sensors present a majority of NFIQ=3. This tendency is kept also for the samples captured during the visits (i.e. after enrolment). FPC presents a very low number of NFIQ=1 samples, placing the most of the samples at NFIQ=3. UPK presents a growing curve with NFIQ, having more samples at NFIQ=3 than the ones at NFIQ=2, and those are more than the ones at NFIQ=1. In the case of NXT sensor, a majority of the samples present NFIQ=2, with a reasonable high percentage at NFIQ=1. Once again, the sensor presenting a larger number of rejected samples (i.e. NFIQ=5) is FPC. Although this conclusion is accurate considering the results, it is important to note that scientific community has already determined the need of improving NFIQ as to provide results that are more consistent. But for the time being, NFIQ is the baseline for quality assessment. According to the quality error rate, the results show that FPC rejects more users than the other two sensors, who behave equivalently, being slightly lower for NXT than for UPK. This gives the impression of a faster adaptation of the user to the NXT sensor, in the same level of easiness than with UPK. The sensor for which the user needed a larger number of attempts (i.e. larger number of images created in the database) is FPC; this creates some concerns about the usability of the sensor among the test crew. The same tendency is present during the capturing process. A qualitative result obtained by operators during the acquisition process is that users felt more uncomfortable or have more difficulties in interacting with the sensor having the smaller area (i.e. FPC), as the location of the finger had direct impact to the quality assessment and/or the ground truth assurance mechanism. PUBLIC REPORT Code: IDTL-FDC-01 Revision: 1.1 Date: 11/05/2015 Page 127 / 139 ANALYSIS OF THE RESULTS OBTAINED PERFORMANCE ALGORITHM-SENSOR PAIRS The performance of the NBIS algorithm results in a lower FTE rate for NXT with a similar (although higher) rate for UPK and a sensible larger rate for FPC. Regarding the feature extraction of the samples acquired during the capturing process, the first thing to note is the high number of the FTA rate for all sensors, being above 25%, which may raise usability concerns due to the large rejection of samples. Comparing the results for the three sensors, FPC shows a much higher FTA rate (over 45%), while UPK and NXT show similar rates between each other, being lower for UPK, although still over 27%. Therefore, when using NBIS algorithm, the behaviour of FPC may not be considered acceptable, while the one of NXT and UPK should be analysed as to reduce the number of rejections. Focusing on the recognition rates of the NBIS algorithm for each of the sensors, a similar behaviour can be observed for NXT and UPK (around 4% EER), while FPC shows a better behaviour of below 1% EER. In overall, considering the large amount of samples rejected from the FPC sensor, a trade-off between usability (lower FTA rates) and accuracy (lower EER figures) shall be analysed according to the target application. Finally, avoiding differences between machines, it is shown that NBIS takes longer enrolment time for UPK than for NXT and FPC samples. The same behaviour is shown for the feature extraction process, while the comparison among samples present a more homogeneous behaviour among sensors. It is important to note that for the NBIS algorithm, the comparison time for the mated samples is one order or magnitude higher than the comparison time among non-mated samples. Analysing the performance of the Neurotechnology algorithm, the FTE rates result in a lower error rate for NXT than for UPK and FPC, being the numbers lower than the ones obtained with the NBIS algorithm. Regarding FTA rates, the numbers are also much lower than those of the NBIS algorithm (below 26%, instead of over 45% for FPC). But it still shows a worse behaviour of the FPC sensor compared to the other two ones. Differently from the results of NBIS, in this case the FTA rate is lower for NXT than for UPK. Even though, the rates are still higher than expected (above 15%), although in a much acceptable level than the one with the NBIS algorithm. Focusing on the recognition rates, Neurotechnology presents much lower error rates than NBIS (lower than 0.1% EER, compared to the 4% of NBIS). The accuracy achieved with each of the sensors is quite similar, being better for UPK and NXT and worse for FPC. That relationship is just the opposite as the one with the NBIS algorithm. In overall, considering the rejection rates and the accuracy achieved, it can be stated that NXT presents a better behaviour, followed closely by UPK, and finally with worse results for FPC. But in all cases, the FTA rate may compromise usability of a potential deployment. PUBLIC REPORT Code: IDTL-FDC-01 Revision: 1.1 Date: 11/05/2015 Page 128 / 139 ANALYSIS OF THE RESULTS OBTAINED In the case of Neurotechnology, the time needed for the feature extraction and for the enrolment is equivalent for all 3 sensors, being one order of magnitude higher than the time needed by NBIS. But for comparison, having an equivalent time for mated and non-mated samples, the time consumed is one order of magnitude lower than the one of NBIS. Among sensors, the comparison time for FPC is half of the one needed by NXT or UPK. PERFORMANCE OF ALGORITHMS With the results summarized in the previous sub-section, Neurotechnology obtains nearly two orders of magnitude better performance than NBIS, with a comparison time of one order of magnitude less. The major disadvantage of the Neurotechnology algorithm is the time needed for enrolment and for the feature extraction process. It is important to remember that the mechanism established to guarantee the ground truth has an impact on the error rates, but, nevertheless, for both algorithms the threshold chosen has been relaxed enough as to minimize this effect. Such impact is only on the mated distribution curve, so by analysing the non-mated distribution line, it can be observed how much compact/narrow is in case of Neurotechnology compared to NBIS. Therefore it is clear than the area of intersection between mateds and non-mated will always be larger for NBIS than for Neurotechnology, providing validity to the initial result observed of a better performance in the latter than in the former. IMPACT OF REDUCED AREA Considering the NFIQ, the quality of the cropped images is decreasing as the size of the image is reduced. Specially, 8x8 images present an NFIQ=5. For the other sizes, i.e. 12x12 and 10x10 the most common is, in most cases, NFIQ=3. After analysing all the combinations algorithm/sensor, the main conclusions are equivalent for each case, with slight differences depending on the combination: FTE rate increase enormously as the size of the image is reduced. This effect is very important in all cases although for the Neurotechnology/FPC combination cropping to smaller sizes is not so dramatic. Regarding FTA, the analysis has only considered the additional errors obtained at the processing of the samples (FTP). This rate has been completely insignificant for the case of the NBIS algorithm, while it has been extremely important in the case of Neurotechnology (the “Too Few Features” exception has occurred multiple times). An exception for this case is the use of the FPC sensor, which has not obtained any FTP error, while the number of FTP with NXT and NEU is extremely high. When analysing the accuracy, cropped images present higher error rates than full-size images, being higher the error as the size is reduced. Such errors increase, at least, in an order of magnitude when 8x8 size is considered. For NBIS, 8x8 EER is higher than 40% (being 4% for full-size), PUBLIC REPORT Code: IDTL-FDC-01 Revision: 1.1 Date: 11/05/2015 Page 129 / 139 ANALYSIS OF THE RESULTS OBTAINED while for Neurotechnology the increase has been from below 0.1% till up to 35%. Intermediate values appear for the intermediate sizes, being always above 20% for NBIS and above 3% for Neurotechnology. Regarding computational time, as expected, it shrinks with the size of the image. In the case of the NBIS algorithm this happens for all cases and processes, i.e. enrolment, feature extraction and comparison. But in the case of Neurotechnology, only the comparison time is significantly reduced, while the enrolment and feature extraction processes present equivalent rates among each of the cases. In few words, the smaller the image, the larger the rejection during acquisition, and the higher the error rates. In most cases, the results show important concerns on the potential usability of a deployment, as well as the accuracy achieved. An initial recommendation from this result is avoiding using small size sensors. In case such sensors are used, then two recommendations shall be followed. The first one is to improve the training of the user in interacting with the sensor, as to reduce the FTE and FTA rates. The second one is to complement the recognition process with other mechanisms, as to improve the accuracy during an operational recognition process. INTEROPERABILITY BETWEEN FULL SIZE AND REDUCED AREA When analysing the interoperability between the reduced samples and the biometric references obtained using the full size images, the results obtained are equivalent to the ones noted in the previous section, with some slight differences: FTP error rates (mainly obtained by the lack of being able to extract enough minutiae from the cropped images) increase when the area is reduced in the case of the Neurotechnology algorithm (as this algorithm has additional internal quality checks). These rates shall be added to the FTA rates for the acquisition process given in the full-size case. o This increase in the FTA error rates is very low in the case of the NBIS algorithm, although for the FPC sensor higher. Regarding accuracy, it shows the expected behaviour of an increase in the error rates with the reduction of the image area. The loss of accuracy is very significant, although much less important than the one of cropped vs. cropped comparisons. Using the Neurotechnology algorithm, the accuracy decreases in an order of magnitude with the size, but the error rates keep in a reasonable level (lower than 10% EER in most cases). o For UPK, the accuracy for 8x8 keeps the same level as the 10x10, although, as said, the FTA rate is much higher, and the overall performance of the 8x8, even for that sensor, is much worse than for the 10x10 case. In terms of processing time, the tendency is the one as the case of cropped vs. cropped comparison. The smaller the size, the shorter the time, both for feature extraction and for comparison. Obviously, feature extraction is equivalent as in the previous case, while comparison time is slightly higher PUBLIC REPORT Code: IDTL-FDC-01 Revision: 1.1 Date: 11/05/2015 Page 130 / 139 ANALYSIS OF THE RESULTS OBTAINED than in the cropped vs. cropped comparison, but still three orders of magnitude shorter than the feature extraction. As a summary, results show that the behaviour of the system using reduced size samples, is much better if the enrolment has been performed using full size images. Therefore, the recommendation is to use this scheme in those applications where small sensors need to be used, whenever it may be possible to use an external sensor for enrolment. LESSONS LEARNED After carrying out the acquisition and obtaining the evaluation report, there are a set of lessons learned, being some of them in the roadmap for future evaluations. The lessons learned have been: Using managed/interpreted languages for the evaluation process is fully discouraged, as the latency of the virtual machines involved, not only delays the processing, but also creates further challenges in massive comparisons, such as memory management, garbage collection and core assignment. Potentially related to this is the effect in the execution of each of the test with the different laboratories. The timing taken for performing each of the experiments is much higher than the multiplication of each of the processes multiplied by the number of times the process takes (e.g. it takes much longer the whole cross-comparison, than summing the individual times obtained for each of the comparisons). This effect has been more noted in the case of the Neurotechnology algorithm, taking 3 times longer than the NBIS algorithm, while the feature extraction and comparison durations are, more or less, equivalent or even shorter). After analysing the results of the NFIQ algorithm, and more precisely some of the samples labelled with bad quality and some others with good quality, the performance of NFIQ as a quality assessment tool provide no consistent results. An analysis of the results without such quality assessment (i.e. just using the processing/comparison algorithms) is encouraged. o In addition, a strong support to the teams currently developing a 2nd version of NFIQ, should be given. The need of a mechanism to assure ground truth should be mandatory, even considering the impact to the mated distribution curve. Such mechanism shall complement the visual inspection of the capturing process, but should try to have a reduced impact on both, the distribution rates and the user interaction. PUBLIC REPORT Code: IDTL-FDC-01 Revision: 1.1 Date: 11/05/2015 Page 131 / 139 REFERENCES REFERENCES [1] [2] [3] [4] [5] International Organization for Standardization, 'ISO/IEC 19795-1, Information technology -- Biometric performance testing and reporting -- Part 1: Principles and framework', ISO/IEC 19795-1:2006 Neurotechnology, Biometrics and Artificial Intelligent Technologies, http://www.neurotechnology.com/, accessed April 2015 Watson, C. I. et al., 'User's Guide to NIST Biometric Image Software (NBIS),' National Institute of Standards and Technology (NIST), NIST IR 7392, January 2007, http://www.nist.gov/customcf/get_pdf.cfm?pub_id=51097, accessed March 2015 Tabassi, E.; Wilson, C. L.; Watson, C. I., 'Fingerprint Image Quality, National Institute of Standards and Technology (NIST), NIST IR 7152, August 2004 The BioSecure Reference and Evaluation Framework, Biosecure tool, Performance Evaluation of a Biometric Verification System, http://svnext.it-sudparis.eu/svnview2eph/ref_syst//Tools/PerformanceEvaluation/, accessed March 2015 PUBLIC REPORT Code: IDTL-FDC-01 Revision: 1.1 Date: 11/05/2015 Page 132 / 139 ANNEX A: NBIS algorithm Full vs. Cropped comparisons ANNEX A: Additional performance curves using NBIS algorithm Full vs. Cropped comparisons A.1. DET curve including all cropped sizes Figure 60. DET curve using NBIS PUBLIC REPORT ANNEX A: NBIS algorithm Full vs. Cropped comparisons A.2. ROC curve including all cropped sizes Figure 61. ROC curve using NBIS Code: IDTL-FDC-01 Revision: 1.1 Date: 11/05/2015 Page 133 / 139 PUBLIC REPORT Code: IDTL-FDC-01 Revision: 1.1 Date: 11/05/2015 Page 134 / 139 ANNEX B: Neurotechnology algorithm Full vs. Cropped comparisons ANNEX B: Additional performance curves using Neurotechnology algorithm Full vs. Cropped comparisons DET curve including all cropped sizes Figure 62. DET curve using Neurotechnology PUBLIC REPORT ANNEX B: Neurotechnology algorithm Full vs. Cropped comparisons Roc curve including all cropped sizes Figure 63. ROC curve using Neurotechnology Code: IDTL-FDC-01 Revision: 1.1 Date: 11/05/2015 Page 135 / 139 PUBLIC REPORT Code: IDTL-FDC-01 Revision: 1.1 Date: 11/05/2015 Page 136 / 139 ANNEX C: NBIS algorithm Cropped vs. Cropped comparisons ANNEX C: Additional performance curves using NBIS algorithm C.1. DET curve including all cropped sizes Figure 64. DET curve using NBIS PUBLIC REPORT ANNEX C: NBIS algorithm Cropped vs. Cropped comparisons C.2. ROC curve including all cropped sizes Figure 65. ROC curve using NBIS Code: IDTL-FDC-01 Revision: 1.1 Date: 11/05/2015 Page 137 / 139 PUBLIC REPORT Code: IDTL-FDC-01 Revision: 1.1 Date: 11/05/2015 Page 138 / 139 ANNEX D: Neurotechnology algorithm Cropped vs. Cropped comparisons ANNEX D: Additional performance curves using Neurotechnology algorithm D.1. DET curve including all cropped sizes Figure 66. DET curve using Neurotechnology PUBLIC REPORT Code: IDTL-FDC-01 Revision: 1.1 Date: 11/05/2015 Page 139 / 139 ANNEX D: Neurotechnology algorithm Cropped vs. Cropped comparisons D.2. Roc curve including all cropped sizes Figure 67. ROC curve using Neurotechnology
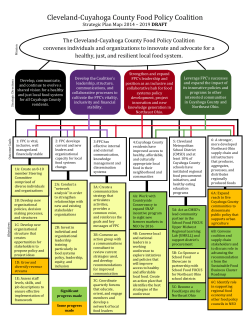


© Copyright 2026