
Difficult Past, Uncertain Future Living Conditions Among Palestinian Refugees in Camps
Ole Fr. Ugland (ed.)
Difficult Past, Uncertain Future
Living Conditions Among
Palestinian Refugees in Camps
and Gatherings in Lebanon
Ole Fr. Ugland (ed.)
Difficult Past, Uncertain Future
Living Conditions Among Palestinian Refugees
in Camps and Gatherings in Lebanon
Authors
Yousef Al-Madi
Najla Bashour
Laurie Blome Jacobsen
Mary Deeb
Aziza Khalidi
Marwan Khawaja
Åge A. Tiltnes
Guri Tyldum
Ole Fr. Ugland
Fafo-report 409
© Fafo 2003
ISBN 82-7422-398-5
ISSN 0801-6143
Cover page: Agneta Kolstad
Cover photo: Norwegian People’s Aid and partners
Printed in Norway by: Centraltrykkeriet AS
2
Living Conditions Among Palestinian Refugees in Camps and
Gatherings in Lebanon
Survey Project Team:
Project director: Ole Fr. Ugland
Lebanon field coordinator: Aziza Khalidi
Fieldwork Team:
Project Manager: Yousef Al-Madi
Translators:
Colette Sednawi
Nuhad Dowagi
Hana Zayat
Accountants:
Yousef Al Houseini
Khaled Sawan
Driver:
Mahmood Ajaj
Guides:
Mouhamed Khattar
Ahmad Maqdah
Bequaa field team:
Sulfa Al-Fassed (Regional coordinator)
Nissrin Abed Al-Mounem (Interviewer)
Amal Al Ahmad (Interviewer)
Faten Shamali (Interviewer)
Joumana Yousef (Interviewer)
Saida field team:
Mouhamad Mau’d (Regional coordinator)
Roula Salah (Supervisor)
Najla Madi (Supervisor)
Slash Younes (Supervisor)
Kadijeh Sawan (Interviewer)
Saumur Dirbaj (Interviewer)
3
Amal Al-Ali (Interviewer)
Amneh Maqdah (Interviewer)
Hajar Nofal (Interviewer)
Inas Ateiweh (Interviewer)
Rana Flafel (Interviewer)
Fadia Zamel (Interviewer)
Ana Antar (Interviewer)
Ibtisam Al-Khalil (Interviewer)
Lama Khamis (Interviewer)
Hinaya Zeidan (Interviewer)
Naziha Khatab (Interviewer)
Hala Yassin (Interviewer)
Haila Khatab (Interviewer)
Sadiqa Sararre (Interviewer)
Nabiha Qassem (Interviewer)
Mouna Shahin (Data entry supervisor)
Rula Higair (Data entry operator)
Hula Higair (Data entry operator)
Mirvet Yassin (Data entry operator)
Manal Nofal (Data entry operator)
Raghida Khalil (Data entry operator)
Angi Abdel Hamid (Data entry operator)
Ali Younes (Coding and auditing)
Tyre field team:
Walid Ward (Regional coordinator)
Haitham Beidas (Supervisor)
Siham Hamideha (Supervisor)
Kawla Asa’d (Supervisor)
Kawla Jarad (Interviewer)
Ina’m Diab (Interviewer)
Samira Said (Interviewer)
Randa Zakaria (Interviewer)
Sahar Abed-Razaq (Interviewer)
Alia Ramid (Interviewer)
Faizah Khalaf (Interviewer)
4
Beirut field team:
Hatem Sadek (Regional coordinator)
Moujahed Abbas (Supervisor)
Souad Hamad (Supervisor)
Sana’ Al Housein’ (Interviewer)
Jihan Za’roura (Interviewer)
Nouha Sarhan (Interviewer)
Fatema Dibaja (Interviewer)
Than’a Yousef (Interviewer)
Fadia Kharbiti (Interviewer)
Amneh Al-Khatib (Interviewer)
Maha Abd Al-Wahab (Interviewer)
Jamal Al-Alem (Data entry supervisor)
Suzi Nounou (Data entry operator)
Kamila Sha’ban (Data entry operator)
Fadi Raji (Data entry operator)
Mahmoud Kalid (Coding and auditing)
Tripoli field team:
Ahmad Abou Al-Hassan (Regional coordinator)
Faten Abou Ghaida (Supervisor)
Salah Zubeidi (Supervisor)
Mur’l Gama’h (Supervisor)
Hibah Abdallah (Interviewer)
Joumana Khamash (Interviewer)
Hanan Ayash (Interviewer)
Rana Rahmeh (Interviewer)
Marwa Quasmieh (Interviewer)
Nisrin Abed-Arasoul (Interviewer)
Amal Ahmad Mahmoud (Interviewer)
Nadia Abou Ali (Interviewer)
Lina Loubani (Interviewer)
Rae’dah Wahbeh (Interviewer)
Manal Sha’ban (Interviewer)
Lara Khatib (Interviewer)
Nada Shahin (Data entry supervisor)
Sahar Lobani (Data entry operator)
Rabi’ Rabi’ (Data entry operator)
Hanadi Mouhamad (Data entry operator)
Mahmoud Yones (Coding and auditing)
5
Norwegian People’s Aid:
Wafa Al Yassir
Rashid Khatib
Lebanese Directorate for Refugees:
Dr. Khalil Shatawi
Lebanese expert:
Salah Salah
The Royal Norwegian Embassy in Lebanon:
Rita Sayigh
Tony Bathani
Fafo consultants:
Willy Egseth
Jon Hanssen-Bauer
Jon Pedersen
Siri S. Størmer
6
Acronyms and abbreviations
CPR
Contraceptive Prevalence Rate
DHS
Demographic and Health Survey
DOS
Department of Statistics, Jordan
IGO
International Governmental Organization
ILO
International Labour Organisation
IMR
Infant Mortality Rate
IUD
Intra-uterine Device
JLCS
Jordan Living Conditions Survey
LIPRIL
Survey of Living Conditions among Palestinian Refugees in Lebanon
LL
Lebanese Pounds
MTFR
Marital Total Fertility Rate
MI
Macro International
NGO
Non-governmental Organization
NPA
Norwegian People’s Aid
PCBS
Palestinian Central Bureau of Statistics
PLO
Palestine Liberation Organization
PRCS
Palestine Red Crescent Society
RSI
Randomly Selected (Adult) Individual
SES
Socio-economic Status
TFR
Total Fertility Rate
U5MR
Child (Under-five) Mortality Rate
UNDP
United Nations Development Programme
UNRWA United Nations Relief and Works Agency for Palestine Refugees
US
United States of America
USCR
The United States Committee for Refugee
USD
US Dollar
WHO
World Health Organization
7
8
Contents
Acronyms and abbreviations ......................................................................... 7
Preface .......................................................................................................... 13
Chapter 1 Introduction ...................................................................... 15
1.1 A Difficult Past, An Uncertain Future ................................................... 15
1.2 The Surveyed Population ....................................................................... 16
1.3 Community Types and Geographical Distribution ............................... 19
1.4 A Conceptual Model of Living Conditions ........................................... 21
1.5 Report Outline ....................................................................................... 26
Chapter 2 Population ......................................................................... 29
2.1 Introduction ........................................................................................... 29
2.2 Population Structure ............................................................................. 30
2.3 Marriage ................................................................................................. 32
2.4 Fertility ................................................................................................... 35
2.5 Infant and Child Mortality .................................................................... 44
2.6 Household Size and Composition ......................................................... 45
2.7 Migration ............................................................................................... 47
2.8 Relatives Abroad .................................................................................... 58
Chapter 3 Health and Health Services .............................................. 61
3.1 Introduction ........................................................................................... 61
3.2 Self-assessed General Health ................................................................. 62
3.3 Chronic Illness and Disability ................................................................ 67
3.4 Functional Impairment .......................................................................... 70
3.5 Psychological Distress ............................................................................ 73
3.6 Medical Consultation and Treatment ................................................... 81
3.7 Medical Insurance .................................................................................. 89
3.8 Satisfaction With Medical Services ....................................................... 90
3.9 Maternity Care ....................................................................................... 92
3.10 Risk Behaviour and Environmental Effects ......................................... 99
9
Chapter 4 Education ........................................................................ 107
4.1 Introduction ......................................................................................... 107
4.2 The Educational System ....................................................................... 108
4.3 Educational Attainment ...................................................................... 110
4.4 Illiteracy ................................................................................................ 115
4.5 Enrolment and Drop-out ..................................................................... 117
4.6 Parental Attitudes to Education ......................................................... 123
Chapter 5 Employment and Working Conditions .......................... 127
5.1 Introduction ......................................................................................... 127
5.2 A Snapshot of the Labour Market ...................................................... 128
5.3 Determinants of Labour Force Participation ...................................... 130
5.4 Labour Utilisation ................................................................................ 135
5.5 Employment Characteristics ................................................................ 141
5.6 Working Conditions ............................................................................. 149
Chapter 6 Household Economies .................................................... 155
6.1 Introduction ......................................................................................... 155
6.2 Household Incomes .............................................................................. 156
6.3 Who are the Affluent and the Poor? .................................................. 164
6.4 Economic Wealth ................................................................................. 174
6.5 Past Experiences and Future Expectations ......................................... 178
Chapter 7 Housing and Environment ............................................. 183
7.1 Introduction ......................................................................................... 183
7.2 Community Profiles: Community Origins and Damage
from Armed Conflict .................................................................................. 184
7.3 Physical Aspects of the Dwelling ......................................................... 186
7.4 Land and Reported Ownership ........................................................... 190
7.5 Infrastructure Amenities, Sanitation and Environment ..................... 192
7.6 Indoor and Outdoor Environment ...................................................... 202
7.7 Neighbourhood Resources and Services ............................................. 204
Chapter 8 Social Networks ............................................................. 209
8.1 Introduction ......................................................................................... 209
8.2 Family Life and Extended Family Networks ........................................ 210
8.3 Satisfaction with Neighbours, Distance to Relatives and Friends ...... 213
8.4 Marriage and the Family: Autonomy in the Choice of a Spouse
and Kinship Relation Among Spouses ...................................................... 214
10
8.5 Connectedness of Family Networks .................................................... 222
8.6 Determinants of Strong Family Ties ................................................... 227
8.7 Social Networks and Well-being ......................................................... 230
Chapter 9 Social Participation ........................................................ 237
9.1 Introduction ......................................................................................... 237
9.2 News Consumption .............................................................................. 238
9.3 Participation in Social Organisations ................................................. 241
9.4 Women’s Freedom of Movement ....................................................... 243
9.5 Domestic Violence ............................................................................... 248
9.6 Attitudes Towards the West ................................................................ 250
Chapter 10 Putting the Pieces Together ......................................... 253
10.1 Introduction ....................................................................................... 253
10.2 Market and Infrastructure Availability ............................................. 255
10.3 Market and Infrastructure Utilisation .............................................. 260
10.4 Household Resources ......................................................................... 267
10.5 Future Needs ...................................................................................... 274
References .................................................................................................. 277
Annex1: The LIPRIL Sample ....................................................................... 285
11
12
Preface
This report presents the first comprehensive analysis ever made of the living conditions among the Palestinian refugees in Lebanon. The population surveyed consists
of refugees who live within the camps and those who live in scattered communities
locally referred to as “gatherings”. The report is based on a survey implemented
jointly by the Palestinian Central Bureau of Statistics in Damascus and the Fafo Institute for Applied International Studies in Oslo.
The project was made possible by a generous grant from the Royal Norwegian Ministry of Foreign Affairs, the acceptance of the prime minister of Lebanon,
H. E. Rafik Hariri, and the cooperation of the refugees themselves. All the local
popular groups in the camps agreed to the implementation of the project, and the
field staff of approximately 90 persons were primarily recruited from among the
qualified Palestinians in the camps. In addition, a significant number of professionals
and academics, as well as local non-governmental and international organizations,
have provided invaluable input and assistance.
The project preparations started in 1996. The survey fieldwork was carried out
in 1999, and the first results were released early in 2000. Six presentations were made
to different stakeholders in Lebanon and the subsequent comments and discussions
have been invaluable in drafting this report.
It is commonly believed that the Palestinian refugees living in Lebanon face more
hardship and are less integrated into the host country communities than those refugees living in the other countries in the Middle East. Yet, the information available has not allowed for the elaboration of indicators that might help in constructing a general and accurate picture. Such indicators are needed in order to map the
status of living conditions and to evaluate the needs of the population. As a major
provider of humanitarian assistance, Norway agreed to help fill the information gap
by helping to provide updated, reliable and internationally comparable statistics.
We would like to take this opportunity to express our gratitude to all those who
have participated in the undertaking, and in particular the Lebanese co-authors of
this report. We are grateful to the Government of Lebanon and to Dr. Khalil Shatawi,
director of the Lebanese Directorate for Palestinian Affairs. We extend our particular
thanks to the Norwegian People’s Aid and to its Representative, Ms. Wafa Yassir,
for very valuable support in all aspects of the work. We felt privileged to cooperate
13
with our partner, the Palestinian Central Bureau of Statistics in Damascus, and we
thank its director Dr. Mustafa Abyad for his support and Dr. Yousef Al Madi for
his excellent management of the fieldwork teams. We are grateful to Dr. Aziza Khalidi
for excellent coordination of the project in Lebanon and to Mr. Ole Fredrik Ugland for his overall responsibility for the project execution. Our gratitude also goes
to representatives of the many local NGOs and political parties that gave input to
survey design as well as constructive feedback to our analyses following several data
dissemination seminars. The Norwegian ambassadors Odd Wibe and Vigleik Eide
and their staff in Damascus, as well as Rita Sayigh and Tony Bathani of the Norwegian Embassy in Beirut, went out of their ways to assist us in all possible and impossible issues.
Lastly, but not the least, we would like to thank all the Palestinian households
who willingly opened their doors to the project team and spent their valuable time
with our fieldworkers. Without their amicable cooperation the survey would not
have been possible.
Oslo, December 2002
Jon Hanssen-Bauer
Managing director, Fafo AIS
14
Chapter 1 Introduction
Ole Fr. Ugland1
1.1 A Difficult Past, An Uncertain Future
In 1948, one hundred thousand Palestinians fled to Lebanon from what is today
Israel, mainly from Haifa, Acre and the Galilee, to find refuge from the war. In
Lebanon, temporary camps were established to provide shelter for the refugees. A
UN organisation was later established to provide assistance to them, the United
Nations Relief and Works Agency for Palestine Refugees, the UNRWA.
More than half a century later, the refugees are still in Lebanon. They have grown
in number, and they have witnessed, been part of, and been the victims of political
turbulence, civil and international wars, occupation and military actions, new displacements, even massacres, that have ravaged on the Lebanese soil since their arrival. Some of them have migrated to third countries and some are integrated into
the Lebanese society. Descendants in the second and third generations are still refugees.
The majority of them live on the borderline of the Lebanese society; tolerated,
but not integrated. Most live in camps that are still precarious settlements even if
they have become more like permanent neighbourhoods, or they live in clusters of
Palestinian homes outside the camps, in the so-called “gatherings”. They are frequently reported to face the worst living conditions among the Palestinian refugees
in the host countries in the Middle East (USCR 1999). In a situation characterised as one of physical misery, fear and insecurity (Sayigh 1994), most refugees face
limited employment opportunities and possess scant economic resources. Their
income is reported to be low and they often reside in densely populated camps.
UNRWA supports twice as many families that are unable to sustain themselves here
than in its other fields of operation (Besson 1996:5).
To a large extent, their future depends on outside political forces, over which
the refugees living in Lebanon have little control. They await an international settlement of the refugee issue. They long for their right of return. They know that
1
The author would like to thank Dr. Aziza Khalidi and Jon Hanssen-Bauer for comments to an earlier draft of this chapter.
15
they are not welcome to stay in Lebanon indefinitely. In brief, they suffer from a
difficult past, and they share an uncertain future.
Palestinian refugees in Lebanon are dependent on assistance from the international community for their survival. The most important source of such assistance is UNRWA. The refugees also obtain assistance from bilateral sources. This
assistance is channelled through a number of non-governmental organisations that
are crucial to the welfare of the refugees.
This report concludes a survey of the living conditions of the Palestinian
refugees living in camps and gatherings in Lebanon (LIPRIL). The survey was financed by Norway out of concern for the impact on the living conditions caused
by a decline in international assistance to the refugees. The survey was conducted
by the Palestinian Central Bureau of Statistics and Fafo Institute for Applied International Studies, with the support of the Palestinian population in Lebanon.
Fieldwork was conducted in January and February 1999.
The aim of the survey is to produce an unbiased and “objective” description of
current living conditions by using statistical indicators that are internationally recognised and suited for international comparison. Therefore, the study is founded
on the use of survey methodology that has been used in the region before, and which
incorporates methodologies that are internationally recognised.
The purpose of this introductory chapter is to elaborate further this conceptual framework, at the same time as placing it within the framework of the population surveyed.
1.2 The Surveyed Population
The origin of the surveyed population is families and individuals that fled to Lebanon in connection with the 1948 Middle East war. As previously stated, their
number is estimated to be around 100,000 individuals at that time. It is no straightforward exercise to establish their exact number today, as no population census has
ever been made, and as figures offered by various sources are highly contested.
Current estimates range from some 200,000 to 600,000 individuals. The number
depends, of course, on the exact definition of a Palestinian refugee, and several such
definitions are currently in use. Furthermore, the estimates are often based on
registers that have weaknesses with regard to population estimations, or they are
sensitive to underlying assumptions introduced to enable the estimation.
The most cited estimates are the ones given by Lebanese authorities and by
UNRWA. According to Lebanese officials, the number of Palestinian refugees and
their descendants in Lebanon is in the range of 400-600,000. This number would
16
be consistent with an annual population growth of 4-5 per cent, but it is doubtful
whether the actual population growth has been as high as this, particularly in recent years. The estimate is used by Lebanon to assess the number of refugees having any kind of “claim” on Lebanon, because Lebanon was their first country of
refuge, and does not pretend to indicate the number actually residing on their soil.
According to UNRWA registers, a Palestinian refugee is “a person who, as a
result of the establishment of the state of Israel, took refuge elsewhere in Palestine
(The West Bank and Gaza Strip), Lebanon, Syria and Trans-Jordan prior to 1 July
1952, and who was deemed in need”. Patrilineal descendants of these individuals
are also included in the population. These registers estimate the Palestinian population in Lebanon to be around 350,000 refugees, thus accounting for an estimated 6 per cent of all Palestinian refugees worldwide (UNRWA 1996; IPS1994:3).
UNRWA registers were originally established to serve administrative purposes for
the Agency, and not to estimate the number of refugees. This definition may actually imply underestimation of the real number as, at least historically, it targeted only those “in need”. UNRWA figures have also been criticised for overestimating the real number, as their registers are not necessarily updated for
out-migration, deaths, changes in citizenship and other “demographic” events.
Most observers claim that a reasonable estimate for the current Palestinian refugee population in Lebanon is lower than the examples cited above, while at the
same time none is in a position to provide authoritative figures. A recent survey in
Lebanon fixes the current number of refugees at slightly below 200,000 (ACS 1998).
Whatever their exact number, the study presented in this report covers only a
part of the total population of Palestinian refugees living in Lebanon, namely those
residing in the camps and in camp-like areas outside the camps, known as “gatherings”. These areas most probably contain the majority of the refugees in Lebanon.
However, the LIPRIL has not been designed to estimate population figures, so we
cannot really tell. The reason for covering only this part of the population is that
it is located in geographically identifiable areas that can be surveyed. Other
Palestinian families living scattered in predominantly Lebanese communities are
much more difficult to trace, and more costly to locate and enlist in the sample
frame.
There is also a second reason behind the limitation of the survey population.
The survey donors were mainly interested in identifying the needs of the Palestinian
refugees for humanitarian assistance. Hence their main focus is directed at refugees who are insufficiently integrated into the Lebanese society and, consequently
face the most vulnerable living conditions.
The LIPRIL covers twelve refugee camps. The major part of these camps consists
of areas operated by UNRWA. However, as the camps have expanded across their
“de jure” geographical borderlines, the LIPRIL includes also the population living
17
outside the strict UNRWA-defined camp borders, and which is commonly perceived as their “de facto” borders. Additionally, the study covers 45 neighbourhoods
located outside the camps. These are areas where 25 or more Palestinian refugee
households live together in a “gathering”. Gatherings thus typically constitute relatively homogeneous refugee communities, such as smaller “villages”, households
living in the same multi-storey residential building, along the same street, etc. 2
The LIPRIL further defines a Palestinian as any person who satisfies 1 of the
following 4 criteria:
• Currently holds Palestinian nationality;
• Is a refugee from before 1948, after 1948, or from 1967;
• Is registered with UNRWA and/or with Lebanese authorities (i.e. with the
Directorate for Refugees); or
• Holds a Palestinian Lebanese or other Palestinian passport or nationality
document.
In a few instances, households will have mixed Palestinian and non-Palestinian
members, as is the case for example when a Lebanese man has married a Palestinian
woman or vice versa. The LIPRIL covers all households where there is at least 1
Palestinian member. In other words, some households include non-Palestinian
members, while totally non-Palestinian households are excluded.3 The number of
non-Palestinian household members is, however, negligent.
The exclusion from the survey population of refugees living outside camps and
gatherings implies a limitation of the sample. The LIPRIL is not fully representative
for the entire Palestinian refugee population living in Lebanon at the time of the
survey. It is even less representative for the total population of refugees who arrived
in Lebanon as their first country of refuge, and their descendants.
The sample limitation also introduces a possible bias if the data is used to depict the living conditions of the entire Palestinian refugee population in Lebanon.
In general, it can be assumed that households that have managed to settle outside
camps and gatherings are generally better off than those that have not. Likewise they
can also be assumed to have better access to the national labour market and to other resources that are important in the conduct of their daily life. This implies that
this report probably illustrates the part of the Palestinian refugee population in
Lebanon that faces the most adverse living conditions.
2
For further references on the survey population, see Annex 1.
3
Non-Palestinian households were included in the survey sample, but are excluded in the following
analysis.
18
1.3 Community Types and Geographical
Distribution
The geographical distribution of the refugee communities across Lebanon is determined partly by historical and administrative decisions, with regard to the location of the initial refugee camps, and partly by later relocations due to space
limitation or war. The current population lives in 12 refugee camps and about 45
gatherings. These are shown in Figure 1.1.
The map demonstrates that most refugee communities are located inside or
close to the major Lebanese cities. Starting in Beirut, they are all, with one exception, located within the geographic boundary of the capital itself. A second
group is found in the Tripoli area, where two camps are located north of the city
and several gatherings are found inside it. In the Bequaa, there is one camp at the
outskirts of the city of Baalbek, and we find gatherings in two major locations of
its suburbs and in the Zahleh area. In the south, the major refugee concentrations
are located around the cities of Saida and Tyre. In both places, camps and gatherings
Figure 1.1 Map of Lebanon with LIPRIL locations of camps and gatherings.
Camps
Gatherings
Tripoli
Messaylha
Byblos
Jeita
Baalbeck
Harrisa
BEIRUT
Zahleh
Beiteddine
Anjar
Jezzine
Saida
Arnoun
Tyre
Tibnine
19
are found close to the city centres. In Saida, they are mainly concentrated in the
immediate (western) city vicinity, while in Tyre, most are found along the main
city connection roads. Given the LIPRIL design and the way the initial population
was settled across camps, three-quarters of the refugee population surveyed are camp
residents. The geographical distribution of the population is shown in Table 1.1.
As the refugee communities are of different sizes, their numbers do not reflect
the distribution of the refugee population. Almost 8 in 10 refugees covered live in
camps, while 2 in 10 live in gatherings, i.e. in communities outside the camps. The
largest refugee concentrations are found in the camps of Saida and Tripoli respectively, while the camps of Tyre and Beirut follow closely behind. The largest population of gathering residents are located in the South, around Saida and Tyre, where
Table 1.1 Distribution of the Palestinian refugee population in camps and gatherings in Lebanon
by geographic location and location type. Per cent of total population (n=19,200), households
(n=3,620) and refugee communities (n=55).* Camp + Gathering = 100 per cent.
Beirut
Tripoli
Bequaa
Saida
Tyre
ALL
Camps
Individuals
14
21
2
23
18
77
Households
15
20
2
23
18
78
7
4
2
4
5
22
3
2
2
10
6
23
3
1
2
10
6
22
20
7
9
24
20
78
Communities
Gatherings
Individuals
Households
Communities
*
Two smaller communities out of the 57 covered by the LIPRIL were not classified precisely according to these definitions.
Table 1.2 Distribution of the Palestinian refugee population in camps and gatherings in
Lebanon by geographic location and urban-rural residence. Per cent of total population
(n=19,074). Number of refugee communities in parenthesis (n=55).
City centre
City suburb
Urban area
Rural area
All
20
Beirut
Tripoli
Bequaa
Saida
Tyre
ALL
8
1
2
3
4
17
(11)
(1)
(1)
(3)
(1)
(17)
8
1
0
26
1
36
(2)
(2)
(1)
(9)
(2)
(16)
1
7
2
4
6
20
(1)
(2)
(4)
(3)
(1)
(11)
0
14
0
0
13
27
(0)
(1)
(0)
(0)
(10)
(11)
17
22
4
33
24
100
(14)
(6)
(6)
(15)
(14)
(55)
we also find the largest share of refugee gatherings. Bequaa represents the smallest
refugee area, both with regard to the number of refugee communities as well as in
terms of the region’s share of the refugee population. The distribution of households
largely follows the population distribution4.
Social and economic services and infrastructure are usually better developed in
urban and central areas than in rural and more remote areas. The surveyed refugee
population is predominantly an urban population, as 73 per cent actually live in
urban areas. Table 1.2 shows how the population and the communities are distributed across location types from city centres, across city suburbs and urban areas to
rural locations. Later in this report, we will analyse to what degree the location itself affects current living conditions.
Table 1.2. shows that the communities are more or less equally distributed across
city centres, suburbs, urban and rural areas, as could be expected from the geographical distribution detailed above. In Beirut, the majority of locations are found in
the city centre. In Tripoli and Saida, they are more frequently located in the city
suburbs or in urban areas outside the cities. In the Bequaa, they are mostly urban
based, but located outside the city itself. Finally, in Tyre, the overall majority of the
communities are rural.
The community location naturally reflects the population distribution. Nonetheless, while communities in the Beirut city suburbs are relatively few, they still
account for about half of the population here. Likewise, the Tripoli population is
largely rural. In the Bequaa, the population is shared about equally between the
Baalbek city centre and the urban areas outside the city. The Saida population is
dominantly suburban, while in Tyre the prominence of rural communities reflects
a dominant rural population.
An important implication of the LIPRIL conceptual framework is that socioeconomic variations among the refugee population will be influenced by their community type, their geographic location and the type of urban-rural setting in which
thy live. We will now turn to a presentation of our analytical framework.
1.4 A Conceptual Model of Living Conditions
Systematic analyses of living conditions have to take into account that households
and individuals are shaped by the context within which they conduct their lives.
4
In the following chapters, regions will be collapsed in order to increase the sample size within each
area and hence improve the accuracy of statistical estimates. A frequently used categorisation is a
grouping into Northern camps, Southern camps and gatherings. “North” in this context refers to
the geographical areas of Beirut, Tripoli and Bequaa, while “South” refers to Saida and Tyre.”
21
Figure 1.2 The LIPRIL conceptual framework: Living conditions as outcomes of arena selection
and distribution mechanisms.
NATIONAL POLICIES
Government
IGOs
COMMUNITY ARENAS
Markets
Services
Civil society/NGOs
HOUSEHOLDS/INDIVIDUALS
Health, education, income,
family, housing, recreation,
security, democratic rights
DISTRIBUTION
(Equality)
Living
conditions
Resources
ACCESS
(Freedom)
In her description of the Shatila experience for example, Sayigh (1994:15-34)
describes the institutional framework as a set of ”layers”, each with its specific set
of actors. The first layer is the Lebanese state (the army) and the refugee management apparatus (laws, ministries, UNRWA, the Directorate for Refugees etc.). The
second layer is the rest of the Palestinian community, with other camps and national institutions. Furthermore, each camp is situated in a specific regional, economic and social setting of friends and foes – settings that are shaped by historic
movements and sectarian mobilisation. Beyond the immediate neighbourhood,
the Lebanese political arena is present with its multitude of parties, movements
and leaderships, as well as the Lebanese economy with its particular labour laws.
Finally, beyond Lebanon, Sayigh identifies a fifth layer of the Diaspora with which
camp people still maintain close family and political links.
Following the same logic, our conceptual framework is simplified as a tripartite relationship between national policies, communities, and households or individual citizens (Figure 1.2).
Following the model, living conditions can be analysed as the outcome of interactions between individual or collective actors at 3 different levels. These are
termed as national policies, community arenas and households/individuals. Let us
take a brief look at each.
22
Access To and Command Over Resources
Starting with individuals and households, a basic premise behind the concept of
living conditions is that they are studied in terms of the individuals’ and the households’ access to and control over resources, rather than as mere descriptive labels
(Coleman 1971:3; NOU 1993:44-45). Resources may be many things, such as
monetary possessions, knowledge, psychic and physical energy, social relations,
security, work and employment, etc., with the help of which the individual can
control and consciously direct her/his conditions of life (Titmuss 1958). Describing living conditions in terms of such resources, we are thus interested in both revealing the access to resources enjoyed by groups of individuals or groups of households, as well as measuring the outcome of the use of the resources. It is therefore
necessary to study a rather wide range of aspects. The basic resources covered by
the LIPRIL are:
• Health and access to medical treatment
• Competence and opportunities to acquire education
• Employment and working conditions
• Economic resources and consumer conditions
• Family and social relations
• Housing and access to social services
• Social participation and social networks
• Recreation and cultural activity
Hence the list of indicators needed to reflect individual resources at a given point
in time is rather comprehensive. At the same time we also face the conceptual challenge of identifying combinations of resources utilised, in a situation where the list
of possible combinations is virtually endless. Ideally speaking, our measure of living conditions should cover or describe entire life situations, or in technical terms,
should be treated by a holistic approach. Problems arise however, when people with
many or few different types of resources are to be compared with each other. Does
much of few compare with a little of many? Many attempts have been made to
establish indexes that reduce such complexity into a single “physical quality of life”
index or a “human development” index. However, to date no single and universally
agreed indicator, or any measurement scale, exists on socio-economic conditions
of life, and even less so for the total life situation of humans.
The activity of converting the resources may in fact also be regarded as a living
conditions asset, whether positive or negative. Work may involve capability
23
enhancement and provide feelings of self-esteem, while the conditions under which
the work is performed may cause adverse side effects in terms of health, or in terms
of the time spent. Social participation is seen as positive in itself as it enhances individual capabilities and skills during daily interaction with the community at large.
Nonetheless, a basic problem inherent is one of linking and weighing the various resource indicators. What weight should the respective indicators listed be given
in an overall assessment of living conditions? For example, is poor health better or
worse than low income? Should high income be considered as compensating for
adverse working conditions? Is it worse to be without electricity than to be without a job? While it is generally unproblematic to assume that the situation is worse
if an individual faces several living condition liabilities than if he or she faces none,
the balancing of good and adverse situations is a complex exercise.
As long as there is no immediate solution to these problems, analyses of living
conditions tend to be confined to the examination of distributional patterns along
one or a few single indicators, to distinguish between situations that are good or
adverse. The critical question in this regard is to what degree different population
groups, for example females and males, young and old, urban and rural dwellers,
demonstrate different living conditions “profiles”. Again, the reader should be aware
that a straightforward comparison across households or individuals is rather problematic. Those concerned may evaluate similar situations differently. Some may
consider the lack of public transport a huge problem, while for others it makes no
difference. The LIPRIL addresses this problem by asking households and individuals about their own judgement and by letting them assess their own situation.
Communities Represent “Arenas” for Resource Conversion
Moving one step up in the conceptual framework (Figure 1.2), individuals and
households are described as living in communities where they utilise their resources to improve future living standards. Therefore, the qualities of these communities, such as for example the presence of local markets and institutions, influence
the way individuals and households actually can use their resources, as well as the
outcomes they obtain.
In studies of living conditions, the arena concept is of crucial importance, and
relates to two regulating principles, i.e. those of freedom and equality. An arena is
simply a place where individual resources can be interchanged, for example educational institutions, labour markets, the hamula etc. Assuming that an individual or
a household possesses a set of resources, these resources can be invested in the various arenas and converted into qualities of life or improved living conditions. In
chapter four, we will for example see how learning skills (resources) are invested
within the educational system (the arena) to obtain formal competence (outcome).
24
In chapters 5 and 6, we see how formal education and skills are further invested
in the labour market for occupational prestige and economic rewards. In chapter
seven, we look at how income is invested in for instance the housing market to
improve the dwelling standard, etc.
For the individual and the household, it is thus crucial both to have resources and
to live in a community where these resources can be utilised to improve future living
conditions. Hence utilisation is dependent on arena access. Arena access is furthermore regulated by selection mechanisms, where individuals have varying degrees of
freedom or the ability to make choices and to pursue their individual life projects. It
is, for example, well known that females in the Middle East participate less frequently
at the labour market than men, partly due to social norms and informal regulations.
When measuring living conditions, we thus attempt at identifying whether a given
distribution of an outcome is the result of individual choice, of inequalities in access to resources, a result of differences in the availability of arenas or of quality
variations related to the constitution of a given arena.
National and International Agencies Frequently Intervene Arenas
Moving to the top level of our conceptual framework (Figure 1.2), it is seen that
national or international actors may also intervene at the community arenas. The
community level is thus crucial also to the design of social assistance, as it is often
here that public or other interventions can be made in order to improve living conditions. Typical initiatives made by such actors are made in the form of infrastructure provision or through regulation or deregulation of markets and prices. A significant trait in this regard is the legal and institutional restrictions facing the
Palestinian refugees in Lebanon as long as they are not considered Lebanese
nationals.
Initiatives from national or international actors can be taken to eliminate hindrances for certain groups to arena access, or access to resources. Positive access
“discrimination” may in some instances be required to ensure that those most in
need of a service actually obtain it. Norms, traditions, factors of supply and demand
may favour some groups in their competition with others for access, and these may
be supported or compensated through arena intervention. The UNRWA “hardship
classifications” is one example of attempts at identification and support of refugees
deemed mostly in need.
As seen above, arenas have a distributive capacity in shaping the outcome of
individual resource “investments”. Educational institutions, labour markets and
housing markets all produce winners and losers. “Social justice” considerations will
thus typically be involved in the outcome assessment by national or international
agencies. As a rule such considerations will be based on premises of equality, implying
25
that large differences in affluence or poverty are deemed in opposition to human
dignity. From one perspective, a society characterised by equality can be valued
as a better society than one characterised by high levels of inequality in its own
regard. From another perspective, it can be argued that some inequality is of value either if it means that special qualifications are rewarded or if it implies stimulating people to act. Strict equality may be considered counterproductive to socio-economic development.
When analysing living conditions from the national perspective, we look mainly for 3 basic distributive patterns in the arena distribution outcome (Iversen et al
1979). First, heaping indicates that a good or bad situation as measured along one
living condition dimension, tends to go along with the same quality along other dimensions. Those with the highest education, for example, tend to have the best jobs,
the highest economic reward, and vice versa. Second, compensation indicates that
an advantage in one field is counterbalanced by disadvantages along other dimensions. Those living in urban areas may have access to many services, but at the same
time they are also often exposed to noise and pollution. Finally, independence indicates that there is no particular association between the different indicators. The
following chapters will provide many examples of such patterns.
Yet we still have to admit that the concrete processes that create well-being and
welfare through interaction among household members, as well as their activities
at the various arenas across time, remain largely undiscovered by the survey. Additionally, time series data is scarce. As in most studies of living conditions, the following analysis will direct focus at a comparison of living condition distributions
between various population categories at a given time, i.e. January to February
1999. While the analysis will be directed at identifying selection and distribution
mechanisms, it will be difficult to formulate exactly the processes working behind
the observed outcomes.
1.5 Report Outline
Following the conceptual framework of Figure 1.2, the report is organised in chapters that systematically describe the survey results across 7 aspects of living
conditions: health; education; employment and working conditions; household
economics; housing and environment; social networks; and attitudes and social
participation (chapters 3-9). At the very beginning of the report (chapter 2), we
provide an in-depth demographic analysis of the population and its growth, which
serve as background for the subsequent analysis of living conditions. In the final
26
section (chapter 10), we will draw the combined picture that emerges when these
aspects are put together, and linked within the analytical framework.
27
28
Chapter 2 Population
Marwan Khawaja
2.1 Introduction
This chapter examines basic aspects of the demographic situation of the Palestinian population living in camps and gatherings in Lebanon, as revealed in the 1999
LIPRIL survey data. Population patterns are of great interest mainly because they
relate closely to other social and economic changes that are of relevance for assessing the living conditions of the refugee population. Components of demographic
change, including migration, fertility and mortality trends, reflect momentous social changes, and have important consequences for the provision of health and educational services as well as for the labour market. Other structural features of the
population, particularly the age distribution and household composition, are among
the most important factors contributing to the relative socio-economic standing of
refugees.
The quality of the age data is of considerable importance in household surveys
because the age distribution is needed for various estimates. Age was derived from
date of birth, although in some cases date of birth will have been imputed or otherwise calculated from completed age. One way to evaluate the accuracy of the age
data is to examine the extent of age heaping in convenient digits, most commonly
0 and 5. Two indexes are used to evaluate the amount of heaping found in the age
data: Whipple and Myers (Shryock and Siegel 1976:114–119). Though some digit
preference occurs, the quality of age reporting is generally good. The Myers’ Blended Index of digit preference is 4.8 for males and 4.1 for females. The Whipple Index of preference for 0 or 5 is 107, indicating a slight heaping. There was obvious
heaping for the digit zero as expected, but also for digit nine. Surprisingly, no heaping
was found for digit five. It is difficult to explain the pattern of digit preference found
in the data.
For most demographic estimates, the single-year age data are less important than
age-grouped data. Examining age ratio scores derived from grouping the survey data
by 5-year age groups can also assess the quality of the age reporting (see Shryock
and Siegel 1976:124–126). Lower age ratio scores indicate that the age distribution
progresses smoothly, i.e. no surplus or deficits. Age ratio scores of 2–3 indicate high
quality data, while scores of 8–9 indicate inaccurate age reporting. The scores found
29
in the LIPRIL data were 7.9 for males and 11.8 for females, indicating inaccurate
age reporting overall. Examination of the age ratios by age groups revealed some age
misstatement for females of reproductive ages. Some age shifting might have been
the reason for the patterns found, but selective migration cannot be ruled out.
Otherwise, both variables, age in completed years and year of birth, were virtually complete. However, substantial proportions of the day and month of birth of
household members were missing: 52 per cent were missing the day of birth, month
of birth, or both. Other variables were generally well reported, with low levels of
non-response. Data used in fertility, mortality and migration estimations are discussed in the relevant sections.
Young and mobile population
The analysis demonstrates that mortality and fertility have been falling rapidly to
low levels. Marital fertility is still high, but has also begun to drop substantially. Age
at marriage is quite high by Arabic standards, and the proportion of females remaining single is exceptionally large. The fall in fertility, owing mainly to a rapid decline
in the proportion of women married, has been paralleled by a recent expansion of
family planning services. Households are relatively small in size for a camp population, and a high proportion of them are headed by females compared with the refugee population in Jordan and Palestine. The population structure and direct evidence of migration suggest that the refugee population in the camps and gatherings
has been experiencing large movements into and out of the camps, mainly due to
the civil wars. The vast majority of households have relatives living abroad, with
about half of them having relatives in Europe.
2.2 Population Structure
The gender ratio of the population is 981 males per thousand females. This is lower than expected, but could be explained by sex-selective labour migration. The
pattern of gender ratios by age groups found in the data is somewhat unusual (Figure 2.1). Gender ratios for those aged 30 and over are generally too low; the ratios
increase from age 10 to age 24, which is not consistent with what would be expected. The pattern found for older ages may largely be a reflection of past history rather
than data errors. However, it is difficult to explain the deficit of females in the age
groups 15–24 other than to suggest an intended omission – a cultural practice in
the Arab context is to “hide” females of marriageable ages during enumeration.
30
Figure 2.1 Sex ratios by age (unadjusted).
Males per 100 females
140
120
100
80
60
40
20
0
0- 4
5-9
10-14
20-24
30-34
40-44
50-54
60-64
70-74
80-84
15-19
25-29
35-39
45-49
55-59
65-69
75-79
Age groups
Given the above and recent trends in the levels of fertility and mortality, the population age-sex structure found in the data seemed highly irregular, especially at younger ages. We used the survey age distribution, the survivorship rates and age-specific
fertility rates to assess the extent of omission, or age shifting, in the data. The procedure used is simply a reverse projection of the population to 5 years prior to the
survey year. The result is an adjusted population that is consistent with the mortality and fertility levels found during the 5 years preceding the survey. We have chosen not to smooth, or otherwise adjust, the part of the population aged 10 years
and over, owing to uncertainties with regard to migration in and out of the camps
or gatherings.
A Young Population
Figure 2.2 shows the adjusted population structure. Up to age 34, its shape reflects
the typical age structure of a population with low or rapidly declining fertility.
However, the profile of the upper part of the pyramid is quite irregular. The distortion observed is perhaps a reflection of the political and economic instability during the civil war, which motivated many to migrate.
The female deficit in the age group 15–24, as already pointed out above, is also
unusual, but cannot really be explained by out-migration. The pyramid also shows
that the population is still rather young, despite the recent decline in fertility. The
proportion of the population aged less than 15 years is 37 per cent. The population is older, however, than camp refugees elsewhere.
Based on a working age of 15–64 years, the dependency ratio is 726 dependents
per thousand population of working age. Some regional differentials in the population structure are expected, given the greater reductions in fertility in the gatherings and Northern camps as well as migration. An examination of the dependency
31
Figure 2.2 Population by age and sex.
80-84
Male
Female
75-79
70-74
Married
Single
65-69
60-64
55-59
50-54
45-49
40-44
35-39
30-34
25-29
20-24
15-19
10-14
5- 9
0- 4
1400 1200 1000 800 600 400
200
0
0
200 400 600 800 1000 1200 1400
Table 2.1 Dependency ratio.
Camp North
Camp South
Non camp
Total
Mean
0.94
0.97
0.88
0.94
0-0.3
30.13
27.30
30.14
28.98
0.31–0.99
22.66
23.69
26.39
23.91
1–1.99
28.32
30.50
27.04
28.92
2+
Total
18.88
18.51
16.43
18.18
100.00
100.00
100.00
100.00
ratios at the household level shows that this is indeed the case. As shown in Table
2.1, the mean of the dependency ratios is lowest in the gatherings (0.88) and highest in the Southern camps (0.97). The distribution of households by grouped dependency ratios shows little variations between the Southern and Northern camps.
2.3 Marriage
In the Arab countries, marriage marks the beginning of socially sanctioned exposure
to pregnancy and subsequent childbearing. Thus, age at marriage is one of the most
important determinants of fertility and hence population growth in this context. It
32
is also an important indicator of women’s health and socio-economic status. Early
and universal marriage is customary in the Arab world, especially for females. More
recently, however, there has been a trend towards later marriages and higher rates
of celibacy in many countries. This trend is evident in Lebanon, with a direct bearing on fertility behaviour.
More Single Women in the Camps
The distribution of the respondents by marital status shows that about 37 per cent
of women and 46 per cent of men are unmarried (Table 2.2). Given the age structure of the population as a whole, these percentages should be considered very high.
The discrepancy between men and women who were never married can be explained
by the significantly higher proportion of women widowed (11 per cent) than men
Table 2.2 Marital status by age and sex. Per cent.
Age and sex
Single
Married
Widowed
Divorced
Separated
Total
Male
15
99.91
0.09
0.00
0.00
0.00
100
20
89.40
10.06
0.11
0.43
0.00
100
25
58.56
39.97
0.27
0.94
0.27
100
30
22.50
75.25
0.14
1.97
0.14
100
35
8.69
90.02
0.18
0.55
0.55
100
40
4.86
92.43
0.27
2.16
0.27
100
45
4.20
94.96
0.42
0.42
0.00
100
50
3.86
93.82
0.77
1.16
0.39
100
55
0.43
97.44
1.71
0.43
0.00
100
60+
0.83
87.95
10.23
0.66
0.33
100
45.89
51.86
1.30
0.78
0.17
100
88.85
10.67
0.19
0.19
0.10
100
Total
Female
15
20
54.32
44.07
0.25
1.36
0.00
100
25
37.75
58.82
0.86
2.33
0.25
100
30
32.49
61.54
2.87
2.87
0.23
100
35
25.04
65.65
6.09
2.71
0.51
100
40
19.90
66.75
8.82
3.27
1.26
100
45
17.41
65.19
12.59
3.70
1.11
100
50
11.14
65.98
21.11
1.17
0.59
100
55
5.17
66.21
26.21
1.72
0.69
100
60+
1.92
45.52
50.51
0.90
1.15
100
37.00
49.71
11.02
1.80
0.47
100
Total
33
Figure 2.3 Proportion of males and females never married.
Per cent
100
90
80
70
60
50
40
30
20
10
0
15
Male
Female
20
25
30
35
40
45
50
55
60+ Age
(1 per cent). Thus, remarriage rates following divorce or widowhood are higher for
males than for females.
Marriage may no longer be considered universal among the Palestinian refugees
in Lebanon’s camps and gatherings. As observed in Figure 2.3, about 20 per cent
and 17 per cent of females in the age groups 40–44 and 45–49 years respectively,
were never married and the general trend shows an upward movement of these proportions. The corresponding percentages for males in the age groups 30–34 and 35–
39, were 23 and 9 respectively. The proportion of men and women who never
married in the younger age groups is remarkably high. In the age group 25–29, for
example, about 59 per cent of men and 38 per cent of women remain unmarried.
At the other extreme, in the age group 50–54, about 4 per cent of men and 11 per
cent of women are never married, which is quite astonishing for an Arab population.
The proportions widowed in all age groups are relatively high, especially for women. By the age of 35–39, about 9 per cent of females are without a spouse owing to
widowhood, divorce or separation, compared with only 1 per cent of males. By the
age of 50–54 as many as 23 per cent of females but only 2 per cent of males are
without a spouse.
A Recent Decline in Age at First Marriage
The singulate mean age at marriage is estimated at 25.3 for females and 28.5 for
males. This is considered relatively high for a developing country population. However, singulate mean age at marriage, which is commonly employed in surveys to
examine trends in the pattern of marriage, may not be a very precise measure when
nuptiality patterns are changing (United Nations 1983). Therefore, measures of the
central age at first marriage, such as the median age, are used to analyse recent nuptiality trends.
34
Figure 2.4 Median age at first marriage.
Median age at first marriage
30
Male
Female
25
20
15
10
5
0
15
20
25
30
35
40
45
50
55
60
65
70
75
80 Current age
The median age at first marriage among all ever-married women is 18 years and 23
years for men. These should be considered relatively low, even in the context of the
Arab world. Interestingly, the data (Figure 2.4) suggest that the median age at marriage has actually decreased in the most recent years. The median age at first marriage for the cohort currently aged 20 to 24 years is lower than for older age cohorts
in reproductive ages. This indicates that older cohorts are of a higher age at marriage than their younger counterparts. Trends over the entire age range (15–90) show
an overall increase for both men and women, but they are not consistent. An examination of the mean age at first marriage shows the same picture – during the
entire period, the highest mean age at marriage is reported for those aged 40–49.
The contraction in the marriage market, educational opportunities, changes in the
overall living conditions of the population, or all of these factors, may have been
behind the consistent increase in age at marriage.
2.4 Fertility
The current fertility rates can be estimated directly from birth history data. This
method usually leads to good estimates, owing to little omission and under-reporting of births in this kind of data relative to other sources. However, retrospective
birth history data are subject to common problems of age heaping, missing or incomplete information, as well as misstatement of the ages or birth dates of children.
Systematic displacement of children’s birth dates is especially common in a DHStype survey such as this one. Specifically, children born in the 5 years preceding the
survey date have their dates of birth shifted backward by interviewers in order to
35
avoid asking numerous questions (relating to health) to children born after this date
(Arnold 1990). According to Blacker (1994), this tendency of birth displacement
inflates the number of births between 5 and 10 years prior to the survey at the expense of those recorded for the 5 years preceding the survey, “thus simulating a fertility decline.”
An examination of the year of birth distributions of children reveals evidence of
a slight concentration of births in 1993 and 1996, corresponding to 6 and 3 years
preceding the survey. Another way to assess the extent of age shifting is to compute
birth year ratios for the years concerned. The values of these ratios would be around
100 in the absence of displacement; but they are 98 and 104 for 5 and 6 years preceding the survey, indicating a small degree of displacement. However, the problem is greater for dead children than those surviving. While these results do not have
serious implications for fertility estimation, we have chosen to calculate the rates
for periods of 4 years preceding the survey instead of the conventional 5-year periods, in order to minimise the impact of this problem.
Low Levels of Fertility for a Palestinian Population
The total fertility rates (TFR) and the marital total fertility rates (MTFR) for selected periods are shown in Figure 2.5. Fertility levels are relatively low – the TFR
is estimated at 3.0 children per woman during the 4 years preceding the survey.
Indeed, this is the lowest level ever reported for a Palestinian population. However, this level of fertility is higher than the TFR of 2.5 reported for Lebanese women
in 1995 (Lebanon Ministry of Public Health 1996).
The refugee population in camps and gatherings has also experienced a noticeable decline in fertility. The TFR declined from about 4.5 children per woman in
the 1987–1990 period to around 3.9 children per woman in the period 1991–1994.
During the entire 12-year period, TFR decreased by about 1.5 children on average,
amounting to a decline of 33 per cent. Thus, the decline is more noticeable during
the past eight-year period than before.
Figure 2.5 Total fertility and total marital fertility by time period.
Total fertility
8
TFR
MTFR
6
4
2
0
36
198790
199194
199598
Figure 2.6 Total fertility by region.
Total Fertility
6
198790
199194
199598
4
2
0
Camp North
Camp South
Gathering
However, levels of marital fertility are still high, as shown in Figure 2.5. The MTFR
is estimated at 6.32 children per married woman in the most recent period, suggesting that changes in nuptial patterns are responsible for much of the decline in
fertility. However, marital fertility has also been declining, although at a slower
pace. It declined from 7.59 in 1987–1990 to 6.32 in 1995–1998, amounting to
about 17 per cent. Most of this decline occurred only recently, as clearly shown in
the Figure. The rather wide gap between the TFR and MTFR found for the population here is also observed among other populations in the Middle East, and should
not therefore be surprising. It is perhaps important to point out that such levels of
marital fertility are still lower than those observed among Palestinians elsewhere, and
have been declining rapidly.
Figure 2.6 shows that the decline in fertility levels is observed across regions, but
more marked in the gatherings. In each of the regions, the TFR declined by about
1.5 children during the 1987–1998 period. The gatherings maintained lower levels of fertility than the camps across the 3 time periods. During the 4-year period
preceding the survey, TFR in the gatherings was 2.62 compared to 3.07 in the Southern camps and 3.2 in the Northern camps. These regional differentials are larger in
magnitude compared to earlier periods, suggesting a regional divergence in the rates
of fertility, and, perhaps, population growth. It is not clear at this point whether
access to contraceptives, other health services, or other mechanisms produced such
differences.
The fertility decline is also evident across all educational groups (Figure 2.7).
Women with elementary and preparatory education experience the most dramatic
decline in their fertility – by 2 and 3.5 children across the three 4-year periods.
Such changes in the levels of fertility during a mere 12-year period are implausibly high. Measurement errors especially in the education data cannot be ruled out
as a possible explanation. On the other hand, there are very little fertility differentials between the 4 educational groupings during the most recent period. Nor
37
Figure 2.7 Total fertility by education and time period.
Total fertility
8
198790
6
1991-94
4
199598
2
0
Below elementary Elementary
Preperatory
Secondary or more
is the expected inverse relationship between fertility and education evident (in any
of the periods). As shown in the Figure, the fertility level is highest among women with elementary education during the most recent period, and among women
with preparatory education during the 2 previous periods. The lack of a uniform
relationship between education and fertility is found in many developing countries, especially during the early phases of the fertility transition (United Nations
1987; Cochrane 1979). One explanation for this pattern is the abandonment by
women with little education, of traditional methods of fertility controls, especially breastfeeding, (see, Lesthaeghe and Jolly 1995; Jain 1981).
The age-specific fertility rates, as displayed in Figure 2.8, show a broad flat top
distribution. The fertility rate is highest among women aged 20–24, and it declines
thereafter. However, the marital age-specific fertility rate (not shown) is highest
among women aged 15–19 years. Age-specific fertility rates for all age groups were
lower in 1987–1990 than in 1995–98, indicating that the decline of fertility is
evident regardless of age. However, the Figure demonstrates that the decline is
especially rapid in the last 2 periods. The pattern of decline for older women gives
preliminary evidence regarding the increased use of contraceptives. Overall, the age
pattern of fertility has changed considerably during the period 1987–1998; the shift
Figure 2.8 Age specific fertility rates by period.
Fertility Rate
0.25
198790
0.20
199194
0.15
199598
0.10
0.05
0.00
38
15-19
20-24
25-29
30-34
35-39
40-44
45-49 Age groups
is evident from a rise in the mean age at childbearing by over 1 year during the
1979–98 period. This suggests that childbearing is taking place relatively earlier
than previously.
A Rise in Age at Childbearing, Especially at Higher Parities
The total fertility rate reflects the fertility level observed in a given year or period,
and hence it is affected by changes in the timing of childbearing. More specifically,
increases in the age at childbearing can depress the TFR, implying lower fertility
than it would have been without this “timing” effect (see, Bongaarts and Feeney
1998). An examination of changes in the timing of childbearing for all births by a
cohort of women would perhaps lead to misleading conclusions as reduction of
fertility usually occurs at higher birth orders. Changes in the weights for different
birth orders can have varying impacts on the overall quantum changes in fertility.
It is important, therefore, to examine changes in the mean age at childbearing by
birth order.
Figure 2.9 displays trends in the order-specific mean ages of women (aged 15–
54) at birth for the first 5 parities. Between 1979–83 and 1994–1998, the mean
age at childbearing for births of all orders rises from 25.8 to 26.96 years, which
amounts to an increase of only 1.16 years. Such an increase during a period of more
than 20 years is very modest indeed, suggesting little timing effect on fertility. However, during the same period, the mean age at first birth rises from 20.78 to 22.4
years and the mean age at second birth rises from 22.42 to 23.8 years, amounting
to an increase of about 1.5 years on average. The increase is more substantial for
birth orders 3 to 6, which amounts to nearly 2 years each as shown in the graph,
and implying a clear timing effect that depresses fertility.
Figure 2.9 Mean age at birth by birth order and time period.
Age
30
5th
4th
3rd
28
26
24
2nd
22
1st
20
18
<1979
197983
198488
198993
199498
39
Contraceptives Widely Used
The awareness about contraceptives is very high among the Palestinians in camps
and gatherings in Lebanon (Table 2.3). The pill is the most widely known contraceptive. Almost every woman (99 per cent) aged 15–54 mentions that she has heard
of the pill and IUD. The second best known modern contraceptive methods are the
condom and “tubal ligation”, which are referred to by about 91 per cent of the
women. A smaller percentage of women refers to the diaphragm (81 per cent), and
an even smaller percentage has heard of male sterilisation (65 per cent) or injections
(67 per cent). As for traditional methods, breastfeeding is the best known, with about
94 per cent of the women referring to this method.
As shown in Table 2.3, there is a close correspondence between knowledge of
and ever use of contraceptive methods. Thus, the pill is the most ever used method, followed by the IUD, with about 50 and 40 per cent of women using them
respectively. Interestingly, the women interviewed have not tried the remaining modern methods much. The third ever-used method is periodic abstinence, with 15 per
cent of women reporting usage. Breastfeeding is ever used by about 13 per cent of
the women interviewed. Surprisingly, about one-fifth of the women interviewed report using a method (most likely traditional) other than the ones mentioned.
Table 2.4 summarises data related to current contraceptive use among currently married women aged 15–49. The contraceptive prevalence rate (CPR) is 66 per
cent, of which 53 percentage units are using a modern method. About a third of
currently married women are using IUDs or the pill. Given the small sample size
of the women included, method-specific rates are not reported here.
The differentials in contraceptive use are in line with the fertility differentials.
There is a gap in the level of contraceptive use between gatherings and refugee camps,
corresponding to prevailing levels of fertility there. In gatherings, about 64 per cent
Table 2.3 Women’s awareness and use of contraceptives. Per cent of women aged 15 and above.
Method
Knows
Pill
99.29
Ever used
49.94
IUD
98.93
40.00
Injections
67.25
1.35
Diaphram
81.19
6.23
Condom
91.91
6.23
Tubal ligation
91.04
2.49
Male sterilization
65.00
0.44
Abstinence
89.65
14.98
Withdrawal
80.97
12.73
Breastfeeding
93.64
13.37
-
20.92
Other methods
40
Table 2.4 Current use of contraceptives among currently married women aged 15-49. Per cent.
Method of contraception used
Age
Not using
Modern only
15–19
80.0
20.0
Traditional
0.0
Total
100
20–24
40.9
39.8
19.4
100
25–29
34.1
52.0
13.8
100
30–34
24.7
63.7
11.6
100
35–39
28.6
57.1
14.3
100
40–44
28.4
60.5
11.1
100
45–49
50.0
44.0
6.0
100
Total
34.2
53.1
12.7
100
of currently married women use modern contraceptives; in the Northern camps,
the figure is 44 per cent. Traditional methods are more used in the Northern camps,
compared to Southern camps or gatherings, but caution should be taken here because of the small differences given in the sample size. While the level of contraceptive use in the 3 residential areas is relatively high, there is still a significant percentage point gap between them.
Contraceptive use also varies by age and education. Women with more education are more likely to use contraceptives, but there are little variations with respect
to the use of modern methods. Thus, while almost 70 per cent of women with at
least preparatory education use contraceptives, 60 per cent of those with less than
elementary education do so. However, the variations are mainly due to differences
in the use of traditional methods. Only women with preparatory education are more
likely to use modern methods compared to others, corresponding with observed
levels of fertility differentials by education discussed above.
The age pattern of contraceptive use shows some resemblance to the age pattern of fertility, indicating perhaps some use of contraception for spacing purposes
rather than only termination of childbearing. As shown in Table 2.4, the use of modern contraceptives initially increases rapidly with age – from 20 per cent for women aged 15–19 to 52 per cent for those aged 25–29. It then stabilises until age 44,
decreasing thereafter to 44 per cent. The rates of use found among younger women
aged less than 24 years are quite low, as is the case in many other Arab countries.
Most of the diffusion in contraception has taken place during the past decade, which is a reflection of the concerted efforts of the non-governmental organisations (NGOs) to provide necessary health services on the grounds. UNRWA
clinics are the main source of contraceptive methods for first users, accounting for
about 38 per cent (Figure 2.10), and this is the same throughout the regions.
However, the percentage is significantly higher in the gatherings (42 per cent) than
in camps in the North (34 per cent). Other (mother and child health and family
41
Figure 2.10 Source of contraceptives for first users. Per cent of currently married women who
ever used contraceptives.
Other
Family planning clinic
Mother and child health clinic
Hospital
Doctor
Pharmacy
UNRWA
0
10
20
30
40
Per cent
planning) clinics are referred to as the main source of supply for first users by about
9 per cent of women. Apparently, first users obtain contraceptives directly from
the pharmacy (23 per cent) or medical doctors (17 per cent) more than health clinics
– and this is especially true in the Northern camps.
Yet there is still some reliance on traditional methods, which account for as many
as 13 per cent of all current users in 1998. Besides, the present users of family planning are predominantly older couples with relatively high parities. The fertility
impact of modern contraception, although substantial, remains somewhat limited.
In other words, there exists ‘unmet need’ for contraception. About 28 per cent
of currently married, non-pregnant women aged 15–49 are identified as having an
unmet need. This also includes about 2 per cent with an unmet need, but who are
breastfeeding. The rate of the unmet need is higher in the Northern camps (35 per
cent) than in the Southern camps, (25 per cent) or gatherings (24 per cent).
Short Birth Intervals
Summary measures of the birth interval lengths give an insight into the speed of
reproduction. It is widely believed that in the Arab countries, contraceptives are
mainly used for stopping rather than spacing behaviour (see Eltigani 1998; Fargues
1989; Kouaouci 1994). Hence, birth intervals are expected to be relatively short,
especially at lower parities. It is thus of interest to examine whether this conclusion
holds true in the Lebanese context.
Table 2.5 presents the distribution of birth intervals to ever-married women aged
15–49 for births occurring during the 5 years preceding the survey. As shown in
the Table, birth intervals are quite short. About 32 per cent of births have a preceding interval with less than 18 months in length overall. The median length for all
births, a common measure of the speed of reproduction, is 23.3 months and the
modal interval is 17 months. While these birth intervals are longer than comparable ones for Palestinian refugees in Jordan and Palestine, they are still relatively short,
42
Table 2.5 Birth intervals for women aged 15-49 during the 5 years before the survey by age,
birth order, region and educational attainment.
Spacing in months
7-17
18-23
24-35
36-47
48+
15
47.22
19.44
20
28.57
15.53
Total
Median
25.00
5.56
2.78
100
18.05
35.40
17.39
3.11
100
24.47
Age of mother
25
28.86
22.15
30.20
14.77
4.03
100
23.55
30
36.47
21.18
28.24
9.41
4.71
100
21.68
35
Birth order
46.67
13.33
33.33
6.67
0.00
100
20.91
2–3
33.61
17.21
33.61
13.93
1.64
100
23.36
4–6
30.86
19.75
29.63
13.58
6.17
100
23.58
7 or more
30.95
23.81
28.57
11.90
4.76
100
22.63
Region
Camp North
34.92
18.52
33.33
10.05
3.17
100
22.49
Camp South
29.48
16.18
32.95
16.18
5.20
100
24.02
Gathering
31.40
25.58
24.42
17.44
1.16
100
22.33
42.19
19.53
24.22
10.16
3.91
100
21.56
Education
Less than elementary
Elementary
29.51
19.13
32.79
13.66
4.92
100
23.88
Preparatory
30.43
16.30
35.87
15.22
2.17
100
23.98
Secondary or more
19.51
21.95
39.02
19.51
0.00
100
25.38
Total
32.37
18.75
31.70
13.62
3.57
100
23.34
confirming the expectation that the study population practices contraception more
for stopping of childbearing rather than spacing.
However, examination of the medians by age of mother indicates that spacing
is probably becoming more widespread than before. With the exception of education, the median does not vary much by regional, social or demographic characteristics. Education seems to be an important factor in the spacing of births by Palestinian women. Thus, while about 42 per cent of births by women with less than
elementary education have a very short birth interval (less than 18 months), only
20 per cent of women with secondary education or more do so.
43
2.5 Infant and Child Mortality
Infant and child mortality estimates, for different periods preceding the survey,
are calculated directly from the birth histories of all sampled women, providing
data on dates of birth. If the child has died, the age at the time of death for each
live-born child is used for calculation. Issues of data quality discussed above also
apply to the mortality data. However, there are particular biases affecting this kind
of data. For one, some children who die during infancy are omitted, causing a
downward bias in the mortality estimates. Moreover, the resulting omission is
generally selective with respect to the age of women as well as the timing of death.
An examination of sex ratios at birth for dead children (not shown) indicates some
omission of infant girls. The reporting of age at death, or date of death, is another
kind of error affecting the mortality estimates. It is likely that these errors cause
some underestimation of infant mortality, but it is doubtful whether they have any
significant impact on child mortality as such. Furthermore, child mortality appears
less sensitive to other biases resulting from the estimation procedure (Fargues and
Khlat 1989). We therefore focus on child mortality in examining mortality
differentials.
Low Levels of Infant and Child Mortality
The infant mortality rate (IMR) is relatively low (Figure 2.11). It was about 32 per
thousand live births during the 5-year period preceding the survey. In the two 5year periods preceding the survey, the IMR fell by 9 per cent – from an estimated
35 per thousand to 32 per thousand. Likewise, child mortality (5q0) declined by
about the same magnitude, from 40.3 to 37.3 per thousand, during the 10-year
period preceding the survey date. Although comparatively low, these mortality levels
are higher than those observed among the camp populations elsewhere, notwithstanding their higher levels of fertility.
Figure 2.11 Infant (IMR) and child (U5MR) mortality rate.
Rate
50
IMR
U5MR
40
30
20
10
0
44
198993
199498
Table 2.6 Child mortality rates by sex, residence and time period.
Male
Female
Camp North
Camp South
1984–88
5q0
Ratio
39.26
41.74
0.9
52.39
2.2
38.80
1.7
1989–93
5q0
Ratio
44.64
41.32
1.1
49.49
2.1
46.74
2.0
5q0
45.49
28.13
44.51
38.57
Gathering
23.43
23.73
19.99
1994–98
Ratio
1.6
2.2
1.9
As shown in Table 2.6, there is an excess of mortality among boys, compared to
girls, which appears to increase over time. The under-5 mortality level increases
slightly for boys, from 44.6 to 45.5 per thousand in the 2 5-year periods preceding the survey. During the same period, child mortality decreases for girls from
41.3 to 28.1 per thousand. Thus, the ratio of male to female mortality levels during the 5 years preceding the survey is 1.62. Further examination reveals that most
of this gap is accounted for by the gender differential in infant mortality levels,
especially their neonatal mortality component. While infant mortality among girls
is expected to be lower than that of boys in most cases, the gap found is implausibly large and also quite inconsistent with earlier levels and differentials. This
suggests that the excess mortality of boys can be the result of an underreporting
of female deaths in the survey. Part of the gap, however, can be attributed to the
wider vaccination coverage after the war years, or the reduction of the occurrence
of certain diseases affecting girls more than boys, or both.
Table 2.6 also shows that significant regional differentials exist for mortality
levels during the five-year period preceding the survey. Child mortality rates in
the Northern camps (44.5) are higher than those in either the Southern camps
(38.6) or the gatherings (20). The level for the gathering is implausibly low, owing perhaps to the sample size for this category. Nevertheless, the observed pattern
of these regional differences may be close to reality, suggesting high levels of health
conditions or health services in the Southern camps and gatherings, compared to
the North.
2.6 Household Size and Composition
Small Households, Compared to Refugee Camps Elsewhere
On average, households are generally small, at least compared to Palestinian refugee
camps elsewhere. The average household size is 5.3 persons, with little variations
between regions. Contrary to what would be expected (at least with respect to
fertility levels), households in the gatherings are slightly larger (5.4) on average.
45
Figure 2.12 Household size.
Per cent
16
14
12
10
8
6
4
2
0
1
2
3
4
5
6
7
8
9
10+ Household size
There are also slightly more large households than small ones, but the distribution
of household size is approximately “normal” (Figure 2.12, see next page). Overall,
almost 1 out of 5 households consists of 8 persons or more. Larger households are
more common in the gatherings and Northern camps than in the Southern camps.
In general, households headed by men tend to be larger (5.7 persons) than those
headed by women (3.6 persons).
In the population as a whole, women head over 17 per cent of households,
which is considered high from a regional perspective. The majority of women who
head households are with children, the rest being primarily loners or widows living with other relatives. The gender composition of household headship reflects a
predominantly patriarchal structure of families and households.
This is evident in the living arrangements of the population. There are relatively few extended households: only 15 per cent of households consist of extended families. Extended family households are even less common in the Southern
camps (with about 13 of the households consisting of extended family units), than
in the gatherings or the camps in the North (about 17 per cent). The regional differentials in household composition should not be surprising given the differences in fertility levels observed between the regions. About one-fifth of the femaleheaded households contain extended families (Figure 2.13); the corresponding
figure for male-headed households is 14 per cent. This differential is perhaps due
Figure 2.13 Household type by headship.
Loner
Childless couple
Couple w/ children
Single w/ children
Extended
80
100 Per cent
Female head
Male head
0
46
20
40
60
to the economic standing of female-headed households, forcing them to doubleup in a way not typical of male-headed households. As expected, significant gender differences also exist across the other types of living arrangements. Femaleheaded households are more likely to be loners (23 per cent) or singles with children
(57 per cent) than male-headed households, with corresponding percentages of
nearly 2 per cent. On the other hand, men head virtually all households consisting of ‘married couples with children’ and ‘childless couples’. There are little regional differentials in these patterns, at least with respect to the North-South distinctions used here.
2.7 Migration
As seen in chapter one, Lebanon was one of the main receivers of Palestinian
refugees on the eve of the 1948 war. Since then, the Arab-Israeli conflict has
continued to play a major role, sometimes indirectly, in shaping the population
composition of Lebanon. The civil war, especially, during the 1970s and 1980s,
contributed to a massive movement of people within Lebanon, but also across the
borders, making Lebanon one of the largest senders of refugees in the Arab world.
During and after the civil war, both the Palestinians and Lebanese have moved
mainly to escape military conflict and the recurrent security threats. Others have
moved for better economic opportunities, for schooling, or simply to join other
family members.
We will now shed some light on the migration experience of refugees in Lebanon. While UNRWA and the Lebanese authorities have administrative records
that can be used to describe the movement of Palestinian refugees, registrationbased data on migration are quite limited in scope and are usually poor, owing in
part to the difficulties during the war years. Hence, the LIPRIL provides quite
detailed information on migration. The data can be used to describe 3 kinds of
migration: (1) lifetime migration, which refers to individuals who have moved since
birth; (2) period migration, which is defined here as the movement of individuals
within a period of 5 years preceding the survey; and (3) circular and temporary
migration within Lebanon and internationally. For the third type, a complete migration history of adults, aged 15 and over, is collected.1 The migration history data
include the timing of each move, places of origin and destination, and basic demographic and social characteristics of the individual (or household) at the time of
1
The information is collected through a special module in the “randomly selected individual”
questionnaire.
47
Figure 2.14 Selected migration indicators.
Gulf returnee
International (since 1995)
Internal (since 1995)
Life-time
0
10
20
30
50 Per cent
40
move since birth. It should be pointed out that the migration data are necessarily
restricted to those usually living in the camps and gatherings at the time of survey.
Other migration-related data have also been obtained, including whether the
person ever worked abroad and whether he/she is a returnee from the Gulf. Figure
2.14 presents a summary of the migration-related indicators. Not so surprisingly
perhaps, the data show that Palestinian refugees living in camps and gatherings
are quite mobile, even when compared to other Palestinian refugee populations.
About 40 per cent are born in a place other than their current place of residence,
about 10 per cent have moved since 1995, and about 4 per cent (of adults) have
returned as a result of the Gulf War. However, the level of international migration
is relatively low.
No Filial Links with the West Bank or Gaza Strip
Where do the Palestinian refugees in Lebanon originally come from? Table 2.7
presents the distribution of individuals by current Governorate and original place
of their family. While these data may not be representative of all Palestinians living
in Lebanon (see section 1.2), they do provide a general picture as to their place of
origin. As expected, the vast majority (95 per cent) comes from the Northern part
of Mandatory Palestine. The regional breakdown presented in the Table shows that
Table 2.7 Family origin by current Governorate of residence. Per cent.
Current residence (Governorate)
Origin
Safad
Akka
Tabaria/Bisan
Nazereth
Haifa
Palestine south
West Bank/Gaza Strip
Other
Total
48
Beirut
Tripoli
Bequaa
Saida
Tyre
Total
17.9
50.0
0.7
2.6
12.3
11.6
2.3
2.7
39.6
21.7
1.6
25.3
7.8
2.6
0.8
0.7
49.8
11.3
18.0
2.1
16.8
0.6
1.3
0.1
28.4
39.1
11.5
7.8
9.4
2.3
1.0
0.5
40.9
42.4
5.8
2.4
6.1
0.3
1. 0
1. 1
33.1
36.6
6.3
9.5
9.0
3.3
1.2
1.0
100.0
100.0
100.0
100.0
100.0
100.0
some 70 per cent come from 2 regions, namely Safad and Akka, and about 1 in 4
come from Nazereth, Haifa, and Bisan. The filial links to the West Bank and Gaza
are minimal, with only about 1 per cent coming from there.
This picture does not change much from one Governorate to another, with
the North dominating each one. However, there are some noteworthy differences. While 1 in 2 persons in Beirut, for example, originate from Akka, Beirut is
more likely to have persons originating from areas other than the North, compared
to the rest of the Governorates. Also, 1 in 4 persons in Tripoli originate from
Nazereth; Bequaa’s residents are significantly more likely to come from Safad (50
per cent), Bisan (17 per cent) and Haifa (17 per cent) compared to other Governorates. Thus, while the overall picture is mixed, there is evidence of some “clustering” by family origin, even at the Governorate level.
About Two in Five Born in Palestine
As already noted, about 2 in 5 persons are born in a place (i.e. camp or gathering)
different from their current place of residence. This high rate of lifetime migration
should not be surprising, however, for a refugee population. Yet, given the age structure of the population and the time elapsed since the 1948 war, the figure is higher
than expected, implying substantial lifetime moves among the younger generation
as well.
Figure 2.15 displays the age distribution of lifetime migrants by sex. The overall
figure does not resemble a typical migrant population, where the young are overrepresented compared to the rest (see, Singelmann 1993). Instead, migration
selectivity by age and sex is clearly shown. The incidence of migration increases
consistently with age, from 13 per cent to 42 per cent for females aged 20–24,
stabilising until age 34, and increasing again reaching 100 per cent by age 55.
Almost every person aged 50 or over is a migrant: a refugee born in Mandatory
Palestine. Another striking observation in this Figure is that the “rates” are generally
Figure 2.15 Age distribution of male and female migrants.
Percent
100
80
Female
Male
60
40
20
0
0
10
20
30
40
50
60
70
80
Age
49
Table 2.8 Place of birth by Governorate of current residence. Per cent.
Place of birth
Beirut
Tripoli
Bequaa
Saida
Tyre
Palestine
Other countries
Total
Beirut
69.9
1.6
1.4
3.4
5.9
12.2
5.7
100.0
Governorate of current residence
Tripoli
Beuqaa
Saida
Tyre
3.9
4.5
5.1
2.4
78.4
0.1
0.9
0.6
0.7
70.3
1.0
1.5
1.0
1.4
70.6
5.1
1.6
4.7
5.1
73.4
10.1
14.4
12.0
14.0
4.2
4.6
5.4
3.0
100.0
100.0
100.0
100.0
Total
15.3
18.6
3.8
25.1
20.4
12.2
4.6
100.0
higher for women, especially during the 15–45 age range. This is probably due to
marriage as, in this context, it is the bride who moves to join her future husband.
It remains that the majority of the population are non-migrants, and this is
also true at the regional level. Table 2.8 reports the distribution of the population
by place of birth and region of current residence. It should be pointed out that
only intra-Governorate moves are included here. Several conclusions can be documented. First, the vast majority of the population is born in Lebanon, with very
little international lifetime migration. Thus, only about 13 per cent of the total
population is born in Mandatory Palestine, and another 5 per cent is born in other
countries. Second, each Governorate consists mainly of stayers, i.e. those born in
their current Governorate of residence. Here, the variations among Governorates
are not considerable, ranging from 70 per cent in Beirut, Bequaa or Saida, to about
78 per cent in Tripoli. Third, lifetime migration between Governorates is not very
common, ranging from 1 to 5 per cent. Most of these intra-Governorate moves
are probably due to displacements after, or during, factional conflicts.
Little Migration Since 1995
It should be pointed out at the outset that the data on period migration are not
strictly comparable to those for lifetime migration. The former include only those
aged 5 years or over at the time of the survey. Nevertheless, almost the same agesex pattern of internal migration is found (Figure 2.16). Women are more likely
to move, especially at younger ages (15–24), and the older groups (50–70 years
old) are more likely to be movers than the younger ones. The age pattern for
international migration shows a concentration in the young working ages, which
is typical of cases found elsewhere. Surprisingly, women are slightly more likely to
migrate than men, up to age 30. Even with increased importance of family
migration, one would expect higher proportions of male migrations at these ages.
However, the proportions as well as the differences are rather small.
50
Figure 2.16 Age distribution of migrants (since 1995) by sex and type of migration.
Per cent
12
10
Female internal
Male internal
8
6
4
Male international
Female international
2
0
5
15
25
35
45
55
65
75
85+ Age
The overall magnitude of internal migration is also relatively small, comprising
about 7 per cent of the total. It is not possible, given the sample size, to provide a
meaningful breakdown of migration flows at the regional level. Counting only
intra-Governorate flows, Beirut and Tyre have relatively larger proportions of movers, with 5 and 8 per cent, respectively, compared to about 3 per cent in the remaining areas.
Nearly Six in Ten Adults Moved at One Point in Their Life
Conventional data on migration, such as those analysed above, are limited to 2
points in time, and thus provide little or no information on the dynamic process
of migration. Given the circular nature of migration, individuals who moved within
the last 5 years, for example, are not counted as migrants. Migration history data
provide a fuller picture of the migration experience of individuals as they mature.
As with any kind of retrospective data, however, there are several concerns about
the quality of information collected, especially those pertaining to the timing and
occurrence of events. Recall error is perhaps the most serious problem in retrospective data. Respondents were asked to provide the year and month of events that
may have taken place many years ago. The misreporting of dates of moves (and
ages) is particularly common among illiterate or old persons. Preliminary analysis
of the data reveals some heaping, at certain digits, in the year of move and the age
at move. Distortions in the data are most pronounced in figures ending in zero
and five. The month of the move is also mostly missing in the data. Otherwise,
missing or inconsistent data are not serious problems in the retrospective data.
Figure 2.17 (next page) shows the number of moves initiated by men and
women during their entire life. The migration event is defined as any move
undertaken by the person between camps, gatherings, major towns, and countries for the intention of establishing permanent residence. A complete listing of
51
Figure 2.17 Number of migration events (moves) by sex.
Percent
50
Female
Male
40
30
20
10
0
0
1
2
3
Number of moves
4
5+
administrative units, with clearly defined boundaries within Lebanon was not
available at the time of the survey. Thus, the number of events is probably underestimated. Nevertheless, the Figure shows that almost 6 in 10 adults have migrated at one point in their life and slightly over a third of adults have migrated twice.
Women were more likely to be both movers and recurrent movers (i.e. make additional moves) than men. Comparatively speaking, this is clearly a mobile population.
Geographic mobility varies by type of residence. As shown in Figure 2.18, the
majority of adults have made a migratory move regardless of residence, but the
adults in the gatherings are the most mobile compared to those in the camps. Thus,
while about 70 per cent of the adults living in gatherings have migrated at least
once, about 58 per cent of the adults in the Northern camps and 52 per cent in
the Southern camps have done so. Also, the populations in the gatherings are more
likely to have made additional moves compared to those living in the camps. Given
the diversity of the gatherings included both in terms of size and living conditions,
it is difficult at this point to speculate on the possible causes for the relatively high
Figure 2.18 Number of migration events (moves) by residence.
Per cent
50
Camp North
Camp South
Gathering
40
30
20
10
0
52
0
1
2
3
Number of moves
4
5+
mobility observed among their populations. Events associated with the conflict,
rather than economic fortune, could be the principal reason behind more frequent
displacements of the non-camp population.
Examining the marginal distributions of moves by place of origin and place of
destination indicates that the majority of moves originate in Lebanon (Figure
2.19). The Beirut region stands out as an originator and receiver of migrants,
accounting for 28 per cent of all places of origin and 30 per cent of all places of
destination. Tyre and Saida follow, each accounting for about one-fifth of all the
moves by origin or destination. The Figure also shows that overall there is a net
migration to Lebanese Governorates as expected, due to the influx of refugees
during, or soon after, the 1948 war.
However, there are significant changes in the place of origin and destination
over time for the population currently living in the camps and gatherings. Figure
2.20 shows that Tyre is the major place of destination during the pre-1966 period,
accounting for about 44 per cent of the moves. Saida and Beirut each accounts
for about 15 per cent of the moves. Apparently, more moves were made to Saida
during the 1980s and 1990s in relative terms. The Figure also demonstrates the
Figure 2.19 Distribution of moves by place of origin and place of destination.
Other countries
Origin
Destination
Palestine
Tyre
Saida
Bequaa
Tripoli
Beirut
0
10
20
30
50 Percent
40
Figure 2.20 Place of destination by time period.
Other countries
Tyre
Saida
Bequaa
Tripoli
Beirut
90-99
80-89
67-79
< 66
0
20
40
60
80
100
Per cent
53
declining importance of other countries (and Beirut) as places of destination as
time elapses. The trends reported here appear to be related to the security situation in Lebanon and elsewhere in the region.
Furthermore, each adult was asked about the specific reason for the move made,
if any. Figure 2.21 displays a summary of changes in the reasons for moving in
the 4 periods. A more detailed list of reasons was included in the survey instrument, but only an aggregated list is presented here. As expected, war and securityrelated reasons are the most important for moving overall, accounting for about
47 per cent of all moves made during the entire period. However, the trends of
reasons given over time show that war and conflict become less important in the
1990s compared to other reasons. Marriage and family-related reasons are also
important, ranging from 30–37 per cent during the post-1966 period. Other reasons such as work, study, or facilities are, and remain, relatively minor factors in
“pushing” or “pulling”’ adults in and out of the camps and gatherings. The Figure
shows an increasing importance of work, housing and marriage in the 1990s.
Figure 2.21 Reason for moving by time period.
Other
War/security
Marriage/family
Study
Facilities
Housing
Work
90-99
80-89
67-79
< 66
0
20
40
60
80
100
Per cent
Figure 2.22 Reason for moving by place of destination.
Other
War/security
Marriage/family
Facilities
Housing
Work
Study
Other countries
Tyre
Saida
Bequaa
Tripoli
Beirut
0
54
20
40
60
80
100
Per cent
Of course, reasons for moving not only differ over time, but also in terms of space.
For example, reasons for movement within Lebanon should differ from those given for moving abroad. Figure 2.22 displays the distribution of the reasons by place
of destination. The reasons given for moving within Lebanon are quite similar,
with security and marriage-related factors dominating every place of destination.
There are 2 exceptions, however. First, Tripoli and to a lesser extent Beirut account for marriage or family-related reasons at the expense of security, compared
to other Governorates. About 37 per cent of the moves to Tripoli and 30 per cent
of the moves to Beirut are made for family or marriage-related factors. Second,
slightly larger proportions of moves to Saida and Tyre are for better or cheaper
housing or facilities, compared to other regions. Larger proportions of moves to
other countries are made for work or study-related reasons, as compared to internal places of destinations. Thus, about 37 per cent of the moves to other countries are made for work or study. The corresponding percentages for internal moves
range from 6 (Beirut and Saida) to 9 (Tripoli) per cent.
Data on some characteristics of the migrant, including education, marital status
and family composition at the time of move are also available. These data provide
unique opportunities for a thorough investigation of the process of migration as
it evolves over time. We only present basic findings here. Figure 2.23 presents a
rather “static” picture of the changing educational profile of migration over time.
Almost 3 out of 4 moves are made by a person with elementary or less education.
The Figure shows that the educational profile of persons at the time of the move
changes across the 4 periods, and especially so during the 1990s. This is probably
a reflection of the increased education levels of the population as a whole (see chapter 4) rather than migration selectivity.
To examine migration selectivity in a simpler, more straightforward manner,
we focus on the demographic and socio-economic characteristics of persons at the
Figure 2.23 Educational level at the time of move by time period.
Elementary
Preparatory
Secondary
Over secondary
90-99
80-89
67-79
< 66
0
20
40
60
80
100
Per cent
55
time of the survey, distinguishing movers from stayers. Movers are defined here as
persons who have made a recent move (i.e. since 1980) to, or from, the camps
and gatherings. Thus, no distinctions are made between movers on the basis of
duration of stay, frequency of moves, or exact timing of events. Of course, there
is a loss of information in such an approach, however it does provide an informative picture of migration selectivity during the most recent period.
To put the following figures in perspective, the recent movers account for about
38 per cent of the adult population. Of those, almost 40 per cent are from the
Northern camps (Figure 2.24). The stayers, amounting to 62 per cent of the total, are more likely to live in the Southern camps than the movers.
Figure 2.25 shows that the movers are generally younger than the stayers. The
migrants are more concentrated in the young working ages of 25–34. Almost 3
out of 4 movers are in the age group 15–39, which is about 10 percentage points
higher than the corresponding one for stayers. This discrepancy between movers
and stayers remains until age 70, as shown clearly in the graph. This pattern does
not necessarily imply a decline in family migration as opposed to labour migration, as the proportion of migrants in the working ages is still small in a comparative perspective.
Figure 2.24 Migration selectivity by residence.
Mover
Stayer
Gathering
Camp South
Camp North
0
10
20
30
50 Per cent
40
Figure 2.25 Migration selectivity by age.
Cumulative percent
100
Movers
Stayers
80
60
40
20
0
56
15
25
35
45
55
65
75
85
Age
The age selectivity of migration observed here implies that family migration rather than labour migration is the predominant form of geographic mobility among
Palestinian refugees in the camps and gatherings. This is also evident when the
reasons for moving are examined, showing that the majority of all migrants moved
for security reasons, to join their families, or for marriage, rather than primarily
for economic reasons. Results pertaining to migrant selectivity by demographic
composition, shown in Figure 2.26, reinforce these conclusions: recent movers
are more likely to be females and to come from an extended family than stayers.
Figure 2.27 indicates that migrants are more likely to have a higher socio-economic status and education than stayers, in line with the conventional view. Thus,
movers are more likely to be professionals, wealthier, and with secondary education,
compared to stayers. However, migrants are less likely to be employed than stayers.
It should be emphasised, however, that the economic fortune and occupational distribution of migrants does not differ much from non-migrants. For example, migrants and non-migrants are about equally likely to be economically active and
their unemployment rates are only marginally different.
Figure 2.26 Migration selectivity by household composition and sex.
Mover
Spouse w/child and other
Stayer
Spouse w/child
Extended family
Female
0
20
40
60
100 Per cent
80
Figure 2.27 Migration selectivity by education and socio-economic status.
Mover
Unemployed
Stayer
Low wealth
Agricultural workers
Craft workers
Professionals
Secondary+
Below elementary
0
10
20
30
40
50
Per cent
57
2.8 Relatives Abroad
The LIPRIL survey includes basic information on close relatives of household members living abroad. The data obtained cannot be used directly to estimate out-migration or to provide a complete picture of the characteristics of out-migrants for 2
main reasons. First, out-migrants without close relatives in Lebanon are not reported.
Second, the sample is likely to include close relatives and thus some out-migrants
are counted twice. The extent of these problems on the estimated population size
of out-migrants is not known. Nor is it clear how these selection problems affect
the characteristics of out-migrants. These data do, however, provide valuable information on relatives residing abroad, especially when used in a comparative perspective (i.e. in relations to the populations in Jordan or Palestine).
Four Out of Five Households Have Relatives Living Abroad
The data show that almost 4 out of 5 households have relatives living abroad, with
little variations between places of residence (Figure 2.28). Households in the Northern camps are slightly more likely (81 per cent) to have relatives abroad than those
in the Southern camps (77 per cent). Thus, Palestinian refugee households in the
camps and gatherings have extensive filial links abroad, and these international links
appear quite varied as shown in Figure 2.29. Surprisingly, 1 out of 2 households
report having relatives living in Europe and 1 out of 3 report relatives in the Gulf
countries. Syria and Northern America follow, with almost 1 out of 5 and 1 out of
10 households respectively reporting relatives there. About 8 per cent of households
have relatives in Jordan, only 4 per cent have relatives in the West Bank and Gaza,
and only 5 per cent have close relatives in Israel.
The characteristics of relatives living abroad are quite typical of refugee outmigrants everywhere. There are however some peculiarities since part of the population consists of migrant labourers living abroad temporarily. The overall sex ratio
of relatives living abroad shows more males than females; 118 males for every 100
Figure 2.28 Households with relatives abroad by residence.
Gathering
Camp South
Camp North
0
58
20
40
60
80
100
Per cent
Figure 2.29 Households with relatives abroad by country of current residence. Adds up to 147
per cent because some households have relatives in two or more countries.
Other
Europe
USA/Canada
Gulf countries
Syria
Jordan
Israel
West Bank/
Gaza Strip
0
10
20
30
40
50
60
70
80
90
100
Per cent
Figure 2.30 Sex ratios of relatives abroad.
Sex ratio
2,5
2
1,5
1
0,5
0
0- 4
5-9
10-14
20-24
30-34
40-44
50-54
60-64
70-74
80-84
15-19
25-29
35-39
45-49
55-59
65-69
75-79
Age groups
females, as expected. An examination of the sex ratio by age reveals a male surplus
across age groups (see Figure 2.30) with one exception: those aged 15–19 years.
In this age group, there are about 80 males per 100 females. It is not clear why
this is the case, but may be due to an underreporting of male relatives or marriagerelated factors.
The age structure of the relatives abroad shows a few children, while the majority are of working age. Over 60 per cent of relatives living abroad are in the
age group 20–44, indicating a relatively young population. The age structures of
males and females are strikingly similar.
Figure 2.31 (see next page) displays the distribution of relatives living abroad
by country (or continent) of current residence. It shows that almost 40 per cent of
them are in Europe, 20 per cent in the Gulf, 14 per cent in Syria, and 7 per cent in
the US or Canada. There are only 4 per cent in Israel, the West Bank and Gaza,
59
Figure 2.31 Relatives abroad by country (continent) of current residence.
Other
Europe
USA/Canada
Gulf countries
Syria
Jordan/Egypt
Israel
West Bank/Gaza Strip
0
10
20
30
40
50 Per cent
and another 5 per cent in Jordan and Egypt. Thus, there are weak filial links with
Palestinians in Israel and the Occupied Territory, reflecting the historic patterns
of refugee migration from Palestine on the eve of the 1948 war.
Households with relatives residing abroad were also asked what the main reason was for their relatives living abroad. A rather detailed list of reasons was included but only the broad categories are shown in Figure 2.32. As shown in this Figure,
work was the most important reason. Twenty-seven per cent went abroad for work
and 8 per cent went to seek work, while about one-third went for other work-related reasons. Marriage and family reunification together have a larger weight, accounting for about 38 per cent. Place of origin is the third most important reason, with
about 15 per cent of relatives being abroad because this is their place of origin.
Schooling is not an important reason, accounting for a merely 3 per cent of the total.
The reasons given do of course vary by places of destination (or type of migration), particularly with regard to the international-internal distinctions.
Figure 2.32 Relatives abroad by main reason for living abroad.
Other
Place of origin
Followed family
Marriage
Study
Seeking work
Work
0
60
10
20
30
40
50 Per cent
Chapter 3 Health and Health Services
Åge A. Tiltnes
3.1 Introduction
This chapter describes the current health situation among the Palestinian refugees
in camps and gatherings in Lebanon. Keeping health and sanitary conditions above
the level of basic needs is regarded as highly valuable in itself, as vital aspects of a
“decent life”. At the same time, the health situation of a population is generally
considered to be a prerequisite to educational achievements, labour market participation and consequently income earning possibilities. While the lack of access to
productive assets or employment often explains the persistence of poverty among
potentially productive groups, labour skills and market access may be of little value
unless the population is in good health.
The Survey Focuses on Self-reported Health
The LIPRIL approaches health status by focusing on self-reported health and illness. The survey does not enquire about diseases or collect exact diagnostic information. Instead, it concentrates on the (possible) negative effects of chronic illness
and disability, and also establishes the relation between prolonged illness and a set
of socio-economic background characteristics. In this context, health is generally
understood as the absence of (serious) illness, and health failure.
Furthermore, we analyse self-perceived health captured by one simple question
asking the respondents to rate their general health status on a five-point scale. We
do not as researchers define “good health” for the respondents by, for example, assigning the concept any positive ethical-philosophical feature along the lines of “leading a life of purpose” or “positive self-regard and mastery” (Ryff and Singer 1998).
Nonetheless, it is known that the layman’s health definition encompasses more than
the non-existence of illness (a negative dimension). Research seems to concur that
2 other important dimensions are the capacity to cope with the challenges of everyday life (a functional definition) and the feeling of well-being, energy and vigour
(a positive dimension) (Bjørndal 1992).
61
Besides chronic health deficits and self-perceived general health, the LIPRIL also
captures reproductive health. Furthermore, the study gives attention to health behaviour and raises questions such as: How widespread is cigarette smoking? To what
extent do the acutely ill seek medical advice and treatment? The latter question draws
attention to the health care system itself, as the use of services is affected by factors
such as geographical availability and the cost of services. To what degree do Palestinians have access to basic curative and preventive health care, we ask.
Overall Poor Adult Health; Health Services of Unsatisfactory Quality
The survey demonstrates that the health situation of adult Palestinian refugees is
generally poor. As is common everywhere, people’s health deteriorates with ageing.
Furthermore, for most indicators we find a clear association between poor health
and socio-economic status indicators such as education, income and housing standards. Compared for example to Palestinian camp refugees in Jordan, the health situation is significantly worse in Lebanon. At least partly, this can be explained by
the civil war and problems caused by warfare or war-related events. These circumstances also most likely explain why Palestinian refugees residing in Southern Lebanon report a higher incidence of chronic health failure (including physical handicaps) and more mental distress than other refugees.
Following sudden illness, the majority seeks medical assistance. Very few claim
not to see a doctor or other professional because facilities are not within reasonable
distance. However, for some acutely ill persons, especially in the poorest segments,
treatment is not affordable. Maternity health care services are widely used, although
at lower levels than reported for comparable populations. Furthermore, as many as
1 in 4 deliveries takes place at home, with much poorer qualified birth assistance
than offered in clinics and hospitals.
As we shall see, overall satisfaction with health services is fairly low, and lowest
among the Palestinians residing outside of the refugee camps. When the services and
treatment provided at the various types of health care facilities following acute illness are compared, UNRWA clinics receive the lowest score.
3.2 Self-assessed General Health
The survey asked 1 randomly selected person aged 15 years and older in each household to describe his or her own health according to a five-point scale ranging from
“very good” to “very bad”. The question was posed because previous research has
shown that the answer to this rather simple question describes the overall health
62
situation of each individual accurately, and reflects “objective” (medical) assessment
rather well (Moum 1992a). Other studies have concluded that single-item measures of self-rated health similar to the one applied in the LIPRIL correlate strongly
with scores on more extensive health measurement scales (Mackenback et al 1994).
No Gender Difference in Subjective Health
The majority of the Palestinian refugees in Lebanon, more than 4 in 5, consider their
own health to be quite satisfactory. Sixteen per cent of the respondents say their
health is “very good”, 42 per cent say it is “good”, while 26 per cent describe it as
“fair”. Altogether, 16 per cent of the adults feel that their general health situation is
bad or very bad (Figure 3.1). These numbers suggest that the health of the adult
population in the Palestinian camps and gatherings in Lebanon is poor, at least when
compared to the health of the Palestinian refugee camp residents in Jordan. Here, a
household survey asking exactly the same question, reports that 55 per cent have
very good and 23 per cent have good general health, while 17 per cent have fair and
5 per cent have poor or very poor health (Khawaja and Tiltnes 2002).
Overall, men and women do not rate their general health differently (Figure 3.2).
This result is a bit surprising taking into consideration the fact that, as will be demonstrated later, women tend to score poorer on other health indicators. On the other
hand, as shown in the Figure, self-rated, subjective health is closely related to age.
For example, while 19 per cent of the men and 14 per cent of the women in the age
group 25–34 years report their health to be very good, among persons aged 45–59
only 2 per cent of the men and 3 per cent of the women report the same.
Figure 3.1 Self-assessed general health by sex of respondent (n=3,593). Per cent of persons
aged 15 and older.
Per cent
50
40
30
20
10
0
Very good
Good
Fair
Bad
Very bad
63
Figure 3.2 Self-perceived very good, and bad/very bad health by gender and age (n=3,593).
Per cent of persons aged 15 and older.
Per cent
100
Bad or very bad
Men
Women
80
Very good
Men
Women
60
40
20
0
1524
2534
3544
4559
60+
Chronic Health Failure, Low Education and Income
Means Poor Subjective Health
Figure 3.3 highlights the relationship between various individual characteristics other
than gender and age, and the respondents’ general health status. Not surprisingly,
there is a wide gap between the subjectively felt health status of individuals who have
some long-standing illness or disability, and those who have not. While only 2 per
cent of the chronically ill state that their health is very good, 21 per cent of those
who do not suffer from lasting health problems say the same. The figure also shows
that there is an association between other “objective” health variables and subjective global health. The relationship between physical health and general health is
very clear: while almost 1 in 4 with full physical strength and the ability to move
around at will report very good general health, extremely few with poor physical
health do the same. People’s emotional and psychological well-being plays a significant role in their perception of overall health status. The Figure demonstrates that
more than twice as many persons reporting fewer than 5 symptoms of psychological distress rate their overall health as very good, compared to those who report 5
or more symptoms of distress.1
Figure 3.3 shows that subjective global health improves with increasing socioeconomic status, measured here by educational attainment and income. That subjective health is associated with level of education is a result that accords with earlier studies (Ross and Wu 1995; Kharabsheh and Tiltnes 1998). The particularly poor
1
The chapter contains separate sections on long-term illness, physical health and impairment, and
mental health, which explain how the various health indicators in Figure 3.3 are constructed.
64
Figure 3.3 Subjective health by selected characteristics: educational attainment, household
income, chronic illness, physical health, and mental health (n=3,608). Per cent of persons aged
15 and older.
Very good
Chronic illness
Has chronic illness
Good
Fair
Bad or very bad
No chronic illness
Physical health status
Very poor physical health
Poor physical health
Fair physical health
Good physical health
Very good physical health
Mental health
57 symptoms
04 symptoms
Educational level
Less than basic
Basic
Secondary or higher
Income groups
Low
Middle
High
0
10
20
30
40
50
60
70
80
90 100
Per cent
health among persons without any formal education is obviously related to the disproportionately high number of older persons in this category. Nonetheless, as demonstrated by Figure 3.4, the association between educational attainment and selfrated general health remains when controlled for age.
Figure 3.3 further indicates that the respondents report better health when they
live in high-income households than when they live in low-income ones. While 44
per cent of the persons in the lowest income group say their health is very good or
good, 57 and 67 per cent of the persons in the middle and upper income groups
do the same. Two and a half times as many adults in the lowest income group compared to the highest income group report bad or very bad global health, at 26 against
and 11 per cent respectively. In the middle-income group, 15 per cent rate their
health as very poor or poor.
65
Figure 3.4 Adults stating that their general health is “very good” and “good” by age and
educational attainment (n=3,593). Per cent of persons aged 15 and older.
Very good
45 and above
Less than basic
Good
Basic
Secondary or higher
3044
Less than basic
Basic
Secondary or higher
Below 30
Less than basic
Basic
Secondary or higher
10
0
20
30
40
50
70
60
80
90 100
Per cent
There is also variation in self-rated global health according to place of residence. As
shown in Figure 3.5, people living in the Northern refugee camps are the best off,
while the population of the Southern camps has the poorest rating, leaving the noncamp residents in the middle position. Twice as many persons residing outside the
refugee camps and nearly 4 times as many persons in the Northern camps assess their
health as very good, compared to the camp dwellers in the south of Lebanon.2
Figure 3.5 Self-rated general health and place of residence (n=3,593). Per cent of persons aged
15 and older.
Very good
Good
Fair
Bad or very bad
Camp South
Non camp
Camp North
0
2
10
20
30
40
50
60
For further description of geographical regions, see chapter 1.3.
66
70
80
90
100
Per cent
3.3 Chronic Illness and Disability
The subjective general state of health - evaluations based on objective realities as well
as influenced by cultural and other factors - is a powerful health indicator (Cleary
1997) and a valuable summary statement of the individual’s perception of own health
(Murray et al 1982). Yet it is also useful to take the prevalence of chronic health
problems into account. We have already demonstrated how chronic health failure
negatively impacts on individuals’ subjective health appraisal, as only one-tenth the
number of respondents with some chronic illness or handicap compared to respondents without such problems report very good general health. Furthermore, as will
be shown below, long-term health failure is a strong negative determinant of people’s psychological well-being.
One in Five Chronically Ill; Three Per Cent Suffer from
Prolonged Illness Due to War
To identify chronic health problems the LIPRIL asked the following question about
all household members: “Does <name> suffer from any physical or psychological
illness of a prolonged nature, or any afflictions due to an injury, a handicap, or age?”
To get a picture of how severe the afflictions are, a follow-up question was introduced: “Does <name> find it difficult to go out on his/her own without the help of
other people because of the health problem or handicap?” The Lebanese population has experienced more than 15 years of civil war, and some areas have until recently been targets for Israeli bombardment. Given these special circumstances, we
also enquired to see if the prolonged health problem “was caused by a war-related
event, such as bombing and/or combat?”
The survey demonstrates that 19 per cent of the population report some sort of
lasting health problem, while 9 per cent have a severe problem, or a disability. A
severe problem/disability is defined as finding it “a bit difficult” or “definitely difficult” to go outside without assistance. Three per cent claim to be suffering from
chronic health problems caused by warfare or war-related events and 1 percentage
point less maintain that they are suffering from severe prolonged health failure for
the same reason. In the following, we will describe the chronically ill in some more
detail. Who are they?
At first glance, the LIPRIL data reveal only small gender differences in relation
to chronic illness. Nineteen per cent among both genders suffer from some kind of
long-term health problem, while a slightly higher number of women than men have
a severe problem; 9 and 8 per cent respectively. If we take the age aspect into account in the comparison between men and women, however, a somewhat different
picture emerges (Figure 3.6). While males as children and young adults are worse
67
Figure 3.6 Prevalence of chronic illness and war-related chronic illness according to gender
and ten-year age groups (n=19,119). Per cent of total population.
Per cent
100
Women
Men
Warrelated, women
Warrelated, men
90
80
70
60
50
40
30
20
10
0
09
1019
2029
3039
4049
5059
6069
70+ Age groups
off than females, the latter face more chronic health problems at higher ages, notably over the age of fifty.
The Figure shows that men are noticeably more troubled than women by lasting illness due to Lebanon’s history of conflict and warfare. As a matter of fact, war
is held responsible for chronic health failure among 10 per cent of men over the age
of 30. A study profiling the health of the citizens of Beirut has found a similar gender difference. It concludes that 71 per cent of the individuals injured by war between 1983 and 1992 were males, and 29 per cent were women (Nuwayhid et al
1997). The gender difference is presumably explained by men’s more active involvement in the hostilities.
Uneven Distribution Across Region and Socio-economic Status
The occurrence of chronic health problems varies across regions. As is evident from
Figure 3.7, people residing in the Southern camps are more plagued by severe prolonged illness, while camp dwellers in the north of Lebanon are the least negatively
affected by such lasting health problems. This observation may partly be explained
by the fact that the Southern camp dwellers have suffered much more from the
negative health effects of war and war-like events than people residing elsewhere: 4
per cent in contrast to 3 per cent in the Northern camps and 2 per cent in the gatherings. Two per cent of the residents in the Southern camps suffer from serious warrelated health failure compared to 1 per cent in the other 2 regions.
68
Figure 3.7 Prevalence of severe prolonged illness according to region (n=19,119). Per cent of
total population.
Camp North
Non camp
Camp South
0
5
10
15
Per cent
Socio-economic status (SES) is consistently associated with health outcomes. As
above, we use 2 indicators of SES here: income and education. Persons in the lowest income group report prolonged illness much more often than other persons.
Whereas over 16 per cent among individuals whose annual household income is
below LL 1.8 millions have a serious long-lasting health problem, the figures for
those in the upper 4 income groups vary from about 5 to almost 10 per cent (Figure 3.8). The prevalence of chronic health problems among the poorest segments
of the Palestinian population (the lowest income group) is about triple that of the
wealthiest segments (the highest income group).
The LIPRIL demonstrates that education, the second indicator of SES, is also
associated with chronic health failure. Figure 3.8 suggests that the prevalence of severe lasting illness and disability is more than 5 times higher among persons who
have not completed basic schooling compared to those who have a post-secondary
degree. However, age may be an intervening and “disturbing” factor here because
Figure 3.8 Prevalence of severe prolonged illness by annual household income (in LL 1,000)
(n=18,815) and educational attainment (n=19,094). Per cent of total population.
Income groups
Upper
Upper middle
Middle
Lower middle
Low
Educational attainment
Higher than secondary
Secondary
Basic
Less than basic
0
5
10
15
20 Per cent
69
the group of people with the lowest education largely consists of the oldest and
youngest generations. To control for age, and by way of example, we compare individuals aged 30–39 years who did not finish basic schooling, with those in the same
age group who successfully completed basic schooling and those who have achieved
a secondary or post-secondary degree (Figure 3.9). In the first group, we find some
individuals with learning disabilities stemming from physical or mental handicaps,
which have no doubt been registered as chronic illnesses. This may account for a
substantial part of the gap between the 2 lowest educational groups. However, it
does not explain the reduced occurrence of chronic health problems in the third
group. Thus, it should be clear that persons with relatively higher education tend
to experience lasting health problems less frequently. One explanation here is the
effect of occupation, that is, persons with higher education tend to hold jobs that
present them with fewer health risks: the work tasks are not physically demanding;
the work environment in general is kinder; and the employee runs lower chances of
on-the-job accidents and injuries.
Figure 3.9 Prevalence of severe prolonged illness among persons aged 30–39 by educational
attainment (n=2,720). Per cent.
Secondary or higher
Basic
Less than basic
0
2
4
6
8
10
Per cent
3.4 Functional Impairment
As health problems may vary considerably in magnitude and seriousness they will
influence the daily life of the affected individuals to a varying degree. The indicator
“severe chronic illness”, presented above, is a crude measure of disability. Since we
want to describe functional impairment in some more detail, the LIPRIL inquired
about adult respondents’ ability to perform 5 everyday activities: ascending and
descending stairs, a quick 5 minute walk, carrying an item weighing 5 kilos no less
than 10 meters, reading a newspaper (with glasses, if necessary)3, and following a
3
The interviewers took great care to explain to the respondents that this was a question about eyesight, not reading skills.
70
Figure 3.10 Adults’ ability to perform certain everyday activities. Persons aged 15 and older
who can perform these activities with difficulty or not at all (n=3,593). Per cent.
Can with difficulty
Cannot
Hear conversations
Read newspaper
Carry 5 kilo
Go for a brisk walk
Climb stairs
0
5
10
15
20
25
30
35
40
45
50
Per cent
normal conversation (with a hearing aid, if necessary). The main results are presented
in Figure 3.10. Although only a limited number of activities are measured, we believe that they capture important aspects of people’s ability to operate freely, and as
such, are good indicators of physical well-being.
Furthermore, we have constructed an additive index to investigate how the 5
indicators of ambulatory and sensory problems accumulate. Those who reported
any problem related to a described activity were given the score “1” on that particular activity. We then counted the scores for each respondent and grouped all respondents accordingly. The result is shown in Table 3.1.4
Table 3.1 Distribution of adults aged 15 and older according to number of sensory and mobility problems (n=3,608). Per cent.
Number of difficulties
0
1
2
3
4
5
Total
Proportion of adults
53.5
13.8
10.3
11.4
6.4
4.6
100.0
Women and Poorer Segments Report More Problems
The results for men versus women as well as across 5 income groups are presented
in Figure 3.11. The Figure shows that women are systematically worse off than men.
While almost 26 per cent of the women report difficulties with 3 or more activi-
4
The index’s standardised item alpha=0.8210.
71
Figure 3.11 Difficulties in performing everyday life activities. Persons having problems with 3
or more activities by gender (n=3,608) and income (n=3,549). Per cent of population 15 years
and older.
Poor physical health
(3 problems)
Income groups
Very poor physical health
(4 or 5 problems)
Upper
Upper middle
Middle
Lower middle
Low
Sex
Men
Women
0
10
20
30
40
50 Per cent
ties, 17 per cent of the men do the same. The background to this is that women
aged 40 to 70 report more problems than men on 3 of the indicators (those measuring strength and mobility), while the performance on 2 of the indicators (eyesight and hearing) is not significantly different. The finding that women are more
often functionally impaired than men is in accordance with the section on chronic
health failure above.
Figure 3.11 further shows that people’s health status is firmly associated with income. For example, almost 17 per cent of the interviewed adults living in households with the lowest income report difficulties with 4 or all 5 indicators of physical health. This is 3 times as many as in the upper income group. That the association
between income and health is significant across age should be evident from Figure
3.12, which shows that physical health gets poorer with falling household income
for all 3 age groups.
To what extent does functional impairment restrict people’s ability to generate
income? To answer that question, we compare the scores of the respondents between
the ages of 20 and 65 who form part of the labour force, with those outside the labour
force. We have removed the individuals aged 15 to 19 years old since almost half of
them are still in the educational system. As can be seen from Figure 3.13, female
and male labour force participants alike are less troubled by weakened physical health
than persons outside the labour force. Yet it is a bit surprising that as many as 4 to
5 per cent of the Palestinians in the labour force can perform 4 or 5 of the 5 activities only with some difficulty or not at all.
72
Figure 3.12 Difficulties in performing everyday life activities. Persons having problems with 3
or more activities by age groups and income. Per cent of population aged 15 and older.
Poor physical health
(3 problems)
60 to 69 years
Very poor physical health
(4 or 5 problems)
Upper
Upper middle
Middle
Lower middle
Low
50 to 59 years
Upper
Upper middle
Middle
Lower middle
40 to 49 years
Low
Upper
Upper middle
Middle
Lower middle
Low
0
10
20
30
40
50 Per cent
Figure 3.13 Persons with very poor physical health (face problems when performing 4 or 5 out
of 5 every day activities) by gender and labour force status (n=2,804). Per cent of population
aged 20 to 64 years old.
Outside labour force
In labour force
Women
Men
0
5
10
15 Per cent
3.5 Psychological Distress
In addition to physical health, psychological, mental and emotional aspects are naturally of great importance to people’s general well-being and living conditions. “Psychological distress” is a term frequently used in mental health literature. Psychological distress
is seen as a prime indicator of mental health, and symptoms of distress are important
because they stimulate care-seeking. (McDowell and Newell 1996).
73
In order to measure psychological distress, the LIPRIL used an abbreviated version
of the so-called Hopkins Symptoms Check-List or “HSCL-25” (Moum 1992b). One
randomly selected adult in each household was asked whether 7 symptoms or problems that people sometimes have, had bothered or distressed him or her very much,
quite a bit, a little, or not at all during the past week. The symptoms were (1) worrying too much about things, (2) feeling depressed and sad (blue), (3) feeling hopeless
about the future, (4) feelings of worthlessness, (5) nervousness or shakiness inside,
(6) feeling continuously fearful and anxious, and (7) headaches.
The original HSCL-25 was constructed to measure symptoms of anxiety and
depression only, and not to assess poor psychological health in general. This is reflected in our seven-item battery of questions. The first 4 items are closely interrelated and measure depression, while items 5, 6 and 7 are intimately linked and indicate anxiety. (Moum 1992b, Tambs and Moum 1993). Nonetheless, it has been
argued that the list “may serve as a good proxy to global general mental health because most states of mental illness or distress are accompanied by anxiety and/or
depression.” (Tambs and Moum 1993:364). Besides, measures of anxiety and depression overlap and interlink because both tap a broad and general mood characterised by the experience of various negative affective states (Clark and Watson 1991).
Figure 3.14 shows the respondents’ scores on each of the 7 items. Between 17
per cent (“feelings of worthlessness”) and 61 per cent (“nervousness”) of the Palestinians report to have been bothered “very much” or “quite a bit” by these symptoms during the week preceding the interview. Four of the symptoms distress more
than half of them.
Although the 7 indicators capture distinct sides of psychological distress, our
objective is to focus on the overall level, not each individual indicator. Therefore,
Figure 3.14 Distribution of the adult population according to seven indicators of psychological
distress (n=3,589). Per cent of persons aged 15 and older.
Not at all
A little
Quite a bit
Very much
Worrying too much
Depressed and sad
Hopeless about the future
Feeling worthless
Nevousness
Headaches
Anxiousness
0
74
20
40
60
80
100
Per cent
using the limited battery of questions we constructed a simple additive index, where
we assumed that the higher the number of stress symptoms reported, the poorer the
individual’s general mental well-being. For each item, the respondent is given the
score “1” if he or she answered “very much” or “quite a bit”. Otherwise he or she is
given “0”. We then summarised the total scores for all respondents and assigned them
a number on the mental distress index ranging from zero to seven.5
Higher Level of Distress Than in the Palestinian Refugee Camps
in Jordan
Only about 1 in 6 persons report no symptoms of psychological distress whatsoever (Table 3.2). On the other hand, almost 3 out of 10 respondents (27 per cent) say
they were bothered quite a bit or very much by 5 or more of the 7 listed indicators
during the week preceding the interview. This is fairly high compared to the Palestinian refugee camp population in Jordan, where only 11 per cent report having at
least 5 symptoms (Khawaja and Tiltnes 2002).
Table 3.2 Distribution of 7 indicators of psychological distress in the adult (15+) Palestinian
population in camps and gatherings in Lebanon (n=3,263) compared to Palestinian camp
refugees in Jordan (n=2,274). Per cent.
Lebanon 1999
Jordan camps 1999
No symptom
16
41
1 symptom
13
20
2 symptoms
14
13
3 symptoms
16
9
4 symptoms
14
6
5 symptoms
13
6
6 symptoms
8
3
7 symptoms
7
2
100
100
Total
Reduced Mental Health Associated with High Age,
Chronic Health Failure and War
The LIPRIL indicates a significant variation in the psychological health of the Palestinian refugees in Lebanon according to several background variables. The first point
worth mentioning is that there is little difference between men and women - we can
tell by the way the line for women in Figure 3.15 quite neatly follows the line for
the total population.
5
The index’s standardised item alpha=0.8007.
75
The curve for persons 60 years and older is included in the Figure to illustrate the
perhaps not so surprising fact that older Palestinians are worse off in terms of emotional and psychological well-being than younger Palestinians. The effect of ageing
on mental welfare is displayed more accurately by Figure 3.16, which shows how
people gradually acquire additional symptoms of psychological ill health as they get
older.
One would expect the association between age and reduced psychological wellbeing and happiness to be related to other health aspects. Figure 3.15 confirms this,
as the shape of the curve for the disabled, i.e. persons suffering from chronic health
problems involving functional impairment, resembles the one for the older generation to a large degree. Furthermore, as shown above (Figure 3.6), the LIPRIL reveals a strong relationship between age on the one hand and long-term health failure and disability on the other. Naturally, the severity of the chronic condition plays
Figure 3.15 Score on mental distress index: women, persons 60 years and older, disabled and
residents in the Southern refugee camps compared to the total population (n=3,608). Per cent
of all adults aged 15 and older.
Per cent
20
15
60 and above
Disabled
Women
Total population
Camp south
10
5
0
0
1
2
3
4
5
7 Mental index score
6
Figure 3.16 Score on mental distress index (0-7 symptoms) and age groups (n=3,608). Per cent
of all adults aged 15 and older.
0
1
2
3
4
5
6
7
60+
4559
3544
2534
1524
0
76
20
40
60
80
100 Per cent
Table 3.3 Score on mental distress index (0–7 symptoms) and severity and type of chronic health
failure (n=3,608). Per cent of all adults aged 15 and older.
Number of
symptoms
0
No chronic
illness
18
Chronic
illness
8
Severe
War-related
Severe warchronic illness chronic illness related illness
5
4
3
1
14
9
6
7
4
2
14
13
12
10
10
3
16
13
11
10
5
4
13
18
20
18
21
5
12
15
17
13
11
6
6
14
18
23
30
7
5
10
12
14
16
a role. As shown by Table 3.3, the more severe the illness or handicap, the more
negative the impact is on people’s mental well-being. The table also shows that the
most adverse effects derive from war-related illnesses and impairments. While among
persons without any prolonged illness 11 per cent report 6 or 7 out of 7 symptoms,
the figures are 24 and 30 per cent respectively for people with chronic and severe
chronic health failure. The numbers rise to 37 and 46 per cent among the Palestinian refugees who suffer from injuries and handicaps caused by war.
The last background factor displayed in Figure 3.15 is place of residence. The
Figure shows that residents in the Palestinian refugee camps in the south of Lebanon have a mental health slightly above the average. The fact that their psychological well-being is somewhat better than that of Palestinians living in the Northern
camps or outside the refugee camps is rather unexpected, as the camp dwellers in
the south report a significantly higher prevalence of severe chronic health failure (see
Figure 3.7) and long-term illness caused by war than residents of the 2 other regions.
They further rate their general, subjective health as poorer than people living elsewhere (see Figure 3.5).
Enhanced Socio-economic Status Improves Psychological Health
Figure 3.17 indicates variation in people’s mental health along other background
factors as well. The dotted line starting at the highest point to the left of the figure
shows that the psychological well-being of individuals with at least secondary education is above average. Individuals with the poorest education are conversely worse
off (not shown). The association between educational attainment and mental health
is most evident for the middle-aged and oldest age groups, and not so significant
for the youngest Palestinians (Figure 3.18).
77
Figure 3.17 Score on mental distress index: Percentage of individuals having secondary education or more (n=437), and belonging to the lowest income group (n=726) compared to the
total population (n=3,608).
Per cent
20
16
12
Low income
Total population
8
Secondary or
higher education
4
0
0
1
2
3
4
5
6
7
Figure 3.18 Percentage of persons aged 15 and older reporting 5-7 symptoms of psychological distress by age and educational attainment (n=3,608).
Secondary or higher
45 and above
Basic
Less than basic
30 to 44
Below 30
0
10
20
30
40
50 Per cent
Figure 3.17 shows that members of the households with the lowest income report
considerably poorer mental health than the average. While 34 per cent of the persons in the lowest income bracket say they suffer from 5 or more symptoms of psychological distress, 27 and 24 per cent of the middle and upper income brackets
respectively, say the same. The association between income and mental well-being
is robust when checked for the effect of ageing (Figure 3.19). Labour force status is
found to have no significant effect on the emotional and psychological well-being
of the Palestinian refugees (not shown).
The standard of a dwelling can be understood as a sign of wealth and socio-economic standing. One important aspect of a dwelling is the indoor milieu. We have
consequently created an environmental index based on 4 indicators about the milieu: Is the dwelling (i) characterised by humidity and damp, (ii) cold and difficult
78
Figure 3.19 Individuals reporting 5-7 symptoms of psychological distress by age and income
(n=3,549). Per cent of persons aged 15 and older.
45 and above
High
Middle
Low
30 to 44
Below 30
0
10
20
30
40
50 Per cent
Figure 3.20 Persons 15 and over reporting 5–7 symptoms of psychological distress by quality
of their dwellings’ indoor environment (n=3,608). Per cent.
Men
Women
Very good
Good
Fair
Poor
Very poor
0
10
20
30
40
50 Per cent
to heat in winter, (iii) uncomfortably hot in summer, and (iv) poorly ventilated?6
The survey results show that low-quality dwelling is a strong predictor of faltering
psychological health for both women and men (Figure 3.20). For women, 41 per
cent in a home with a very poor indoor environment compared to 17 per cent in a
home with a very good indoor environment, i.e. less than half as many, report at
least 5 distress symptoms. For men, the association between indoor environment
and distress is a bit weaker, but the contrast between men residing in homes with
very good indoor conditions and those in very poor conditions is still substantial –
19 and 34 per cent respectively report 5 or more symptoms of mental ill health.
6
If the living quarters cannot be described by any of these characteristics, it is assigned the value “very
good” indoor environment; if it can be described by 1 of them, it is given the value “good”; if it can
be described by 2 characteristics, the value is “fair”; 3 characteristics give the value “poor”; and, finally, a dwelling that can be described by all 4 characteristics is assigned the value “very poor” indoor environment. The scale is used in Figure 3.20.
79
Never-married Women Happier; Divorced and Widowed More
Distressed
Civil status is an indicator of a person’s life stage. The various life stages are typically characterised by different responsibilities and stress factors. Hence one would
assume that civil status affects the happiness of a person. The LIPRIL reveals that
single, never-married persons (almost 70 per cent are below 25 years of age) are
happier overall than other persons. As shown by Figure 3.21, they report fewer symptoms of psychological distress than both those currently married and those who have
been married before (the separated, divorced, or widowed).
However, civil status does not affect women's and men's psychological wellbeing in exactly the same way. Single, never-married men are different from married
men and men who have been married before, because only half as many of them
report 5 or more symptoms of psychological distress compared to the other 2 groups
(Figure 3.22). The same Figure shows that divorced and widowed women are
Figure 3.21 Psychological distress by civil status: Percentage of persons aged 15 and older by
number of symptoms of reduced mental well-being (n=3,608).
Per cent
25
Single, married before
Married
Average
Single, never married
20
15
10
5
0
0
1
2
3
4
5
6
7
Figure 3.22 Psychological distress by civil status: Percentage of men and women who report
5–7 symptoms of reduced mental well-being (n=3,608).
Per cent
50
Men
Women
40
30
20
10
0
80
Single, never married
Married
Single, married before
considerably more mentally distressed than other women. This may have emotional
and economic as well as other explanations. One cause for their worries and depressed moods is perhaps the increased responsibilities that follow from being alone
at a later stage in life - many of these women are household heads and lone parents with children under the age of fifteen.
Few See a Doctor for Mental Distress; Use of Medication
Increases with Age
Some 22 per cent of the adult respondents took antidepressants, sedatives or other
medicines regularly to treat and alleviate psychological symptoms and problems
during the 6 months prior to the interview. Another 16 per cent had used such drugs
from time to time (Table 3.4). As demonstrated by the Table, the use of medication rises as people get older. For example, nearly 5 times as many persons in the
oldest age group compared to the youngest age group use medicines regularly. During
the same six-month period, just over 1 per cent saw a medical doctor as a result of
psychological distress. In contrast, some 46 per cent visited a doctor for other conditions of ill health.
Table 3.4 Persons using medicine due to psychological distress in the past 6 months by age
groups (n=3,592). Per cent of persons aged 15 and older.
15–24
25–34
35–44
45–59
60+
Total
Regularly
10
16
23
37
48
22
From time to time
14
18
18
18
12
16
3.6 Medical Consultation and Treatment
The LIPRIL is not particularly concerned with the prevalence of acute illness and
injury per se, but such data serve as an introduction to the study’s focus on the use
of health services. Nevertheless, the data allow comparison across age groups, which
we set out below. On the subject of health services, the survey asks whether or not
the persons who suffer from a sudden health problem seek assistance from the health
care system, and if so, what kind of health personnel they see, what sort of health
facility is contacted, does the person travel far, and what do consultations cost?
Prevalence of Acute Illness and Injury
All household members were asked if they had suffered from any acute illness or
injury during the 2 weeks preceding the interview. For all individuals over the age
81
Figure 3.23 Prevalence of acute and severe acute illness (including injury) among persons 5 years
and older during the past 2 weeks (n=16,849). Per cent. Interviews conducted during January,
February and March.
Per cent
35
30
25
20
Acute illness
Serious acute illness
15
10
5
0
5-9
10-14
20-24
30-34
40-44
50-54
60-64
70-74
15-19
25-29
35-39
45-49
55-59
65-69
75+ Age groups
of 5, the severity of the illness was assessed by enquiring if it had prevented him
or her from carrying out normal duties such as going to school or work, or doing
domestic work.
Overall, 11 per cent over the age of 5 suffered from an acute health problem
during the reference period, while 7 per cent suffered from a serious or severe problem. In the under-five age group, more than a half (53 per cent) were reported acutely
ill. Figure 3.23 shows the variation according to five-year age groups, excluding the
youngest children. As can be seen, persons aged 10 to 19 years are the least affected
by acute health problems. In line with expectations, the elderly suffer the most from
abrupt health failure. From the age of 20, the incidents of acute illness increase steadily, until among persons over 65 years of age more than 1 in 4 are afflicted.
The interviews were conducted in the months of January, February and March.
The disease pattern is not the same throughout the year. For example, illnesses related to the respiratory system are more widespread in the winter months, whereas
dehydration among the youngest children is more common during the summer.
Therefore, one cannot extrapolate from these findings to yearly rates.
Acute health problems in the Palestinian population are not distributed evenly
across socio-economic groups. Figure 3.24 suggests that persons of all ages in the
upper income group suffer from acute health failure less often than others - the lines
fall as they move from the left side of the graph, where we find individuals residing
in low income households, towards the right side, where we find those with higher
incomes.
82
Figure 3.24 Prevalence of acute illness among persons 5 years and older by age and annual
household income (in 1,000 LL) (n=16,575). Per cent.
Per cent
35
30
25
20
15
45 and above
3044
Below 30
10
5
0
<1,801
1,8013,600
3,6015,100
5,1017,800
>7,800
The Young and Old See a Doctor Most Often; Specialists Frequently
Consulted
Seventy-five per cent of all afflicted persons (84 per cent of those with a severe health
problem and 58 per cent of those less seriously ill) sought professional help. There
is no significant variation in the tendency to seek medical advice or help according
to insurance status or socio-economic status as measured by household income.
However, the survey indicates that residents of the Palestinian refugee camps in the
North obtain assistance more often than the Palestinian refugees in the Southern
camps and those residing outside the camps, at 83, 73 and 71 per cent respectively.
Furthermore, there is variation by age, as children below 15 as well as persons 55
years and over seek medical advice and treatment more often than the young adults
and the middle-aged (Figure 3.25).
Figure 3.25 Persons consulting someone following acute illness by age (n=1,967). Per cent of
individuals aged 5 years and older.
Per cent
100
90
80
70
60
50
40
30
20
10
0
59
1519
2529
3539
4549
5559
6569
75+ Age
groups
1014
2024
3034
4044
5054
6064
7074
83
Almost all of those who consult someone visit a physician: 56 per cent see a general practitioner and 40 per cent visit a medical specialist, while the rest see some
other person, such as a pharmacist, nurse, healer or a religious man. The high
number of persons going to a specialist may suggest that there are many specialist
physicians available, but may also indicate a general preference for expert help even
when such care is strictly speaking not needed. Therefore, even though people
choose what they believe is the best for themselves and their children, the above
pattern of choices may suggest that they overuse the more expensive specialist
services and hence impose unnecessary costs on themselves. We return to expenditure on health services in a separate subsection.
Not surprisingly, individuals covered by medical insurance see a specialist doctor more often than individuals who are not covered, at 46 against 40 per cent respectively. However, since only 7 per cent are covered (and only 83 insured individuals in our sample suffered from acute illness) we should treat this finding with
caution. (See section 3.7 below for further details of insurance coverage.) Furthermore, the findings show that socio-economic background has some effect on the
use of health services, as more people in the highest income group compared to the
rest benefit from specialist help: 45 per cent in the upper group versus 36 to 42 per
cent in the other 4 income groups. However, the variation is again moderate and
should be interpreted with caution. The main picture is perhaps one of similarity
across socio-economic standing.
UNRWA Services Most Frequently Used; One in Three Patients
Travel Afar
It is widely believed that the Palestinian refugees in Lebanon rely almost solely on
UNRWA for health services (see for example USCR 2000:17). In spite of this, the
LIPRIL shows that UNRWA does not stand as alone in the field of health services
as many may think. Yet there is no doubt that UNRWA is a cornerstone in the
provision of health services to the Palestinian refugees. For example, the UN agency is by and large the most frequently used place to get help in connection with
sudden illness: UNRWA health clinics are visited by 44 per cent of those who are
ill.7 Thereafter follows private clinics, private hospitals and PRCS hospitals (Table
7
In 1999 UNRWA was running 25 primary health care facilities in Lebanon, 13 inside official camps
and 12 outside camps. All facilities provided family planning services, 15 had laboratories, 17 provided dental services, 24 gave special care for communicable diseases, and 15 health points had specialist care in cardiology, obstetrics and gynaecology (UNRWA 2000a: Table 1, Fact sheet:79; UNRWA 2000b:35).
84
Table 3.5 Place of consultation following acute illness by region of residence (n=1,465). Per cent.
Camp North
UNRWA clinic
37
Camp South
Non camp
All
51
40
44
Private clinic
20
19
22
20
Private hospital
12
11
11
11
PRCS hospital
12
9
11
10
NGO dispensary
6
4
8
6
Government hospital
4
2
2
3
At home
4
2
2
3
Pharmacy
2
1
1
2
Government health center
1
0
2
1
PRCS clinic
1
1
0
1
Other
Total
1
0
0
0
100
100
100
100
3.5).8 According to the Table, NGOs handle 17 per cent of all cases of acute illness referred to the health care system.9
The regional variation is marginal, but UNRWA clinics are somewhat more frequently used in the South than elsewhere, and NGO centres slightly less. There is
also variation according to other background factors. For instance, men go to private clinics more often than women, at a rate of 14 versus 9 per cent, while women
visit UNRWA clinics more often than men, at 47 versus 41 per cent.
Those insured tend to visit private hospitals and NGO dispensaries more frequently than the uninsured, at 23 versus 11 per cent and 13 versus 5 per cent respectively. That those insured have a preference for private service providers is in
accordance with expectations and similar to what is found in other countries, e.g.
Jordan (Kharabsheh and Tiltnes 1998).
Looking at socio-economic status, the most striking observation is that there
is only minimal differentiation across income groups. However, individuals with
high income (relative to others) use UNRWA services somewhat less frequently
than other people (Table 3.6, next page). Instead, they show up more often at NGO
dispensaries, but they do not visit private clinics and hospitals more frequently as
we would have expected, and as is the case in Jordan, for instance (Kharabsheh
and Tiltnes 1998).
8
At the time of the survey, PRCS was running 4 hospitals and 9 primary health clinics in Lebanon
(USCR 2000:19). In the beginning of 1999, UNRWA started to refer patients to PRCS for in-patient care (USCR 2000; UNRWA 2000a).
9
According to one source, health NGOs serving Palestinian refugees in Lebanon employ about 1,500
persons (900 full time and 600 part time) in addition to some 400 volunteers (NPA 2000).
85
Table 3.6 Place of consultation following acute illness by annual household income (in 1,000 LL)
(n=1,465). Per cent.
Less than
1,800
1,801–3,600 3,601–5,100 5,101–7,800
More than
7,800
UNRWA clinic
47
49
45
39
37
Private clinic
21
18
20
21
22
Private hospital
12
12
10
10
12
PRCS hospital
10
9
14
7
12
NGO dispensary
4
5
4
9
7
Government hospital
3
2
1
4
3
At home
2
2
3
5
2
Pharmacy
1
1
1
4
1
1
Government health center
0
1
2
0
PRCS clinic
1
2
0
0
1
Other
0
0
0
0
0
100
100
100
100
100
Total
No more than 1 out of 4 individuals who suffer from a sudden health problem
refrain from seeking medical advice or treatment. The majority of them, 77 per
cent, are either not ill enough to need professional help, or they treat themselves,
or are treated by a household member. Thirteen per cent say they cannot afford
consultation or treatment – 23 per cent in the lower income quintile in contrast
to 4 per cent in the upper income quintile. Only 2 per cent argue that there is
not any appropriate medical facility nearby, and hence do not seek help. A few
say they are too busy, which most likely implies that they do not need attention
from a professional, and the rest do not specify the reason for not obtaining help.
While 34 per cent of acutely ill persons receive professional medical assistance
within the hara or neighbourhood where they live, 29 per cent travel within the
locality or town, and 37 per cent see a medical doctor or similar in another locality
or town. Figure 3.26 shows the travel distance from place of residence to place of
Figure 3.26 Travel distance to place of consultation by region (n=1,465). Per cent.
Within neighbourhood
Within locality/town
To another locality/town
Non camp
Camp North
Camp South
0
86
20
40
60
80
100
Per cent
consultation for people living in the 3 regions. Unmistakably, camp dwellers in
the South have the easiest access to health services, with 46 per cent getting help
within their living area following acute health failure, and only 26 per cent travelling afar. Neither the Palestinian refugees residing in the Northern camps nor
those living outside of the refugee camps have such uncomplicated access to medical services as those living in the camps in South Lebanon. No more than 21 per
cent of the north and non-camp sick persons received consultation and treatment
close to home. Individuals residing in the gatherings clearly have the most difficult access to adequate health services, as roughly 6 in 10 travel from their place
of living to the nearest town or to another town or city for professional help.
As already stated, many health services are more easily available to the southerners compared to their brothers and sisters in the other 2 regions. This at least
partly results from the fact that a considerable proportion of the population here
reside in the large Ein El Hilweh and Rashidieh camps (of Saida and Tyre respectively), which have a better coverage of (UNRWA) health services than many other
Palestinian refugee camps and non-camp neighbourhoods.
Those insured and people in the highest income groups tend to travel a bit farther than other people. For instance, while 48 per cent of the insured travel to another town, 36 per cent of the non-insured do so. Additionally, whereas 40 and 46
per cent of the second highest and highest income groups travel to a different town
to get professional medical assistance, between 33 and 36 per cent in the 3 lower
income groups do the same. We would assume, however, that for a substantial
number of the insured and the relatively affluent, the travelling is a result of free
choice and with the objective of receiving improved treatment and not necessarily
a reflection of necessity.
UNRWA the Less Expensive Place to Go; No Variation in
Expenditure Across Socio-economic Groups
The LIPRIL asked how much those who were ill paid for the consultation and the
subsequent medication or treatment, if any. The mean and median10 expenditures
for consultation are LL 57,000 and LL 5,000 respectively, for treatment (including
care, medication, remedies) LL 107,000 and LL 20,000, while the mean and median total expenditures are LL 164,000 and LL 30,000 respectively. As is evident
from the top bar of Figure 3.27, about a quarter of the cases (24 percent) were not
10
The mean, often called the average, is the most common measure of central tendency. Here, the
values for all observations are added together and divided by the number of observations. In contrast, the median, a second measure of central tendency, is the outcome that divides a distribution of
observations – ranked from low to high value – exactly into halves: half the cases will have values
above the median and half will have values below the median (Bohrnstedt and Knoke 1994).
87
Figure 3.27 Total consultation and treatment costs (in 1,000 LL) by type of doctor (n=1,355)
and health institution (n=1,196) visited. Per cent.
No cost
1 30
31 100
101 or more
Total
Private clinic
Private hospital
PRCS hospital
UNRWA clinic
Specialist doctor
General practitioner
0
20
40
60
80
100
Per cent
charged anything, while nearly 1 in 5 (18 percent) paid more than LL 100,000
altogether.
The same Figure indicates that consultation and medication bills vary considerably across different types of health institutions and according to whether the sick
person sees a general practitioner or a specialist doctor. While 36 per cent of the
sick who saw an ordinary physician did not pay anything for consultation, prescription and medicines, only 6 per cent of those who saw a specialist did the same. In
the first group, 38 per cent paid between LL 1,000 and LL 30,000 compared to 15
per cent in the second group. Thus, seeing a specialist is clearly the most expensive
alternative.
Furthermore, Figure 3.27 compares the 4 most widely used health institutions.11
It shows that the cheapest place to obtain professional help in case of emergency
and acute illness is at the UNRWA clinics, where just about half of the patients (48
percent) get free consultation and treatment and 1 in 3 have a total outlay of between LL 1,000 and LL 30,000. The private institutions are evidently the more
expensive alternatives.
There is no difference in out-of-pocket expenditure for the insured when compared to the uninsured (Table 3.7). However, as the insured tend to use specialist
services somewhat more often and as these services are more expensive, one may
conclude that insurance pays off. Nor is there any significant difference in out-ofpocket expenditure across income groups. Thus, the poorest segments of the
11
The number of observations for the other institutions is too low to permit comparison.
88
Table 3.7 Total consultation and treatment costs by insurance status (n=1,396) and annual
household income in (1,000 LL) (n=1,372). Per cent.
No cost
1,000–30,000 LL 31,000–100,000 LL 101,000 LL or more
Not insured
24
29
30
17
Insured
24
28
32
17
Less than 1,800
22
29
33
17
1,801–3,600
26
29
27
17
3,601–5,100
24
31
29
16
5,101–7,800
21
34
29
17
More than 7,800
24
23
34
19
Palestinian refugees in Lebanon pay roughly the same in absolute terms for medical diagnosis, advice and treatment, as the wealthier segments.
3.7 Medical Insurance
An important determinant of accessibility and utilisation of health services is medical insurance, understood here as programmes that give the individual free or highly
subsidised access to health services. Although the services provided may vary considerably between the different programmes, being covered by a programme gives
the insured a benefit over the non-insured.
About 98 per cent of the surveyed population are registered with UNRWA and
hence are entitled to and benefit from the various health services rendered by UNRWA. However, as UNRWA provides only a limited set of services and puts a stronger emphasis on preventive rather than curative health care, holding medical insurance makes a big difference for access to hospital as well as certain outpatient
services. The LIPRIL finds that only 7 per cent of the Palestinians are covered by
health insurance. This is very low and compares with 47 per cent found for Beirut (Karam et al 1997), 42 per cent for Lebanon overall (Ministry of Social Affairs/UNDP 1998), 26 per cent for the Palestinian refugee camp population of
Jordan (Khawaja and Tiltnes 2002), and 61.5 per cent for the West Bank and Gaza
taken as a whole (PCBS 1997).
As shown in Figure 3.28, there is some variation across regions, with the highest insurance coverage found outside of the refugee camps. More significant, however, is the effect of income. The Figure shows that in the households with the highest
income, the coverage rate is substantially higher than in the 4 lower income groups
with 17 against 3 to 5 per cent respectively. Nonetheless, what stands out is the overall
low coverage of medical insurance.
89
Figure 3.28 Individuals covered by health insurance, by annual household income (in 1,000 LL)
(n=18,813) and region (n=19,117). Per cent of total population.
Yearly household
income
>7,800
5,1017,800
3,6015,100
1,8013,600
<1,801
Region
Non camp
Camp South
Camp North
0
5
10
15
20
Per cent
3.8 Satisfaction With Medical Services
One in Three Households Not Satisfied with
Local Medical Services
Satisfaction is determined by several factors, such as the availability and quality of
services, and expectations. The LIPRIL does not measure the perceived quality of
local health services, but asks about the general satisfaction with the medical services available (or unavailable) in the living area. In response to this question, 38 per
cent of the households said that they are very satisfied or rather satisfied, 25 per cent
reported that the local health services are acceptable, while 37 per cent claimed to
be rather dissatisfied or very dissatisfied. To put the findings into perspective, this
compares to 71, 10 and 18 per cent in a national Jordanian survey, which asked the
same question (Kharabsheh and Tiltnes 1998). In the Palestinian refugee camps in
Jordan, 10 per cent of the households stated that they are rather dissatisfied or very
dissatisfied with the medical services in their communities (Khawaja and Tiltnes
2002). Hence, almost 4 times as many are unhappy with the local health services
in the Palestinian community in Lebanon compared to the Palestinian refugee camp
community in Jordan.
The level of satisfaction with the local health services varies somewhat across
regions. Figure 3.29 shows that households residing in the camps in the North are
the least discontented (34 per cent rather dissatisfied or very dissatisfied), while
households living outside the camps are the most discontented (45 per cent rather
dissatisfied or very dissatisfied).
90
Figure 3.29 Households’ satisfaction with local health services by region (n=3,450). Per cent
of all households.
Very satisfactory
Rather satisf.
Acceptable
Rather unsatisf.
Very unsatisf.
Non camp
Camp South
Camp North
0
20
40
60
80
100
Per cent
One in Four Dissatisfied with Treatment at UNRWA Centres
The survey asked about people’s satisfaction with the help and service they received
following acute illness. Some 3 out of 4 cases are rated as satisfactory: 38 per cent
said that they were very satisfied with the consultation, treatment and care, 36 per
cent stated that they were rather satisfied, 9 per cent replied that they were neither
satisfied nor dissatisfied, while 17 per cent were rather dissatisfied or very dissatisfied with the service they received. As shown by Figure 3.30, specialist physicians
are rated as slightly better than general practitioners.
Only 4 different institutions had enough visitors to allow comparison. Private
clinics and hospitals fare better than PRCS hospitals and UNRWA clinics. The latter institution attracts the more dissatisfaction, with 25 per cent of visits being judged
as rather unsatisfactory or very unsatisfactory. This is in contrast to 10 per cent of
the visits to private clinics (Figure 3.30). Dissatisfaction with services can be relatFigure 3.30 Opinion about treatment and service following acute illness by type of doctor
(n=1,418) and type of health institution (n=1,255). Per cent.
Very satisfied
Rather satisfied
Acceptable
Unsatisfied
Specialist doctor
General practitioner
Private clinic
Private hospital
PRCS hospital
UNRWA clinic
0
20
40
60
80
100
Per cent
91
ed to factors such as the availability and quality of the services, as well as their cost.
Since, as shown earlier, UNRWA seldom charges its users, and only takes a nominal fee when it does, high price and non-affordability cannot be the reason why
almost a quarter of the visits are rated as unsatisfactory. The explanation has to be
found in the availability and quality of the services. One weak point of UNRWA’s
services might be the low number of doctors relative to demand, which leaves the
doctors with very little time for each patient. As a matter of fact, the pressure at the
UNRWA health centres in Lebanon is so immense that each medical doctor on
average holds 91 consultations per day (UNRWA 2000a:80 (Fact sheet)).
3.9 Maternity Care
Prenatal Care the Rule; Eight Out of Ten Visit UNRWA; Six Out of
Ten See a Doctor
During pregnancy, the vast majority of women see professional medical personnel
for prenatal check-ups: 58 per cent visit a medical doctor, 40 per cent a midwife, 8
per cent go to a nurse, while 5 per cent do not receive any prenatal care. These figures add up to more than 100 percent, because most women have more than 1 visit
and may see different persons with different backgrounds during the pregnancy. The
above figures indicate that the proportion of pregnant women receiving prenatal care
by trained personnel is about the same as found for Beirut and Jordan. However, a
considerably smaller number of women see a physician for pregnancy controls than
in Beirut, where 97 per cent of the 95 per cent who received care saw a medical doctor
(Deeb et al 1997:208–209), and in Jordan, where 90 per cent of all pregnant women
see a doctor (DOS and MI 1998:81).
About half of those who do not have prenatal visits say that they prefer not to
have such care or that the care is not needed, approximately a quarter of them think
that pregnancy check-ups are too expensive, while the rest give various other reasons for not obtaining prenatal health controls. UNRWA clinics are by far the most
popular place to go for prenatal care. Almost 80 per cent of all women with a history of pregnancy during the 5 years prior to the survey and who reported receiving such care at least once, said they had visited UNRWA.
The LIPRIL indicates that the pregnant woman’s economic standing influences
the type of institution as well as the kind of medical profession she seeks for prenatal care. More pregnant women in the highest income group go to specialised pregnancy clinics and private physicians’ offices compared to other income groups (Table
3.8), and the higher the income the higher the proportion that sees a medical doctor at least once during the pregnancy (Figure 3.31).
92
Table 3.8 Type of institution visited for pregnancy care among those who saw someone, by
household income. Per cent of all pregnancies during the past 5 years (n=2,809). Columns add
up to over 100 per cent, because some women have visited more than one type of facility.
Low
Lower
middle
Middle
Higher
middle
High
Total
77
81
78
81
70
78
UNRWA clinic
Private doctor
6
6
4
8
16
8
Pregnancy clinic
6
7
6
5
11
7
Private hospital
4
6
7
7
8
6
4
PRCS clinic
2
5
4
5
3
PRCS hospital
4
3
3
3
5
4
Government hospital
1
1
1
1
1
1
Government health center
1
0
1
1
1
1
MCH health center
1
1
1
2
2
1
At home
1
1
0
1
1
1
Figure 3.31 Type of medical profession seen for pregnancy care among those who saw someone, by household income. Per cent of all pregnancies during the past 5 years (n=2,809).
Doctor
Nurse
Midwife
High
Higher middle
Middle
Lower middle
Low
0
20
40
60
80
100
Per cent
There is also variation across regions. Non-camp pregnant women tend to use private doctors and private hospitals more often than the average, while pregnant women from the Northern refugee camps more frequently visit private hospitals and pregnancy clinics. In the Southern camps, however, pregnant women lean more on
UNRWA’s services than elsewhere (Table 3.9). These differences are most likely a
consequence of the availability of the various sorts of services to the users, including their geographical proximity.
Two-thirds of pregnant women have their first pregnancy visit within the first
trimester of pregnancy, while 5 per cent start in the sixth month or later (Figure 3.32).
As in Jordan, the level of concern regarding prenatal health, in the sense of
consulting pregnancy health care services early on in the pregnancy, increases by
education (Blome Jacobsen, Khoury and Størmer 1998). While 74 per cent of
93
the pregnant women with a secondary or higher degree visit someone during the
first three months of pregnancy, only 65 per cent of the women who have not completed basic schooling do the same. However, contrary to in Jordan, income has no
significant effect on seeing a doctor early in pregnancy (data not shown).
The mean and median numbers of prenatal visits among the pregnant women who received a minimum of 1 check-up are 6.95 and 6.0 respectively, which
are similar to data for Jordan (Blome Jacobsen, Khoury and Størmer 1998; DOS
and MI 1998).
Neonatal tetanus can cause neonatal mortality, which is why pregnant women
are sometimes given tetanus toxoid injections. The LIPRIL shows that in 56 per cent
of the pregnancies during the five-year reference period, the women received a tetanus vaccination, which is higher than the most recent estimates for Jordan at about
40 per cent (DOS and MI 1998:82).
Table 3.9 Type of institution visited for pregnancy care among those who saw someone, by
region. Per cent of all pregnancies during the past 5 years (n=2,809). Columns add up to over
100 per cent, because some women have visited more than one type of facility.
Camp North
Camp South
Non camp
Total
UNRWA clinic
76
Private doctor
10
82
72
78
5
10
Pregnancy clinic
10
8
5
5
7
6
Private hospital
4
7
9
PRCS clinic
7
2
2
4
PRCS hospital
6
2
3
4
Government hospital
1
1
0
1
Government health center
1
1
1
1
MCH health center
1
1
2
1
At home
1
1
1
1
Figure 3.32 Month of first pregnancy visit. Per cent of all pregnancies the past 5 years, which
had at least 1 visit (n=2,703).
7th month or later
6th month
5th month
4th month
3rd month
2nd month
1st month
0
94
10
20
30
40
50
Per cent
Majority Deliver in Hospital, But Considerable Amount of
Home Deliveries
Overall, three-quarters (76 percent) of all deliveries during the 5 years preceding
the LIPRIL survey took place at a hospital, while 21 per cent were home deliveries
and 2 per cent took place elsewhere, most of them probably at some health clinic.
By way of comparison, the Beirut Health Survey found that over 92 per cent of all
births took place at a hospital (Deeb et al 1997:210) and the 1997 Jordan Population and Family Health Survey reported 93 per cent hospital deliveries (DOS and
MI 1998:83). While there is little difference with respect to the place of delivery
between the regions (not shown), the LIPRIL suggests significant variation across
socio-economic standing. In the upper income group, a noticeably higher proportion of deliveries take place at hospitals and fewer at home compared to the lower
income groups (Figure 3.33). Likewise, with increased education women tend to
give birth at hospitals more often, while home deliveries are fewer (Figure 3.34).
For example, less than half as many women with secondary or higher education give
birth at home compared with women who have not completed basic schooling, at
11 per cent and 24 per cent respectively. Unfortunately the latter group is by far
the larger of the two, and the women in this group were responsible for 65 per cent
of all births in the five-year period preceding the survey.
Figure 3.33 Deliveries during the past 5 years by location of delivery and household income
(n=2,381). Per cent.
Private hospital
PRCS hospital
Home
Government hospital
Other
High
Higher middle
Middle
Lower middle
Low
0
20
40
60
80
100
Per cent
Half of All Deliveries Attended by a Physician
For the most part, women have professional health personnel assisting them during birth: 51 per cent are assisted by a trained midwife, 45 per cent by a physician,
17 per cent by a trained nurse and only 6 per cent by a traditional birth attendant
without modern health education. These figures add up to about 120 percent, implying that a significant proportion of women giving birth have more than 1 trained
95
Figure 3.34 Deliveries during the past 5 years by location of delivery and educational attainment of mother (n=2,415).
Private hospital
PRCS hospital
Home
Government hospital
Other
Secondary or higher
Basic
Less than basic
0
20
40
60
80
100
Per cent
birth assistant. While this is not uncommon for hospital deliveries, it is rarely found
in cases of home births.
The presence of medical doctors at 45 per cent of the deliveries is a fairly low
number. Comparable data from Jordan suggest that physicians assist in 65 per cent
of the births (DOS and MI 1998:85), and a study of Beirut’s population found that
doctors assist in 93 per cent of all deliveries (Deeb et al 1997:210).
The professional qualifications of the birth attendants vary significantly across
certain background factors (Table 3.10). The higher the household income and the
Table 3.10 Births in past 5 years by type of assistance during delivery and various background
factors: household income (n=2,381), education (n=2,415), region (n=2,415) and location of
delivery (n=2,342). Per cent.
Doctor
Nurse
Midwife
Traditional
birth attendant
58
17
41
5
Higher middle
47
17
50
5
Middle
48
20
45
8
Lower middle
40
15
58
5
Household income High
Educational level
Region
Place of delivery
Low
33
14
57
6
Secondary or higher
63
13
39
4
Basic
47
15
48
7
Less than basic
41
18
54
6
Non camp
53
14
41
6
Camp South
47
12
46
8
Camp North
39
23
61
3
Private hospital
73
24
27
2
Government
hospital
55
17
44
1
PRCS hospital
35
18
67
2
3
1
76
20
45
17
51
6
At home
Total
96
education of the pregnant woman, the higher is the likelihood of her having a physician assisting during labour. Compared to their Palestinian sisters in the South and
residing outside the refugee camps, pregnant women from the Northern regions are
less frequently assisted by a doctor. Very few women giving birth at home are
attended by a medical doctor (3 percent) and trained nurse (1 percent), while quite
a number of home births are assisted by traditional birth attendants (20 percent).
This makes the situation for women giving birth at home very different from the
situation surrounding women giving birth at the hospitals. Here, physicians and
trained nurses are present to a much wider degree. Yet there are considerable differences between the various types of hospitals. While at the PRCS hospitals trained
midwives play the largest role assisting 67 per cent of the births, the doctors make
up the personnel group most often present during births at the private hospitals (73
per cent of the deliveries). At the government hospitals, the 2 medical professions
are more even in terms of importance.
One in Ten Wants Better Hygiene and Birth Attendants with
Higher Qualifications
The LIPRIL asked the women who had given birth in the past 5 years if they would
like to see any changes regarding the treatment and care they received when they
gave birth the last time. Overall, 3 out of 4 (76 percent) do not want to see any changes, implying that they are generally satisfied with the attendance they received and
the circumstances surrounding the delivery. Women with low education are slightly more satisfied with their deliveries and birth attendants than other women: 79
per cent of women who have not completed basic schooling suggest no changes, in
contrast to 68 and 72 per cent of women with basic education and secondary or
higher education respectively. Compared to women giving birth at hospitals, those
who deliver at home are more content, as 85 per cent suggest no changes compared
to 73 to 76 per cent of women delivering at the 3 categories of hospitals.
The suggested improvements are shown in Figure 3.35. Improved hygiene and
higher-skilled attendants top the list, as these 2 points are mentioned by 9 per cent
of the women. Interestingly, there is no significant difference between private hospitals, PRCS hospitals and government hospitals (not shown). About 3 per cent believe that the room was too congested. A similar proportion of women call for improved information services or indicate that the food served was sub-standard.
Another 3 per cent make suggestions related to the caretakers: some want only female personnel, while others propose more staff. In addition to the above proposals, a considerable number of women (7 percent) suggested improvements for which
the questionnaire had no pre-coded answer category, and the answers were hence
recorded as “other”.
97
Figure 3.35 Persons suggesting changes regarding care and treatment received at latest delivery (n=1,332). Per cent. 76 per cent (or 1,011 persons) suggested no changes, and are not
included in the graph; many women made more than one suggestion, so the bars add up to
more than 24 per cent.
Only female personnell
More attendance
More personnell
Better food
Better information
Larger rooms
Other
Better skilled personnell
Better hygiene
0
2
4
6
8
10
Per cent
More Than Half Receive Post-natal Care
The majority of births (55 percent) are followed by post-natal check-ups of the
women’s health. This is higher than in Jordan at 28 per cent (Blome Jacobsen,
Khoury and Størmer 1998:332), but similar to what has been reported for Beirut
(Deeb et al 1997:211). In line with the 2 studies just cited, we have found an association between educational attainment and the probability of having a health checkup after giving birth (Figure 3.36). Furthermore, and as shown in the Figure, women
with health insurance more frequently visit a health professional for a post-natal
check. The women who do not have a post-natal health check mostly argue that it
is not needed (85 percent), while some (10 percent) say that the service is too costly.
Figure 3.36 Deliveries being followed by post-natal check-ups of the women’s health during
the 40 days following delivery (n=2,356) by mother’s education and health insurance status.
Per cent of all deliveries.
Less than basic
Basic
Secondary or higher
No insurance
Has insurance
0
98
20
40
60
80
100
Per cent
3.10 Risk Behaviour and Environmental Effects
Tobacco smoking is one of the prime causes of disease and death in the industrialist countries and according to the World Health Organisation (WHO) it is
“emerging as the world’s largest single preventable cause of illness and death” (WHO
1995:34). The World Health Report claims that 1 in 2 long-term smokers die from
smoking and that the smokers who die between ages 35 and 69 lose about 20 to 25
years of their life span compared to non-smokers (WHO 1999:66). Cancer, coronary heart disease and respiratory disease are the 3 most common causes of death
related to smoking (WHO 1999). How many people smoke; how much do they
smoke; and when do they take up the habit? These are among the questions answered
below, based on information given by 1 randomly selected adult (15 years and over)
from each household.
Three in Ten Adults Smoke; Wide Gender Disparity
A minority of the Palestinians in Lebanon smoke. While in the entire adult population 29 per cent are regular smokers, 5 per cent smoke from time to time (Table
3.11). A third of the population has ever smoked daily and 4 in 10 have ever smoked
daily or occasionally. All current tobacco smokers report to smoke cigarettes.
A gender difference in smoking habits is noticeable. Table 3.11 shows that while
44 per cent of men smoke daily, only 16 per cent of women do the same. As many
women as men claim to be occasional smokers - 5 percent. By comparison, the Beirut
1992–93 Health Survey found that 46 per cent of the men and 27 per cent of the
women 18 years of age and older are current cigarette smokers (Nuwayhid et al
1997:128). For the same age category, i.e. 18 and over, the LIPRIL yields 48 per
cent for men and 18 per cent for women. Consequently, the results of the 2 surveys
Table 3.11 Smoking habits by gender: regularity of smoking (n=3,608); average number of
cigarettes smoked daily among regular smokers; and average age when started smoking
(n=1,115). Per cent.
Percent daily smokers
Male
Female
Total
29
44
16
Percent occasional smokers
5
5
5
Percent ever smoked daily
49
18
33
Percent ever smoked daily or occasionally
56
25
40
Mean number of cigarettes per day*
25
17
23
Median number of cigarettes per day*
20
20
20
Mean age when started smoking*
18
21
19
Median age when started smoking*
17
19
18
*Among current, daily smokers.
99
are very similar for men. However, considerably fewer women have taken up the
habit of regular tobacco smoking in the Palestinian population than in the Beirut
population.
By way of comparison, we can also contrast the LIPRIL results with that of the
1996 Jordan Living Conditions Survey (JLCS), which applied exactly the same
methodology as the LIPRIL (Kharabsheh and Tiltnes 1998), and the 1997 Palestinian Health Survey (PCBS 1998). The rates for daily smoking amongst men in
the 3 studies are almost identical: 44 per cent for Palestinians in Lebanon and Jordan, and 40 per cent in the Palestinian territories. However, there is a substantial
disparity in the prevalence rate for women. The LIPRIL finds 16 per cent of the
females to be daily smokers compared to less than 5 per cent in the Jordanian survey and 3 per cent in the West Bank and Gaza study.12 This puts Palestinian women surveyed by the LIPRIL in the middle range, between women surveyed in Beirut and the exceptionally low number of female smokers observed in Jordan and
the self-ruled Palestinian areas. The Palestinian Central Bureau of Statistics suggests
that some under-reporting takes place due to social conventions that disapprove of
smoking among the young and particularly among the young women (PCBS 1998).
Such norms may have had a similar effect in our survey because, “[u]ntil recently,
cigarette smoking was not considered an accepted social practice for women in the
Lebanese culture.” (Nuwayhid et al 1997). Nevertheless, the fact stands that less than
half as many women as men are regular tobacco smokers.
Figure 3.37 portrays the smoking habits of Palestinians in Lebanon according
to gender and age groups. It is evident that the gender gap holds for people of all
ages. The prevalence peaks for both sexes in middle age: for men between 40 and
44 years of age, for women between 35 and 39 years. A similar pattern was found
in the aforementioned Beirut Survey (Nuwayhid et al 1997:131).
Not only are there fewer female smokers, but those females who do smoke regularly tend to smoke less frequently than men: an average of 17 cigarettes daily in
contrast to 25 cigarettes daily for men (Table 3.11). This, however, is higher than
in Jordan, where the average cigarette consumption is 12 for women and 21 for men
(Kharabsheh and Tiltnes 1998). The 1992–93 Beirut survey uses the median number
of cigarettes smoked instead of the average.13 It reports 20 cigarettes daily for both
male and female regular smokers, which is equal to the results of the LIPRIL.
12
The PCBS reports on persons 14 and over, and not 15 and over as reported by the LIPRIL and JLCS.
13
See footnote 10 for definitions of the average /mean and the median.
100
Figure 3.37 Regular smokers by gender and age groups (n=3,593). Per cent of persons aged
15 and older.
Per cent
100
90
80
70
60
50
40
30
Men
Women
20
10
0
1519
2529
3539
4549
5559
6569
70+
2024
3034
4044
5054
6064
Age groups
The earlier the smoking starts, the greater the loss of life expectancy. On a world
basis, very few people start after the age of 20 (WHO 1995). In the USA, some 9
in 10 smokers take up the habit before the age of 18 (WHO 1999: Figure 5.3). The
smokers in the Palestinian refugee camps and gatherings in Lebanon do not deviate
from the global pattern and are also early starters. However, there is variation across
gender here too: on average male smokers take up the habit at the age of 18, while
female smokers start smoking some 3 years later (Table 3.11). If we use the median
age for the onset of smoking instead of the average age, we can compare the LIPRIL
results with the findings for Beirut (Nuwayhid et al 1997). The comparison shows
that the Palestinians start smoking sooner than the Beirut population surveyed in
the 1992–93 health survey, with a median age at onset for men at 17 and 19 respectively, and 19 and 20 respectively for women - all respondents were 18 years
and over.
The LIPRIL shows no significant regional variation in tobacco smoking. Likewise, the expected association between socio-economic status (SES) and tobacco
smoking whereby smoking is gradually reduced by increased education and income
does not exist (Figure 3.38).
Even so, the survey indicates that education and income do have an impact on
smoking prevalence, but that the effect is different for the various generations (Figure
3.39, Figure 3.40). While both higher education and increased income tend to reduce
regular smoking among the youngest and middle-aged, the 2 indicators of SES have
the opposite effect on the oldest generation.
101
Figure 3.38 Daily smokers aged 15 and over by education (n=3,608) and household income
(n=3,549). Per cent.
Educational
level
Secondary or higher
Basic
Less than basic
Income quintiles
Upper
Upper middle
Middle
Lower middle
Low
0
10
20
30
40
50
Per cent
Figure 3.39 Adult daily smokers by age and education (n=3,608). Per cent of persons aged 15
and older.
Prosent
50
45 and above
40
3044
30
Below 30
20
10
0
Less than basic
Basic
Education
Secondary or higher
Figure 3.40 Adult daily smokers by age and household income (n=3,549). Per cent of persons
aged 15 and older.
Per cent
100
90
80
70
60
50
40
30
20
10
0
Low
45 and above
3044
Below 30
Lower middle
Middle
Upper middle
Income groups
102
Upper
The health benefits from smoking cessation are many. The LIPRIL shows that 4
per cent of the adults have been daily (cigarette) smokers at one time, but have
abandoned the habit of daily smoking at some point in the past. Six per cent of
the sampled adult population have been daily or occasional smokers in the past
but have stopped smoking totally.
We calculated the so-called quit ratio (see box) following the 1992–93 Beirut
health survey (Nuwayhid et al 1997) to enable comparison between the 2 studies.
Whereas the men were more likely to stop cigarette smoking (quit ratio = 20 percent) than The quit ratio = number of
women (quit ratio = 12 percent) in the Beirut former smokers / (number of
survey, the LIPRIL found the opposite to be former smokers + number of
true. According to the latter survey, the wom- current smokers)
en’s propensity to stop smoking was slightly
higher with a quit ratio of 19 per cent versus 14 per cent for men.
Weak Association Between Smoking and Health Status
Given that tobacco smoking worldwide is found to have a very harmful impact
on people’s health, we assumed that we would be able to detect some traces of the
relationship between smoking and ill health in our data. Below we take a closer
look at 2 health measures: subjective general health and 2 indicators of physical
health. We begin with the latter.
The assumption is that smoking through its negative effect on the respiratory
system reduces people’s general fitness and capacity to move around easily. The
assumption is further that smoking takes its toll after some time and that the oldest generation, therefore, are affected the most. However, the picture emerging is
not one of total concurrence with our hypotheses. A higher number of male nonsmokers compared to male daily smokers can take a brisk walk and climb stairs
(Table 3.12), but only in the 2 youngest age groups. Surprisingly, among the oldest
men a significantly higher number of smokers than non-smokers seem to be in a
Table 3.12 Percentage of male daily smokers and men who do not smoke daily (15+) who can
walk up and down stairs and go for a brisk walk with ease, by age groups (n=1,419).
15–29
30–44
Daily smokers who can climb stairs easily
82
67
41
Non-smokers who can climb stairs easily
90
78
25
85
79
58
94
84
43
Daily smokers who can go for a brisk walk
without assistance
Non-smokers who can go for a brisk walk
without assistance
45 and above
103
Figure 3.41 Subjective health by smoking habits: Percentage of male, adult (15+) daily smokers and persons who do not smoke daily with bad or very bad general health, by age (n=1,419).
Per cent
100
90
80
70
60
50
40
30
20
10
0
Daily smokers
Nonsmokers
1519
2029
3039
4049
5059
6069
70+
better physical condition, as measured by the selected variables. We will not speculate on possible explanations for this unexpected result, but instead move on to
the association between smoking and the second variable, which rather than focusing on one aspect of people’s health (physical fitness) captures their health status more generally.
Figure 3.41 shows the relationship between smoking habits and self-reported
bad or very bad health among adult males. The graph indicates that there is a tendency for male non-smokers to feel healthier than male smokers. However, as was
the case with physical health above, this trend does not hold for the oldest age
groups. Again, we refrain from speculating on explanations for this pattern, but
conclude that the association between tobacco smoking, perhaps the most important health risk factor, and health in this survey, is at best weak.
Poorer Health Among Adults Living in Low-standard Dwellings
At its best, appropriate housing promotes physical and mental health. It provides people with psychological security, physical ties with their community and
culture, and a means of expressing their individuality (WHO 1989).
As is documented in Chapter 7 of this report, the housing conditions and the immediate living environment of Palestinian refugees in Lebanon are sub-standard in
many respects. Inadequate housing standards logically imply poorer health, while
good housing means good health. For example, safe and sufficient water supply,
sanitary disposal of excreta and solid wastes, and adequate facilities for the storage
and preparation of food give protection against communicable diseases, and proper furnishing prevents children in particular from accidents. We will look at two
aspects of housing here: indoor climate and space.
104
Figure 3.42 Adults with poor or very poor subjective health by standard of dwelling (n=3,593).
Per cent of persons aged 15 and older.
Very poor
Poor
Fair
Good
Very good
0
5
10
15
20
25
Per cent
As shown in Figure 3.42, we find a positive relationship between poor housing
conditions and poor health. “Housing standard” is defined here by an index made
from 4 indicators about the indoor milieu, or climate (cold, heat, damp, ventilation) of the dwelling. The same index was used for the analysis of psychological
distress in section 3.5. More than twice as many persons residing in homes characterised by very poor indoor conditions compared to those living in very good
houses claim their general health to be poor or very poor.
As argued in section 3.5, housing standard can be interpreted as a sign of wealth
and socio-economic standing. In section 3.2, we found that poverty, as defined by
low household income, is positively associated with poor self-assessed general health.
It is, therefore, interesting to isolate the effect of economic standing here by looking at the effect of poor housing within income groups. The result of this exercise
is shown in Figure 3.43. Although not fully consistent within each age group, the
Figure indicates that housing standard is indeed linked to health outcomes.
Another aspect of housing is density, “social” density or crowding, where crowding can be understood as either “objective” crowding, defined as persons per room,
Figure 3.43 Adults with poor or very poor subjective health by standard of dwelling and household income (n=3,534). Per cent of persons aged 15 and older.
Dwelling standard
Very poor
Poor
Fair
Good
Very good
Upper
Upper middle
Middle
Lower middle
Low
0
10
20
30
40
50 Per cent
105
or “subjective” crowding, defined as perceived crowding or, alternatively, lack of
privacy (Edwards et al 1994:4). The assumption is that people living in crowded,
or overcrowded conditions suffer from health failure more often and of a graver
nature than people living in less crowded homes. However, this claim is not supported by our data, as can be seen in Table 3.13. Contrary to expectations, and based
on “objective” definitions of crowding, persons residing in dwellings with the most
space per person tend to report the poorest health.
This finding is in accordance with the relationship between crowding and
psychological distress (Figure 3.44). Here too, it is clearly people with a relatively
large living area who show signs of poor health more often. As can be seen in the
graph, there is no difference between men and women in this respect, although
women report a higher number of distress symptoms overall. A similar result has
been found for Palestinian refugee camp residents in Jordan (Khawaja and Tiltnes
2002). A possible explanation for the lack of association between crowding and poor
psychological as well as general health lies in the positive aspects of living together
with the immediate family and other close relatives. A large proportion of the persons showing signs of considerable mental distress, for instance, are elderly people
living alone, or single parents whose loneliness and lack of help in raising children
most likely outweigh the benefits of a large living area.
Table 3.13 General health by crowding: Percentage of adults (15+) by subjective health status
and number of persons per room in their dwelling (n=3,592).
Houshold members per room
Less than 1
1–1.99
2–2.99
3–3.99
4 and above
Very good
15
16
17
15
16
Good
29
41
43
43
41
Fair
27
24
27
28
26
Bad or very bad
30
19
13
14
16
100
100
100
100
100
Total
Figure 3.44 Psychological distress by crowding: Adults reporting 5–7 symptoms of distress by
persons per room in their dwelling (n=3,607). Per cent of persons aged 15 and older.
4 and above
3-3.99
2-2.99
1-1.99
Less than 1
Women
Men
0
106
10
20
30
40
50 Per cent
Chapter 4 Education
Guri Tyldum and Najla Bashour
4.1 Introduction
A high educational level in the population is argued to promote economic and social development, and widening access to education has thus been a major policy
goal in most developing countries. An educated population is more productive, and
there is clear evidence that educating a population, and in particular women, improves health, reduces child mortality and population growth (Hill and King 1993).
Palestinians, as is often the case for refugee populations, are generally known to
“invest” in education, and are claimed to be among the most highly educated people in the Arab world (World Bank 1993). However, in Lebanon, restricted access
to government educational services is argued to restrain the population’s educational
achievements.
Many Lack Basic Schooling
This chapter starts out with a presentation of the educational system and the main
providers of educational services for the Palestinian camp population in Lebanon.
Thereafter, we present the educational level in the population at large, literacy levels, current enrolment and attitudes to educational services among parents with
children in elementary and intermediate schools.
A third of the Palestinian population in camps and gatherings in Lebanon lack
basic education, and very few have higher education. Limited access to education
used to be an obstacle for women, resulting in low educational levels and high illiteracy rates among older women today. Nowadays, however, young men are more
likely not to complete elementary school than young women. While there has been
an “educational revolution” for women, the educational level is not significantly
higher for the younger generation men than for their fathers and grandfathers. For
those below 30, the educational level is higher among women than men. This is also
reflected in the number of functional illiterates.
Parents have high expectations for their children’s schooling. Half of all parents
with children in elementary or intermediate schools expect their child to complete
post-secondary or higher education. This is in striking contrast to the current
107
situation, where only 5 per cent of the population have any type of post-secondary
education.
The data suggest that place of residence has a significant impact on the educational level of the refugee population. Educational level, literacy rates and current
enrolment are all highest in the Bequaa valley, while the population in Beirut often
ends up with the lowest educational achievements.
4.2 The Educational System
Both UNRWA schools and most private schools follow the curricula and class structure of the Lebanese government schools. A new educational structure was introduced in Lebanon in 1997, and is illustrated in Figure 4.1.
Children are enrolled in elementary school at age 6, but may take two years of
non-compulsory pre-school prior to this. NGOs are the main providers of preFigure 4.1 The educational structure in Lebanon after 1997.
Semi-professional training
2 years
Teacher training, secretary,
laboratory technician etc.
Vocational training
Age
Level
16
II
15
I
University
47 years
BA/BS, MA and PhD
College
2 years or 3 years
Secondary school
Age
Grade
17
12th
16
11th
15
10th
Intermediate school
Age
Grade
14
9th
13
8th
12
7th
Elementary school
Age
Grade
11
6th
10
5th
9
4th
8
3rd
7
2nd
6
1st
Pre-school
Age
Grade
5
K2
4
K1
108
schools for the camp population (see section below). After 6 years of elementary
schooling, students continue for 3 years at the intermediate (also called preparatory) level. Having completed intermediate school, students may take 1 or 2 years of
vocational training, or continue with 3 years of (academic) secondary school. After
the secondary level there are 3 options: 2-year courses of semi-professional training
to become teachers, secretaries, laboratory technicians etc; colleges which offer exams in nursing, engineering etc; and finally, the universities offering standard academic degrees.
Education a Major UNRWA Priority
Most of the Palestinian population in Lebanon have limited access to government
schools, and their education has mainly been the responsibility of UNRWA. Since
1966 when UNRWA’s expenditure on education outstripped that on food rations,
education has been the most important activity of the Agency as measured in monetary expenses (Endresen and Øvensen 1994). In 1998, 47 per cent of UNRWA’s
budget was allocated to the education programme (UNRWA 1999a).
By 1987, UNRWA expenditures (per pupil) on education in Lebanon had been
reduced to about 25 per cent of the 1983 level (when price adjusted the reduction
appears even more dramatic). Since that time, there has been a steady increase in
per pupil expenditures until 1993 when the growth levelled off (UNRWA 1999a).
However, 17 years of civil war destroyed most of the educational infrastructure, or
damaged it badly. During the post war period, UNRWA has been forced to spend
most of its budget on repairs and the reconstruction of school buildings (IPS 1994).
Today, a number of schools are still in strong need of replacement or comprehensive maintenance (UNRWA 1999a). However, according to current UNRWA statistics, the UNRWA schools in Lebanon have the lowest number of students per
class (on average 40/39) and students per teacher (33/28) at the elementary and
intermediate levels, among the UNRWA schools in the region (UNRWA 1999b).
UNRWA Mainly Offers Schooling at the Elementary and
Intermediate Level
UNRWA stopped offering services for pre-elementary education in the early seventies. Hence today there are only two UNRWA kindergartens left in Lebanon, both
located in the Northern parts of the country. Palestinian non-governmental organisations have taken the responsibility for pre-school education in the refugee camps.
During the school year 1998–99, 28 different NGOs operated a total of 85 preschools throughout the country, providing services to 9,092 children. There are large
109
variations between pre-schools with regard to curricula, qualifications of teachers
and tuition (National Institution for Social Care and Vocational Training 2000).
In 1998/99, UNRWA operated 36 elementary and 37 intermediate schools in
Lebanon (UNRWA 1999b). Elementary and intermediate education is offered to
all Palestinian children at ages 6–15. Most UNRWA elementary schools are situated inside camps, making access sometimes difficult for persons living outside the
camp environments (IPS 1994).
UNRWA has recently started operating some secondary schools as well. Until
1993, UNRWA provided only elementary and intermediate schooling, in addition
to vocational courses, and some post-secondary courses (mainly teacher training).
In 1993, UNRWA opened its first secondary school in Beirut, followed by one in
Saida in 1997 and one in Tyre in 1998 (General Commissioner of UNRWA, 1999).
In the school year 2000/01, secondary schools were opened in the North and in the
Bequaa. In the school year 2000/01, UNRWA offered schooling for 2,474 secondary school students. Enrolment in UNRWA secondary schools is however only offered to refugees that are officially registered with UNRWA.
In addition to formal vocational training, UNRWA has since the early 1990s
offered short-term vocational training courses from 8 to 40 weeks of duration (UNRWA 1999c). For students in higher education, UNRWA awards a limited number
of scholarships to academically outstanding students (Endresen and Øvensen 1994).
In 1998/99, 115 students received UNRWA scholarships in Lebanon.
4.3 Educational Attainment
One in Three Have No Complete Elementary Education
About every third refugee aged 10 years or older in the Palestinian camps and gatherings is no longer in school and has not completed any education (Figure 4.2), 13
per cent of the population have never attended school at all, and another 18 per
cent dropped out of school before completing elementary education. An additional 8 per cent are currently enrolled in elementary school. One in 10 have completed the secondary or higher levels, and only 1 in 20 have completed semi-professional
or higher education.
The educational level among Palestinians in Lebanese camps and gatherings is
clearly lower than in the Lebanese population at large (Figure 4.3). In the Palestinian population 10 years of age and above, 39 per cent have not completed any education, which is 10 percentage points higher than in the Lebanese population. The
110
differences are particularly marked for education after intermediate school: in the
Lebanese population, 14 per cent have completed secondary school, while another
8 per cent have higher education. The corresponding figures for the Palestinian population in camps and gatherings are 6 per cent and 5 per cent respectively. If we
compare this with the Palestinian camp population in Jordan, the educational level
is higher there as well: in Jordan 9 per cent of the camp population (aged 10 and
over) have completed secondary school and another 11 per cent have post-secondary or higher education.
When comparing the educational level of the Palestinian population with other
groups we should bear in mind the relatively high out-migration (to Europe and
other Arab countries) in this group (see section 2.7). Persons with secondary or higher
education are more likely to have left the country, and we must assume that the
Figure 4.2 Highest completed educational level. Per cent of population aged 10 years and over.
Per cent
50
Currently enrolled
40
Completed education
30
20
10
0
No
Elementary
complete
school
education
Intermediate
school
Secondary Vocational
SemiHigher
training professional academic
Figure 4.3 Highest completed educational level among the Lebanese population (Palestinian
population not included) and among Palestinians in camps and gatherings in Lebanon. Per cent
of population aged 10 years and over.
No complete
Elementary
Intermediate
Secondary
Post secondary or higher
Palestinian population
in Lebanese camps
and gatherings
Lebanon at large
0
20
40
60
80
100
Per cent
Source: LIPRIL & Housing and Population survey (ACS 1998)
111
educational attainment in the survey population is reduced because of this. However, the differences between Palestinians living in camps and gatherings and the
Lebanese population at large are too large to be accounted for solely by a high level
of out-migration of persons with higher education.
Young Women Attain Basic Education More Often
Than Young Men
As can be expected, the educational attainment varies strongly between age groups,
and is particularly low in the oldest age groups. Women in the oldest age groups in
particular lack basic education – among those over 45 years of age, 85 per cent have
no complete education, compared with 57 per cent of the men.
If we take a closer look at the group of persons with no complete education, only
half are 45 years or over, and contrary to what could be expected, women are only
slightly over-represented (56 per cent). There is thus a significant group in the younger age groups as well, with no complete education: for persons aged 15–29, 1 in 5
are not currently enrolled in school and have not completed the first 6 years of elementary education, and for the population aged 30–44 this is the case for 1 in 3.
The proportion without elementary schooling is significantly smaller among
people aged 15–29 (20 per cent) than in the age groups 30–44 (28 per cent). However these differences are almost fully accounted for by vast differences in educational levels between young and middle-aged women. While 30 per cent of women
aged 30–44 have no complete education, this is only the case for 17 per cent of
women below 30 years of age. If we look at the men separately we find only minor
differences in educational levels between those aged 15–29 (22 per cent) and those
aged 30–44 (25 per cent). As a result of this “female educational revolution”, women in the youngest age groups now attain basic education more often than men.
Figure 4.4 Persons with no complete education. Per cent of population aged 15 and over
(n=11,991).
Average: 35%
Male
Female
1529
3044
45 and above
0
112
20
40
60
80
100
Per cent
Figure 4.5 Persons with no complete education by place of residence. Per cent of population
aged 15–29 and 30–44, not currently enrolled in school (n=5,790/3,482).
Age: 1529
Bequaa
Tripoli
Tyre
Saida
Beirut
0
10
20
30
40
50 Per cent
Age: 3044
Bequaa
Tripoli
Tyre
Saida
Beirut
0
10
20
30
40
50 Per cent
As illustrated in Figure 4.5, there is significant variation in the educational attainment across 5 Governorates. While the Palestinian population in the Bequaa valley
stands out with a particularly large share of the population with complete elementary education (in particular in the youngest age groups), the lowest educational level
is found in Beirut. In the capital, the educational level is particularly low among
men in the youngest age group: 27 per cent of the men aged 15–29 have not completed the first 6 years of elementary school, compared with 17 per cent of the
women. In the Bequaa valley, this is the case for only 12 per cent of the men and 9
per cent of the women in this age group.
Very Few Have Secondary Education
UNRWA started offering secondary education among the Palestinian population
in Beirut in 1993. UNRWA secondary schools were opened in all other Governorates after 1997, but at the time of the fieldwork of the LIPRIL, no groups could
have completed the 3 years of secondary education from these schools. The majority of the refugees with secondary education have completed this education in governmental- or in private schools.
113
At the elementary level, we have revealed a significant increase in the number of
women completing basic education, with elementary education being far the most
common in the younger age groups. However, for secondary education there are
no significant differences between women aged 20–29 and 30–44. Among men,
secondary education is less common among those aged 20–30 than among those
30–44.
There is significant regional variation in the share of the population with
secondary or higher education. Once again we find the highest educational level in
Figure 4.6 Persons with secondary or higher education. Per cent of population aged 20 years
and older (n=9,816).
Male
Female
2029
3044
45 and above
0
10
20
30
40
50
Per cent
Figure 4.7 Persons with secondary or higher education. Per cent of population aged 20–29 and
30–44 (n=3,315/3,481).
Age: 2029
Tyre
Beirut
Saida
Tripoli
Bequaa
0
10
20
30
40
50 Per cent
Age: 3044
Tyre
Beirut
Saida
Tripoli
Bequaa
0
114
10
20
30
40
50 Per cent
the Bequaa, while Beirut and Tyre show the lowest levels. The regional differences
are most marked for the youngest generation (Figure 4.7).
As can be expected, there is a strong relationship between household income and
its members’ educational levels. Dividing the Palestinian households into 5 groups
(quintiles) according to income, we find that secondary education is 4 times as common in the most affluent group compared to the poorest one.
4.4 Illiteracy
One of the principal goals of education is the eradication of illiteracy, and the ability to read and write is considered almost a basic human right. As seen above, 1 in
3 Palestinians in Lebanese camps and gatherings have not completed elementary
education. In the older age groups, the proportion is even higher. It is thus interesting to examine further whether this low-educated group has left school without
reaching functional literacy. The LIPRIL asked whether the household members are
able to read and understand everyday writing. Persons who are not able to read everyday language, not even with difficulty, are here classified as functionally illiterate.
Strong Reduction in Female Illiteracy
Among the Palestinian population living in camps and gatherings in Lebanon, 20
per cent are not able to read everyday writing, and are thus classified as illiterates
(Figure 4.8). However, in the population aged 15–29 and 30–44, the proportion is
much smaller than in the age group 45+. As for the general educational level in the
Figure 4.8 Persons unable to read and understand everyday written material, by gender and
age. Per cent of population aged 15 years and over.
Male
Female
1529
3044
45 and above
0
20
40
60
80
100
Per cent
115
population, the overall decline (between generations) in illiteracy is caused largely
by a significant decrease in female illiteracy. In spite of elementary education being
somewhat more common among men in the youngest age group, the illiteracy level is higher among men aged 15–29 than among those aged 30–44. However, in all
age groups the number of illiterates is significantly lower than the number of persons without elementary education. For those over 30 years of age, women are more
often illiterate than men. In the youngest age group, the situation is turned around,
and illiteracy is most common among men.
As for educational attainment, illiteracy rates vary by place of residence. Bequaa
demonstrates the lowest illiteracy rates among both women and men in all age groups
below 45. While illiteracy is almost non-existent among men aged 15–29 in the
Bequaa valley, 1 in 10 men in this age group are illiterate in Beirut and Saida. Regional differences are not as marked for women in the youngest age group. However, among women aged 30–44, illiteracy is particularly high in Tyre (19 per cent)
and Beirut (16 per cent), and lowest in Bequaa (8 per cent).
The economic situation of a household is strongly associated with the literacy
of its household members (see chapter 6). Among the population living in the poorest
20 per cent of the households, 1 in 3 cannot read, compared to 1 in 8 in the richest
20 per cent.
Figure 4.9 Functional illiterates (persons that cannot read everyday writing even with difficulty) by place of residence. Per cent of population aged 15–29 and 30–44 (n =5,460/3,462).
Age: 1529
Bequaa
Tripoli
Tyre
Beirut
Saida
0
5
10
15
20
Bequaa
25 Per cent
Age: 3044
Tripoli
Tyre
Beirut
Saida
0
116
5
10
15
20
25 Per cent
4.5 Enrolment and Drop-out
Low adult literacy rates may be a result of past under-investment in education, and
thus do not necessarily reflect recent progress. However, as long as a significant proportion of the younger generation do not read, we need to take a look at current
enrolment and dropouts at the primary school level.
High Enrolment Until Age 11 – Significant Drop-out After This
Almost all 7-year-olds are enrolled in school, and the enrolment level remains above
96 per cent until the age of 11 (Figure 4.10). At age 14, 4 in 5 are still enrolled, but
at age 16 only half remain in school. Between ages 12–18, enrolment is significantly higher for girls than for boys. After this age, male enrolment rates surpass those
for women. As we shall see below, men in this age group are more often enrolled at
the secondary or even intermediate level, or are taking vocational training. The proportion enrolled in semi-professional and higher education is the same for men and
women.
Some regional variation in enrolment rates is observed. Once again, the Bequaa
area stands out, with the highest enrolment rates for all age groups, while the lowest enrolment rates are found in Beirut. In the next section, we will take a closer
look at enrolment rates at the various educational levels.
Figure 4.10 Enrolment in school or pre-school by age and gender. Per cent of pupils aged 7–22.
Per cent
100
90
80
70
60
Male
Female
50
40
30
20
10
0
5
6
7
8
9
10 11 12 13 14 15 16 17 18 19 20 21 22 Age
117
Drop-out Often Unrelated to Household Economy
At age 7–15, children should be enrolled in primary or intermediate school (grades
1–9). As Figure 4.10 shows, enrolment stays close to 100 per cent until age 10, when
it starts to drop rapidly. Among children aged 10–15, 1 in 6 boys and 1 in 10 girls
are not enrolled in school. Two thirds of these dropouts are, according to their parents, caused by repeated failure, or lack of interest in school. Among the girls, 1 in
10 have left school in order to get married or to take care of family members.
Every tenth dropout (among both boys and girls) is explained by family poverty
and the need to help the family economically. About 5 per cent of the boys and 2
per cent of the girls in the age group 10–15 worked (either for payment in cash or
kind, including self-employment and home production or work on family farm/
enterprise) during the week preceding the survey. About half of the boys that
worked during the week prior to the interview no longer attend school. However, 4 in 5 male dropouts in this age group did not work during this week. Girls
tend to stay in school in spite of having to work – there is no difference in the
enrolment level among those who work and those who do not.
As illustrated in Figure 4.11, there is only a weak relationship between household income and dropout rates. Boys growing up in poor households are somewhat
more likely not to be enrolled in school than boys growing up in the most affluent
households, but male drop-out rates are generally high at all income levels, except
for those living in households in the richest income group. Girls in the age group
10-15 years old are in general more likely to attend school than boys, but for girls,
high household income does not lead to higher enrolment. Female enrolment rates
are somewhat higher in mid-income households than in both the richest as well as
the poorest households. In other words, boys living in poor households have a someFigure 4.11. Children currently enrolled in school, by gender and household income quintiles
(equivalence scaled). Per cent of children aged 10–15 (n=2,606).
Per cent
100
Female
90
Male
80
70
0
118
First
quintile
(lowest)
Second
quintile
Third
quintile
Forth
quintlie
Fifth
quintile
(highest)
Figure 4.12 Children currently enrolled in school, by sex of child and educational level of household head. Per cent of all children aged 10–15 (n=2,640).
Male
No complete education
Elementary or intermediate
Secondary
Post-secondary or higher
70
80
70
80
Female
90
100
Per cent
90
100
Per cent
No complete education
Elementary or intermediate
Secondary
Post-secondary or higher
what larger probability of dropping out of school. However, the majority of dropouts cannot be explained with reference to family poverty.
A more important factor in explaining primary and intermediate school enrolment is the educational level of the household head (Figure 4.12). We find a quite
strong connection for both boys and girls: 1 in 5 children living in a household where
the head has no complete education, have dropped out of school before age 15,
compared to 1 in 8 if the head has completed elementary, and to 1 in 35 if the head
has post-secondary or higher education. Here, the boys’ education is more easily affected by social background than the girls’.
Delayed Enrolment in Secondary and Higher Education
We have seen that there is a serious decline in enrolment at age 16, which is at the
time of entry at secondary schools or vocational training. About 40 per cent of 16–
18-year-olds are enrolled. But as illustrated in Figure 4.13, almost half of these are
still at the elementary or intermediate levels. Only 15 per cent of children in this
age group are in secondary schools, and an additional 7 per cent of the boys and 5
per cent of girls attend vocational training.
119
Figure 4.13 School enrolment by gender, age and educational level. Per cent of population
aged 16–21 (n=2,517).
Elementary and Intermediate
Vocational training
Age 1921
Female
Secondary
Semiprofessional
College and university
Male
Age 1618
Female
Male
0
10
20
30
40
50
Per cent
Among persons aged 16–18, enrolment levels are higher for women than for men,
while after 18 years of age, school enrolment becomes more common among males
than females. However, the differences between the sexes are largely due to delayed
enrolment at the lower levels. For those aged 16–18, there are no differences between the sexes in secondary school enrolment, and for those aged 19–21, an equal
share of men and women attend schools for semi-professional or higher education.
In the youngest age group, women are more likely to remain at the elementary or
intermediate levels. In the older age groups, a larger proportion of the men are still
in secondary school. For both age groups, men are more likely to attend vocational
training.
In the Bequaa and in Tripoli, where UNRWA did not offer secondary education
at the time of the survey, the proportion enrolled in secondary school is larger at 19
and 14 per cent respectively, versus about 9 per cent in the other regions (Figure 4.14).
However, while between 47 to 66 per cent of those enrolled in secondary schools
Figure 4.14 Persons enrolled in school by type of school and region. Per cent of population aged
16–21.
Elementary + Intermediate
Vocational training
Secondary
Semiprofessional
College and university
Tyre
Saida
Bequaa
Tripoli
Beirut
0
120
10
20
30
40
50 Per cent
Figure 4.15 Persons currently enrolled in school by household income and type of school. Per
cent of population aged 16–21 (n=2,524).
Elementary + Intermediate
Vocational training
Secondary
Semiprofessional
College and university
Fifth quintile (highest)
Forth quintlie
Third quintile
Second quintile
First quintile (lowest)
0
10
20
30
40
50 Per cent
in Beirut, Saida and Tyre attend UNRWA secondary schools, the absolute majority
of secondary school students in Tripoli and Bequaa attend private schools. Only
14 per cent attend government secondary schools, varying from 5 per cent in
Bequaa to 17 per cent in Saida. There is seemingly no direct relationship between
the use of (which may indicate accessibility) government or UNRWA schools, and
overall enrolment at the regional level.
Looking at enrolment at the elementary and intermediate levels, we observe only
a weak relationship between household income and school enrolment. For enrolment in secondary and higher education, a more marked relationship was revealed
(Figure 4.15). Enrolment after age 16 is quite high among the 20 per cent poorest
households (first income quintile). However, among these, the largest group is still
enrolled in intermediate school or in vocational training. If we look only at enrolment in secondary and post-secondary education, we find a clear pattern: The two
lowest income groups have significantly lower secondary school enrolment than the
others (8 per cent versus 12-13 per cent), while the two highest income groups demonstrate significantly higher enrolment rates at the post-secondary level (7 and 5
per cent versus 2 per cent).
The educational level of the household head is one of the strongest determinants
of school attainment after age 16 (Figure 4.16). If the household head has secondary or higher education, household members aged 16–21 are enrolled in secondary
education 3 times more often than if the head has no complete education, and twice
as often as when the head has completed elementary school. For post-secondary
education, the differences are even more marked: in households where the head has
secondary or higher education, 1 in 10 persons aged 16–21 are enrolled in postsecondary education, compared to 1 in 25 if the head has elementary or intermediate education. Once again, men’s education is more easily affected by social background than women’s.
121
Figure 4.16 Persons currently enrolled in school, by educational level of household head. Per
cent of population aged 16–21 (n=2,506).
Elementary + Intermediate
Vocational training
Secondary
Semiprofessional
College and university
No complete education
Elementary or
Intermediate
Secondary or higher
0
20
40
60
80
100 Per cent
To summarise, enrolment is quite high during the first years of primary schooling, and remains above 90 per cent until the age of 11. There is then a significant
decrease in the enrolment level for boys, while girls tend to remain in school longer.
School attendance is higher for girls in all age groups up until 18 years of age, when
attendance levels become more similar for males and females. The most marked
decrease in enrolment is seen after the age of 15, when intermediate school should
otherwise be completed.
Type of School Attended
For the Palestinian population in Lebanon, UNRWA is the main provider of educational services at all levels and for all types of education – with the exception of
university studies and college (Figure 4.17).
At the elementary and intermediate level, UNRWA delivers 95 per cent of educational services. About 3 per cent attend private schools; largely children from highincome families. For vocational training, students are more evenly distributed beFigure 4.17 Type of school by level. Per cent of population currently enrolled in school.
Government
Private
NGO
Other/abroad
UNRWA
60
100
Per cent
College and university
Semiprofessional
Secondary
Vocational training
Elementary and Intermediate
0
122
20
40
80
tween private, government and NGO institutions. However UNRWA is still the
main provider, offering 45 per cent of the services. In spite of UNRWA having a
very limited offer for secondary schooling at the time of the survey, 43 per cent of
those enrolled in secondary schools attend UNRWA schools. UNRWA secondary
schools are more commonly attended among the poorest, and government schools
somewhat more common in more well off families. About one third of those enrolled in secondary school attend private schools. Still there is no indication that
private schools are more common among members of the more affluent households.
Private secondary schools are most common in Tripoli and Bequaa, where UNRWA
had no secondary school offer at the time of the survey.
Following the completion of the secondary level, about half of those still enrolled
in school attend Lebanese government schools. But 1 in 5 attend private schools,
and a significant proportion attends UNRWA and NGO schools for semi-professional training.
4.6 Parental Attitudes to Education
We will now take a brief look at parents’ expectations for their children’s future
schooling, and how they evaluate the schools their children attend.
High Expectations for Children’s Schooling
We have seen above that 11 per cent of the population have completed secondary
school, and that only 5 per cent have completed any form of post-secondary education. Furthermore, the educational level is somewhat higher in the younger age
groups, where 17 per cent of those aged 20–29 have completed secondary education, while 7 per cent have completed or are currently enrolled in post-secondary
or higher education.
When asked about the level of education they realistically think their children
will complete, most parents express high expectations on behalf of their sons and
daughters. Two in 3 parents believe their child will complete secondary or higher
education. Half of the parents expect their child to take some kind of post-secondary education, usually college and university studies. Yet a significant proportion
of the parents have low expectations for their child – 1 in 8 boys and 1 in 10 girls
currently enrolled in elementary or intermediate schools are not expected to complete the intermediate level. Half are expected to drop out because of repeated failure, and another 20 per cent because of lack of interest.
123
Figure 4.18 Parents’ expectations about their children’s educational achievements (oldest child
currently enrolled in elementary or intermediate school). Per cent of parents with child in
elementary or intermediate school.
University degree
Female
Baccalaureate/College
Male
Semiprofessional after secondary
Secondary
Vocational after intermediate
Intermediate
Will not complete intermediate
0
10
20
30
40
50
Per cent
Contrary to actual dropout rates, parents’ expectations of their children’s future
educational levels are strongly connected to the household income. One in 5 children in the poorest 20 per cent of households are expected to drop out of school
without completing intermediate education, compared with 1 in 20 in the richer
segments of the population. However, even in the poorest households close to half
think their child will complete some kind of post-secondary or higher education.
Among the camp population in general, 6 per cent say they do not approve of
girls taking higher education. However, this is not reflected in the parents’ expectations for their own child – they express almost equally high expectations for boys
and girls, even though hopes for a university degree are somewhat more common
for boys. At the same time, boys are more often expected to drop out of school
without completing the intermediate level.
Expectations for children’s education are somewhat related to the educational
level of the household head. However, even in households where the head has not
completed elementary education, 45 per cent believe their child will go on to college or university. This compares with 59 per cent in households where the head
has a post-secondary or higher education.
Overcrowding a Major Problem in UNRWA Schools
We have seen that almost all Palestinian children in Lebanese camps and gatherings
attend UNRWA schools at the elementary or intermediate levels, while about 6 per
cent attend private or government schools. When asked to give an overall evaluation of the quality of the education their child is receiving, there are surprisingly
124
little differences between parents with children in government, private and UNRWA schools – just less than half say the education received is excellent or quite
good, and less than 20 per cent find it poor or very poor. However, the differences are more marked when parents are asked to select the most important areas that
need improvements in the school that their child attends. Among parents with
children in private or government schools, half say no improvements are needed
in their school, compared with 1 in 4 parents of children in UNRWA schools. In
all types of schools, parents most often complain about teacher qualifications and
teaching practises (however, more often in UNRWA schools than in other schools).
Parents of children in government or private schools seldom mentioned overcrowding (too many students in the classroom), while 42 per cent of parents of children
in UNRWA schools see this as a major problem. Also here the situation seems to
be somewhat better in Bequaa, where only 1 in 4 parents complain of overcrowding. The need to improve buildings, infrastructure and equipment is mentioned
twice as often in Tripoli (32 per cent) as in other areas.
Figure 4.19 The most important issues to be improved in children’s school. Main groups from
a list of 12 elements. (Up to 3 answers possible.*) Per cent of parents with child in elementary
or intermediate school.
UNRWA school
Student conduct, behaviour
and dicipline
Private or government schools
Textbooks and curriculum
Too many students in the class
Teacher lacks qualifications/skills,
uses wrong teaching practices, has
bad attitudes to students or not
commited to teaching
Equipments, learning facilities,
buildings or physical facilities
No improvements needed
0
10
20
30
40
50
60
70
80
90
100
Per cent
*
About 27 per cent said no improvements were needed, about half pointed out 2 areas where improvements are needed, and 25 per cent mentioned 3 items.
125
126
Chapter 5 Employment and Working
Conditions
Yousef Al-Madi and Ole Fr. Ugland
5.1 Introduction
This chapter analyses the labour market of the Palestinian refugees in camps and
gatherings in Lebanon. Employment is described as the most important arena for
income generating activity, and is thus extremely important as regards population
welfare.
Fifteen years of civil war has impacted negatively on the Lebanese economy and
hence employment opportunities for Palestinians and Lebanese alike. The exodus
of the PLO institutions from Lebanon in 1982 led to an immediate loss of labour
and local employment opportunities. The Gulf War, and expulsion of Palestinian
workers from the Gulf countries, saw the loss of labour opportunities abroad. A
particular problem for Palestinians in Lebanon is that their status prohibits them
from taking employment in skilled professions. These jobs require membership in
professional associations, which is not given to foreigners. UNRWA, the PRCS and
various NGOs thus provide the only possible legal labour opportunities.
Field observations report an overall difficult situation as regards unskilled labour
as well. Here Palestinians (and Lebanese) compete with large numbers of Syrian and
Asian workers who do not require work permits and who can work for considerably
lower wages. Some Palestinians operate small businesses in the camps, and some
youths graduating from various technical training programmes are able to use their
skills to obtain work with Lebanese companies. Most are not legally employed however, and allegedly receive a fraction of the salaries and benefits that Lebanese employees receive for doing the same job (USCR 1999).
Employment figures on the Palestinian community are contested, partly due to
differing target populations and partly due to conceptual differences. The LIPRIL
describes the labour market according to the standard classification system developed
by the International Labour Organisations (ILO).1 Starting with a brief
1
Similar decomposition and further references can be found in Øvensen (1994) and in Awad and
Arneberg (1998).
127
decomposition of the labour market, the analysis reveals that overall labour market
participation is low, at the same time as being a fundamentally male phenomenon.
The time of entry into the labour market is largely determined by marital status and
educational aspirations. At the same time, labour under-utilisation is significant, although unemployment in the Palestinian camps and gatherings is not very much
more prominent than in Lebanon at large. The problem of under-utilisation is all
the more important as it largely affects the youngest segments of the population.
Subsequently, the analysis turns to a description of the activities performed by
the economically active population. Although educational investments delay labour
market entry, educational qualifications are a major vehicle to occupational prestige. That is for the small segment that actually takes higher education and who can
find employment relevant to their skills. A slight majority work outside the refugee
communities: in the trade and construction industries, and as craft and service
workers. Their jobs are typically not regulated and they are frequently exposed to
hazardous working conditions.
In general, we can say that the labour force participation among Palestinian refugees in the camps and gatherings of Lebanon shares many of the characteristics of
the labour force in Lebanon at large, and typical to other countries in the region. A
major difference as compared to the Lebanese workforce seems to be the general absence of a higher stratum of upper-middle and high-level professionals.
5.2 A Snapshot of the Labour Market
In order to analyse the labour force in a coherent fashion, the LIPRIL adopts the
ILO labour force classification framework (ILO 1990). This frame classifies the
population into a set of distinct and mutually exclusive categories based on any
economic activity performed during the week prior to the interview. 2 Figure 5.1
outlines the labour force decomposition schematically.
High Economic Dependency
Departing from the total population, the classification follows two steps. First the
working age population is delimited by the exclusion of people who do not usually
participate in economic activity. Although some children may be economically active,
2
In addition, a randomly selected household member (RSI) was questioned about his/her employment experiences, and a separate section of the questionnaire deals with child labour.
128
the lower age limit in the LIPRIL is set at 15 years old. There is no upper age limit.
Thirty-seven per cent of the population are below working age (39 per cent and 36
per cent for males and females respectively). The proportion is high in an international perspective, and is also significantly higher than the 28 per cent observed for
the total population in Lebanon in 1997 (ACS 1998).
The dependency rate illustrates the link between the age distribution and economic activity. It is measured as the rate of the population defined as dependent –
those below 15 and those over 65 years of age – to the working age population aged
15–64. The current rate among the Palestinians in Lebanon is 72 per cent. The rate
is high compared to the rate of 50 per cent observed in developed countries. However, it is similar to the rate in Egypt (70 per cent), while it is lower than in Syria
(86 per cent) and Jordan (83 per cent), and about the same as in Lebanon at large
(65 per cent) (UNDP 1999b:198–199).
There are some regional variations in the age distribution, something that may
affect regional labour force participation patterns. The lowest proportion below
working age is seen in Beirut and in Bequaa (both 33 per cent), while the highest
proportion is found in Tripoli (40 per cent).
Low Labour Force Participation
Having identified the working age population, the next step involves identification
of those who are economically active, based on their activity during the week prior
to the interview. The labour force includes those who are either employed or unemployed.
Figure 5.1 The International Labour Organisation (ILO) classification system of the economically active population and the labour force.
Total population
Working age population
Below
working
age
Persons in the labour force
Outside
labour force
Employed
Full-time
(35 hours
or more)
Unemployed
Part-time
(34 hours
or less)
Hours
unknown
Temporarily
absent
129
Following Figure 5.1, employed individuals include persons who performed any
economic activity, even if only for 1 hour, during the week prior to the interview.
People with temporary absences, such as those who are sick or on holiday, are also
considered as working. Unemployed individuals are persons who can work, are available for work and who are actively searching for a job. Representing potential labour, they are considered economically active and are included in the labour force.
People with employment contracts, but who have not yet started working, are considered unemployed. Estimating the labour force as a percentage of the working age
population, the overall labour force participation rate is 42 per cent. This is again
quite low in an international perspective, although it is in line with labour force
participation rates observed elsewhere in the Middle East.3
5.3 Determinants of Labour Force Participation
The overall labour force participation pattern hides significant variations between
subgroups of the population. The marked gender differences observed in educational
participation (Chapter 4) are likely to be transferred to the labour market as well.
In general, youth are increasingly engaged in education, which may increase labour
force participation, at the same time as narrowing the gender gap.
The overall low labour force participation rate observed is mainly due to low
activity among women. The female rate is only 16 per cent compared to 69 per cent
among males. The female rate is again very low compared to developed countries,
while it is similar to that observed in other countries of the Middle East. Female
labour force participation in Lebanon in general is 19.2 per cent, in Jordan it is 13.6
per cent, in Syria 16.3 per cent and in Egypt 22.2 per cent (UNDP 1999b:234–
235).
Second, labour force participation follows the life cycle, and is particularly determined by marriage (Figure 5.2). Participation is generally the highest for both
men and women in their mid-twenties to mid-forties. An exception to this is the
participation rate for married men, which starts at 97 per cent and then decreases
steadily towards older age. Never-married men start out at a significantly lower level
of 44 per cent, increasing to 80 per cent at the ages of 25–34, before decreasing again
rapidly for the most elderly. The pattern is different for women, as women stop
3
Comparable figures are available for the “crude labour force participation” rate, i.e. the labour force
estimated as a percentage of the total population. The 1999 figure for the Palestinians in Lebanese
camps and gatherings is 27 per cent, the 1995 figures for Lebanon in general is 33 per cent, for Jordan
28 per cent, for Syria 30 per cent and for Egypt 36 per cent (UNDP 1999b).
130
Figure 5.2 Labour force participation by gender, age and marital status. Per cent of population
aged 15 and over (n=12,287).
Percent of persons
100
90
80
70
60
50
40
30
20
10
0
1519 2024
Male married
Male never married
Female never married
Female married
Female widowed
Female divorced
/separated
2534
3544
4554
5559
6064
Age
working when they get married and start having children. Hence the participation
rate for married women starts at a low level of 3 per cent among the youngest ones,
increasing to only about 10 per cent at middle age before declining again at old age.
We have however seen in chapter 2 that many women in the camps and gatherings
remain unmarried. The contrast is marked to never-married women and widows,
both reaching 40 per cent at ages 25–44. Furthermore, participation rates of divorced
or separated women reach the level of never-married men at this age. Divorced and
separated women are usually the main providers for children, which may force them
to enter the labour market in the absence of other income sources.
In chapter four, we have seen that the Palestinian community in Lebanese camps
and gatherings has experienced an educational “revolution” over the last decades,
among males as well as females. With increasing educational skills, people want to
invest their skills in income-generating activity. The impact of education on labour
force participation is evident for both sexes. Participation rates increase systematically with educational levels. The rate for males with less than primary education is
64 per cent, increasing to 70 per cent for those with technical intermediate or secondary education, and increasing further to 87 per cent for those who have more
than secondary education. The same trend is also observed for females, although
with slightly less impact. Starting at 14 per cent among those with no primary education, it increases to 33 per cent for those with technical intermediate and
secondary education, and increases further to 65 per cent for those who have completed education above the secondary level.
In addition to influencing the probability of being economically active as such,
the duration of the educational career also determines the entry and exit points into
the labour force (Figure 5.3). Illiterate males enter the labour force in their early
teens. While increasing rapidly to 80 per cent at ages 25–44, the participation rate
131
Figure 5.3 Labour force participation by gender, age and education. Per cent of population
aged 15 or over (n=12,263).
100
Male total
Male no complete
Female total
Female no complete
80
60
40
20
0
100
15-19 20-24 25-34 35-44 45-54 55-59 60-64
Male total
Male basic
15-19 20-24 25-34 35-44 45-54 55-59 60-64
Age groups
Female total
Female basic
80
60
40
20
0
100
15-19 20-24 25-34 35-44 45-54 55-59 60-64
Male total
Male vocational after intermediate
or secondary
15-19 20-24 25-34 35-44 45-54 55-59 60-64
Age groups
Female total
Female vocational after intermediate
or secondary
80
60
40
20
0
100
15-19 20-24 25-34 35-44 45-54 55-59 60-64
Male total
Male higher education
15-19 20-24 25-34 35-44 45-54 55-59 60-64
Age groups
Female total
Female higher education
80
60
40
20
0
15-19 20-24 25-34 35-44 45-54 55-59 60-64
15-19 20-24 25-34 35-44 45-54 55-59 60-64
Age groups
never exceeds this rate. It then starts falling rapidly towards old age. The contrast is
striking compared to those with higher education. Here the labour force entry is
slower. However, it increases rapidly and peaks at 90 per cent in the middle 20s.
While declining towards old age, the rate is significantly higher than among
illiterates. A similar pattern is also observed for women, where education at the secondary and, in particular, graduate levels boosts labour force participation significantly. While among illiterate females the rate never exceeds 20 per cent, among graduates it reaches almost 70 per cent at ages 20–59.
132
Table 5.1 Gender and domain-specific labour force participation rates. Per cent of population
aged 15 and over (n=12,293).
Domain
Male
Female
Total
Beirut
73
23
47
Tripoli
70
15
42
Bequaa
64
18
40
Saida
71
13
41
Tyre
66
19
41
Total
69
17
42
Participation rates also vary between different geographical regions in Lebanon,
following differences in proximity to urban centres, industrial bases and hence
employment opportunities (Table 5.1). Hence we observe the highest participation
rate in Beirut (47 per cent), but it is only slightly higher than in the other regions
(40–42 per cent). This pattern applies to both men (73 per cent) and women (23
per cent). However, while the lowest male rate is observed in Bequaa (64 per cent),
the lowest female rate is seen in Saida (13 per cent). The low rate for men in Bequaa
may partly be explained by a high migration of youth from this region to the Scandinavian countries (see chapter 2), where most of them are employed.
Lack of Employment Often Delays Labour Market Entry
Reflecting the gender-segregated labour market, gender differences are significant
when it comes to the main reasons given for not being economically active (Figures
5.4 and 5.5). Among women, full-time housewives form 65 per cent, and students
10 per cent of the population outside the labour force. Among men, students make
up 32 per cent while 33 per cent are disabled. A category of particular interest in
this regard is jobless individuals who have lost all hope of finding a job. These “discouraged workers” account for 17 per cent of the men and 4 per cent of the women.
To some degree, they represent available labour, as they would have been searching for a job if work had been available, and as such may be classified among the
labour force. We will return to this issue below.
The main reasons given for lack of economic activity depend on age. Discouragement is generally observed among men below 44 years old. In the age group 20–
24, discouraged workers account for 38 per cent. Students are for natural reasons
prominent among those below 24 years of age. Starting at 71 per cent among males
aged 15–19, the rate drops to 27 per cent in the age group 20–24. For females, the
rate starts out low at 45 per cent, dropping to 3 per cent in the same age groups. As
seen in chapter 4, men stay in the educational institutions longer than women, which
also delays their entry into the labour market. Women on the other hand often
133
Figure 5.4 Main reason for not working among men. Per cent of men in respective age categories who are outside the labour force (n=1,793).
Per cent
100
Other
Student
Discouraged
Retired
Health
90
80
70
60
50
40
30
20
10
0
1519
2024
2534
3544
4554
5559
6064
65+
Age
Figure 5.5 Main reason for not working among women. Per cent of women in respective age
categories who are outside the labour force (n=5,286).
Per cent
100
Other
Student
Discouraged
Restrictions
Retired
Health
Housewife
90
80
70
60
50
40
30
20
10
0
1519
2024
2534
3544
4554
5559
6064
65+
Age
become housewives. Three-quarters of non-active women are full-time housewives
by the time they are in their early 20s. Finally, disabilities and retirement become
more prominent with increasing age. For men, sickness or disability actually become
a prominent reason already in the early 20s. At this age, 3 in 10 of those inactive
are so because of health problems. Women’s health problems only become prominent
during their late fifties and onwards. Finally, retirement is also becoming more
frequent in the late fifties, especially among men as more of them have been labour
active.
134
There are some regional variations in the reasons for being outside of the labour
force. The smallest proportion of discouraged male workers is seen in Beirut (7
per cent), while the highest is seen in Tyre (23 per cent). Additionally, the proportion of retired individuals is higher in Beirut and Saida (13–14 per cent) than
in the other regions (3–4 per cent). This partly reflects regional variations in the
age structure as such.
Some of those currently outside the labour force have previously been economically active. One in 10 report to have been active the previous year. Among those
who have lost all hope of finding a job, a third were active the previous year. This is
also the case for 15 per cent of those currently sick or disabled, 6 per cent of students and 4 per cent of housewives. Furthermore, 28 per cent of persons who were
inactive last year have worked earlier during their lives. This is true for 59 per cent
of those currently disabled or sick and for 15 per cent of housewives. In total, almost a third of those currently inactive have worked at one stage in their life.
5.4 Labour Utilisation
Labour force participation is not equivalent to full labour utilisation. We will now
take a look at patterns of labour under-utilisation as seen by part-time work, unemployment, and underemployment.
High Unemployment
Following our classification scheme, the unemployment rate is measured as the
percentage of those unemployed in the labour force (Figure 5.6).
The unemployment rate for the Palestinians in camps and gatherings in Lebanon
is 17 per cent. It is thus high in an international perspective. However, it is similar
to the overall high unemployment seen in most of the Middle East countries, ranging
from 30 per cent in Iran and Yemen, via about 15 per cent in Jordan and Lebanon,
to about 12 per cent in Egypt and Syria in 1997 (World Bank 1999). Furthermore,
while unemployment in the region is usually higher among men than women, it is
about the same for men (16 per cent) as for women (19 per cent) among the Palestinians in camps and gatherings in Lebanon.
Consequently, due to high unemployment, but in particular due to low labour
force participation, only 21 per cent of all employed persons among the Palestinian
refugees in camps and gatherings are women. This is lower than found elsewhere in
the region, for example in Egypt (30 per cent), Jordan (23 per cent) and Syria (26
per cent), and in the total Lebanese labour force (29 per cent) in 1998 (World Bank
1999:234-235).
135
Figure 5.6 Gender-specific employment rates. Per cent of persons in the labour force (n=5,216).
Employed
Unemployed
All
Female
Male
0
10
20
30
40
50
60
70
80
90
100 Percent
Table 5.2 Gender-specific unemployment rates in the camps, 1980 –1999. Per cent of the labour
force.
Year
Male
Female
Total
1980
7.1
4.9
6.9
1989
13.3
19.8
13.6
1995
13.7
10.4
13.2
1996
11.2
8.5
10.8
1999
16
19
17
Source: PCBS figures and 1999 LIPRIL
Historic figures indicate that unemployment was relatively low before the Israeli
invasion of Lebanon in 1982 (Table 5.2). The presence of Palestinian organisations
attracted a large number of Palestinian workers. A sharp unemployment increase
was observed at the end of the 1980s, followed by a decline in the mid-1990s. By
1999, the unemployment rate rises above the level observed at the end of the 1980s.
The increase between 1980 and 1989 has been associated with the 1982 deportation of the PLO, which immediately exacerbated the unemployment problem. Since
that time, unemployment has remained high. Gender differences are not prominent.
If women who enter the labour market in increasing numbers end up jobless, their
increased labour force participation does not represent increased labour utilisation.
Significant Underemployment
In addition to unemployment, underemployment represents another loss of the
productive potential in the population, and welfare loss for the individual. Underemployment is derived from the fact that some employed individuals do not work
as many hours as they would like.4
4
The classification of the underemployed follows the same structure as the classification of the unemployed. All employed persons were asked whether they wanted to work additional hours, whether
they were available for more work and whether they were actively searching for more work during
the reference week. While only those actively seeking additional work are classified as underemployed,
it may be argued that the difficult situation in the labour market may discourage people (continues..)
136
Looking first at the total number of hours actually worked (Figure 5.7), the most
common working weeks are from 30-49 hours, covering 42 per cent of the employed. Part-time workers, who worked less than 35 hours during the reference week,
account for 25 per cent. Underemployment (Figure 5.8) peaks among those working 10-19 hours for both genders. However, among men it reaches 40 per cent, while
among women it reaches 20 per cent. Young people tend to work somewhat longer
hours than older people, but differences across age groups are generally small (not
shown).
We have seen above that marital status has a significant impact on the labour
force participation. Differences are further accentuated when it comes to the number
of hours worked (Figure 5.9 next page). Full-time employment among married men
Figure 5.7 Weekly working hours in all jobs by gender. Percent of employed persons (n=4,163).
Per cent
30
Male
Female
25
20
15
10
5
0
1-9
10-19
20-29
30-39
40-49
50-59
60-69
70-79
Weekly
work hours
Figure 5.8 Underemployment by weekly working hours and gender. Per cent of employed
persons (n=4,163).
Per cent
45
Male underemployed
Female underemployed
40
35
30
25
20
15
10
5
0
1-9
10-19
20-29
30-39
40-49
50-59
60-69
70-79
Weekly
work hours
from active labour searching. Hence, all those saying that they want to work more time could in principle be considered as underemployed.
137
Figure 5.9 Employment and unemployment by marital status. Per cent of persons in labour force
(n=5,216).
Full time
Part time
Unemployed
Male married
Male never married
Female divorced
or seperated
Female widowed
Female married
Female never married
0
10
20
30
40
50
60
70
80
90
100
Percent
is slightly higher (63 per cent) than among never-married men (58 per cent). This
is largely due to the fact that the unemployment rate is higher among the latter
(22 per cent compared to 12 per cent), while the proportion working part-time is
about the same. For women, full-time employment is somewhat higher among
widows (56 per cent) than those single or divorced (48–49 per cent). Since the
unemployment rate is highest among those never married and divorced, this implies that part-time work is the most frequent among married women. Four in 10
married women work part-time compared to 2 to 3 in 10 among the other women.
The question remains as to how many of the part-time workers actually want
to work more. Following the ILO classification, underemployed individuals are those
currently working who want to work more and are actively seeking additional employment. This applies to 13 per cent of the employed. Six in 10 part-time workers
and 8 in 10 full-time workers do not want to work more. Only 26 per cent of parttime workers are actually seeking additional employment, while this is also the case
for 9 per cent of full-time workers.5 Part-time work does not always represent labour under-utilisation.
Let us carry out an experiment. Unemployment, underemployment and discouraged workers all represent labour under-utilisation. In order to obtain a better impression of the magnitude of the under-utilisation, and at the same time assess what
type of under-utilisation is the most common problem in various subcategories of
the labour force, we will put them together (Figure 5.10). Note that the inclusion
5
As mentioned above, and given the generally difficult labour market situation, one could possibly
also include people who say that they want to work more (4 per cent) and people who are at the same
time available for more work (8 per cent).
138
of discouraged workers extends the labour force as compared to the above figures.
Separate figures are given for men and women.
Unemployed (11 per cent) and underemployed (10 per cent) males account
for the largest share of under-utilised labour in addition to a high share of discouraged workers (5 per cent), since the male labour force is larger than the female labour
force. Equivalent figures for females are 4 per cent, 4 per cent and 1 per cent
respectively.
Comparing the geographical regions, Beirut has the highest rate of unemployment, while the lowest rate is observed in Tyre. The variation is largely caused by
Figure 5.10 Unemployment, underemployment and discouraged workers by selected individual characteristics. Per cent of male and female persons in the extended labour force (n=5,759).
Male unemployed
Female unemployed
Male underempl.
Male discouraged
Female underempl.
Female discouraged
Graduate
Secondary
Basic
No education
Widow/sep/divorced
Married
Never married
55+
45-54
35-44
25-34
20-24
15-19
Gathering
Camp
Tyre
Saida
Bequaa
Tripoli
Beirut
All
0
10
20
30
40
50
60 Per cent
139
variations in male unemployment. Taking into account labour under-utilisation,
the picture is partly reversed. Due in particular to high underemployment among
males, Tyre is the region with the highest proportion of under-utilised labour. Bequaa ranks next, with about the same proportion of unemployed and discouraged
workers as in Tyre, while the proportion of underemployed men is somewhat smaller. While Saida shows about the same proportion of unemployed as the other regions, except Beirut, the proportion of underemployed and discouraged persons
is smaller. No underemployed women are observed here.
While regional variations are significant, differences between camps and gatherings are small. Labour under-utilisation reaches the same level in the two areas,
and the distribution across the various types of under-utilisation is also more or less
equal.
Turning to age, under-utilisation decreases systematically with increasing age,
and especially from the age of 25. This is also the case for most types of under-utilisation. In the two youngest age categories, i.e. 15–19 and 20–24, almost half of
the labour force is under-utilised. The age differences are partly reflected in marital
patterns. Under-utilisation is the highest among those never married, where almost
half of the labour force is under-utilised, while it is significantly lower among the
currently and previously married.
Finally, educational qualifications also have some impact on the under-utilisation
of the labour force. Underemployment is the highest among persons with basic education. This is basically due to high unemployment and underemployment among
men at this educational level.
Underemployment Caused by Poor Employment Opportunities
When asking those who want to work more about the main reason why they do
not do so, they were given a set of options ranging from the general situation in the
labour market to housework and social constraints. The answers are more or less
unanimous that the main reason is lack of available work. This goes for men as well
as women, and regardless of age. The same pattern is also found among those who
are available for more work, but are not currently searching for a job. Looking at
those who say they want to work more, although they are not available, 2 in 10 refer
to health reasons.
Unemployment is Permanent
Unemployment often lasts for a long time. For half of the unemployed, the unemployment period has lasted for 2–6 months, while for 2 in 10 it has lasted for 7–12
140
months. One in 10 of the unemployed have not been economically active during
the past 2 years. The longest unemployment periods are observed for people with
high education, where 14 per cent have been without work for more than 2 years.
Gender differences are small in this regard. Lasting unemployment is observed more
frequently in Beirut (21 per cent), while in Bequaa no one has been unemployed
for more than 6 months.
5.5 Employment Characteristics
Following the description of labour force participation patterns, we will now turn
to employment characteristics among the economically active. Three indicators are
applied: different sector attachments and types of industry reveal the degree of the
labour division; the occupational structure shows the skills of the economically active population; and the occupational status outlines the organisational structure
of the economy.
Most Employed are Paid Employees
Employed persons can be divided into 4 groups according to the occupational status of their main job, as paid employees, employers who employ non-family members; self- employed who do not employ any family members and unpaid members
in family business. Paid employees make up 72 per cent of those employed. The
rate is slightly higher among women (79 per cent) than men (70 per cent). About
one-fifth of the working population is self-employed (21 per cent), somewhat higher
among men (22 per cent) than women (16 per cent). Unpaid family workers or
apprentices are rare (1 per cent).
While occupational opportunities are usually related to educational skills, there
is only a weak connection between educational qualifications and employment status. The overall high proportion of paid employees is observed among men as well
as women, and regardless of educational level. One exception is a relatively higher
proportion among women with primary or no education. Otherwise the limited
number of unpaid family workers observed is largely found among women with secondary or higher education. The most surprising finding is perhaps the small proportion of unpaid family workers seen.
141
Significant Gender Segregation Across Industry and Sector
Lebanon is endowed with few natural resources and has a relatively small manufacturing sector. Consequently, the majority of the workforce in Lebanon is employed
in service occupations (UNDP 1998). Although affected by these surroundings,
prevailing employment restrictions for the Palestinians produce a slightly different
pattern (Table 5.3). In particular, no Palestinian is employed in public administration, as this is prohibited by law. Also prohibited are 70 specific occupations, spanning all industries. The dominant industry employing the Palestinians is trade (27
per cent), followed by construction (19 per cent), and then manufacturing, social
services and agriculture (each 11–13 per cent). Together these 5 industries account
for 80 per cent of the employed.
While agriculture and manufacturing employ about the same share of men and
women, trade and, in particular, the construction and transport industries are largely
male dominated. Women are over-represented in education and the health and social service industries. Construction and trade in fact employ more than half of the
employed males, while half of the females work in the service industries. The distribution is similar to Lebanon overall where trade and social services are also dominant, and with about the same gender diversification (ACS 1998:149–148). The
only distinction from the total Lebanese pattern is thus the lack of public administrators.
Following the lack of employment opportunities in the public sector, 80 per cent
of the employed work in private companies. Additionally, IGOs and NGOs provide some employment opportunities, employing 13 per cent. The remaining 7 per
cent work in family businesses or as servants in private households. Again, the gender segregation is manifest. While 84 per cent of the males work in private compaTable 5.3 Employment structure by industry and gender. Per cent of all employees.
Gender
Industry
Male
Female
Total
Agriculture, hunting, forestry, fishing
11
12
11
Manufacturing, mining, quarrying
14
12
13
Construction, electricity, gas
24
1
19
Trade, hotels and restaurants
28
21
27
6
1
5
Transport, storage and communication
Financial intermediation, real estate
1
2
2
Public administration and defence
0
0
0
Education, health and social work
8
32
12
Community social services & other
8
19
10
100
3,467
100
863
100
4,330
Total
N
142
nies, the same is true for 66 per cent of the females. This reflects the fact that women
are largely turning to the NGOs and IGOs, accounting for 24 per cent of employees
compared to 9 per cent among men.
Finally, linking industry and sector, the labour market is quite narrow in scope.
Two market segments are dominant. The first is private companies in agriculture,
manufacturing, construction and especially trade. These account for 65 per cent of
all employed persons, and are predominant among males. The second is a smaller
segment of IGOs and NGOs in the education sector and the health and service industries, together covering 10 per cent of the employed, and dominated by women.
While the labour market is clearly gender segregated, the differentiation is also
linked to educational skills. Among men, agriculture and partly manufacturing declines rapidly with increasing education (Figure 5.11). While among people with
no education, 2 in 10 work in agriculture, no one with higher education is found
in this industry. An opposite trend is observed for the education sector and the health
and social service industries, where employment increase significantly with improved
education. While accounting for less than 1 in 10 uneducated males, these sectors
are the dominant employers among the higher educated. Among women, the picture is different, following their different employment orientations (Figure 5.12 next
page). A divide is seen between those with elementary or lower education on the
one hand, and those with post-intermediate vocational or higher education on the
other. Similar to the the situation for men, the agriculture and manufacturing sectors are dominant, in addition to trade, together covering half of the employed. From
Figure 5.11 Employed men by industry and highest completed educational level. Per cent
(n=3,462).
Agriculture
Manufacturing/mining
Transport,storage, communication
Construction/electr./gas
Trade, hotels/restaur.
Education,health/social workers
Other services
40
100 Percent
Higher education
Semi-professional
Secondary
Vocational after
intermediate
Elementary and
preparatory
Not completed
any education
0
10
20
30
50
60
70
80
90
143
the post-intermediate vocational level onwards, health and social service industries are dominant regardless of further qualifications.
Finally, the distribution across industries follows regional variations in industrial
localities across Lebanon (Figure 5.13). Four in 10 employed in Tyre work in
agriculture, reflecting the predominance of citrus and banana plantations in the area.
One in 10 work in construction. A third of the employed in Saida also work in the
construction sector, mainly in the large companies operating in this district. Similarly,
a third of the employed in Tripoli, Beirut and Bequaa work in the domain of trade,
Figure 5.12 Employed women by industry and highest completed educational level. Per cent
(n=862).
Agriculture
Manufacturing/mining
Transport,storage, communication
Construction/electr./gas
Trade, hotels/restaur.
Education,health/social workers
Other services
Higher education
Semi-professional
Secondary
Vocational after
preparatory
Elementary or
preparatory
Not completed any
education
0
10
20
30
40
50
60
70
80
90
100 Percent
Figure 5.13 Industry structure by geographical districts. Per cent of employed in each region
(n=4,330).
Agriculture
Manufacturing/mining
Transport,storage, communication
Construction/electr./gas
Trade, hotels/restaur.
Education,health/social workers
Other services
Beirut
Tripoli
Bequaa
Saida
Tyre
0
144
10
20
30
40
50
60
70
80
90
100 Percent
restaurants and hotels. While Beirut offers these services as the capital, Tripoli and
Bequaa serve the same functions as main border cities.
Differences between camps and gatherings are, however, minor. Both camps and
gatherings follow the same pattern as for the overall regional distribution where they
are located.
Little Occupational Diversity
As for type of industry, the occupational distribution is quite narrow (Table 5.4).
The largest occupational category is craft workers (36 per cent), followed by service workers (19 per cent), professionals (16 per cent) and unskilled agricultural workers (12 per cent). These categories together account for 8 in 10 employed. Once
again, gender differences are clear. Women are over-represented at the top and bottom of the occupational hierarchy, among professionals as well as in elementary occupations. Professionals are the largest occupational category among women while
2 in 10 are service and sales workers. Men dominate among craft workers and among
plant and machine operators. Craft workers alone account for 4 in 10 employed men.
Once again, occupational differences follow educational qualifications (Figures
5.14 and 5.15 next page). Two in 3 men and 9 in 10 women with graduate education work as professionals or managers. Conversely, half of the males and females
with no completed education work in elementary occupations, as machine operators
or as craft workers. The most interesting pattern is perhaps that 2 in 10 men with
higher education and 4 in 10 with secondary education are employed in such elementary occupations, as this may indicate under-utilisation of skills. Otherwise, the
dominant occupations of craft workers, skilled farmers and sales workers cover 6 in
10 employees regardless of educational level. Among women, occupational positions
are more clearly related to educational skills. While 3 in 10 are in managerial or
professional positions, the proportion is reduced from 9 in 10 among women with
Table 5.4 Employed individuals by gender and occupation. Per cent of all employees.
Occupation
Professionals and managers
Clerical workers
Male
Female
Total
12
31
16
2
4
2
Service and sales workers
19
23
19
Unskilled agricultural and fishery workers
11
12
12
Crafts and related workers
42
12
36
Plant and machine operators
7
1
6
Elementary occupations
7
18
10
100
3,478
100
870
100
4,348
Sum
N
145
graduate education to 2 in 10 for those with basic education. The other single
largest occupational category, i.e. sales workers, is observed with about the same
proportion at intermediate vocational and all lower educational levels. In other
words, educational qualifications do not contribute significantly to occupational
prosperity among men, except for the marginal category of managers and professionals with higher education. Among women, increasing education systematically advances the occupational position.
With regard to regional differences across occupational categories, there is little
difference, except for the fact that the proportion of agricultural workers is higher
Figure 5.14 Employed men by occupation and education. Per cent of employed men (n=3,473).
Managers, professionals,technicians Clerks
Service and sales Skilled agricultural
and associate professionals
and fishery workers
Crafts and related workers
Plant and machine operators
Elementary occupations
Higher education
Secondary
Vocational after
preparatory
Elementary or
preparatory
Not completed any
education
0
10
20
30
40
50
60
70
80
90
100 Percent
Figure 5.15 Employed women by occupation and education. Per cent of employed women
(n=870).
Managers, professionals,technicians
Skilled agricultural
Service and sales
Clerks
and associate professionals
and fishery workers
Crafts and related workers
Plant and machine operators
Elementary occupations
Higher education
Secondary
Vocational after
preparatory
Elementary or
preparatory
Not completed any
education
0
146
10
20
30
40
50
60
70
80
90
100 Percent
in the camps and gatherings of the South than in the North (Figures 5.16 and 5.17).
Eighteen per cent of employed men in the South work as skilled workers in agriculture and fishing. The rate decreases to 2 per cent in the North. Furthermore, onefifth of employed women in both the North and the South work in elementary occupations, usually as service workers.
We have seen above that industrial structure is closely linked to sector. In the
same manner, the industrial structure is linked to occupational distribution (Table
5.5 next page). Four or 5 segments are identified, each covering 10 per cent of the
workforce or more. The first one represents skilled agricultural workers, naturally
working in the agricultural industry. The second represents craft workers in manufacturing and construction, as well as trade. The two former segments alone account
for 3 in 10. A significant segment is observed among service and sales workers in
the trade industry, accounting for almost 2 in 10. Finally, professionals in the social
Figure 5.16 Employed men by occupation and camp/gathering location. Per cent of employed
men (n=3,478).
Managers, professionals,technicians Clerks
Service and sales Skilled agricultural
and associate professionals
and fishery workers
Crafts and Related workers
Plant and Machine operators
Elementary occupations
Gathering South
Gathering North
Camp South
Camp North
0
10
20
30
40
50
60
70
80
90
100 Percent
Figure 5.17 Employed women by occupation and camp/gathering location. Per cent of employed
women (n=870).
Managers, professionals,technicians Clerks
Service and sales Skilled agricultural
and associate professionals
and fishery workers
Crafts and Related workers
Plant and Machine operators
Elementary occupations
Gathering South
Gathering North
Camp South
Camp North
0
10
20
30
40
50
60
70
80
90
100 Percent
147
Table 5.5 Industry composition by occupation. Per cent of all economically active individuals
(n=4,330).
Occupation
Industry
Professionals
Clerks
Service
and sales
workers
Skilled
agricultural
workers
Craft and
related
workers
11.0
-
Plant and
machine
operators
Elementary
occupations
Total
-
-
11.2
Agriculture
-
-
-
Manufacturing
0.4
0.1
0.9
0.1
10.6
0.5
0.7
13.3
Construction
0.9
0.3
-
-
17.1
0.3
0.8
19.4
Trade
0.8
0.2
15.9
-
7.2
0.2
2.1
26.6
Transport
-
0.3
-
-
0.2
4.4
0.2
5.2
Financial
1.0
0.2
-
-
0.2
-
0.2
1.5
Public
Administration
-
-
-
-
-
-
-
0.3
Education/health
9.7
0.4
-
-
0.3
0.3
1.5
12.5
Other services
2.9
0.7
1.9
-
0.3
0.4
4.0
10.1
15.7
2.2
19.3
11.3
36.0
6.1
9.5
100.0
Total
service industries account for about 1 in 10 economically active individuals. Together these four segments cover 8 in 10 employed Palestinians in the camps and
gatherings.
Half Work Outside the Camps or Gatherings
The difficult employment situation inside the camps makes some turn to the labour
market outside the camps. While Lebanese authorities over the last years have enforced more strict labour laws that prevent Palestinians from working with Lebanese companies, this is still often their only opportunity to generate income. Construction work is prohibited inside the camps while at the same time available free
space is limited. Space limitations also reduce the number of agricultural fields in
the refugee areas.
While 37 per cent of the employed work inside their own camp or gathering,
8 per cent work in other camps or gatherings and 55 per cent work outside these
areas. Men are more inclined (58 per cent) to work outside their living area than
women (45 per cent), partly due to general social restrictions on women’s movement (see chapter 9). Furthermore, middle-aged people tend to work more frequently outside camps or gatherings than the youngest and oldest people. The most significant differences are, however, observed for type of industry. Looking at the
dominant industries among men, 4 in 10 tradesmen work outside their area of living, while this is the case for 6 in 10 in the manufacturing sector and 7 in 10 construction workers. Working outside the area of residence is also common among
148
agricultural workers (74 per cent), while it is less prevalent among people employed
in the service industries (40 per cent). Turning to the major female industry, social
services, 4 in 10 work outside the camps. In the other two industries with large female
presence, i.e. manufacturing and trade, the proportion is 44 per cent and 22 per
cent respectively.
5.6 Working Conditions
Following the examination of labour force participation patterns and the decomposition of the labour force, we finally turn to the working environment of those
employed. This is perhaps particularly relevant to the situation of the Palestinian
refugees in Lebanon, as the difficult legal situation often forces workers to take
whatever job is available, usually without the same legal and security protection that
is granted to Lebanese workers (USCR 1999). We start by a brief look at the amount
of time spent at the workplace, before we turn to characteristics of the working environment.
The Working Week is Long
We have seen above that a quarter of those economically active work part-time, with
about twice as many women as men. Having identified the major segments in the
labour market, we can now describe more precisely how working hours differ between the segments (Table 5.6).
The overall average working hours reported is 44 hours (45 hours for men and
39 hours for women). The longest working week is observed in the trade industry,
Table 5.6 Average weekly work hours by industry and employment status in main job (n=4,149).
Paid
employee
Employer
Selfemployed
Unpaid worker
in family business
Agriculture
32
18
44
15
32
Manufacturing
47
39
38
50
45
Construction
43
42
38
58
43
Industry
All
Trade
54
52
55
36
53
Transport
49
48
46
25
47
Financial
49
51
45
31
47
Education/ health
39
41
34
38
39
Other services
40
51
44
25
41
Total
43
45
49
39
44
149
and the shortest one in agriculture. We find the longest week among the self-employed and the shortest one among unpaid family workers. In general, there is a wide
variety of working patterns across sectors and occupations. Persons working in the
trade sector, in restaurants and hotels work an average of 53 hours, while self-employed tradesmen work 55 hours. Unpaid family workers and employers in agricultural only work 15 and 18 hours respectively.
The 39 working hours observed in the health and education sectors, regardless
of occupation, also range below the average because their work is usually regulated.
While long working hours may often be a burden, the working schedule may
also be important with regard to individual welfare. Eight in 10 of the employed
work normal day shift (6 am – 6 pm). This is the case regardless of working hours,
except for people working 65 hours or more per week, among which working outside
regular hours and rotating shifts are more common. Irregular working hours are,
however, shared equally among men and women. They are also shared more or less
equally across industries and occupations.
Most Workers Have No Contract of Employment
Facing a situation whereby they lack access to the formal labour market, and at the
same time experiencing fierce competition in the informal sector, Palestinian workers
often have to take whatever job is available. While a few are able to find employment with IGOs and NGOs, where employment conditions are usually regulated,
this implies that the majority may be exposed to unregulated and perhaps hazardous working environments. Let us take a brief look at their working conditions.6
Only 15 per cent of the economically active population in Palestinian camps and
gatherings have a written contract with their employers, or hold a work permit from
the government. This is consistent with government decrees that forbid the signing
of contracts with Palestinians for any kind of formal work. As long as no work permit is issued, this implies that most Palestinian workers are deprived of regular workers’ rights, such as social, health and retirement benefits.
Contracts of employment are equally lacking for men and women. However, significant differences prevail across industries. While in agriculture, manufacturing,
construction and trade only 1 in 10 have a signed contract, this is the case for half
of those working in social services. Turning to occupational differences, 6 in 10 legislatures and professionals, and 3 in 10 technicians have signed contracts compared
to 1 in 10 sales workers, farmers, craft workers and machine operators. Contracts
are thus the most prominent among UNRWA employees (70 per cent), in the PRCS
6
Information in this section is taken from a randomly selected household member.
150
(37 per cent) and NGOs (20 per cent), while outside these sectors this is the case
for the minority (10 per cent).
Contracts of employment do however have little influence on the feeling of
job security as such. While more than half of the employed are afraid of loosing
their job in case of company closure, labour surplus, or other, the proportion is
the same for those with and those without a contract. Otherwise, the most frequent worries are observed in the construction industry, followed by trade. These
are also the industries where most (male) Palestinian workers are employed.
Many Work Under Hazardous Working Conditions
Figure 5.18 lists the 9 unfavourable conditions that the LIPRIL enquired about. It
shows the proportion of employed persons facing each of the conditions. Four in
10 employed people work in uncomfortable and dangerous conditions, as reported
from their own description.
Working conditions are the least favourable in the construction industry where
more than two-thirds work in uncomfortable and dangerous conditions. Furthermore, the majority (64 per cent) of those employed in manufacturing are exposed
to the hazard of working near dangerous machines.
Exposure to physical hazards is another important dimension of working conditions. A third of workers (41 per cent men and 15 per cent women) say that they
do heavy lifting, are exposed to grease, carry out monotonous work or work in a
position that is physically uncomfortable. The most unfavourable conditions are
again found in the construction sector where two-thirds of the employed are exposed
to heavy lifting and work in uncomfortable positions. The manufacturing sector
Figure 5.18 Working conditions. Per cent of all economically active facing each condition
(n=911).
In front of PC screen at least
4 hrs daily
Chemicals
Inflammable/explosive material
Dangerous machinery
High altitude
Heavy lifting
Become very dirty
Bent/stretched/uncomfortable
working positions
Repetitive/ monotonous movements
0
10
20
30
40
50
60
70
80
90
100
Per cent
151
comes in second place, where 6 in 10 men and 3 in 10 women say that they are
exposed to the lifting of heavy materials, work in uncomfortable positions, or are
exposed to dirt or grease. Almost half (45 per cent) of the agricultural workers say
that they suffer from health problems during work, while 16 per cent of women
working in education and health complain that their jobs are monotonous or require standing upright for a long period of time.
Three in 10 among those exposed to chemically hazardous materials or explosives, or working near dangerous machines, have access to protective clothing. Of
these, 39 per cent use the protective clothing regularly, 52 per cent use it sometimes
and the rest do not use it at all.
In order to summarise the working conditions, we have created an index based
on the 9 various working conditions dealt with above. For each indicator, each individual is given the score of 1 if the situation is problematic, and otherwise 0. The
index thus ranges from 0 (no problems) to 9 (9 problems). The overall average is
2.6 problems, mainly represented by the above observed most frequent problems
of monotonous movements, dirty work, uncomfortable positions and lifting of heavy
material. The most significant variations are observed for type of industry and occupation. The most hazardous working conditions are observed in the construction
industry (4.0 problems) and in agriculture (3.3 problems), closely followed by manufacturing (2.9 problems). With regard to occupation, farmers are once again the
most significantly affected (3.3 problems), together with craft workers (3.8 problems). Once again these sectors are also the ones employing the largest numbers of
Palestinian workers.
Few Receive Job Training
Skill acquisition is an important part of individual emancipation. While participation
in the working life as such involves day-to-day learning, training may also be formalised. When asking the employed to what extent they acquire new skills or knowledge during work time, 22 per cent say that they acquire skills in a regular and continuous manner. More than a quarter of the employed do it sometimes, while half
have never or rarely acquired any new skill. Looking at people who do acquire skills
on a regular basis, those are most commonly observed in the health and education
sectors (40 per cent), while 22 per cent of people employed in trade and 18 per cent
of people working in construction and industry learn new skills regularly.
Less than a quarter of the employed (23 per cent) have received training to
improve their skills or to practice a new profession, including training during work
time (Figure 5.19). However, the majority (79 per cent) of those who receive training (18.5 per cent of all employed) find the training relevant to their jobs, and
actually use it. Half of the trained workers have received training at their current
152
job, while one-tenth have received training at a previous job (Figure 5.20). Apprenticeship programmes, vocational schools and post-secondary educational institutions each has trained some ten per cent of the employed who ever received
job training.
The employers paid for the training in a third of the cases, while a quarter of
the trainees had their families pay (Figure 5.21). UNRWA trained more than a
fifth of the trainees.
Figure 5.19 Occurrence of job training. Per cent of all employed (n=834).
Training, use it
Training, but do not use it
No training
0
20
40
60
80
100
Per cent
Figure 5.20 Type of training received. Per cent of those who received job training (n=187).
Vocational secondary school
Informal training by family members
Other
Intermediate diplomacourse University
Training received in previous job
Vocational or commercial school
Apprenticeship program
On the job training, current job
0
10
20
30
40
50
Per cent
Figure 5.21 Person or institution that paid for the training. Per cent of those who received job
training (n=193).
Other
NGO
UNRWA
Employer (other
than family)
Self or family
0
10
20
30
40
50
153
154
Chapter 6 Household Economies
Ole Fr. Ugland and Yousef Al-Madi
6.1 Introduction1
This chapter addresses household incomes and economic wealth among Palestinian
refugees in camps and gatherings in Lebanon. The civil war disrupted the Lebanese
economy, and its effects are still manifest in income deficits and huge public debt.
Within this context, we have seen in chapter 5 that the Palestinians are faced with
problems of low labour force participation, labour under-utilization and a general
lack of access to the labour market. A major question is thus how these limitations
affect household income earning possibilities, and to what degree the Palestinians
can turn to other sources of income or savings in order to make ends meet.
Low Income and Widespread Defeatism with Regard to the Future
The analysis starts with a description of household incomes and wealth, to assess
overall economic resources available. It reveals that incomes are generally low, with
an annual average of about 5.5 million Lebanese pounds (LL). The income distribution across households is, however, skewed. A few households reach the income
level of the Lebanese middle class, while the majority are found among the poorest
households in Lebanon. The income level is partly linked to the income source on
which the household relies. Most households are dependent on employment income,
in particular from wages, and wages increase in importance as one moves up the
income ladder. At the same time, transfers are vital, especially to low-income households. Remittances are supplementary to the highest income- earning households.
Social support is important compensatory income to the poor.
In the following section, income-earning opportunities are analysed. As long as
wages constitute the most important income source, household labour market
attachment is the most critical factor in determining the household income. While
the labour market as such is segmented with regard to occupations, sectors and types
of industry, there is relatively little income diversification among the segments.
1
The authors would like to thank Marie Arneberg, Fafo, for valuable comments to an earlier draft of
this chapter.
155
Exceptions are two small categories of a relatively speaking high income-earning
administrative and service related segment, and a low income-earning agricultural
segment. For natural reasons, household incomes generally rise and fall with the
number of economically active household members across the household life cycle.
Households that manage to engage one or more members, often a female, in one of
the higher income-earning segments, are better off. Few economic household members, low activity and/or involvement in agriculture are associated with low economic
reward.
Prevailing circumstances, and in particular the legal framework, determine both
the way in which incomes are derived and their level. The types of self-employment
usually giving the highest rewards, as income from the liberal trades of lawyers,
doctors, businessmen etc., are in the Palestinian context prohibited by rules and
regulations. Households with weak attachment to the labour market rely on transfers, in particular social services. While these may be less sensitive to the difficulties
in the labour market, they are generally low.
Finally, the analysis assesses household economic wealth, and lets the households express their own assessment of their situation. Most households possess basic
household goods such as TV, fridge, washing machine etc., although luxury items
are rare. At the same time, there is a general lack of savings and widespread difficulty in increasing capital in most households, including the relatively speaking
most affluent households.
Almost every household is dissatisfied with their entrepreneurial environment.
Expectations about the future are characterised by defeatism. The current labour
market situation allows limited room for manoeuvre and limited upwards economic
mobility. Low incomes imply little potential for saving and hence vulnerability with
regard to income fluctuations.
6.2 Household Incomes
2
We start the analysis with a description of household incomes. In chapter 1 we noted
that the Palestinian refugees in Lebanon demonstrate the highest proportion of
Special Hardship Cases, in any of UNRWA’s fields of operation (Besson 1996). Some
scholars also claim that international aid to this community was reduced during the
2
Information on household incomes is missing from one or more income sources for 6 per cent of
the households. Among those missing, the overall majority simply do not know their income, while
a few households refuse to tell. Further analysis of the missing households demonstrates a slight regional tilt. It is highest in Beirut (11 per cent) and lowest in Bequaa (3 per cent). At the same time
63 per cent of the missing households report their total income, regardless of source. Comparing non156
early 1990s, relative to Palestinian refugee populations in other countries (Sayigh
1995).
In addition to these observations, a few small-scale studies on selected populations provide some information on household incomes. A survey of Palestinian
women’s health from 1996, for example, reports that nine in ten wage-earning
families live below the UNRWA $ 700 per month income poverty line. A quarter
reports that they receive remittances from abroad. Among those receiving
remittances, a third are families with no other income source (Zakharia and Tabari
1996:27-28). Likewise, in a study of widows in the Burj El Barajneh camp, about
four in ten report to have children living overseas. Language, skills and employment
difficulties in their host countries imply, however, that they are not always able to
support their family. Remittances returned to the camp are low (Mc.Cue 1994). A
general impression from these studies is one of an overall difficult economic situation, while several households rely on outside economic support. The findings are,
however, contested, as the survey populations are small and not necessarily representative of the larger Palestinian community.
The LIPRIL measures household income by asking respondents to report twentytwo different income types. For each type, the household is asked whether any household member earned such income during the last year. Those who confirm are asked
about the income amount. Let us take a look at the total income earned and its
distribution across households. We will then see if income differences reflect variations in the income composition.
Incomes are Low and the Distribution Skewed
To get an idea of the overall income level and its distribution, all households are
ranked into deciles by their total income. The first decile represents the 10 per cent
lowest income-earning households; the second decile represents the next lowest 10
per cent, and so on until we reach the top 10 per cent income earners in the tenth
decile (Figure 6.1). 3
missing households to missing ones by the total income reveals that non-reporting is twice as high
among the lowest incomes as for the highest ones. (Average total annual income is 5,476,000 among
non-missing households compared to 4,243,000 for missing ones.) The following analysis relies only
on households with complete income source reporting, and thus slightly inflates the income level.
3
One should bear in mind in this regard the possibility of recall error and under-reporting. Underreporting usually increases with the time distance from the date when the income was earned, and
often with the complexity of the household income (implicitly the highest incomes). Additionally,
the phenomenon of strategic reporting, whereby households understate their income if they expect
the reporting to generate further social or economic support, is well known.
157
Incomes are generally low and the distribution is skewed. The total annual average income reported is LL 5,476,000. The poorest decile accounts for only 1 per
cent of all incomes. The contrast is marked in the upper decile, which earns 32
per cent of the incomes. In fact, the two top income deciles alone account for half
of all incomes earned.
At the same time, large households will typically have more income, while at the
same time they have more mouths to feed. This does not mean that the average
household of five members needs five times the income of a one-person household
to achieve the same standard of living. Economies of scale imply that all household
members alike share some expenses, for example for consumer durables. Viewing
the household income in terms of income per consumption unit, or economic welfare, thus reveals a slightly different picture.4 Starting from a low level of LL 250,000,
incomes rise fairly slowly towards LL 2.5 million in the 9th decile before turning
upwards to LL 4.5 million in the top decile. The average is LL 1.6 million. In other
words, the distribution of economic welfare is more evenly distributed than indicated by the income size as such. We will return to this issue in section 6.3.
Figure 6.1 Households by total household income and income per consumption unit deciles.
Incomes in annual average LL 1,000 (n=3,395).
Income in 1,000 LL
20,000
Total income
18,000
16,000
14,000
12,000
10,000
8,000
6,000
Consumption income
4,000
2,000
0
4
1
2
3
4
5
6
7
Income decile
8
9
10
The adjustment adopts the commonly applied OECD consumption weights transformation. The
first adult household member is given the weight of 1. Other adult members are assigned the weight
of 70 per cent, and children (below 17) the weight of 50 per cent of the first adult. (A household
consisting of two adults requires an income 1.7 times as large as a single person to achieve the same
standard of living.) The equivalent score for a household with two adults and two children is 2.7 (SSB
1993:235).
158
Returning to the total income, further assessment can be made by reference to other
sources. Compared for example to the UNRWA LL 12.6 million per year ($ 700
per month) poverty criterion, nine in ten households are found to be below the
poverty line. While the realism of this criterion is contested, the income shortfall is
also striking when compared to the total Lebanese population, as seen from the 1997
survey by the Lebanese Central Agency of Statistics (ACS 1997:224–225). While
some of the deviances may be accounted for by methodological differences and the
slight time span between the two studies, they may be used for rough illustration
(Figure 6.2).
The CAS survey covers the entire population of Lebanon. Hence the Palestinian
camp and gathering communities can be compared to the total average. At the same
time, one should bear in mind that the Palestinian population covered by the LIPRIL
only includes those living in camps and gatherings, and hence is likely to give an
impression of a less fortunate community than if all Palestinians were covered.
The average annual household income in Lebanon is LL 18.5 million.5 The
distribution departs from a low level of 6 per cent in the lowest income bracket and
Figure 6.2 Household total annual income in LL 1,000 among all households in Lebanon in May
1997 (n=16,864) and among Palestinian households in camps and gatherings in February 1999.
(n=3,395)*. Per cent of households.
Per cent
50
Palestinians
45
40
35
30
25
20
15
10
Lebanese
5
0
<3,601
6,001-9,600
14,401-19,200
28,801-38,400
>60,000
3,601-6,000
9,601-14,400
19,201-28,800
38,401-60,000
* Palestinian household incomes in February 1999 are not deflated to June 1997 levels. The annual
inflation over the last years has been about 8 per cent. Incomes, however, have not managed to keep
pace with inflation. The exact rate of the income change is unknown. This implies that the incomes
in the Palestinian camps and gatherings may be somewhat inflated as compared to the total Lebanese population, thus deflating the actual difference between the two surveys.
5
The average household size in Lebanon is 4.8 members. Among the Palestinians in camps and gatherings it is 5.3 (see chapter 2).
159
rises steadily to a peak of 20 per cent in the brackets 6-14 million, then declines
again to a low level of 3 per cent in the upper bracket. The Palestinian population
starts out from a high level of 43 per cent in the lowest income bracket, and then
immediately declines as one moves up the income ladder. While seven in ten Palestinian households have an annual income of less than 6 million, this is also the case
for two in ten of the total population. While almost thirty in a hundred households
in Lebanon have an income in excess of 19 million, the same is true for only three
Palestinian households. In fact, very few Palestinian households are seen in the income brackets above 14 million, and no Palestinian household is found in the bracket
above 38 million. This means that while the income level in the Palestinian camps
and gatherings is significantly lower than for the total Lebanese population, their
internal distributions are both skewed.6
Most Households Rely on Wage Employment
Household incomes are derived from four different sources. Employment incomes
are earned as wages by employed household members and as entrepreneurial incomes
from the self-employed. Property incomes comprise incomes from house ownerships,
interest rates and other financial incomes. Transfers include incomes not generated
by the household members but transferred to the household by others, such as pensions, alimonies, scholarships or remittances from abroad. Are the income sources
themselves indicative of the amount of income? While we might have expected
employment incomes to constitute a relatively speaking small part of the Palestinian household revenue due to the strong impact of labour regulations, this is not
the case. Employment incomes constitute the main (largest) income source for 80
per cent of the Palestinian households. Fifty-nine per cent report wages, and 21 per
cent have income from self-employment as their main income. Otherwise, 18 per
cent rely on transfers and 2 per cent report property or other miscellaneous incomes.
The distribution is thus not very different from the rest of the Lebanese population. According to the 1997 ACS survey quoted above, 80 per cent of the households in Lebanon also derive their main income from labour and 20 per cent from
transfers and other incomes. The most apparent difference compared to the Palestinian camps and gatherings lies in the relative shares of the different types of employment income, where 35 per cent is accounted for by self-employment and 45
per cent is derived from wages in the total population (ACS 1997:224–225).
The amount of income among the Palestinians is clearly related to the way it is
derived, as seen from the composition across income deciles (Figure 6.3).
6
The gini coefficient for the distribution is 0.42, the same as for the Lebanese households (0.435)
(ACS 1997:71).
160
Figure 6.3 Total household income (deciles) by main (largest) income type. Per cent of all households in each income decile (n=3,395).
Per cent of households
100
Other
90
Property
80
Transfers
Self employment
Wages
70
60
50
40
30
20
10
0
1
2
3
4
5
6
7
Income decile
8
9
10
In the lowest income bracket, seven in ten households rely on transfers; in the top
deciles this is the case for only one in ten. The reliance on transfers is thus systematically diminishing as we move up the income ladder, while at the same time employment incomes gain in magnitude. This applies to wage incomes in particular.
In the five top deciles, wage employment is the major income source for more than
seven in ten households, and self-employment for about two in ten. Self-employment thus accounts for a slightly larger proportion of the middle incomes as compared to the highest and lowest ones. In other words, the poorest households largely survive by relying on transfers. Wages take precedence over self-employment in
generating the highest incomes.
Once again the picture is somewhat similar to the total population in Lebanon
(ACS 1997). In the lowest income bracket, non-employment incomes are received
by 50 per cent of the Lebanese households, diminishing to 25 per cent in the top
income bracket. The major difference to the Palestinians again lies mainly in the
proportion of self-employment incomes, which increases systematically from 25 per
cent of the households in the lowest bracket to 44 per cent in the highest, with a
reverse trend for wage incomes. This means that while labour incomes share the same
proportions in the two populations, regulations on skilled self-employment among
the Palestinians in camps and gatherings may stimulate compensation through (unskilled) wage employment.
161
Low Income Diversification and Modest Output from
Supplementary Incomes
While we have so far focused on the main income, many households report supplementary incomes. Every second household in fact relies on more than one income
source. Four in ten households have two income sources, and the remaining one in
ten have more than two sources. There is, however, a slight tendency in the direction of increased income diversification as we move up the income ladder, which
partly reflects an increasing number of income earners. However, this tendency is
insignificant compared to the overall pattern of similarity. In other words, there is
no tendency in the direction of the poorest households to compensate the low
income level by income diversification, as compared to the more affluent ones. In
fact, the opposite is true.
Examination of the various types of combinations of main and supplementary incomes reveals that households relying on transfers demonstrate the lowest income diversification (Figure 6.4). Three in ten transfer households have supplementary incomes. The number increases to six and seven in ten for wage earners
and for those relying on self-employment respectively. Households relying on property or ”other” incomes all have more than one source. As they account for less
than 1 per cent of the households, they are not shown in the figure.
The main supplementary income for transfer households is wages, which are
received by 14 per cent of these households, in addition to 9 per cent receiving selfemployment incomes. The patterns for wage earners and the self-employed are somewhat similar. In both categories, about 40 per cent also receive transfers and 7 per
Figure 6.4 Household supplementary income sources. Per cent of households with respective
main income types (n=3,395).
Per cent of households
80
Supplementary incomes
70
60
50
40
Other
30
Transfers
20
Self employment
10
0
162
Wages
Self employment
Transfers
Main income source
Wages
cent other incomes. Ten per cent of wage earners receive self-employment income
and 15 per cent of the self-employed also have income from wages.
However, the amount of income received from the supplementary sources is
modest, again partly depending on the main income type. For wage-earning households, the supplementary income adds only 2 per cent to the main one. For households relying on transfers, the contribution is 30 per cent. In other words, households relying on wages most frequently report additional transfer incomes, but they
make little difference to the overall income level. For households relying on transfers, fewer households have additional labour income, but it makes a significant
contribution to the overall income for those who do have it.
Social Support to the Poor, Remittances to the “Wealthy”
We have seen that two in ten households rely on transfers as their main income, while
another three in ten supplement their main income by transfers. There are several
different types of transfer. Let us take a look at the transfer types and their magnitude along the income distribution (Figure 6.5).
Transfers received by the Palestinian households are mainly of three kinds.7
Remittances from abroad and social support each account for about 40 per cent of
Figure 6.5 Households receiving transfers, by type of transfer and household income decile.
Per cent of all transfers in each decile (n=3,395).
Per cent
100
90
80
70
60
50
40
Other
30
Social support
20
Local support
10
0
1
2
3
4
5
6
7
Income decile
8
9
10
Remittances
7
One should be aware of the problem for the households in estimating the actual size of the transfers. Some of the assistance is provided in terms of food rations or other gifts in kind, social services
etc., which can be difficult to assess in terms of exact monetary value.
163
the total transfers. The remaining transfers are support from friends and relatives
inside Lebanon.
A general shift in the composition is observed, however, as we move from the
lowest to the highest income decile. Although all four types of transfers are present
at all income levels, remittances from abroad increase in magnitude as we move up
the income ladder. Similarly, social support diminishes slightly. In other words, social
support constitutes an important compensation to the poorest households. However, the most “affluent” ones also receive it. Remittances from abroad tend to boost
the highest incomes. Gifts or transfers from other Palestinian households inside
Lebanon have the same magnitude in all income brackets, with slightly less impact
than remittances and social support. Furthermore, changing the total household
income with the income per adult equivalent does not change the picture.
To summarise, while incomes are generally low, there is significant income
variation among Palestinian refugee households in Lebanon. Half of the households
supplement their main income by one or more additional sources, especially transfers, although the contribution from the supplementary income is modest. The
wealthiest households receive their income from wage employment, often supported by remittances. The poorest households typically rely on transfers, which is often their sole income source, and which is often received as social support.
6.3 Who are the Affluent and the Poor?
While the income type is itself indicative of its size, households generate incomes
differently according to their size and composition, reflecting different preferences,
abilities and opportunities. At the same time, we have seen above that household
welfare is dependent on how many household members have to share the income.
We continue our analysis with a comparison of the poorest and the most affluent households, according to their social background and their labour activity. We
then use the background information to identify some of the most central mechanisms that produce variations in income and economic wealth.
Little Regional Income Variation
Poverty targeting implies identification of the poorest households by relating their
economic situation to social characteristics that are easily identifiable on the ground.
The refugees in Lebanon are located within more or less definite geographic areas.
The question is whether poverty targeting can be made by simple area mapping, or
164
Table 6.1 Top and bottom household income and consumption unit income deciles by household location. Per cent of total households in each decile.
INCOME DECILE
Total
household income
1
2
9
10
INCOME DECILE
Consumption
unit income
1
2
9
10
Beirut
14
12
22
20
11
12
22
23
17
Tripoli
19
29
21
19
20
28
19
14
21
Bequaa
3
3
6
5
2
2
4
6
4
All
HOUSEHOLD LOCATION
Region
Location
Saida
28
26
31
44
29
28
41
42
34
Tyre
35
31
21
12
38
30
14
15
24
Camp
80
83
76
65
80
82
77
65
78
Gathering
19
17
23
34
19
17
22
35
337
339
344
344
330
334
339
347
N (Unweighted)
21
3,395
whether other characteristics should be adopted across areas. Before we turn to
labour activities let us start by looking at some basic household composition indicators distinguishing the lowest from the highest income deciles (Table 6.1).
Following Figure 6.1, we distinguish between the total income and the income
per consumption unit. Starting with the total household income, we observe relatively small geographical variations. Beirut, Saida and Bequaa are over-represented
in the upper deciles. Tripoli has an almost equal share across the income distribution while Tyre is significantly over-represented in the lowest deciles.
The same goes for income variations inside and outside camps. There is a slight
over-representation of higher incomes outside the camps. However, the overall picture of similarities is more striking than the differences. The same is also the case
when the total household income is replaced by the income per adult consumption
equivalent.
As long as income levels are associated with income types, we would expect fairly
equal income compositions across regions as well (Figure 6.6, see next page). The
wage component is higher in Beirut and Saida than in the other regions. The wage
“deficit” is compensated by salary incomes in Bequaa and Saida, thus producing an
overall equal employment income level, except for Tyre. Finally, transfers and “other” incomes are slightly higher in Bequaa, producing the overall highest total income.
Yet the income variation is still relatively modest. The difference between the most
“affluent” Bequaa and the poorest area of Tyre is LL 1–1.5 million.
Once again, a rough comparison with the total Lebanese population may be
illustrative. Incomes in Lebanon vary significantly across regions, and range from
a low level of about LL 13 million per year in the North to LL 25 million in Beirut (ACS 1998:229). Bearing in mind methodological differences, incomes among
165
Figure 6.6 Household total income by main income type and region
Total yearly household income (1,000 LL)
7,000
6,000
5,000
4,000
Other
3,000
Property
2,000
Transfers
1,000
0
Self employment
Bequaa
Beirut
Saida
Tripoli
Tyre
Wages
the Palestinian households may be in the range below the income level in the
poorest area of Lebanon in general. Yet there is still significant income variation
among the Palestinian households within their respective regions. The same goes
for households inside and outside camps, although households outside the camps are
slightly better off.
Income variations linked more closely to human capital than to
region
While a significant proportion of the income variation is observed within regions,
it may be due to variations in the household composition (Table 6.2).
Starting with some salient characteristics of the household head, education, age
and health are the most distinguishing factors in producing income variations, in
that order. Graduates are significantly over-represented in the highest deciles and
are almost absent from the lowest ones. However, the linkage with age takes an inverted u-shape. The highest incomes are observed among middle-aged heads, where
older and younger ones are less well off. Especially among the old, this ties in with
the health situation. While three in ten in the highest deciles have a health problem, this is also the case for six in ten in the lowest deciles.
The effect of gender is, however, quite weak. Female-headed households are
clearly over-represented in the lowest deciles, but the overall gender effect is significantly weaker than both the effect of age and education. We will return to this below.
Turning to the household composition, some significant differences are observed. Among the most prominent factors we find the household size and type.
The richest households have about twice as many household members compared
to the poorest ones. Accordingly, single persons living alone, or single parents are
166
often found among the poorest households. This contrasts to “nuclear” or extended
families, which are over-represented in the upper deciles. The poorest households
are much older. The average age across household members is forty-five years in
the bottom decile as compared to twenty-six in the top one. This situation is also
partly reflected in the dependency ratio. In the lowest decile households, there is
Table 6.2 Top and bottom household income and consumption unit income deciles by household characteristics.
INCOME DECILE
Total
household income
1
2
9
10
INCOME DECILE
Consumption
unit income
1
2
9
10
All
HOUSEHOLD HEAD (%)
Age
<29
7
13
7
5
6
10
17
16
12
30-39
17
29
28
19
25
29
31
25
30
40-49
10
14
25
26
13
19
20
17
18
50-59
12
14
21
35
15
16
18
26
17
60-69
23
16
15
12
20
14
9
10
13
70>
30
15
4
4
21
12
5
7
10
Male
57
77
89
87
72
82
86
80
82
Female
43
23
11
13
28
18
14
20
18
Gender
Education
Incomplete
70
57
38
29
62
53
35
29
46
Elementary
20
25
23
17
24
29
24
15
26
Primary-secondary
10
16
28
29
12
15
29
32
22
1
2
11
26
2
2
11
24
6
Refugee
93
90
86
85
91
92
86
89
91
Displaced
1
2
1
2
1
1
0
1
1
None
6
8
13
13
8
7
14
10
8
63
52
29
26
58
53
23
27
41
Household type (%)
Singles alone
Singles with children or relatives
Couples alone
Couples with children
Extended families
27
21
11
34
6
9
20
8
56
7
1
13
2
66
18
0
15
2
67
16
12
17
7
53
9
6
18
5
59
12
4
14
11
62
9
10
18
12
55
5
5
17
6
62
10
Household size (average)
Age dependency ratio
Members age (average)
Gender ratio (males/females)
3.4
0.7
45
0.8
4.6
1.1
33
1.0
6.4
1.8
25
1.3
6.7
1.8
26
1.4
5.0
1.1
36
1.0
6.1
1.2
29
1.2
4.7
4.1
1.3
1.1
27
30
1.4
1.2
5.3
1.2
28
1.2
0.1
0.0
0.2
0.1
26
21
15
15
330
334 339 347
0.1
19
3,395
Graduate
Refugee status
Prolonged disease
HOUSEHOLD COMPOSITION
Non Palestinian members (%)
0.1
0.0
0.2
0.2
Members w/prolonged disease (%) 34
25
15
13
N (Unweighted)
337
339
344 344
167
less than one person in the economically active ages between 15-64, compared to
almost two persons in the top decile.
Looking at the consumption unit income, we observe many of the same characteristics, as the consumption unit income is closely associated with the total income. A few distinct patterns emerge. In general, we have already seen that the
variations in the income per consumption unit are smaller than for the total income, as the largest income earning households are also the biggest ones. Consequently, there is less variation in the income per consumption unit than in the
total household income, regardless of social background. The factors remaining
as the most significant ones with regard to household consumption unit income
are the educational level of the head, region and the health situation of the members. Low consumption unit income is generally associated with the same characteristics as for low total income, although the effect of the household member’s
age and gender are less prominent than for the total income.
To summarise, income variations are larger with regard to household human
capital than regional location. An old household head, low education and bad health
among the household members are all characteristics associated with low incomes.
Conversely, larger households, where the head is in his early fifties, and households
with high educational qualifications are likely to be better off. It is suggested that
labour market exclusion is an important factor in producing low incomes.
Little Income Differentiation in the Labour Market
In chapter 5, economically active Palestinians were classified according to occupation and type of industry. In this section, we will see to what degree incomes vary
across these categories.
In addition to the household income, a randomly selected household member
was interviewed about his/her economic activity, the type of work performed, the
number of hours worked last week etc. We can now use this information to obtain
some basic information about the income formation in the labour market. Figure
6.7 displays the average income earned among employed Palestinians by their occupation and the type of industry in which they work.
The income differentiation across occupations and industries is relatively small.
We have seen above that seven-eight in ten income earners are employed in manufacturing, construction and trade, as service or craft workers or in elementary work.
In all these industries and occupations incomes are generally low, and do not exceed
LL 400,000 per month (4.8 million per year). We have, however, seen in chapter 5
that the number of weekly working hours varies significantly between occupations
and industries, ranging from 32 hours for paid employees in agriculture to 55 hours
for the self-employed in the trade industry. Looking at the income per hour thus
168
Figure 6.7 Economically active Palestinians by occupation, type of industry and income. Income
per hour (in LL 1,000) and income per month (in LL 100,000).
Industry
Education/Health
Community
Per month (in 100,000 LL)
Construction
Per hour (in 1,000 LL)
Manufacturing
Transport
Trade
Agriculture
Occupation
Professionals
Technicians
Machine operator
Elementary
Craft
Service
Farmers
0
1
2
3
4
5
6
7
Lebanese pounds (LL)
8
9
10
adds to the income differentiation. However, the general pattern of similarity prevails, where the average hourly wage for the large segment of construction, trade
and service workers is about LL 3,000.
The remaining two in ten constitute two different segments with distinguished
income profiles. The first segment is an “upper” stratum of legislators, professionals and technicians, working in education/health or social service occupations. Incomes are two to three times higher here than for the vast majority of income earners, at about LL 8,000 per hour or LL 3 million per month. The second segment is
a stratum of agricultural workers. These constitute the lowest income category with
an average hourly rate of LL 2,000 and a monthly income of LL 900,000 (1 million per year), about half of the overall average. Also in this very low-income category we find individuals employed in family work and servants in private households.
The variations observed are not very different from the Lebanese workforce
in general. According to the 1997 ACS Survey, the average annual income is LL
14 million among the self-employed and LL 9 million among wage earners. The
lowest incomes here are also found in agriculture. Agricultural wage earners receive
about LL 4 million, which is only half of the income received by wage earners in
industry and commerce. The contrast is striking to the LL 16 million received by
169
the self-employed in the commercial sector (ACS 1998:218–219). The most striking characteristic of the Palestinian incomes compared to the national average thus
seems to lie in the absence of self-employed high-level professionals, who among
the former account for the bulk of the highest incomes. That is, apart from the
fact that the overall income level as such is much lower among the Palestinians.
In chapter 5 we have seen that females account for a small portion of the employed, while at the same time they are often highly educated and working as professionals in the service industries. Hence, the income variations between Palestinian
males and females are small, where the female average is in fact slightly higher than
the male average. This pattern contrasts with the Lebanese labour market in general, which is characterised by significant gender segregation. Female incomes are about
two-thirds of male incomes regardless of sector and industry (ACS 1998:218–219).
As such, IGOs and NGOs provide ample income-earning opportunities for a small
segment of Palestinian workers. This is particularly the case for females, and may
constitute a valuable contribution to the total household income. However, additionally for males, these institutions provide employment in a situation where other legal restrictions prohibit the establishment of their own enterprises for higherlevel professionals. These opportunities, however, are for the very few. At the same
time, households relying on agricultural employment may be in a dire situation,
although the income received may vary considerably across agricultural seasons. Yet
one should not exaggerate the differences. Most Palestinian workers experience low
income-returns from labour.
Poor Households are Weakly Attached to the Labour Market
The labour market and income differentiations observed raise the question of which
households have access to which labour market segments and by how many household members. While region and gender seem to have less effect on household income than household size and its position in the life cycle, the question is raised to
what degree these characteristics also reflect different attachments to the labour
market. Which households manage to enter the labour market segments with the
highest rewards? In short, what is the ”ideal” household composition with regard
to income-earning opportunities, and who are the most disadvantaged?
The associations observed for employment characteristics are significantly stronger than for the regional and human capital characteristics observed above. Whether
the members are economically active, how much they work, what type of job they
have, in what sector, what type of industry they work in etc. are strong indicators
of the total household income (Table 6.3). For example, we see that three in ten of
top-decile household members are economically active compared to less than one
in the lowest deciles. Additionally, the most affluent household members worked
170
ten times as many hours during the week preceding the survey compared to the
lowest income-earning ones. Similarly, the picture reflects the labour market segmentation described above. In contrast to the high-income earners, the bottomincome households do not have any members who are employed by IGOs/NGOs,
in the service sector, working as high-level professionals, or in sectors of the economy where the highest incomes are earned. This is also partly reflected in the skills
competence, which on average is significantly higher in the top-earning households.
Conversely, the proportion of unemployed members is twice as high among the
lowest income earners compared to the highest.
Table 6.3 Top and bottom household income and consumption unit income deciles by household labour force indicators. Various indicators.
INCOME DECILE
Total
household income
1
2
9
10
INCOME DECILE
Consumption
unit income
1
2
9
10
All
HOUSEHOLD HEAD (%)
Economic activity:
Employed
20
44
73
75
29
48
73
74
61
Unemployed *
15
16
7
6
19
16
7
7
10
Housewife
14
8
5
8
11
8
6
8
7
Disabled/retired
49
30
11
10
40
27
13
9
20
Other
SUM
2
2
4
6
2
1
2
2
2
100
100
100
100
100
100
100
100
100
15
28
31
11
16
30
36
23
5
4
3
6
5
3
3
4
24
85
101
20
34
71
70
53
7
12
17
7
9
10
11
9
0
3
6
0
0
4
8
2
0
6
10
0
0
6
14
3
0
8
11
0
2
8
15
5
339
344
344
330
334
339
347
ECONOMIC ACTIVITY OF MEMBERS:
Economically active members (%
9
of household members)
Unemployed (% of household
7
members)*
Working hours last week (average
11
of all household members)
Educational competence
(household member index
5
average)**
Sector IGO/NGO/Government (%
0
of household members)
High level professionals (% of
0
household members)
Administration or service industry
0
(% of household members)
N (unweighted)
337
3,395
*Unemployed includes those not working but seeking work, those who have signed a contract of
employment but not yet started working, and “discouraged workers”.
** The educational index assigns a score for each educational level, starting from 0 for no education
and up to 7 for university education. Scores are then summarised across household members according to their highest completed education. The total index score ranges from 0–48.
171
Somewhat lower association, although still significant, is observed for the characteristics of the household head. These effects partly reflect the household economic activity, in the 60 per cent of the households where the head is in fact economically active. This is partly seen as an impact of the economic activity of the head
himself. The top-income deciles show twice as many economically active heads as
the bottom ones. Conversely, households in the lowest income deciles have twice
as many heads with elementary or no completed education as compared with
households in the highest income deciles. Otherwise, economic participation by
other household members may compensate for the lack of activity by the head.
With regard to the income per consumption unit, the picture is again the same.
While there is slightly less variation in the income per consumption unit along our
background characteristics, the relative impact of the various factors is about the
same as for the total income.
Household Incomes Vary Across the Household Life Cycle
So far we have focused social characteristics on the one hand and labour activities
on the other, and focused each background characteristic in isolation. At the same
time, we know that many of these characteristics tend to cumulate. For example,
low human capital transforms into low labour activity and hence low economic
wealth. To what degree do they accumulate or compensate with regard to the total
income?
To assess the effect of each background characteristic, at the same time as taking into consideration the simultaneous effect of others, we have performed a socalled multivariate analysis. For example, we know that certain occupations tend
to be filled with individuals holding high educational qualifications while others do
not require them. This means that the effect of education is at the same time accounted for by workers’ occupational profiles. Comparing the effect of each background characteristic, at the same time as taking into account the variation contributed by other factors, we can see how much of the net income variation is actually
attributed to this factor alone.8
Let us try to illustrate the dynamics by following the household across the life
cycle the way it is revealed from our (synchronic) data. We have seen that incomes
are low among the youngest household heads. Incomes increase systematically until the head is in his mid-fifties, and then decline steadily towards old age. The cycle corresponds with a rise and fall in the number of household members, and hence
the number of income earners. The household starts out with 3.3 members when
the age of the household head is twenty, then gradually expands to 6.7 at the age of
8
The full result of the analysis is displayed in the technical annex to this chapter, table A6.1.
172
forty-nine, and gradually contracts again to 2.5 at the age of eighty. Likewise, at
the early household stage when the head is in his twenties, almost half of the households are singles who live alone or together with their children or other relatives. In
households where the head is in his or her thirties and early forties, eight in ten households are couples with children. The proportion decreases again at the oldest ages
where single persons living alone account for two to three in ten and couples living
alone account for one in ten.
Starting out at a low annual household income of LL 4.3 million among the
youngest heads, it increases rapidly until it peaks at LL 7.4 million when the head
is in his/her late fifties. It then drops rapidly to a low level of LL 3.2 million for the
oldest heads. This means that even the highest income-earning households receive
an income that is fairly low. Hence the initial effect of the age of the household head
as such “disappears” when taking other background factors into consideration, and
is in fact due to variations in the household size and composition.
At the same time, we have seen that education is central to the income differentiation. While we have observed significant effects of both the educational level of
the head and the total household, it is the educational profile of the entire household that is crucial. The more household members you have, with more educational qualifications, the higher the income. The total household educational composition in fact remains as one of the major single factors contributing to the income
variation among the Palestinian refugee households.
Household labour force characteristics in general have a stronger impact on the
income differentiation than variations in their location, size and composition.
Important factors in this regard are both the number of economically active members as well as the amount of work performed. However, while both the activity of
the household head and the number of hours worked produce significant income
variation, it is the number of economically active household members that remain
the most crucial factor. Furthermore, the effect of occupation, sector and industry,
which alone account for a significant proportion of the income variation, are significantly reduced when at the same time we take into account the number of economically active members. Households may compensate for the potential lack of
access to the small high-income earning segments by employing a higher number
of household members.
The lacking net effect of gender might seem curious, as female-headed households are typically prime targets of development programmes. While we have seen
that individual female incomes on average match male incomes, the explanation is
partly that female headed households also receive transfers which are less sensitive
to gender related employment inequalities. Female-headed households receive almost three times as much in transfers as households headed by males. Additionally,
although they are smaller in size (3.6 members versus 5.6), older (average age 41 versus
173
27), and have a significant overall female tilt (gender ratio of 0.6 versus 1.3), they
have only slightly fewer income earners (0.8 versus 1.2). That is to say that in addition to the female labour market segmentation, this effect is followed up or compensated at the household level by income multiplication. This does not imply that
female headed households are not prominent in the lowest income brackets. While
a total of 18 per cent of households have a female head, they account for 43 per
cent and 26 per cent in the lowest and next lowest income categories respectively.
Female-headed households do not constitute a uniform category.
The picture drawn is, thus, one of a classical labour market selection through
human capital and skills acquisition. While the most affluent households are larger, they also have more members with high educational qualifications and who are
actually economically active, and who partially manage to manoeuvre into the narrow labour market segments of professionals and service jobs where salaries are the
highest.
6.4 Economic Wealth
Closely linked to incomes, economic wealth is important to the standard of living. Investment in real capital, houses, cars, TVs or other durables represents consumption value to the household. Those who do not possess these goods usually
need to invest and hence need income. Investments in financial capital, bank
deposits, precious metals etc. give the household economic freedom when facing
immediate income fluctuations. Although the LIPRIL does not report savings
amounts, an examination of household consumer durables and the household’s own
assessment of their financial situation may be used in proxy.
Most Households Possess Basic Household Goods
Each household was asked to indicate whether they own items on a list of 22 different consumer durables, ranging from ordinary goods such as radios/TVs and
refrigerators to luxury items such as satellite dishes and mobile telephones (Figure
6.8).
Most households possess the most basic household items. TVs top the list and
are observed in nine out of ten households. Other basic items such as cooking stoves,
washing machines and fridges are owned by eight in ten households. Seven in ten
have electric fans and radios. However, that is basically all. A significant drop is
observed when we look at cars, video recorders and mix masters, owned by two in
174
Figure 6.8 Households by ownership of (selected) consumer goods (n=3,395). Per cent of all
households.
Personal computer
Air conditioner
Satellite dish
Kerosene/diesel oven
Ordinary telephone
Mobile telephone
Vacuum cleaner
Sewing machine
Video
Mix master
Car/truck
Radio/cassette player
Gas/electric oven
Gas/electric stove
Washing machine
Fridge
TV
0
10
20
30
40
50
60
70
Per cent of households
80
90
100
ten, as well as telephones and vacuum cleaners owned by one in ten households.
Finally, PCs, satellite dishes and air-conditioners are owned by three in a hundred.
Some of the figures are comparable to similar indicators for the Lebanese households. The basic items of fridges, washing machines and televisions are also present
in nine in ten Lebanese households. The major difference is observed for items that
are more exclusive, such as videos and computers, as well as to ordinary telephones.
Lebanese households own such items about twice as frequently as Palestinian refugee
households.
Wealth Follows Income Size
We would expect a household’s wealth to follow its income. Based on the 22 consumer durables, we have created a wealth index, where the household is given the
score of 1 if it owns the consumer item, and 0 if it does not own it. Adding the items,
the household will have a total score ranging from 0 to 22. The upper part of Table
6.4 (see next page) displays the mean index score by the household income level.
175
Table 6.4 Household wealth by household income (deciles). Mean and per cent of all households in respective deciles.
Income decile
1
2
3
4
5
6
7
4.8
5.7
6.1
6.6
6.9
7.4
7.9
8.5
2
2
2
0
2
3
4
4
10
15
4
Jamiyya (%)
3
6
7
9
10
12
15
15
20
18
11
Gold (%)
5
8
10
8
12
15
23
22
30
33
17
Average number of savings
types (bank/jamiyya/gold)
0.1
0.2
Average number of consumer
durables
Bank savings (%)
Unable to raise LL 200,000 (%)
N
0.2
0.2
0.2
0.3
0.4
8
0.4
9
10
9.1
10.3
0.6
0.7
All
7.3
0.3
71
57
54
49
47
42
37
34
25
23
44
337
339
333
267
409
335
347
340
344
344
3,395
Each household possesses 7.3 items on average. In the lowest income decile, the
average score is 4.8, increasing steadily to 10.3 in the highest income decile. Topincome households have twice as many consumer durables as low-income households.
The various types of durables possessed differ across the income deciles, especially in the margins (not shown). Nine in ten households, regardless of income,
own fridges. Television sets, also owned by nine in ten households, are owned by
seven in ten poor and in more or less every high-income household. On the luxury
side, thirty in every hundred of upper-income households own telephones, while
this is the case for only five of every hundred of the poorest households. Two in ten
households own cars: five in ten in the upper decile as compared with one in ten in
the lower decile. Air-conditioning is owned by only three in every hundred poor
households, and by nine in hundred “affluent” households. In other words, the distribution of consumer durables increases systematically with increasing income. The
variation in types of durables observed as we move from the poorest to the wealthiest households is seemingly also accompanied by an increase in the cost of these
items.
Few Have Savings
Turning to financial capital, we do not have precise information on the savings
amounts, and will rely on indirect measures of savings types (Table 6.4, lower part).
Three kinds of savings are reported: bank accounts; jamiyya savings; and or gold/
precious metals. With respect to bank or other formal credit institution savings, only
five in every hundred households reports these. In addition to a lack of financial
means in general, the pattern may partly be explained by the lack of financial institutions, and partly by the fact that some households see interest rates as violating
Muslim law. At the same time, a general wealth increase is indicated as we move from
the lowest to the highest income deciles. In the lowest decile, only two in every
176
hundred households have savings in a credit institution . In the upper decile, this
goes for every fifteenth household. Yet the dominant impression is the lack of bank
savings in all households, regardless of income.
”Jamiyya” savings are more frequent than savings in the bank. This is an arrangement whereby households pool savings together for disposal at individual households according to needs. It is typical in poorer communities and often compensates for the lack of access to formal credit institutions. Every tenth Palestinian
household participates in this saving arrangement. Only three in every hundred
households in the lowest income decile benefit from jamiyya savings, while this is
the case for 18 in every hundred among the highest income deciles. The pattern may
reflect the overall low income in the population and hence few possibilities for saving at all.
Facing a general lack of credit institutions and insecurity with respect to the
future, households may tend to save in the form of precious metals, which are easily moved and converted into financial capital. Although we are talking about only
two in ten households, this form of savings is the most frequently observed among
the three. In the lowest income decile, less than one in ten households have such
savings, compared to three in ten in the two highest income brackets.9
As an indication of the amount of financial capital held by the households, we
asked them whether they would be able to raise LL 200,000 should the need arise.
Four in ten households were unable to raise the amount, leaving a large proportion
of the households with an immediate problem in terms of managing transitions in
the household life cycle, or the daily life as such. Seven in ten households in the lowest
income bracket were unable to raise the amount, compared to two in ten in the upper
income bracket.
With regard to combinations of savings types, 74 per cent of the households have
neither, 21 per cent have one, 5 per cent have two and 1 per cent report all three
kinds of savings. The more affluent households tend to diversify the most. In the
lowest decile, the average number of types is 0.1, increasing to 0.7 in the tenth decile.
Further examination of the savings combinations reveals a slight tendency of combinations of gold and financial savings. Otherwise, there is no clear pattern.
To conclude this section, the main finding is that real capital in terms of basic
consumer durables is well covered, while luxury items are rare. At the same time,
there is a general lack of financial wealth and widespread difficulty in raising capital in most households, even in the relatively speaking most affluent ones.
9
Note here a general difficulty in data collection observed during fieldwork. Some females may currently be wearing (precious) necklaces or rings, without considering them to be household savings.
177
6.5 Past Experiences and Future Expectations
Having analysed the economy of Palestinian refugee households from their reported
income and wealth and their position in the labour market, we will finally let households express their own assessment of past experiences and future prospects.
Past Experiences
Does the current income level reflect upwards or downwards mobility? A strict comparison of changes in household purchasing power would require a thorough examination of the actual amount of money spent as well as the price changes of the
most vital consumer goods available in the local market over recent years. To obtain a rough idea of the direction in which the household fares, and for reasons of
simplification, we have asked the households to assess their immediate environment
and to compare their income over the last year to the previous year.
“Every” Household Dissatisfied with their Entrepreneurial
Environment
The overall low income reported reflects a situation where an overwhelming majority of the households characterise their local income earning opportunities as poor.
Some households say, however, that the environment is irrelevant, mainly as they
have no income-earning members. Disregarding those who say it is irrelevant, eight
in ten households report opportunities to be very unsatisfactory. While there is a
slight tendency in the direction of wealthier households to be the most positive,
differences across households are small. In the lower income brackets, nine in ten
households regard opportunities as very unsatisfactory, and in the higher income
brackets the proportion is eight in ten. The same applies to the other variables related
to income, such as the number of household members who have managed to move
into high status occupations, the number of those highly educated etc. The only
background characteristic that turns out to be associated with business opportunities is geographic location (Figure 6.9).
While the majority of the households in all regions report opportunities as very
poor, the ranking from the worst to the best is as follows: Beirut, Tripoli, Tyre, Bequaa and Saida. Furthermore, while among the other regions the attitudinal similarity is more striking than the differences, Saida stands out as particular. The proportion rating opportunities here as poor are ”only” 65 per cent, while two in ten
households rate them as acceptable or better. In other words, there is no tendency
in Bequaa households to rate their environment more positively, even though they
show the highest overall household incomes and are the highest proportion facing
178
Figure 6.9 Households’ assessment of local work and business opportunities by region. Per cent
of households in each region (n=3,395).
Per cent of households
100
90
80
70
60
Very satisfactory
50
Rather satisfactory
40
Acceptable
30
Rather unsatisfactory
20
Very unsatisfactory
10
0
Irrelevant
Bequaa
Beirut
Tripoli
Saida
Tyre
income increases over the last year. This may partly be ascribed to the overall low
income level observed, and the limited income differentiation among regions and
labour market segments. At the same time, it is transfer incomes that push the Bequaa average above the other regions, and transfers are not directly related to labour
market conditions. In short, the overall majority, regardless of their social background, perceives the situation as very bad.
Half of the Households Have Experienced Income Deterioration
over the Last Year
Half of the households report their income to be lower in 1999 than the year before,
while fewer than one in ten report higher income than the previous year. The most
prominent factor in explaining economic mobility is the income level itself. While
in the lowest income decile 4 per cent have experienced an income rise and 63 per
cent an income loss, the equivalent figures in the upper decile are 15 per cent and
37 per cent respectively.
Further examination of which households move upwards and downwards reveals no uniform picture.10 In addition to the geographic location of the household, it is the type of work performed by the household members that affects its
mobility. Comparing households across geographical regions, Bequaa demonstrates
the highest proportion of households that have experienced an income rise (11 in
every hundred) and the lowest proportion that has experienced a decline (44 in
10
The model is a multivariate classification analysis. The model accounts for only 6 per cent of the
total mobility variation.
179
every hundred). The opposite trend is found in Tyre, where only four in every
hundred households have improved their income, while sixty in every hundred have
experienced income fall. Once again, regional variations are partly linked to household members’ types of occupation. Among households where no members are
employed in the service sectors, 55 per cent have faced an income loss, and 7 per
cent have experienced an improvement. For those with one or more employers in
the service sector, 13 per cent have experienced an income rise while 32 per cent
have seen their income deteriorate. In general, households experiencing upward
mobility are over-represented among those with the highest proportion of productive members, the highest educational levels, the highest proportion working as
high level professionals, those in the service sector etc., in other words the households with the highest incomes. The mobility may partly reflect the entry of one
or more household members into these higher labour market segments over the
last year, as it is also the most frequent in households where the head is in his/her
twenties-forties.
From this, we cannot, however, automatically assume that the pattern is one of
increasing income diversification among the Palestinian refugee households, as long
as we know neither the actual income level last year of today’s poor households, nor
the magnitude of the improvement or shortfall.
Linking the above assessment of local employment and business opportunities
to the economic mobility last year, the rating is relatively unaffected by recent income improvement or deterioration. Among those who experienced increased income in the last year, the proportion rating the environment as very poor is somewhat lower and the proportion rating the situation as acceptable is higher than the
average, and vice versa for those who have experienced income shortfall. Virtually
no households rate the situation as good, regardless of income change.
Future Expectations
In order to obtain a better impression of the depth of the poverty problems, we
have finally addressed each household with a set of purchase decisions, and asked
them to describe how they would face them (Table 6.5).
Table 6.5 Household assessment of own purchasing power by total household income. Per cent
of all households in respective categories reporting they can afford to... (n=3,395).
Buy new Keep home
Eat meat
Replace broken
Spend
clothes
warm
3 times per week
furniture
holiday away
TOTAL INCOME
Lowest quintile
18
28
11
6
3
Highest quintile
70
57
62
28
10
All
45
43
33
11
5
180
Five different situations are outlined: whether the household can buy new rather
than second-hand clothes; afford to keep their home warm; eat meat or fish three
times a week; replace broken furniture; and spend several weeks on holiday away
from home. The Table shows that five situations are linked to household income.
Although the answers may reflect both individual household preferences as well as
the costs involved, they may serve as rough indicators of the situation.
Affordability is Low and Few Live “Well”
The various purchase decisions give different responses. Almost half of the households report that they can afford to buy new clothes or to keep their homes warm.
The situation then deteriorates further as we move to eating meat or fish, and especially with regard to replacement of broken furniture and going on holiday. Only
eleven and five in every hundred households report affordability with regard to the
two latter situations.
At the same time, responses vary depending on the household’s financial situation. In the highest income quintile, the proportion of households reporting affordability in the various situations is about three times as high as in the lowest quintile.
Finally, we asked the households to characterise themselves with regard to their
situation in Lebanon as “rich” or “poor”. Reflecting the income distribution in Figure
6.2, only two in every hundred households define themselves as being “among the
well off in Lebanon”. Similarly, only seven in every hundred report that they “live
well”. Nine in ten claim to be “neither rich nor poor”. The final category of “poor”
was left as a residual, as households generally tend to refrain from declaring themselves poor.
In other words, the critical financial situation as exhibited by the household
financial situation partly contradicts the subjectively expressed attitudes of the
Palestinian households. Obviously very few regard themselves as well off, in particular compared to the Lebanese.
Defeatism with Regard to the Future
We have already addressed the households’ ability to raise capital. The question
posed in the survey was whether households can raise LL 200,000 in a week. While
we have seen that half of the households are unable to raise the money, let us follow this up by seeing how it relates to expectations for the future (Table 6.6).
As seen above, the ability to raise capital is clearly linked to the household’s
financial situation. Two in ten households in the lowest income decile would be able
to raise the sum, while this is the case for seven in ten households with the highest
181
Table 6.6 Household assessment of its economic future by the household’s financial situation.
Per cent of households in each income source category (n=3,395).
Can raise LL 200,000
INCOME DECILES
9
10
32
69
74
1
2
23
Unable to raise the sum:
- Situation is static
99
100
94
93
- Problem will last
31
26
17
16
- Up to God
66
72
76
76
income. Second, practically every household that is unable to raise the capital describes the situation as enduring, regardless of income, and also regardless of savings. Further examination reveals that the actual past duration of the situation is
largely a reflection of the age of the household head. Finally, two in ten households expect the situation to last for several years, or as reported by seven in ten
households, the future is in God’s hands.
Appendix 6.1 Multiple classification analysis on
total household income
Table A6.1 Household total income by selected social background characteristics. Multiple classification analysis (n=3,395).
Head age
Household type
Household size*
Head education
Members' education (index) *
Head occupation
Economically active members *
Working hours *
Members in high level professional
occupation
Members in IGO/NGO sector*
Members in service industry
Income type
R2
R
Eta/r
Beta 1
Beta 2
Beta 3
Beta 4
0.26
0.32
0.31
0.30
0.44
0.41
0.46
0.47
0.16
0.19
0.31
0.12
0.16
0.31
0.30
0.44
0.06
0.13
0.31
0.14
0.44
0.10
0.33
(0.02)
(0.06)
0.13
0.31
0.12
0.44
0.09
0.41
(0.02)
0.34
0.13
0.30
0.33
0.40
0.13
0.04
0.15
0.40
0.63
0.15
0.39
() = not statistically significant (95 per cent confidence interval)
*= included as co-variate
182
0.25
0.50
0.36
0.60
Chapter 7 Housing and Environment
Laurie Blome Jacobsen and Aziza Khalidi
7.1 Introduction
This chapter describes housing conditions, as well as the housing environment, in
the Palestinian camps and gatherings in Lebanon. The physical aspects of the housing
unit, its type, size and the quality of materials used to construct it, affect the household living in it by determining the comfort and space available to household members. As individuals spend a large part of their day-to-day lives within the dwelling,
its quality and appropriateness to the needs of the family comprise an important
part of living conditions. Hence there are two main objectives for this chapter: The
first is to describe the situation pertaining to housing conditions and infrastructure,
and the second is to delineate populations at high risk for living in poor housing
conditions.
Overall Low Housing Standard
The first section of the chapter focuses on some of the main features of the community and how it has been impacted by the series of conflicts in Lebanon over time.1
While most camps have been established since 1950, refugees mostly reside in neighbourhoods with a majority of Palestinians (see Chapter 8). Neighbourhood clustering along similar areas of origin in Palestine is frequently observed. Upwards of
three-quarters of both the camp and gathering communities’ infrastructure and community service facilities were damaged by armed conflict during the 1980s. While
reconstruction has restored a good deal of the damage, some 6 per cent to 15 per
cent of the previous infrastructure and facilities have never been repaired or restored.
The discussion then turns to the dwelling itself and works outward from the
dwelling to the immediate outdoor areas, and finally to the neighbourhood and larger
community. It shows that dar housing predominates among refugees in camps and
1
This chapter discusses results from both the LIPRIL Household and Community Survey. The latter was a survey of all communities included in the LIPRIL, in which representatives of the co-ordinating body of the community served as respondents to questions regarding a wide range of issues
pertinent to housing and environment issues.
183
gatherings (60 per cent of households), while apartment housing is also quite common, especially outside camps in city centres (40 per cent overall). Crowding is
seemingly less of a problem among refugees in Lebanon than among refugees elsewhere in the region, particularly when comparing camp refugees.
With regard to infrastructure, the refugees have good access to electricity and
almost all have independent kitchens and toilet facilities within the residence. However, piped water and drinking water, connection to sewer systems or septic tanks
and refuse collection are lacking overall or lacking for certain households. Reliability of supply of electricity, water and drinking water is quite low.
With regard to community services, camps are generally better equipped than
the gatherings. Nearly all camp households are covered by basic health facilities and
health personnel and have much better access to general community service facilities (such as cultural, transportation, youth and welfare services) than in the gatherings. There is, however, an overall lack of some services - none of the communities have fire stations and only Northern camp communities have post offices.
In general, the analysis demonstrates that Palestinian refugees’ housing conditions in Lebanon are, in many respects, the worst among Palestinian refugees in the
region. This is partly due to the special legal and security conditions refugees have
faced in Lebanon. Refugees have not only faced restrictions on the construction of
permanent housing and infrastructure facilities in the past and present, but have
also experienced massive destruction of homes, community service facilities, and
water, sewage and electricity infrastructures as a result of armed conflict in Lebanon, particularly in the last 20 years.
7.2 Community Profiles: Community Origins and
Damage from Armed Conflict
Most of the Palestinian population in Lebanon live in camps and gatherings instituted since 1950. The institution year of gatherings is more dispersed. Approximately
a quarter of the gathering population live in communities established in 1948, including gatherings in Beirut, Bequaa, Saida and Tyre. Half of gathering residents
in Beirut and all gathering residents in Tyre live in communities established as a direct
result of the 1948 conflict.
184
Neighbourhoods Cluster Around Similar Areas of Origin
Palestinian camp and gathering refugees tend to reside in communities with a majority of Palestinians, although there are two exceptions to this – gathering refugee
communities in the Bequaa and Tripoli areas. All gathering refugees in Bequaa reside in a predominantly Lebanese community, and in Tripoli, about half of gathering residents are in predominantly Lebanese communities.
Neighbourhood clustering along similar areas of origin is particularly evident
in the camps, but gatherings tend to be characterised by persons living alongside
each other who have more diverse origins. More than three-quarters of camp residents are in communities where people from the same area of origin in Palestine
reside in the same neighbourhood. In the gatherings, the situation is the opposite:
70 per cent of individuals live in communities in which people have different places of origins.
Popular committees constitute the major co-ordinating bodies in communities
where some 70 per cent of individuals reside. Joint activities among organisations
within communities are more commonly held in camps than in gatherings. Tripoli, Beirut and Saida camps all report high levels of joint activities. Gatherings in Beirut
also frequently hold joint activities.
Significant Damage From Wars
As reported by the 55 communities included in the LIPRIL Community survey,
Table 7.1 provides an overview of the level of destruction associated with the worst
conflict event experienced by the community and the level of reconstruction that
has taken place since that event.2 The table shows the estimated percentage of
facilities that were damaged in each community. This includes 37 communities
reporting that they suffered any damage from armed conflict, and 33 communities reporting that the damage from that event still exists in 1999. Most communities report the year of the worst event to be between 1982 and 1983 (48 per
cent) or 1985 and 1986 (32 per cent). Altogether, some three-quarters of medical
facilities, water supply systems and sewage systems were damaged. About half of
the residences and schools were damaged, along with most businesses. As of 1999,
there has been an almost complete recovery, with around 10 per cent of the facilities damaged in the event not having been restored. Almost all camp households
are located in communities that have sustained damage from armed conflict (94
per cent), and 84 per cent of gathering households are located in communities that
have suffered from the conflict.
2
Two small communities were not visited during the community mapping.
185
Table 7.1 Average estimated per cent of facilities damaged in worst armed conflict event reported by communities (n=37).
Average % damaged
in worst event
Average % of damages
still present in 1999
Housing residences
46
6
Schools
55
14
Medical facilities
75
11
Businesses
82
11
Water supply systems
76
15
Sewage and waste water systems
79
12
Number of communities
37
33
7.3 Physical Aspects of the Dwelling
While the house constitutes a vital element of overall individual well-being, some
aspects of the housing structure are dependent upon whether the house is located
in an urban or rural area. Other aspects vary with both the economic situation of
the household and the type of housing structure. Finally, the size of the house and
whether or not rooms have been added recently are often dependent on the need of
the family at various points in its development over time.
Dars and Apartments Most Common Housing
Figure 7.1 shows the distribution of types of housing structures across types of neighbourhoods. Although there is a mix of housing structures in all the types of neighbourhoods, clear urban, rural distinctions are evident. The typical rural housing
structure is a one-storey house, dar, with one central open space and rooms built
on around this, as they are needed. Kitchens and toilets usually sit adjacent to the
rooms. The typical urban housing structure is apartments. The space is more fixed
and is arranged differently in apartments, with the main open space lying on the
periphery of buildings in the form of balconies, and rooms, kitchens and toilets are
located within the main structure.
Overall, approximately 60 per cent of households live in dar housing and 40 per
cent in apartments. Less than 1 per cent of households live in improvised, squattertype housing such as huts or barracks. This type of housing is found primarily in
the city centres, as seen for example by the many extremely low-standard gatherings here. Furthermore, the type of housing unit that the family lives in is related
to the household life cycle (with some exceptions). For most households, there is
186
Figure 7.1 Per cent of households in different housing structures by neighbourhood type
(n=3,600).
Dar, villa
Apartment
Other
Rural area
Urban area
City suburb
City center
0
20
40
60
80
100
Per cent
movement from apartments to dars as the family grows and ages. Two exceptions
to this are high-income households and those residing in the city centres. Outside
camps, high-income households are more than twice as likely to live in apartments
than low-income households. In city centres, households with heads aged between
49 and 60 live in apartments more often than younger families. Camp refugees
overall live in dar housing more often than gathering refugees (63 per cent and 41
per cent respectively).
Most housing structures, including both dars and apartments, are constructed
either from blocks made of a combination of concrete and lightweight material (85
per cent) or from a combination of blocks and cement (11 per cent). This varies
little between camp and gathering locations, although housing made of expensive
cut-stone is primarily rented housing found outside refugee camps in urban gathering areas. Very few housing structures are made with sub-standard materials such
as clay, asbestos, wood or zinc (1 per cent) and most of these are located in gatherings.
Less Crowding than Elsewhere in the Region
Camp and gathering dwellings on average have three rooms, not including kitchens and hallways, and two rooms are only used for sleeping. Dar dwellings are generally smaller in size than apartments, and dwellings in the camps are smaller than
in gatherings. To some extent, dwelling size is conditioned by the size of the household, although large households show a higher degree of crowding than others (discussed below). However, maintaining a constant household size, the income level
of the household shows a stronger association with dwelling size than either the type
of household or location.
187
Figure 7.2 Average number of rooms by household size.
Number of sleeping rooms
Number of rooms
Number of persons in household
All
10 +
59
24
1
0
1
2
3
4
Figure 7.3 Average number of rooms by income.
Number of sleeping rooms
Number of rooms
More than 8,400
5,4018,400
3,8015,400
2,4013,800
Less than 2,401
0
1
2
3
4
Palestinian refugee households in camps and gatherings in Lebanon experience less
crowding than has been found among refugees located in Jordan or the West Bank
and Gaza. In particular, the level of crowding is slightly less among those living in
camps than those in gatherings, while camp refugees elsewhere usually experience
considerably more cramped living conditions than others. While the comparison
must be made with caution, as the gathering refugees do not represent the entire
non-camp population in Lebanon, it is partly the result of the relatively smaller
household size found among the camp refugee population in Lebanon, relative both
to those outside camps in Lebanon and camp refugees elsewhere. The lack of difference between camp and gathering areas may also be partially due to the tendency for there to be settlement in the areas on the immediate periphery of the camps,
which often have severe crowding. Figure 7.4 shows the level of crowding among
camp refugees in the region.
188
Figure 7.4 Per cent of camp refugee households in crowded dwellings in Syria, Lebanon, Jordan and the West Bank and Gaza Strip.
West Bank and Gaza
Jordan
Lebanon
Syria
0
10
20
30
40
50
Per cent
Crowding, defined here as having 3 or more persons per room, is particularly a
problem for large households with 10 or more persons, among whom three-quarters of the households are living in crowded conditions. Households in the phase
of the family life cycle of having small children in the household are also more at
risk for crowding, as shown in Figure 7.5. Finally, rural households have considerably more crowding than average (37 per cent of households compared to 28 per
cent overall). The amount of crowding is also related to the kind of dwelling; one
in two households living in temporary type housing, such as barracks and tents, are
crowded, and those in dar housing are more often crowded than those living in
apartments (32 per cent compared to 22 per cent). The level of crowding varies little across income groups or regions.
Most households (82 per cent) report that their dwelling has some peripheral
space outside of the main rooms, such as balconies or verandas, roof areas, and shop
or work areas. One in ten households have access to a garden plot or kitchen garden. Such peripheral space is more available in gathering areas than in refugee camps,
where over twice as many households have access to gardening areas and more households have balconies, roof areas or workshops (87 per cent compared to 81 per cent).
Figure 7.5 Per cent of households in crowded living quarters.
10+ persons
5-9 persons
Rural area
Extended family
Couple/small children
Head age 31-45
All households
0
20
40
60
80
100
Per cent
189
7.4 Land and Reported Ownership
Land ownership is complex among the refugees in Lebanon. Most camp households live in communities where the land is either partially or wholly leased by
UNRWA (61 per cent and 17 per cent respectively). The owner of the land on
which the community resides thus varies considerably across rural or urban categories. Private ownership, or a combination of private and government ownership, is found mostly in rural and suburb areas, where sole government ownership
is rare. In contrast, half of the households in city centres and other urban areas
reside in communities on land owned exclusively by the government. Private land
ownership is much more prevalent in gathering areas than in camps, thus, 70 per
cent of gathering households compared to 26 per cent of camp households reside
in communities on privately-owned land.
Dwelling Ownership is Legally Complex
Considerable restrictions exist on private persons purchasing buildings for business
purposes, including any production or entrepreneurial activity. Overall, only 10 per
cent of households are located in communities where it is formally legal for individuals to buy buildings for commercial purposes, and nearly all of these communities are in gathering areas. While less than 1 per cent of camp refugee households
have the legal right to such purchases, 45 per cent of gathering refugees reside in a
community where building purchases are officially permitted.
Approximately eight in ten refugee households report that they own their own
home. Camp refugees often report that they own their dwelling - although the land
itself is not owned by the refugees – more often than those living in gathering areas
(82 per cent compared to 70 per cent). However, here the concept of ownership must
be considered with care, as it is in many respects not comparable given the special
circumstances in the camps. Both groups of refugees report ownership more often
than the Lebanese population as a whole, among whom 68 per cent own their homes
(Ministry of Social Affairs/UNDP 1998:64). Figure 7.6 shows the distribution of
reported ownership and renting by the type of dwelling for both camp refugees and
gathering refugees. Reported ownership is quite evenly distributed across income
groups, as depicted in Figure 7.7. However, apartment renters in gatherings are
primarily high-income (25 per cent) and middle-income (52 per cent) households.
In both camps and gatherings, as would be expected, most of those granted or occupying their living quarters without cash rent are low and middle-income households.
The most common way households report they have became “owners” of their
dwelling is by building it themselves (61 per cent) followed by purchasing the home
190
Figure 7.6 Tenure by dwelling type. Per cent of households in camps and gatherings (n=3,617).
Own
Rent
Granted, occupied without cash rent
All
Gatherings
Other
Apartment
Dar
Camps
Other
Apartment
Dar
0
20
40
60
80
100 Per cent
Figure 7.7 Tenure by income group. Per cent of households in camps and gatherings (n=3,617).
Own
Gatherings
Rent
Granted, occupied
High
Middle
Low
Camps
High
Middle
Low
0
20
40
60
80
100 Per cent
(18 per cent) and inheriting the dwelling from parents (11 per cent). Six per cent
report that they received the dwelling free. Camp households are twice as likely to
have inherited their dwelling from their family and are more likely to have built the
dwelling themselves than gathering households. Very few households report that they
rent out rooms in their dwelling (only 12 households in the sample), or receive income from renting (4 sampled households).
Figure 7.8 Financing of dwelling. Per cent of households that own it (n=2,857).
Built
Purchased
Inherited from parents
Received for free
Other
Gathering
Camp
0
20
40
60
80
100 Per cent
191
Considering the 6 per cent of households that rent for cash payment, on average
the monthly payment is LL 150,000, although the payment amount varies considerably by region and type of location. Average monthly rental rates are generally
higher in camps than gatherings, but this is primarily due to higher rates in the
southern region as a whole than the north. Apartments are rented at higher rates
than dars (LL 169,000 compared to LL 118,000) and housing in rural areas is considerably less expensive than average (LL 101,000). When considering rental payment as a percentage of total household income, households use on average 6 per
cent of annual income on rent. This percentage is quite consistent across regions
and type of housing, but is lower in rural areas (3 per cent of income), and considerably higher among lower-income households. Among renters in the lowest income
group, households use on average 16 per cent of annual income on rent, compared
to 1 per cent of income among the highest income group.
Respondents were asked if they either rented or were granted the dwelling from
UNRWA, from private persons or from the government, but not if they rented or
if they were granted the dwelling. Here, only households that report an actual cash
amount paid in rent are considered as renters, otherwise the household is considered as having been granted the dwelling. Among the latter, approximately onequarter are squatters, one-quarter were granted the dwelling from private persons
or concerns, and one-half from UNRWA. Nearly all of the housing granted by
UNRWA is in the camps, and is provided mostly to families with young children
and households with elderly heads. UNRWA-granted housing is somewhat more
common in low-income households (35 per cent of such housing) but otherwise
fairly evenly spread across all income groups (13 per cent to 19 per cent of such
housing in each income group). Squatters (households occupying the dwelling without renting or being granted it) are more common in gathering areas than camps
and primarily middle-income households. Grantees of housing from private sources are mostly in camps (75 per cent) and low-income households.
7.5 Infrastructure Amenities, Sanitation and
Environment
The LIPRIL collects data on infrastructure and related services at both the household and community levels, and includes data on the household’s access to a number
of infrastructure amenities related to sewage, refuse, electricity, heating, water, and
kitchen, bath and toilet facilities.
192
Good Access to Electricity, Kitchen and Toilet, but Water and
Refuse Collection are Lacking
Overall, refugees have good access to electricity (98 per cent are connected to an
electricity network), and have independent kitchens (96 per cent) and toilet facilities (95 per cent) in their residences. The availability of these three amenities varies
little regionally, between urban or rural locations, or between camps and gatherings.
However, other infrastructure amenities are lacking overall, or lacking for certain
groups of households. Figures 7.9 and 7.10 show the variation in these amenities
by camp and gathering, region and urban/rural groups. Not shown, is room heating, which only one in three households report having, and the extent of which does
not vary substantially among groups. It is however slightly more common in the
Northern region.
Camps and gatherings face different types of problems, whereas the difference
between rural and urban is that rural areas have better overall access to amenities,
but less reliable supplies. Overall, access to safe drinking water and water in general
piped directly into the household is lacking for all groups. In addition to this, refuse
disposal is particularly a problem for gathering areas. In the camps, stability of electricity is particularly a problem for the Northern camps and stability of drinking
water supply is a problem for the camps in the South. We go into more detail regarding specific infrastructure amenity problems and their reliability below, and
finally, using an index of all the amenities show how the socio-economic situation
of the households affects the access to these resources and facilities.
Figure 7.9 Per cent of households without amenities by regional camp and gathering locations.
No private bath/shower
80
Unstable electricity supply
60
Not connected to
sewage network/septic tank
40
20
Unstable water supply
0
Unstable drinking water supply
Garbage not collected
No piped drinking water
No piped water
North Camp
South Camp
Gathering
193
Figure 7.10 Per cent of households without amenities by urban/rural locations.
No private bath/shower
80
Unstable electricity supply
Not connected to
sewage network/septic tank
60
40
20
Unstable water supply
Garbage not collected
0
Unstable drinking water supply
No piped drinking water
No piped water
Urban
Rural
UNRWA and the Government are Frequent Providers of Sewage
Slightly over half of all households live in communities where UNRWA is the only
provider of sewer network connection, 14 per cent where the community is served
by multiple providers, 11 per cent where the government is the provider, and 4 per
cent where popular committees provide sewer network connections. Fourteen per
cent of households live in communities that report that there are no sewerage facilities available. Most of these are in urban areas outside of cities and suburbs, and
rural communities and gatherings. The set of sewerage service providers is quite
different in camps compared to gatherings. In camps, UNRWA is the main provider (70 per cent of households live in communities served by UNRWA only) while
in gatherings the government is the main provider (50 per cent of households in
these communities). Over twice as many gathering households live in communities where no sewerage service is provided, compared with the camps (23 per cent
and 11 per cent respectively).
Open sewage ditches are infrequently reported, but are more often found in
camps than in gatherings3. Overall, 7 per cent of households live in communities
where there are open sewage ditches, and most of them are in camps (8 per cent of
camp refugees). Less than 1 per cent of households are in communities where open
sewage ditches are filled with solid waste.
3
The LIPRIL collected data at the community level on several categories of open ditches, including
separate categories for open ditches filled with raw sewage and open ditches filled with garbage.
Discussion of the latter follows later in this section. Here we refer only to ditches with raw sewage.
194
Approximately nine in ten households report that they are connected to the sewer network or to a septic tank. This level of access varies only slightly across camp
versus gathering, or urban versus rural locations. There are regional differences
among camp refugees, however: Camp households in the north have better access
to sewer facilities, where 96 per cent of households are connected compared to 78
per cent of the camps in the south and between 83 per cent and 85 per cent of
gathering households in both regions.
Piped Water often Available, but Suffering from Service
Irregularity
Almost half of the households live in communities where water is provided by
multiple providers, 28 per cent where the popular committees provide water, 16 per
cent where the government is the provider and 7 per cent where UNRWA is the
provider. Overall, only 2 per cent of households are in communities served solely
by private water providers. UNRWA is the sole water provider only in rural areas
(27 per cent of households) and in camps (8 per cent of households). A large number
of households here have popular committees as their water provider (67 per cent).
In contrast, households in urban communities are provided with water by the government or multiple providers much more often.
Overall, 64 per cent of households have water piped into the residence and 50
per cent have piped drinking water. Although less have piped drinking water than
general water, drinking water sources are overall more reliable, providing 63 per cent
of households with a stable supply compared to 56 per cent of households with a
stable general water supply.
While we do not know the quality of the drinking water provided from the
data gathered in the survey, we can assume that drinking water piped into the
residence, or delivered by tanker truck, as well as bottled water, are relatively safe
Figure 7.11 Source of drinking water by urban and rural locations.
Piped into residence
Piped into building,yard
Public tap, reservoir
Tanker truck
Bottled water
Well, borehole, other
Rural area
Urban area
City suburb
City center
0
20
40
60
80
100 Per cent
195
sources of drinking water. Other sources such as open containers and reservoirs
are potentially unsafe. The LIPRIL survey questioned whether the latter type of
source included any filtering devices, 87 per cent of households did not. Overall,
refugees have lower access to “safe” drinking water sources than the national population, among whom 97 per cent are reported to have access to safe drinking water.
As we see in Figure 7.11, there is great variation in the source of water and
drinking water by urban and rural location of households. As the patterns for both
types of water are similar, the remainder of this section will focus on drinking water.
Refugee households in city centres and suburbs have drinking water piped into
their residence least often, relying mostly on tanker truck and vendor delivered
water, although suburban households also make frequent use of public reservoirs
and taps. Rural households have better access to piped drinking water, with over
60 per cent having drinking water piped into their residence. The 40 per cent
without piped water rely on potentially unsafe sources such as boreholes and rainwater wells (which mostly do not have any filtering devices).
Figure 7.12 shows the reliability of the various sources of drinking water by camp
or gathering location. Here we see that the source of water is related to its reliability. While drinking water piped into the residence may be seen as the most convenient source of drinking water, it is not very reliable compared to other sources for
some locations. Tanker truck delivered water is the most reliable, with 83 per cent
of the households using this source reporting that they never, or almost never, experience supply problems. As regards piped drinking water, a total of 61 per cent
report a stable supply, but this varies greatly by location. Camp residents have supply problems more than four times as often as gathering residents, and rural households have daily problems with supply 10 times more often than city households.
Figure 7.12 Per cent of households with no or infrequent problems in supply of drinking water by source and camp or gathering location.
Gathering
Camp
All
Piped into yard
Public reservior
Piped into residence
Well, borehole, other
Public tap
Tanker truck
0
196
20
40
60
80
100
Per cent
Figure 7.13 Per cent of households with weekly and daily problems in supply of drinking water piped into the residence by urban and rural locations.
Weekly problems
Daily problems
Rural
(n=565)
Urban area
(n=430)
City suburb
(n=577)
City center
(n=231)
0
20
40
60
80
100 Per cent
Figure 7.14 Per cent of households with weekly and daily problems in water supply, or restricted
water supply by the main water provider to the community.
Weekly problems
Daily problems
Only water some hours
per day
Prolonged periods
without water
Multiple providers
UNRWA
Popular committees
Government
0
20
40
60
80
100 Per cent
The level of reliability of water varies with the main provider of water to the community. Communities were not asked whether the water provided was general water or drinking water. Households living in communities in which UNRWA is the
sole provider of water most often report some interruption to water service overall,
and most often report that water is only provided for some hours during the day.
This may indicate that UNRWA services target the most poorly developed areas.
Most Households have Electricity Network, but Reliability is Poor
The government, popular committees and multiple providers make up the three
categories of electricity providers to the communities. About half of the households
live in communities where electricity is provided by the government and half where
it is provided by multiple agencies. Popular committees only provide electricity in
city centre communities, where 10 per cent of households have their electricity provided by these committees.
197
Most households are connected to an electric network (96 per cent). Three per
cent of households, in addition to using the electric network, also have a private
generator, and 2 per cent rely completely on a shared electric generator. Overall,
the reliability of electricity supply is poor, with over 40 per cent of households reporting frequent service interruptions.
Those who report regular problems mostly have daily interruptions. As shown
in Figure 7.15, the severity of these interruptions varies considerably by region, camp
and rural or urban location. Camp refugee households in the Northern region have
the least reliable supply of electricity, among whom over six in ten households have
frequent problems, and one in two have daily problems. Many of these households
are located in rural areas (34 per cent), where we also find relatively more electricity supply problems. Gathering and urban area locations have less frequent problems, and have any problems less often than average.
The pattern of electrical interruptions is partially explained by the type of provider. Figure 7.16 shows the level of supply problems associated with each major
provider. Households in communities with multiple providers most often experience electricity supply problems, and have a more restricted supply than in other
communities. Rural communities and city suburbs most often rely on multiple
Figure 7.15 Per cent of households with electricity supply problems by frequency of problem.
Daily problems
Weekly problems
Electricity only few hrs/day
Camp North
Camp South
Gathering
Rural
Urban area
City suburb
City center
0
10
20
30
40
50
60
70
80
90
100
Per cent
Figure 7.16 Per cent of households with electricity supply problems by frequency of problem
and main supplier.
Weekly problems
Daily problems
Electricity only few hrs/day
Multiple providers
Popular committees
Government
0
198
20
40
60
80
100 Per cent
providers. Finally, there is a large difference in providers of electricity between camps
and gatherings: 60 per cent of camp households are in communities served by
multiple providers compared to 16 per cent of gathering households.
UNRWA Main Provider of Refuse Collection
UNRWA provides most refuse collection service in the camps, where 84 per cent
of households are located in communities served exclusively by UNRWA. In gatherings, the provision of service is more dispersed among providers, with half of all
households in communities where the government collects refuse, and roughly 10
per cent in communities serviced by private persons, popular committees and
NGOs. UNRWA also provides refuse collection services to 16 per cent of households living in gatherings.
Open drainage ditches filled with refuse are present in both camps and gatherings. Forty-five per cent of camp refugee households and 33 per cent of gathering
households live in communities where this is reported to exist. This problem is most
evident in city suburbs where some 70 per cent of households live in communities
where refuse is dumped in drainage ditches.
As shown at the beginning of this section, gathering refugee households have a
large problem with refuse collection, and less than half the number of households
have refuse collected in gathering areas compared to the overall average of 73 per
cent. Gathering households depend on open rather than closed containers (43 per
cent) more often than households in other areas, and more depend on burning and
dumping than elsewhere. Refuse disposal is relatively better in camp locations, where
a higher percentage of households have refuse collection services compared to the
average, but service is not as good in the Southern camps as in the Northern ones.
Figure 7.17 Method of refuse disposal. Per cent of households.
Collected
Open container (UNRWA/public)
Closed container (UNRWA/public)
Burned
Dumped
Composted, other
Gathering
Camp South
Camp North
Rural area
Urban area
City suburb
City center
0
20
40
60
80
100
Per cent
199
Considering urban and rural differences, in general, urban areas are less served by
refuse collection, although suburban areas have more access to closed containers. A
high percentage of city centre and urban area households depend on open containers (32 per cent and 21 per cent respectively). While a high percentage of rural
households have refuse collected (83 per cent), those who do not mostly dump it
(8 per cent). Corresponding to the method of refuse disposal, we find that more
than one in three households in gathering areas report that they are usually exposed
to refuse smells. One in two city centre households and 34 per cent of urban area
households also report regular exposure to refuse smells.
Infrastructure amenity problems such as access to safe drinking water, reliability
of drinking water, electricity sources and refuse collection do not appear to be strongly related to the socio-economic position of the household. They are much more
associated with the regional, urban or rural, and camp or gathering location of the
household. However, when we consider infrastructure amenities as a group, certain
groups of households, such as female headed, low-income and “loner” households
more often lack multiple amenities than other households. Figure 7.18 shows the
average number of amenities for these groups.
Figure 7.18 Average number of infrastructure amenities. Bars represent difference from overall
average of 5.6 amenities. The maximum number of amenities is 9*.
Granted, occupied housing
Single with children household
Loner household
Female head
Male head
Not in labour force
Employed
High income
Low income
Gathering
Camp
5
5,2
5,4
5,6
5,8
6
* The nine amenities are: piped drinking water; kitchen; garbage collection; tub or bath in residence; toilet in residence; connection to electricity; stable drinking water supply; stable electricity supply; and connection to sewerage.
200
Gas Used for Cooking, Electricity for Heating
Gas is by far the most common energy source for cooking, and is used by 99 per
cent of the households. Gas is used much less for heating water and rooms (25 per
cent and 39 per cent respectively). The majority use electricity for water heating
(66 per cent). With regard to room heating, the sources are more diverse. As shown
in Figure 7.19, a quarter of the households use wood or charcoal and a third use
gas and electricity. Few households use kerosene or diesel as energy sources for cooking, room and water heating (less than 10 per cent).
Figure 7.19 Fuels used for room heating. Per cent of households. Figure adds up to more than
100 per cent, because some households use more than one type of fuel.
Kerosene
Diesel
Wood, charcoal
Gas
Electricity
0
20
40
60
80
100 Per cent
Figure 7.20 Fuels used for water heating. Per cent of households.Figure adds up to more than
100 per cent, because some households use more than one type of fuel.
Solar
Kerosene
Diesel
Gas
Electricity
0
20
40
60
80
100 Per cent
201
7.6 Indoor and Outdoor Environment
A number of aspects concerning the quality of the indoor environment were explored in the LIPRIL survey. Households were asked if they experience certain kinds
of environment problems such as coldness, dampness and noise, and the severity
of such problems. While the indoor environment is primarily determined by climate, residential density, the type of housing and construction materials used, and
the existence of certain amenities such as room heating, the data is based on the
subjective evaluation of the environment by the household respondent. Persons
have differing expectations of the indoor environment and will be bothered to a
greater or lesser extent by the same indoor quality as other persons. Nevertheless,
we do find that the indoor environment quality is poor for the same households
that tend to live in crowded, sub-standard housing in locations that are less better
served with electricity, water and refuse collection.
Poor Housing Conditions Tend to Cluster
The most prevalent types of indoor environment problems are general dust, humidity, and coldness in winter and hot rooms in summer (Figure 7.21). From twothirds to three-fourths of households complain of each of these problems. The indoor environment is reported to be worse for households in camps than in
gatherings, particularly regarding ventilation and lack of light.
The amount of dust in the household may be related to the climate and levels
of outdoor pollution. Exposure to noise from within the household, however, is more
related to the type of household (for example, households with small children) and
the residential density, as 36 per cent of city centre dwellers complain of daily noise
Figure 7.21 Per cent of households with indoor environment problems. By type of problem.
All
Gathering
Camp
Lack of light
Occasional noise from inside
Daily noise from inside
Poor ventilation
Rooms are hot in summer
Rooms are cold in winter
Rooms are humid/damp
General dust
0
202
20
40
60
80
100 Per cent
compared to 27 per cent of rural households. An indoor quality additive index
was created, which included five of the environmental problems listed above (excluding noise and dust). Overall, households reported an average of 2.7 problems.
Northern camps and low-income households have more problems, as do those living
in temporary type housing and housing made of poor materials such as asbestos
(not shown). Poor housing conditions appear to cluster together as both crowding and lack of amenities are associated with poor indoor quality.
The LIPRIL survey also questioned household respondents about a series of
outdoor environment problems, which may be experienced from within the dwelling itself or in the immediate outdoor area surrounding the dwelling. These problems include severe noise coming from outside, car pollution, industry pollution,
animal smells, refuse smells, sewer or waste water smells, as well as general dust.
Figure 7.22 shows the percentage of households that report experiencing these problems by camp and gathering location. Overall, the most common of these outdoor
environment problems is severe noise coming from outside. Forty-five per cent
complain of sewer smells and 30 per cent complain of car pollution and refuse smells.
These types of problems are not associated with each other. That is to say that the
types of environmental nuisances do not tend to cluster together for certain households, but are determined by the location of the household – camp, gathering or
region. Certain problems are more prevalent in each of these areas.
Figure 7.22 Outdoor environment problems. Per cent of households.
Severe noise from outside
80
60
Sewer, wastewater smell
40
Car pollution
20
0
Garbage smell
Industry pollution
Animal smell
North Camp
South Camp
Gathering
203
Car and industry pollution, and sewer smells are found more in gatherings than
in camps. Almost all types of pollution are more of a problem in the Northern camps
than in the Southern camps. In addition, sewer and refuse smells are more common in city centres than elsewhere, where one in two households complain of sewer smells (30 per cent overall average) and 57 per cent complain of refuse smells (45
per cent overall average). Smells from animals are, naturally, mostly a problem in
rural areas.
Between a quarter and 40 per cent of households report that they are somewhat
to very dissatisfied with their dwelling’s indoor environment or pollution level in
the immediate surroundings of the dwelling. The level of dissatisfaction among
households is higher for outdoor pollution than indoor environment (37 per cent
and 23 per cent respectively). City centre residents are the most dissatisfied with both
indoor and outdoor environments. Gathering households are more dissatisfied with
outdoor pollution than camps (47 per cent and 35 per cent of households respectively). Following the pattern of indoor nuisances, twice as many Northern camps
are dissatisfied with their indoor environment than Southern camps. On average,
those who report to be dissatisfied, also experience more nuisances, particularly with
regard to the indoor environment.
In addition, we find that certain kinds of environmental problems cause relatively more dissatisfaction. Noise from outside, refuse and sewer smells are not only
the most common outdoor environment problems, but also those most associated
with dissatisfaction. Lack of natural light, humidity and poor ventilation in the
indoor environment are more closely linked to dissatisfaction than the other indoor
environment problems, such as difficulty in regulating temperature and noise.
7.7 Neighbourhood Resources and Services
Having assessed the indoor standards, we now turn to the characteristics of the
neighbourhood surrounding the households, such as whether or not the community has general security, postal, fire, shopping, youth and sport facilities, and whether
or not there are basic health and education services. Alongside this description of
the extent of community services, we examine the level of satisfaction the household respondent has with various aspects of community and community-level services.
204
Camps Better Equipped with Community Services than Gatherings
Figure 7.23 shows the percentage of households living in communities reporting
to have a number of different facilities generally provided at the community level.
Two points are immediately evident from the graph. First, camps have much better
access to facilities than gatherings, and second, there is an overall lack of some services. None of the communities have fire stations and only Northern camp communities have post offices. Sports facilities are lacking, particularly for Southern camps
and gatherings.
Apart from transportation services (bus, taxi, train, minibus) and grocery shopping, roughly half to three-quarters of gathering households live in communities
without basic cultural, youth, welfare, security and sports facilities. Correspondingly,
we find that gathering refugee households are less satisfied with these aspects of their
neighbourhood. As shown in Figure 7.26, twice as many gathering households are
dissatisfied with public transportation (26 per cent compared to 13 per cent), and
10 per cent more gathering households are dissatisfied with cultural opportunities
than camp refugees. Gathering refugees are much more dissatisfied with shopping
(20 per cent compared to 8 per cent of camp refugees), although all have access to
groceries.
Rural areas in general have better access to these community services than both
city centres and urban areas. Considerably less city centre households than average live in communities with police or civil defence, feeding or ration centres, or
Figure 7.23 Per cent of households with general community services in their community.
Transportation
100
Fire station
Grocery shopping
80
60
40
Youth club or
childrens park
20
Post office
0
Sports facility
Feeding or ration center
Police or civil defense center
Camp North
Library, cinema or culture center
Camp South
Gathering
205
libraries and cinemas (34 per cent compared to 70 per cent overall and 84 per cent
of rural households). City suburbs, however, have good access to shopping, cultural activities and youth facilities, but very few (less than 5 per cent of households) live in communities with sports facilities, fire stations or post offices.
Turning to health facilities and health personnel, almost all camp households
live in communities where these are available (Figure 7.24). Gathering households
also live in communities with some health facilities, but roughly 80 per cent or more
live in communities without a licensed midwife, emergency medical facilities, ambulance service, or a family planning clinic.
Once again, we find that some of these services are less available in city centre
communities than elsewhere. Only 40 per cent of city centre communities report a
licensed midwife being available, compared to 90 per cent of suburbs, 70 per cent
of urban areas and 79 per cent of rural communities. Emergency medical facilities
are also severely lacking in city centre communities, with only 32 per cent of households residing in communities with this service compared to 72 per cent overall. As
far as the number of clinic and hospital facilities available is concerned, we also find
that although most have such facilities, city centre households have fewer private
hospitals than elsewhere. On average, city centre and suburban households live in
Figure 7.24 Per cent of households with medical facilities and medical personnel in their community.
Medical clinic
100
Family plan clinic
80
Hospital
60
40
20
Emergency
services/ambulance
Doctor
0
Licensed midwife
Nurse
Dentist
Camp North
206
Camp South
Non camp
communities with 1 private hospital, urban residents on average have 2.4, and rural
areas have 2.
With regard to educational services, Figure 7.25 shows the percentage of households living in communities with various kinds of facilities. Lebanese government
schools are treated separately here as refugees are not currently allowed to attend
government schools. As with other community services, gathering households live
in communities with educational facilities less often than camp households. Northern camp residents have access to education facilities less often than residents of
Southern camps.
Almost all camp refugees have kindergartens in their community compared to
70 per cent of gatherings. Eighty-five per cent of camp refugees have an NGO,
UNRWA or religious primary school, and 78 per cent have an NGO, UNRWA or
religious secondary school. In contrast, roughly half of gathering residents do not
have an NGO, UNRWA or religious primary or secondary school in their community. Literacy programmes are lacking in both areas, with 18 per cent of gathering
and a quarter of camp households having a literacy programme in their community. Only half of camp residents and slightly fewer gathering residents have a day care
or home care facility for children in their community. Less than 10 per cent of the
Figure 7.25 Per cent of households with education facilities in their community.
Literacy program
100
Lebanese government primary
Nursery
80
60
40
Lebanese government
secondondary school
20
Kindergarten
0
NGO vocational training centre
University
Camp South
NGO, UNRWA,religious
primary school
NGO, UNRWA, religious
secondary school
Camp North
Non camp
207
households in either camps or gatherings have universities and vocational training facilities in their communities. Childcare facilities and secondary schools are
especially lacking in Northern camps, where half as many households have nurseries than in the Southern camps (35 per cent compared to 72 per cent). In addition, only 56 per cent have a secondary school in the community compared to 97
per cent of Southern camp households. However, more Northern camps have
universities and vocational training (17 per cent) than average, while no households in Southern camps have these in their community.
Literacy programmes, nurseries, secondary schools, universities and vocational
training centres are much less common in city centre communities than elsewhere,
while we find that rural areas have fairly good access to all of these except universities and vocational training.
Finally, camp households in the north are more dissatisfied with the educational facilities in their neighbourhood (Figure 7.26). Twenty-seven per cent of Northern camp households were dissatisfied compared to 24 per cent of Southern camp
and 28 per cent of gathering households. City centre households were less frequently
dissatisfied with schools than rural areas (19 per cent dissatisfied compared to 30
per cent for rural households). This may be because although there are no facilities
in the immediate community, it is easier in a city centre to travel to a community
where this is available.
Figure 7.26 Per cent of households dissatisfied with community services and facilities in their
neighbourhood.
Gathering
Camp South
Camp North
Neighborhood
Housing conditions
Work, business
opportunity
Cultural institutions
Shops, commerce
Public
transportation
Health services
Schools
0
208
20
40
60
80
100
Per cent
Chapter 8 Social Networks
Laurie Blome Jacobsen and Mary Deeb
8.1 Introduction
This chapter provides an overview of the characteristics of family networks among
Palestinian refugees living in camps and gatherings in Lebanon. Individuals and
households are linked to other family members, neighbours, friends and acquaintances. In chapter 2, we briefly looked into the family size and family reproduction
patterns. The term “social network” takes the household description one step further, by describing the wider web of family networks. These webs typically provide
individuals and households with social support and economic assistance, as well as
an enforced feeling of belonging, and hence constitute a basic element of living
conditions. The structure, extension and density of social networks, however, vary
between households. People are born within these networks, and extend them as
they grow older. They may be broken up or reshaped by migration or relocation.
Close Contacts Among Family Members
The description in this chapter covers a number of aspects of social networks, at
both the household and the individual levels. It starts with a general description of
family life, family networks and distances to other relatives. Most households form
nuclear families, and settle among relatives with whom there is frequent contact.
Almost every household has some relatives living nearby. They are typically settled
amongst the husband’s family and the male side of the extended family. Female
headed, elderly headed, mobile households and persons of a low socio-economic
disposition are more often isolated from extended kin, and have less frequent contact with them.
Turning to marriage patterns, the analysis reveals many marriages between related persons, but less so than has been found elsewhere in the region. Attitudes in
favour of cousin marriages and of women to choose their own spouse appear to be
becoming more liberal. The least liberal attitudes in this respect are observed among
men with either very low levels of education or men with higher education. Among
married persons forming nuclear households, 1 in 2 persons have the same geographic origins and family origins in Lebanon or Palestine as their spouse.
209
Finally, the analysis describes family network connections. A good majority of persons report that they exchange financial or non-financial help. Overall, family exchanges of help tend to be one-sided (exclusive giving or taking), while friendship
exchanges are mutual. Financial exchanges occur more frequently than non-financial, and are more often mutual than non-financial exchanges. The geographic location of the family and the age and gender of the household head, as well as the
geographic mobility of the family are factors that contribute to the increasing size
and diversity of family networks. These characteristics, in addition to education
levels, are also related to the tendency to prefer, or to practice, certain marriage
patterns within the kinship network.
8.2 Family Life and Extended Family Networks
We start the analysis by a description of the family itself and its networks. In addition to providing a broad and general picture of the family, it also establishes the
background for the subsequent analysis.
Few Live Alone
The predominant household form among refugees in camps and gatherings is nuclear families. Eight in 10 households are of this type, and half of these form nuclear families consisting of a couple with children under age 15. Few persons live alone,
and slightly less than have been found in the Lebanese population as a whole (5 per
cent of camp and gathering refugees compared to 7 per cent in Lebanon as a whole).
Camp and gathering refugees also live in extended family households more often
(15 per cent compared to 9 per cent in Lebanon) (UNDP 1997:63).
Table 8.1 Household types: per cent of refugee households in camps and gatherings (n=3,617).
Person living without family
Couple without children
5.3
5.9
Couple with youngest child above 14 years
11.4
Couple with youngest child 14 years or less
51.0
Single with youngest child above 14 years
6.7
Single with youngest child 14 years or less
4.1
Extended family
Total
210
15.5
100.0
A general stability in this type of family formation is observed across other background characteristics. Two exceptions, however, are households headed by females
and elderly persons. In these 2 groups of households there are both considerably more
persons forming loner households and slightly more forming extended family households.
Most Settle Near Family and Relatives
About 9 in 10 households report having some relatives nearby (within walking distance in the same neighbourhood). Furthermore, 1 in 2 households have 11 or more
relatives nearby. While the predominant pattern is for families to settle in areas with
kin nearby, this varies somewhat in terms of the predominate type of kin and whether
the kin is the husband’s or wife’s family.
Camp refugee households live away from relatives less often than gathering
households (10 per cent compared to 17 per cent). Male-headed households live
near family more often than female headed households, and households with young
heads live among relatives more often (95 per cent compared to roughly 85 per cent
for households with older heads). Surprisingly little difference (although some) exists
between households whose head has recently moved, and others (85 per cent have
relatives nearby compared to 89 per cent among others).
Settling among lineal relatives (grandparents, parents, siblings and adult children) is common - and the predominant pattern is to live near the husband’s rather
than the wife’s kin. Figure 8.2 shows the distribution of the husband and wife’s nearby
relations by type of relative. We see that siblings are the most common type of relative living nearby, followed by parents. Including adult children, 86 per cent of
Figure 8.1 Households with relatives nearby. Per cent of households (n=3,617).
Head age 60+
Head age 3539
Head age <35
Gathering
Camp South
Camp North
Female head
Male head
Elsewhere 5 years ago
Same place 5 years ago
80
85
Average
90
95
Per cent
211
Figure 8.2 Type of relatives of both spouses nearby. Per cent of households (n=3,239).
Grand-parents
Wife's relatives
Husband's relatives
Parents
Uncles/aunts father's side
Uncles/aunts mother's side
Brothers
Sisters
Cousins father's side
Cousins mother's side
0
20
40
60
80
100
Per cent
households have lineal relatives nearby, 58 per cent have both lineal (grandparents,
parents, children) and collateral (uncles, aunts, cousins) relatives nearby and 28 per
cent have only collateral relatives nearby (Figure 8.3).
A large proportion of households are surrounded by many relatives of different
types. Over half of the households report having “many” relatives nearby, defined
here as more than 10 relatives (Figure 8.4). Approximately 40 per cent report having “some” relatives nearby (1 to 10 persons). Having many relatives nearby is also
Figure 8.3 Categories of relatives nearby (n=2,833).
Lineals and collaterals
Lineals only
Collaterals only
No relatives
0
10
20
30
40
50
60
70
80
90
100
Per cent
Figure 8.4 Size of local family network. Per cent of households (n=3,617).
Many relatives nearby (11+)
Some relatives nearby (110)
No relatives nearby
0
212
10
20
30
40
50
60
70
80
90
100
Per cent
Figure 8.5 Per cent of households with complex and dense local family networks. Bars are difference from average of 37 per cent (n=3,617).
Tyre
Saida
Bequaa
Tripoli
Beirut
Elsewhere 5 years ago
Same place 5 years ago
Female head
Male head
Head age 60+
Head age 3559
Head age <35
Gathering
15
25
Camp
35
Average
45
55
Per cent
associated with having more types of relatives nearby - the amount of variation in
the set of relatives increases with the total number of relatives.
The variation in types and actual numbers of relatives can be considered as
measures of the complexity and density of the local household network. Comparing female headed, gathering located and mobile households with others, we have
earlier seen that the difference between those with any relatives nearby versus those
with no relatives nearby becomes more marked when we take into consideration the
size and complexity of the local family network. Considerably fewer households
living in gatherings, or having older or female heads have complex and dense networks than average (Figure 8.5). Geographical variations are also evident here, which
were not so pronounced when considering only the existence of relatives nearby.
Households residing in Beirut have complex and dense networks least often, and
households in Tripoli have complex and dense networks most often compared to
households in other Governorates.
8.3 Satisfaction with Neighbours,
Distance to Relatives and Friends
The LIPRIL asked the households about their satisfaction with access and proximity to relatives and friends, and their satisfaction with their neighbours. Most reported that they are satisfied with or find the distance to relatives acceptable (almost 80 per cent). In general, respondents report a higher level of satisfaction with
213
Figure 8.6 Satisfaction with distance to relatives and friends. Per cent of households.
Not relevant
Distance to friends
Distance to relatives
Very unsatisfactory
Rather unsatisfactory
Acceptable
Rather satisfactory
Very satisfactory
0
5
10
15
20
25
30
35
40
45
50 Per cent
the proximity of friends than of relatives. Few are dissatisfied with their neighbours,
as only 6 per cent report dissatisfaction.
Variations in the levels of dissatisfaction with regard to the proximity to relatives follow the density and complexity patterns of local household networks based
on headship and location. Thus, we observe higher levels of dissatisfaction in the
gatherings and among female headed and mobile households. Dissatisfaction is
greatest in Beirut, where we also find the least dense and complex networks, and lowest in Tyre, where we see the largest and most diverse family networks (Figure 8.7).
8.4 Marriage and the Family: Autonomy in
the Choice of a Spouse and Kinship Relation
Among Spouses
The choice of a marriage partner, either one’s own or on behalf of others, in many
ways determines the characteristics of family networks. That is to say, how closely
related by kinship and how homogeneous the extended family is in terms of geographical and social origins are both aspects that can influence the “connectedness”
and stability of the network. In this regard, marriages tend to be entered into between persons with very similar backgrounds. This includes marriages between related kin, which is found to be a present but declining practice. We will now take a
look at attitudes among individuals towards women having the ability to choose their
own spouse, preferences for kinship relations between potential spouses, actual levels of consanguineous marriage, and finally, other aspects of family and personal
origins that spouses often have in common.
214
Figure 8.7 Dissatisfaction with distance to relatives. Per cent of households. Bars are difference
from average of 21 per cent.
Tyre
Saida
Bequaa
Tripoli
Same place 5 years ago
Beirut
Elsewhere
5 years ago
Female head
Male head
Gathering
Camp
10
15
20 Average
25
30 Per cent
Supportive Attitudes Towards Women Choosing their
Own Spouse
Traditionally in the Middle East, social contact between unmarried men and women has been restricted and it is common that family members at least perform a
screening of possible marriage partners (Ibrahim 1995:154). Thus, although many
appear to support a girl’s choice in her marriage partner, this may not imply that
the woman is completely free to choose outside of a “pre-selected” group of acceptable candidates. Nevertheless, we do find that the majority of both men and women think their daughter should choose her husband herself, as opposed to it being
solely a family or parental decision. Not surprisingly, women are more supportive
than men in this regard, but not much more so. Some 85 per cent of women report
that the daughter should be free to choose, compared to 82 per cent among men.
More pronounced differences are observed among men and women when other
intervening factors, such as the person’s education, income and social network, are
introduced.
As shown in Figure 8.8, men and women’s attitudes towards autonomy in marriage choice vary by education level. Among women, increases in education are closely associated with increases in support for women’s autonomy in the choice of a
marriage partner. Men report more support at successively higher education levels
up to basic education, but successively lower levels of support with secondary and
higher education. A similar relationship can be seen among men’s attitudes and
household income. For example, 80 per cent of men in both the lowest and highest
215
Figure 8.8 Per cent of persons who think girls’ marriage is mostly her own choice by education
level (n=1,294).
Per cent
100
Women
90
Men
80
70
Elementary or less
Basic
Secondary
More than secondary
Did not attend
income groups support women’s autonomy in the choice of a husband, compared
to 87 per cent of men in the middle-high income group.
Geographic stability, and the complexity and density of family networks appear
to have greater impact among men than women in this regard. Men who have lived
elsewhere 5 years prior to the survey are less supportive of women’s marriage choice
(76 per cent) compared to 83 per cent of men who have been stable residents. Men
with no relatives nearby show less support than those with relatives nearby (80 per
cent compared to 83 per cent) and the support increases among those with more
numerous and more diverse local family networks. This may be the case because more
family nearby means there are more suitable marriage partners for the woman, allowing fathers to grant their daughters more choice in the matter. However, women with any relatives nearby at all, and with more diverse family networks, report
less support for marriage choice autonomy (to about the same average level as among
men) than women with none or fewer. An explanation for this pattern among women could be that the higher presence of family is instrumental in channelling traditional norms regarding marriage practices to women who otherwise might be freer
to develop their own opinions.
Majority Report no Preference for Relatedness of Child’s Spouse
to Family
Marriages among relatives have been reported to be the preferred type of marriage
in Middle Eastern societies. The ideal wife for a young man is the daughter of one
of his father’s brothers. Next in order of preference would be other first cousins. If
none of these types of relatives were available or suitable, then the young man would
be expected to choose from more distant relatives. This trend has been reported to
216
be declining and changing in major cities, but to be still quite predominant in villages
and among low-income groups in urban areas. Such endogamous marriages are
reported to produce several advantages for the parties: the dowries demanded of the
bridegroom’s kin tend to be smaller, such that the family resources are conserved,
and the bride need not go to her husband’s house as a stranger. Consanguinity could
also be considered to measure the extent to which a family follows social norms
encouraging marriage to relatives.
The LIPRIL results do not suggest there is widespread preference for intermarriage. The LIPRIL asked randomly selected individuals who they would prefer their
child(ren) to marry, even if they did not presently have children, and let respondents choose among a list of types of relatives and others. The majority answered that
they had no preference (64 per cent). Fifteen per cent prefer marriage within the
hamula (most of these prefer marriage to the father’s brother’s son), and 20 per cent
prefer marriage outside the hamula. The percentage of those with no preference is
rather consistent across gender, education and age groups, but the preferences among
those who report a preference vary among certain groups.
This is particularly the case with education level and age. As seen in Figure 8.9,
there is a sizeable drop in the percentage that prefers cousin marriage, when comparing those with no education and those with some education. This is even more
pronounced among men than women. Among men, 18 per cent of the uneducated prefer marriage to the father’s brother’s son compared to 11 per cent among men
with only elementary education. Overall, those who have never attended school are
4 times more likely to prefer cousin marriage than those with secondary education.
Age is also closely associated with preference for cousin marriage (Figure 8.10). Individuals aged 50 and above prefer cousin marriage about twice as often, and marriage outside the hamula half as often as other age groups. It is difficult, however,
to untangle the effects of education and age, as younger age groups have higher levFigure 8.9 Marriage preference for children. Per cent of persons aged 15 or over. First preference (n=3,316).
Fathers brothers child
Other inside hamula
Outside the hamula
No preference
All
More than secondary
Secondary
Basic
Elementary or less
Did not attend
0
20
40
60
80
100
Per cent
217
Figure 8.10 Per cent of persons preferring children marry outside hamula by age (n=3,316).
Per cent
50
Men
Women
40
30
20
10
0
15-19
20-29
30-49
50+
els of education. Camp refugees less often have a preference, but non-camp refugees more often prefer marriage outside the hamula (27 per cent compared to 18
per cent in camps).
In comparing preferences for marriage partners and actual types of marriage
partners, we find that more marriages are entered into between cousins than that
which the respondents report to prefer. Part of the reason for this may be that attitudes towards cousin marriage are changing.
The LIPRIL questioned women in the household about their relation to their
most recent husbands. Slightly more than a third of the marriages reported were
between persons related by kinship prior to marriage. As Table 8.2 shows, the data
lends support to the assertion that marriage to first cousins on the father’s side is
preferred among those with any preference. Among women who married a relative,
nearly 1 in 3 marriages were to the father’s brother’s son, while another 8 per cent
were to the father’s sister’s son. Overall, 20 per cent of marriages were between first
cousins.
Table 8.2 Relation to latest husband. Per cent of all marriages.
Mother's brother's son (Ibn khal)
2.7
Father's brother's son (Ibn amm)
9.4
Mother's brother's son & father's sister's son (Ibn khal and Ibn amma)
1.8
Mother's sister's son (Ibn khala)
2.2
Father's sister's son (Ibn amma)
2.7
Mother's sister's son & father's brother's son (Ibn khala and Ibn amm)
1.2
Same hamula, father's side
9.0
Same hamula, mother's side
3.8
No relation
Total
218
67.2
100.0
Figure 8.11 Relation to latest husband. Per cent of all marriages that are between relatives. Bars
are difference from average of 33 per cent (n=3,894).
Age 50+
Age 30-49
Age 20-29
Age 15-19
More than secondary school
Secondary school
Basic school
Elementary or less school
Saida
Complex, dense local network
20
Bequaa
Tripoli
Beirut
Head elsewhere five years ago
Per cent
Did not attend school
Tyre
30
Head same place 5 years ago
Not complex, dense local network
40
50
The age of the woman and her level of education are clearly associated with her
relation to her spouse, as shown in Figure 8.11. These results lend support to the
suggestion that actual marriage practice is changing among the refugee population
with less tendency for couples among the younger generations to practice endogamy. Geographic location also appears to be related to the tendency for intermarriage as we can see that it is much less common in Beirut than in Tyre for example.
Spouses Come from Same Social Groups and Places of Origin
Apart from marriage with a relative, spouses coming from the same social groups,
or originating from common geographic areas, can also serve to increase the homogeneity of the extended family network. We find both of these factors very much
present among marriage partners among the refugees. As seen in chapter 2, data was
collected regarding individuals’ place of birth, the person’s family’s place of origin
in Palestine or elsewhere, and the specific refugee status of the person (1948 refugee, expelled from Israel after 1948, 1967 refugee or internally displaced in Lebanon). This information is now grouped for husbands and wives in nuclear households (with the husband as the head) in order to match the marriage partners’ data.
A number of measures itemise the level to which the spouses have these aspects of
their background in common, and are summarised in Table 8.3.
Marriage partners often have common places of origin and very often have the
same refugee status. The latter point is not surprising, however, since the overwhelming majority of refugees in Lebanon are 1948 refugees (or descendants of 1948
219
Table 8.3 Common links between spouses: own place of origin, place of family origin and refugee status.
Percent of persons
(married heads and spouses)
Same place of origin
67.6
Same families' place of origin
65.5
Same refugee status
88.6
Either own & family origin same
38.1
Both own & family origin same
47.5
Own & family origin & refugee status same
47.2
refugees), and 93 per cent of the spouses with this background married persons who
were also 1948 refugees. Almost 1 in 2 married heads and spouses of heads were
born in the same place as their spouse, and their family comes from the same location as their spouse’s family in Palestine or Lebanon. Overall, 89 per cent of currently married spouses have the same refugee status, and more than half of these
persons also have both common origins and common family origins.
Spouses living in refugee camps more often have similar origins than those living in gatherings, and more often have both their own and family origins in common (50 per cent compared to 40 per cent). The largest group of spouses with all
common aspects of their background considered here (place of origin, family place
of origin and refugee status) is among older persons and those with no education.
Almost 70 per cent of spouses in the 50 years and over group have both their own
and their family’s origins in common compared to around 40 per cent for other age
groups. Twice as many spouses who never have attended school have a common
geographic origin with their partner, compared to spouses with high education.
Those without education also more often have both aspects of their background in
common than those with any level of education. However, similar to our findings
regarding intermarriage and attitudes towards intermarriage, the relationship between education and marriage among spouses with common origins demonstrates
a u-shaped pattern. That is to say that these types of marriages decrease with increasing education to a point, and then increase with increasing education. In fact, spouses
with more than secondary education more often tend to have common backgrounds
and more often to have aspects in common, than those with less education.
Finally, there are considerable geographic variations, which are most likely due
to migration patterns. Thus, we find that spouses living in Tyre have backgrounds
in common twice as often than those in Beirut. The difference in this case appears
to be related both to the persons’ having originated in Palestine and the diversity of
the persons’ families’ places of origin in Palestine. For example, in Tyre a larger per
cent of persons originate from Palestine or Tyre than the per cent of those in Beirut
220
Figure 8.12 Spouses with own and family origins and refugee status in common. Per cent of
married heads and spouses. Bars are difference from average of 47 per cent.
Head elsewhere five years ago
Head same place 5 years ago
Gathering
Camp
Aged 30-49
Aged 20-29
Aged 15-19
Saida
Beirut
High income
More than secondary school
Secondary
Basic
Less than elementary school
Tripoli
Aged 50+
Tyre
Bequaa
Low income
Did not
attend
Not complex, dense family network
Complex, dense family network
30
40
50
60
70
Per cent
who are born there or in Palestine. In addition, most of the families of the persons
living in Tyre come from only 2 locations in Palestine (Safad and Akka), while among
those living in Beirut we find the families’ places of origin to be much more geographically diverse.
Thus far we have primarily described the characteristics of social networks among
Palestinian refugees in Lebanon, including the size and diversity of the networks,
marriage patterns and the factors that appear to be associated with different types
of both the network as a whole and the marriage contracts between persons in them.
While this is an important aspect of any examination of social networks, the kind
of network in terms of size and diversity does not necessarily tell us about either the
connectedness experienced among its members, or how well the network serves the
interests of its members. One might assume that a large, diverse and historicallylinked family network would be more connected in this sense than other types, but
this need not be the case. Furthermore, even if one determines that a network is “close
knit” this does not necessarily mean that the network is more useful to its members
than one that is not. In the next section, then, we examine further the social networks by looking at exchanges of help, visitation patterns, factors influencing the
network’s connectedness, and how different types of networks and levels of connectedness are related to well-being.
221
8.5 Connectedness of Family Networks
Any measure of the connectedness of social networks is subjective; in the sense that
connectedness is ultimately based on a large variety of choices of individuals and
families, and what the persons themselves experience or wish as connected relationships. We will now examine patterns of relations in relation to a set of structural
factors that may limit and shape these choices. In particular, the LIPRIL provides
information that allows us to examine 2 aspects of these patterns of relations – the
type of exchanges that have taken place and the frequency of contact between family members. These aspects of relations will first be described and then the relative
importance of these and other factors in determining the level of connectedness is
tested by statistical analysis.
Frequent Giving and Receiving of Help from Family and Friends
Overall, 60 per cent of individuals have engaged in some kind of exchange of help
during the 2 weeks prior to the survey for non-financial help, and during the 12
months prior to the survey for financial help. As shown in Figure 8.13, help is more
often given and received among family and relatives, than among friends and neighbours. Among family and relatives, financial help is more common than non-financial help (42 per cent compared to 33 per cent). Non-financial help is more often
given than received or exchanged (both given and received), while financial help is
roughly equally distributed among givers, takers and exchangers. In comparing the
2 types of help, we see that there are more takers and exchangers of financial help,
and more givers of non-financial help. The same patterns of giving and taking can
be seen among friends and neighbours.
Table 8.4 describes in more detail the patterns of giving and receiving of both
financial and non-financial help. Those who are exclusive givers mostly give help
Figure 8.13 Givers, takers and exchangers of help (n=3,545).
Giver
Taker
40
60
Giver and taker
Non-financial: family, relatives
Financial: family, relatives
Non-financial: friends, neighbours
Financial: friends, neighbours
Any help
0
222
20
80
100
Per cent
Table 8.4 Givers and receivers of help by categories of others. Per cent of person (n=3,595).
Receivers of help from
No help
Only relatives Relatives & friends Only friends
Total
Givers of help to
No help
39
10
1
1
52
Only relatives
12
9
1
1
23
17
Relatives & friends
4
4
8
2
Only friends
3
1
1
2
8
59
24
11
5
100
Total
to only their relatives (12 per cent of the total). Those who are exclusive takers also
mostly get help only from their relatives (10 per cent of the total). Those who give
help to and receive help from either both relatives and friends, or only friends, are
more often both givers and receivers of help.
One might conclude, then, that among Palestinian refugees in Lebanon family
networks are characterised by “generalised” exchanges, i.e. help that is not mutually
reciprocated. In contrast, friendships are characterised by more “restricted” exchanges
based on reciprocity. The concepts of generalised and restricted exchanges used by
social exchange theorists (Blau 1964) have also been used to show how they have
differing effects on the solidarity of groups (Ekeh 1974). It is theorised that networks characterised by generalised exchanges are more connected and stable because
“in the hiatus between the giving and the reciprocation of an item, obligation, trust
and co-operation are created and extended among exchangers” (Uehara 1990:524).
In addition to asking whether or not the respondent gave non-financial help
during the last 2 weeks, the LIPRIL survey also questioned respondents about what
specific kind of support was given. The types of help included 13 different items
including such things as household help, working in family businesses and assistance with the planning of weddings and other gatherings. Detailed results for each
item are shown in Table 8.5. Household help is the most common type of nonfinancial assistance given and received for both family and friends, and the levels
of giving and receiving this type of support are more equal than for productive
and occasional help.
223
Table 8.5 Types of help given and received last 2 weeks by categories of others. Per cent of
persons (n=3,703).
Types of support:
Help in 1 or more
household activities
Help given or received from
Family and relatives
Friends, neighbours
Given
Received
Given
Received
15.0
11.5
7.2
4.3
Shopping
3.9
3.2
1.7
0.5
Child care
3.8
2.1
0.7
0.2
Food preparation
3.9
4.4
1.5
1.3
Other housework
8.8
8.5
2.6
2.5
School work, studies
1.1
0.4
2.4
1.0
Help in 1 or more
productive activities
6.5
2.1
4.9
1.9
Transportation
1.8
0.9
1.0
0.4
Family enterprise(non-agricultural)
2.1
0.3
0.7
0.5
Fields or hakura
0.1
0.1
0.1
*
House-building or repair
2.2
0.8
2.4
0.8
Help in 1 or more
occasional activities
1.5
0.4
1.7
0.5
Post-natal care
0.5
0.2
0.2
0.1
Wedding arrangement
0.4
0.1
0.9
0.2
Funeral arrangement
0.7
0.2
0.7
0.2
28.3
25.8
14.0
10.5
3.6
2.2
3.7
2.3
Financial help
Other help
Less Family Visits than Elsewhere in the Region
The LIPRIL questioned randomly selected individuals about the frequency of visits
with different kinds of relatives over the 2 weeks preceding the survey. Overall,
about 50 per cent of persons reported visits with a relative over the 2-week period,
most often 1 to 5 visits (30 per cent). Some 20 per cent reported more than 5 or
daily visits (Figure 8.14). This level of interaction with relatives is much smaller than
observed in an almost identical survey in Jordan, where 85 per cent of persons had
at least 1 visit and 25 per cent had daily visits (Hanssen-Bauer et al 1998:276). As
seen in the Jordan study, individuals visit family on the father’s side more often than
the mother’s side, for both spouses’ families. This is probably in part due to the tendency for settlement among the male’s side of the family. Among married persons,
there is a tendency to visit one’s own family more frequently than one’s spouse’s
family. Thirty-five per cent report frequent visits (more than 5 or daily) with their
own family and 20 per cent report frequent visits with their spouse’s family. Men
224
Figure 8.14 Distribution of number of visits with family last two weeks.
Daily
More than 5
1 to 5
No visits
Not relevant
Father's side
Spouse's father's side
Mother's side
Spouse's mother's side
Total visits
0
20
40
60
80
100
Per cent
visit their own family more frequently than women, and women visit their spouse’s
family more frequently than men.
In order to further analyse visitation patterns of men and women with their own
and their spouse’s family, a number of levels of connectedness were defined based
on the frequency of visits. The frequency of visits can be considered an indication
of the connectedness of the family since, apart from giving an indication that the
visiting is to the benefit of one or the other party, more contact between family
members strengthens the collective ability of the extended family to impose its norms
of obligations and social control on its members, thereby further strengthening the
overall connectedness of the network itself.
Defining a strong tie to be the case where there were 5 or more visits, or daily
visits over the last 2 weeks, there are a number of possible combinations, including:
(1) strong ties to both one’s own and one’s spouse’s family, (2) strong ties to one’s
own family only, (3) strong ties to one’s spouse’s family only, (4) no strong ties to
either family, and (5) for unmarried persons, the presence of strong ties to their own
family.
As shown in Figure 8.15, over half of the respondents fall into the category
without strong ties to either their own or their spouse’s family, or were single perFigure 8.15 Type of tie with own and spouse's family. Per cent of persons.
Not strong either
Strong both
Strong own only
Strong spouse's only
Unmarried, not strong own
Unmarried, strong own
0
10
20
30
40
50
Per cent
225
sons without strong ties to their own family (56 per cent in total). Among married persons, slightly more than half had no strong ties, and 1 in 3 persons showed
a strong tie to their own family, roughly proportionally divided between those with
a strong tie only to their own family, and those with a strong tie to both (17 per
cent).
With regard to currently married persons, age, education and the existence of
complex and dense social networks nearby appear to be associated with stronger
family ties (Figure 8.16). Wives have both a strong tie to family and a strong tie only
to the spouse’s family more often than their husbands. Overall, older persons have
strong ties less often, and particularly so with only the spouse’s family. For example, 23 per cent of those aged 20-29 have a strong tie to the spouse’s family only
compared to 15 per cent of those in the 30-49 age groups and 10 per cent of those
aged 50 or over. The high percentage among the youngest age group is partially
explained by the fact that three-quarters of the married persons in the 20–29 age
group are females, who are much more likely to settle in the vicinity of their husband’s family than vice versa.
Higher levels of education are associated with having strong ties up to basic
education, then the frequency of strong ties decreases with secondary and higher
Figure 8.16 Distribution of strenght of family ties by background variables. Per cent of currently
married persons.
Strong spouse's only
Strong both
Not strong either
Strong own only
Head
Spouse
Age
20-29 yrs
Education
30-49 yrs
50+ yrs
Did not attend
Elementary or less
Basic
Secondary
More than secondary
Network
Not complex and dense
Complex & dense network
Migration
Head elsewhere 5 yrs ago
Head same place 5 yrs ago
All
0
226
20
40
60
80
100 Per cent
education. Married persons with secondary education have a strong tie to the
spouse’s family only almost twice as often as average. Persons with more than secondary education have strong ties to both of the marriage partners’ families most
often (25 per cent compared to 18 per cent average), and to the spouse’s family
only least often. This difference between those with secondary and more than
secondary education is partly due to the differing gender ratios between the 2
education levels. The majority of those with just secondary education are female
(68 per cent), while the majority of those with more than secondary education
are male (73 per cent), and as was mentioned above, wives more often have a strong
tie to the husband’s family only. In addition, it was found that the likelihood of
having complex and dense local networks generally increases with education. Individuals with higher education most often have complex and dense local family
networks (42 per cent), which helps to explain the large number of persons with
close ties to both partners’ families among those with high education.
Among unmarried persons, we find fewer close ties with increasing age between
those aged 15-49, but older unmarried persons (aged 50 and over) tend to keep close
ties with their own family. Unmarried persons also show a similar pattern in the
relationship between education and strong ties to family as married individuals.
Those with complex and dense local family networks have close ties to family more
often, but geographic stability has little impact. The association between complex
and dense social networks and strong ties appears to be larger among married persons, and although present, less pronounced among unmarried persons.
8.6 Determinants of Strong Family Ties
The preceding sections have described a number of patterns between types of network exchanges of financial and non-financial help and types of family ties that
appear to be associated with certain socio-economic and personal characteristics of
the individual, as well as with characteristics of the network itself (size, location and
diversity). However, in order to sort out the effects of such factors on the connectedness of the network (defined here as having frequent visitations), more thorough
analysis is needed. Multinomial logistic regression analysis can be used to explain
the probability of persons having one out of a number of types of ties, given a set of
variables describing the person. This is conducted for married persons who have a
number of possible ties given their marriage status.
The analysis for married persons includes testing the association between age,
gender, education, income, presence of financial ties with family, size and variety
of the family social network, presence of common origins with spouse, presence of
227
non-mutual exchanges of help, geographic stability of the household, and geographic location on the one hand, and the type of social ties the individual has (strong
own, strong spouse, strong both, weak both) on the other hand. It is seen (Appendix 8.1) that such characteristics do not go far in explaining a person falling
into the category of having a strong tie with their own family (as opposed to no
strong ties), but better explain a person having strong ties to the spouse’s family,
and show strong relationships in many areas to a person having strong ties to both
one’s own and one’s spouse’s family.
The analysis thus confirms a number of relationships that were indicated by
examining the data descriptively. First, geographic location in Beirut is a significant
factor in decreasing the likelihood of both men and women having close ties in most
of the family tie types. Taking residence in Tyre as the basis, the probability of having strong ties to one’s own family (versus no strong ties) among women living in
Beirut is half that of those residing in Tyre. Among both men and women living in
Beirut, the probability of having strong ties to the spouse’s family (versus no strong
ties) is 57 per cent less, and the probability of having strong ties to both families is
57 per cent less for men. This can be interpreted to indicate that the combination
of urban location and more diversified family networks (having more diverse backgrounds); two of the distinguishing factors among households living in Beirut, are
also reflected in less connected social networks.
Also confirmed, is the observed differing effects of education on the strength of
family ties between men and women, the specific relationship among men with
secondary education tending to have strong ties to spouse’s family, and finally, men
with higher education tending to have strong ties to both. In the first case, we see a
significant relationship between men with secondary education and the probability of having a strong tie to the spouse’s family, but uncertain effects among women. Thus, men with secondary education are almost 4 times as likely to have such a
family tie as those with no education, while the difference for other education levels is twice as high for higher and basic education. Men with higher education are
3.4 times more likely to have strong ties to both families than those with no education. Once again, the results for women were smaller and uncertain.
Age was a particularly important factor in the probability of women having a
strong tie to both families, and to a lesser extent, only to the spouse’s family. Women aged 15-19 are 4 times more likely to have strong ties to both families than those
aged 50 and over, those aged 20-29 are 2.5 times more likely and those aged 30-49
are twice as likely. Young women (aged 20-29) are almost 3.5 times more likely to
have a strong tie to the spouse’s family only, than older women (aged 50 or over).
Age is not decisive for men having strong ties to both families, but men aged 30-49
have double the probability of strong ties with their wives’ families than those aged
50 and over.
228
Income is observed to be associated with men having strong ties to both families.
Men in the middle and high-middle income groups have twice the probability of
such ties compared with men in the highest income categories, while the lower
income groups have about the same probability as the highest.
Gender is an important factor in the probability of a person having only a strong
tie to the spouse’s family, in which case we see that men are 40 per cent less likely to
have this type of tie than women.
A number of characteristics describing the network itself that were included in
the analysis, were assumed to increase the likelihood of strong ties. Persons who had
some sort of financial tie (in the form of giving or receiving financial help) to the
family network were predicted to have stronger ties for the reason that economic
ties between members are expected to increase network connectedness (Bott
1971:102). This is not found to be relevant for having a strong tie to either or both
families. Neither is the level of complexity and density of the network found to be
a factor contributing to strong ties.
However, both the degree of common origins between spouses and the type of
family exchanges occurring during the last 2 weeks are significant variables in a
number of cases. That the spouses have common origins is the strongest predictor
of having strong ties to both families, but not a factor for having other strong ties
to only one or the other family. Persons who have both their own and their family’s
origins in common with their spouse are almost 4 times as likely to have strong ties
to both families than those with no common origins. Those with only one or the
other origin in common have 2.4 times the probability.
As was discussed above, generalised exchanges, or those not based on mutual
reciprocity, are predicted to be characteristic in strong networks for the reason that
such one-sided exchanges tend to either foster, or be the result of, norms of obligation and trust. However, it is found that the relationship between “generalised” or
“restricted” exchanges and strong ties is the reverse of what is expected. This might
well be because these terms are not wholly accurate in this case due to data limitations - we are not able to match the specific giver and receiver of help, but know
only that an exchange has taken place between the individual and “the family”,
whether the family reciprocated, gave or received help, but not the individuals involved. Therefore, where a person is a family “exchanger” (both giving and receiving help) it does not necessarily mean that the exchanges are restricted, but that they
may be parts of generalised exchanges from different persons within the family.
Overall, some exchange increases the probability of having strong ties with one’s own
family and strong ties with both families, but those who both receive and give help
to family have higher probabilities, not lower probabilities for such strong ties than
those who have one-sided exchanges with family. However, this is not equally the
case for men and women. For women, exchanges have little and uncertain effects
229
with regard to any type of strong tie. Among men, those with mutual exchanges
have 2.4 times the probability of a strong tie with their own family (no effect for
non-mutual exchanges compared to no exchanges), and over 3 times the probability of strong ties with both families. Men with non-mutual exchanges also have higher
probabilities for strong ties to both families than those with no exchanges, but not
as high, at two times the probability.
Having described factors contributing to the connectedness of family networks
we finally turn to the “usefulness” of such networks by looking at the relationship
between a person’s self-assessment of well-being and the type and strength of family networks he has.
8.7 Social Networks and Well-being
The LIPRIL includes questions regarding the individual’s overall outlook on life as
a measure of well-being among randomly selected household members. They were
asked about the extent to which they agreed or disagreed with a series of positive
statements about life in the past and present. The series of answer categories are
compiled into an additive index.1 Additionally, a logistic regression analysis is conducted to isolate the factors that are most important in the level of satisfaction of
life. The characteristic analysed is having or not having an above average score on
the life satisfaction index. A number of models are used, including all cases, only
married women, only married men, only single women and only single men (see
Appendix 8.2). The results, similar to those for multinomial logistic regression, show
the odds ratios (Exp(B)) for the person having a higher than average well-being score
Figure 8.17 Mean predicted probability for high well-being by exchanges of help with family.
Unmarried persons aged 15 and over (n=1,037).
Women
Men
No exchange with family
Mutual exchange of help with family
0
1
0.1
0.2
0.3
0.4
0.5
Mean
The life satisfaction question developed by Diener (see Pavot and Diener 1993) asked about levels
of disagreement or agreement with statements including: “my life is close to the ideal”; “conditions
of my life are excellent”; “I am satisfied with my life”; “I have got the important things I want in my
life”; and “I would change almost nothing if I could live my life over”. The last statement was not
included in the index, as it did not correlate with the other statements.
230
compared to not having this result, relative to the reference category for each variable (having an odds ratio equal to 1).
We will not go into detail regarding all the determinants of above average wellbeing, which are namely age, health, and income; but will focus on results pertaining to the social network variables. However, the importance of marriage to
well-being should be noted. The odds ratio of married persons having above average well-being is almost twice that of those who are single. It is interesting that
among married men and women, those who are under age 50 have half the odds
ratio of high well-being compared to older persons, while among single persons
the youngest age group has double the odds ratio of high well-being compared to
older persons.
Apart from the impact of marriage, overall, the results lend weight to the
hypothesis that the type of interaction one has with family influences the person’s
general feelings of well-being. However, this is mostly limited to the type of network exchange the person has with family. The strength of ties to family and the
size of family networks were not found to have an overall relationship to well-being,
but results vary across different gender and marital groups. Thus, married persons
(either male or female) do not show much benefit from exchanges with family, but
unmarried persons (both male and female) do appear to benefit from such exchanges.
As shown in Figure 8.17, among those who have both given help to and received
help from family (either financial or non-financial), the mean probability predicted by the model of having higher than average well-being is over twice that of those
who have had no exchange with family during the last 2 weeks.
Among married women, none of the social network indicators are related to wellbeing. Among married men, we find that although the type of exchange with family is not a factor, the number of relatives nearby and the strength of ties to families
do appear to be related to well-being. Thus, those with no relatives nearby have half
the mean predicted probability of high well-being than those with many relatives
nearby, and those with strong ties to their own families have a 70 per cent higher
mean predicted probability of having above average well-being than those with
only weak ties.
Figure 8.18 Mean predicted probability for high well-being by strength of ties to family. Married
persons aged 15 years and over.
Weak both
Strong both
Strong own only
Strong spouse's only
0
0.1
0.2
0.3
Mean
231
232
-.133
-.006
.007
.258
.244
.732
SPOUSE COMMON ORIGIN (vs. none)
Both own and family common
Either own or family common
FINANCIAL TIE WITH FAMILY (vs. no tie)
COMPLEX, DENSE NETWORK (vs. not)
FAMILY EXCHANGE OF HELP
(vs. no exchange)
Non-mutual
Mutual
*p<.05 **p<.01
.008
SEX MALE (vs. female)
<2,401
2,401-3,800
3,801-5,400
5,401-8,400
-.142
-.228
.106
-.143
.669
.237
.191
.001
.275
.245
INCOME (vs. >8,400 ('000 LL))
.226
.146
Basic
AGE (vs. 50+)
15-19
20-29
30-49
.214
.249
.145
.206
.198
.196
.153
.224
.236
.222
.228
.353
.352
.324
.286
.242
.217
.381
.199
Secondary
-1.870
-.358
.154
.228
Model 1 All
SE
Higher
GOVERNORATE (vs. Tyre)
Beirut
Tripoli
Bequaa
Saida
EDUCATION (vs. none)
B
1.276
2.080*
1.294
1.073
.876
.936
1.089
.868
.796
1.112
.866
.994
1.317
1.278
1.157
1.422
1.331
.699
1.167
1.256
1.205
Exp(B)
B
…
1.513
2.429*
1.312
1.210
.866
1.061
1.063
.960
1.495
.957
1.345
1.099
.843
.884
1.034
.946
1.607
1.286
1.508
Model 2 Men
SE
Exp(B)
B
1.011
1.815
1.299
.944
.953
.835
.784
.733
.880
.827
1.145
1.378
1.537
1.364
1.985
1.551
.503*
.844
1.272
.967
Model 3 Women
SE
Exp(B)
Table A8.1a Strong tie with own family (vs. weak to both). Currently married individuals 15 years and older
Appendix 8.1 Multinomial logistic regression on
family network ties
233
1.148
.838
2.529**
1.226
Secondary
Basic
1.759**
30-49
1.275
COMPLEX, DENSE NETWORK (vs. not)
*p<.05 **p<.01
Non-mutual
Mutual
1.080
1.478
1.228
FINANCIAL TIE WITH FAMILY (vs. no tie)
FAMILY EXCHANGE OF HELP (vs. no exchange)
1.357
1.299
.608**
SPOUSE COMMON ORIGIN (vs. none)
Both own and family common
Either own or family common
SEX MALE (vs. female)
<2401
2,401-3,800
3,801-5,400
5,401-8,400
1.190
1.335
1.097
1.430
2.742**
20-29
INCOME (vs. >8400 ('000 LL))
2.591
15-19
AGE (vs. 50+)
1.485
Higher
EDUCATION (vs. none)
Saida
.567
.963
Bequaa
1.144
1.013
1.560
1.588
.943
1.156
.689
.964
.674
.875
1.978*
2.109
2.954
1.845
3.936*
1.752
.963
.797**
.456*
Model 2 Men
SE
Exp(B)
.443
B
Tripoli
Model 1 All
SE
Exp(B)
Beirut
GOVERNORATE (vs. Tyre)
B
B
Table A8.1b Strong tie with spouse’s family (vs. weak to both). Currently married individuals 15 years and older
.877
1.598
1.071
1.060
1.737
1.413
1.602
1.583
1.238
1.777
1.793
3.347**
1.104
2.073
1.371
.715
1.202
.689
.425**
Model 3 Women
SE
Exp(B)
234
-.370**
-.695
.648
Bequaa
Saida
1.582
1.617*
Secondary
Basic
1.285
30-49
1.181
1.216
FINANCIAL TIE WITH FAMILY (vs. no tie)
COMPLEX, DENSE NETWORK (vs. not)
*p<.05 **p<.01
Non-mutual
Mutual
1.274
2.171**
3.267**
2.432**
SPOUSE COMMON ORIGIN (vs. none)
Both own and family common
Either own or family common
FAMILY EXCHANGE OF HELP (vs. no exchange)
1.056
SEX MALE (vs. female)
<2401
2,401-3,800
3,801-5,400
5,401-8,400
1.149
1.208
1.176
1.365
1.706*
20-29
INCOME (vs. >8400 ('000 LL))
2.813*
15-19
AGE (vs. 50+)
2.626**
Higher
EDUCATION (vs. none)
-.525**
Tripoli
Model 1 All
SE
Exp(B)
Beirut
GOVERNORATE (vs. Tyre)
B
B
2.128**
3.341**
1.309
.792
3.638**
2.665**
1.384
1.258
2.004*
2.352**
.988
1.470
…
1.970
2.614
3.406**
.457
.699
.367**
.443**
Model 2 Men
SE
Exp(B)
Table A8.1c Strong tie with both families (vs. weak to both). Currently married individuals 15 years and older
B
.813
1.574
1.060
1.605
3.888**
2.562**
1.119
1.155
.697
.860
2.033*
2.590**
4.005**
1.272
.797
1.942
.919
.740
.401**
.655
Model 3 Women
SE
Exp(B)
Appendix 8.2 Logistic regression on well-being
outcomes
Table A8.2a Individuals 15 years and older
Model 1
All
Odds ratio
Model 2
Unmarried
men
Odds ratio
Model 3
Unmarried
women
Odds ratio
Model 4
Married
men
Odds ratio
Model 5
Married
women
Odds ratio
INCOME (vs. >8,400 ('000 LL))
<2,401
2,410-3,800
3,801-5,400
5,401-8,400
AGE (vs. 50 yrs+/vs. 30-49 for
single men)
15-19
.620**
.467**
.567**
.6535**
.997
3.34
2.54
20-29
30-49
MALE (vs. female)
MARRIAGE STATUS (vs.
single, divorced)
Married
.619**
.538
.595**
1.62
.801
1.689
.632
Widowed
.159*
.295*
.514
.976
.755
.233**
.382*
.428*
.779
.518
.755
.805
…
.590*
.502**
.566*
.599*
.463
.467*
.431**
.434**
1.965**
1.297
EDUCATION (vs. none)
Secondary or more
Basic
Less than basic
SELF ASSESSED HEALTH (vs.
very poor)
Very good
Good
O.K.
Poor
NUMBER OF RELATIVES
NEARBY (vs. many
None
Some
TYPE OF FAMILY EXCHANGE
(vs. none)
Both give & take
Giver
Taker
TIES TO FAMILY (vs. all weak)
Strong to own
Strong to spouse's
Strong to both
N
-2 log likelihood
Model Chi-square
.955
.163*
.641
1.55
1.60
.929
.8499
.367
.154*
.875
.922
.458
1.19
1.50
1.01
7.615**
5.911**
3.615**
1.479
19.711
14.912
9.024
7.525
.757
.879
1.313
1.689
.730
.792
1.607**
1.350*
.930
2.183*
2.204*
.213
2.419**
1.329
.540
.680
3613
2857.1
224.9
458
432.8
60.013
61.49
46.62
53.94
32.42
1.030
579
399.5
45.10
22.09**
18.08**
13.68*
5.71*
.482*
.829
1.275
1.232
.609
1.749*
.871
1.46
740
704
70.8
10.201**
8.151**
3.332
1.183
.655
.867
1.169
1.226
1.292
.821
.953
1.292
997
888
89.35
*p<.05 **p<.01
235
236
Chapter 9 Social Participation
Guri Tyldum
9.1 Introduction
In all societies some groups stand out as more active in public life than others. Groups
with little education or experience from activities in the public sphere (for instance
through the workplace) are often less involved in political activities. The degree of
participation is also often related to the degree of involvement and integration of
the individual in society; persons are less likely to be involved in local or national
politics if they do not feel a part of either the local community or the wider society.
Finally, a low level of participation can result from a feeling of low returns from
personal involvement; people are unlikely to become involved in politics if they think
the probability of their influencing the outcome of events is low (Dahl 1984).
Most of the Palestinian refugee population in Lebanon have no citizenship or
political rights, giving them little motivation to participate in the polity at large. As
we saw in chapter 4, the educational level among the Palestinian refugees in camps
and gatherings is low compared to the Lebanese population, and as presented in
chapter 5, a number of positions in the bureaucracy are not available to them, thus
excluding them from some of the most important resources for active participation
– such as knowledge and experience for dealings with officialdom. Difficulties in
obtaining travel documents often put restrictions on their freedom of movement,
and consequently social participation is to some degree limited to the local community.
In this chapter, we look at several different aspects of social participation: news
consumption, organisational memberships and restrictions on freedom of movement
for women. We also investigate some attitudinal questions, on female participation
in the public sphere and influences from the western world. The information is
generated from questions posed to randomly selected individuals among household
members aged 15 and over.
Palestinians in camps and gatherings are less likely to follow news media than
the Lebanese population at large, although media attention is somewhat higher than
among the Palestinian refugees in Jordan. TV is by far the most commonly utilised
news medium.
237
Not surprisingly, we find that education and gender are the most important factors
explaining variation in social participation among Palestinians in camps and gatherings in Lebanon: Men and persons with secondary or higher education are more
active both with regard to news consumption and organisational memberships.
Persons living in the more affluent households are more likely to follow the news,
while unmarried persons, both women and men, are more likely to be active in social
organisations. However, unmarried women have stronger restrictions on their freedom of movement, independent of age.
Age is one of the main factors influencing people’s attitudes: The younger generation is more negative to women’s rights to participate in society, and young men
are more likely to approve of violence against women. With regard to attitudes to
influences from Western countries, the younger generation is more positive than the
older generation.
9.2 News Consumption
News Consumption Highest among Men and
Those with Higher Education
Political initiative and participation require access to information, and in particular access to updated news on social and political developments in the local community and in the polity in general. Such information is first and foremost available through modern mass media. The LIPRIL asked respondents whether they had
followed any news transmissions on the radio, on TV (foreign or Lebanese) or in
the newspaper during the day prior to the interview (Figure 9.1).
On average, 60 per cent of the population receive news from at least one of the
three media sources each day, with the most significant differences appearing between men (71 per cent) and women (51 per cent). As expected, news consumption is the highest among persons with secondary or higher education; 86 per cent
of men and 72 per cent of women in this group read, watch or listen to the news.
Persons aged 30-44 follow the news more often than both older and younger age
groups. Persons from poor households, and in particular women in these households,
constitute the least informed group. Among these, only 41 per cent of the women
and 60 per cent of the men watched or listened to the news.
These pair wise comparisons describe the situation for various singular groups,
but tell us little about the mechanisms that produce low or high degrees of news
consumption. Women and older persons have below average education, and persons with high income often have higher education than those with low income.
238
Figure 9.1 Persons who followed news from at least one information-source (radio, TV, newspaper) the day prior to the interview, by gender, age, education and income. Per cent of population aged 15 and over (n=3,604). Bars show the differences from the overall average of 60
per cent.
Female
Male
45 and above
30-44
Below 30
Higher education
Elementary education or less
Fifth income quintile (richest 20%)
First income quintile (poorest 20%)
30
40
50
60
70
80
90
100
Per cent
To identify the factors that have the strongest impact on news consumption we have
conducted a logistic regression analysis. The results are presented in Table 9.1.
Table 9.1 News consumption: watched, read or listened to the news from at least one news
source on the day prior to the interview. Logistic regression (n=3,383).
Secondary or higher education
B
Odds (exp b)
0.97*
2.63*
Fifth income quintile (richest 20% of the population)
0.44*
1.55*
Men
0.80*
2.22*
0.31*
1.36*
Middle-aged (aged between 30-44)
Constant
-0.21
* Significant at a 0.05 level.
Education, income, gender and age all play a significant role in explaining variation in news consumption. The most important factor is the education level of the
person - the probability of following the news are 2.63 times higher for persons
with secondary or higher education than for persons with intermediate or less. This
means that while 52 per cent of middle-aged women with only elementary or intermediate education can be expected to follow the news each day, this increases
to 74 per cent for women with secondary or higher education, when other characteristics are kept constant or “controlled for”. In addition, gender has an independent effect, as men are predicted to follow the news more often than women,
regardless of differences in education level (odds are 2.22 times higher for men).
Among middle-aged men with higher education 86 per cent can be expected to
follow the news. Income and age have a weaker, although significant, effect on
239
news consumption. Young, as well as older women from medium or low income
households, with elementary education or less, form the group with the lowest news
consumption, as only 44 per cent are predicted to follow the news each day. The
most well-informed group are middle-aged men with secondary or higher education, living in high-income households. Of these, 91 per cent can be expected to
follow the news each day.
News Consumption is High Compared to Camps in Jordan
Is the level of news consumption low among the Palestinian population in Lebanon? Fafo conducted a comparable survey in Jordan in 1996 (Hanssen-Bauer et al.
1998). News consumption there is significantly higher, both among refugees and
non-refugees: on average, 77 per cent of the Jordanian population received news from
at least one source. Jordanian gender differences are relatively small as well, with only
a ten percentage-point difference between men (82 per cent) and women (72 per
cent), compared to more than twenty percentage points among Palestinians in Lebanon. However, among the male Palestinian camp population in Jordan, news consumption is lower than in the Lebanese camps. In camps in Jordan, 64 per cent of
the men, and 51 per cent of the women watched, read or listened to news from at
least one source on the day prior to the interview (Figure 9.2).
Figure 9.2 Persons who read, watched or listened to the news from at least one news source
on the day prior to the interview, by gender. Per cent of population in camps and gatherings
in Lebanon, camp population in Jordan and the Palestinian refugee population in Jordan in
general.
Camp population in
Lebanon
Women
Men
Camp population in
Jordan
Palestinian refugee
population in Jordan
0
20
40
60
80
100
Per cent
TV by Far the Most Common Media for News Access
Gender differences are even more apparent when we look at the number and types
of news sources used (Figure 9.3). Only 12 per cent of the women receive news from
other sources than the TV, compared to 34 per cent of the men. One in three men
receive news from more than one source, compared to less than one in ten women.
Newspaper reading and watching of foreign TV channels are both highly dependent on formal education, while radio listening is somewhat more common among
the older generations.
240
Figure 9.3 Persons who read newspapers, listened to news on the radio or watched the TV news
on the day prior to the interview by gender, age and education. Per cent of population aged
15 and over (n=3,604)
Higher education
Elementary
education or less
Foreign TV
Newspapers
Radio
Tv news
45 and above
30-44
Below 30
Female
Male
0
20
40
60
80
100 Per cent
9.3 Participation in Social Organisations
The LIPRIL respondents were asked about memberships in social organisations
and clubs. This section presents the main results.
Low Level of Organisational Membership
The level of organisational membership is surprisingly low – on average, 6 per cent
of adults aged 15 and older claim to be members of some type of organisation.
As Figure 9.4 illustrates, there are large variations in organisational membership
rates between social groups. Membership is clearly most common among persons
with secondary or higher education, and men are members 4 times as often as women. The affluent segment of the population participates more often than the poor,
unmarried persons more often than the married and younger age groups more often than the older.
If we look for explanations of organisational membership in a logistic regression (Table 9.2), we find that being male is the most important factor influencing participation, and there appears to be no effect on organisational memberships of being young (odds ratio 0.99). However, the mechanisms influencing
organisational memberships are not the same for men and women. When regressions are run separately for the two sexes, age turns out to have an effect on membership rates. While there is a positive effect of being young for men, being young
has a negative effect for women: while 2 per cent of married women below 30 (with
higher education) are predicted to be member of at least 1 organisation, this is
241
Figure 9.4 Members of social organisations, by gender, age, education, income and marital
status. Per cent of population aged 15 and over. Bars show the differences from the overall
average of 6.3 per cent (n=3,358).
Sex
Age groups
Male
Female
Below 30
30-44
45 and above
Education
Elementary education or less
Higher education
Household income
Lowest income quintile
Highest income quintile
Marital status
Married or have been married
Nerver married
Region
Camp North
Camp South
Non camp
0
2
4
6
8
10
12
14
16
18
Per cent
Table 9.2 Members of at least one social organisation. Logistic regression. Population aged 15
and over (n=3,368).
All
B
Odds
(exp b)
B
Men
Odds
(exp b)
Man
1.22*
3.40
Fifth income quintile (richest 20%
of the population)
0.42*
1.52
.51*
1.67
Secondary education or higher
0.75*
2.12
.75*
Never married
1.06*
2.88
.69*
.60*
Young (aged between 15–29)
-0.01
Constant
-4.24
0.99
-3.20
Women
Odds
B
(exp b)
.14
1.15
2.12
.91*
2.49
1.98
1.23*
3.43
1.81
-0.93*
0.39
-3.89
* Significant at a 0.05 level.
true for 5 per cent of married women above 30. For men: 21 per cent of married
men in the youngest age group (with high income and higher education) are predicted to be members of organisations, as compared to 13 per cent of those above
30.
For women, marital status is the most important factor influencing organisational membership: among unmarried women above 30, 15 per cent are predicted
to participate. Similarly, young, educated men increase their probability of being
242
member of an organisation from 20 to 34 per cent if they are not married. For
men, higher education is the most important factor accounting for variation in
organisational membership, and for both men and women, the probability of being
member of an organisation is twice as high for persons with secondary education
or higher, than for those with elementary or less. For women, high household
income does not seem to influence organisational participation, while it has a
statistically significant, although rather week impact on male participation.
9.4 Women’s Freedom of Movement
We have seen that higher education is one of the most important factors influencing both participation in social organisations and news consumption among
Palestinians in Lebanon – a relationship we find in most societies of the world.
Women’s Freedom of Movement often Restricted
As we saw in chapter 4, there are no longer any marked differences in the educational level between women and men, particularly in the younger generations. In
spite of this, women are much less likely to participate in organisations or to follow
the news. Palestinians in Lebanon are, as are many population groups in the region,
influenced by a patriarchal gender system, where women’s tasks are mainly tied to
the home and the raising of children, while their access to public arenas is often limited. According to traditions and due to security and other concerns, family members may set limitations on women’s possibilities to travel or move around on their
own, a fact that may undermine their chance of participation in the public sphere.
However, women’s freedom of movement varies greatly between families and social
groups.
The LIPRIL asked female respondents if they were allowed to visit 7 different
types of places on their own, or in the company of others1. More than 80 per cent
of the women report that they can go alone to the market or to visit neighbours,
while 20 per cent say they can go abroad unaccompanied, either to study or to visit
1
The question reads as follows: “Could you please tell me if you can go alone, if you can go only
when you are accompanied by someone, if you cannot go at all to the following places: to the neighbours; to the local market; to visit relatives; to visit relatives out of town; to a doctor or clinic; to
visit relatives in another country; to study in another country”.
243
Figure 9.5 Female freedom of movement. Women who are allowed to visit various places on
her own. Per cent of women aged 15 years and over (n=2,043).
Visit neighbours
Go to the local market
Visit relatives in town
Go to a doctor or a clinic
Visit relatives out of town
To study in another country
Visit relatives in another country
0
20
40
60
80
100
Per cent
relatives. One in 10 women are free to visit all the 7 places listed, while 7 per cent
are not allowed to go to any of them alone.
In order to compare the freedom of movement for women from various social
groups, we have computed an index of these indicators. Because “to study abroad”
is only weakly associated with the other indicators (as leaving husband and children
for studies in another country may be difficult for many), it is not included in the
index. We thus get an index based on 6 indicators, with values ranging from 0 to 6.
Women who say they can go to all 6 places alone are given value 6, and those who
cannot go to any get value 0. Results are displayed in Figure 9.6.
The most marked differences in female freedom of movement are related to their
age. Restrictions are the strongest for the younger generation. However, a significant proportion of those over 44 also live under strong restrictions, while only 3
per cent of women aged 30-44 are not allowed to go to any of the places listed alone.
This is also true for 8 and 9 per cent of younger and older women respectively.
However, even though older women have a greater chance of having little freedom
of movement (many at the bottom of the scale), we find quite a large share of women
over 44 at the top of the scale as well, i.e. women who are free to visit all or most of
these places alone. One in four women in the oldest age group (over 44) say they
are allowed to visit all six places, compared with one in five women aged 30-44, and
less than one in ten women below 30.
There are surprisingly few differences in restriction put upon female freedom
of movement between various income and educational groups. However, there is a
weak tendency that women in high-income families are freer to move around than
women in poorer households. At the same time, women with elementary education seem to live under more restrictions than women with higher or no education.
However, since the education level for women varies greatly between generations,
these differences may be an indirect effect of differences between age groups.
244
Figure 9.6 Women’s freedom of movement. Number of places allowed to visit alone (neighbours, the local market, relatives in town, relatives out of town, a doctor or clinic, relatives in
another country), by age, marital status, education level and household income. Per cent of
women aged 15 and over (n=1,862).
Per cent
100
Per cent
100
80
80
60
60
40
40
20
20
0
100
0
1
1529
45<
2
3
3044
Total
4
5
6
0
100
80
80
60
60
40
40
20
20
0
0
1
2
3
4
Married or been married
Never married
Total
5
6
0
0
1
2
3
4
5
6
Elementary/intermediate
No complete
Secondary/higher
Total
0
1
2
3
4
5
6
First income quintile (poorest 20%)
Third quintile (mid-income families)
Fifth quintile (richest 20%)
Total
There are also clear differences in the restrictions imposed on married and unmarried women. While 12 per cent of unmarried women are not allowed to visit any of
the six places alone, this is only the case for 6 per cent of married women. However, as younger women have a lower chance of already being married, it is difficult to establish from these numbers whether it is age or marital status that influences women’s freedom. So, in order to investigate what factors have the strongest
effects, we have to conduct a regression analysis.
The mechanisms influencing “no freedom of movement” and “full freedom of
movement” are somewhat different, and the distributions on the two ends of the
scale are thus analysed separately (Table 9.3, next page). One of the most interesting findings is that there is no significant effect of education on female freedom of
movement. Analyses were also carried out to check for effects of having no education, only elementary education and the education level of the household head, but
no significant relationships were found. There is a weak association between house245
Table 9.3 Restrictions on female freedom of movement. Logistic regression (n=2,046).
Cannot visit any of
the 6 places listed alone
B
Odds (exp B)
First income quintile (poorest 20%)
0.46*
1.59*
Aged 45 and over
1.52*
4.58*
Aged 15-29
0.99*
2.69*
Secondary education or higher
Never married
-0.53
1.04*
Can visit all the 6 places
listed alone
B
-0.50*
.033*
Odds (exp B)
0.60*
1.38*
-1.03*
0.35*
0.59
0.38
1.46
2.82*
-0.003
1.00
* Significant at a 0.05 level.
hold income and restrictions on female freedom of movement, where persons living in the poorest 20 per cent of the households are more likely not to be allowed
to visit any of the places alone, and less likely to be allowed to visit all 6 places.
However, looking at the relationship between income and each individual indicator, differences are largest between income groups on questions that involve long
journeys (relatives out of town or abroad), indicating that some of these restrictions
may be caused by economic reasons, and not by gender-specific restrictions.
Irrespective of age, unmarried women have more than twice as high chance of
not being allowed to visit any of the places listed, compared to married ones (Table
9.3). At the other end of the scale, there is no effect of marital status; married women
are not more likely to be allowed to visit all the places than unmarried women. Even
when marital status is checked, age is still the most important determinant of female freedom of movement. Compared to women aged 30 to 44, women over 44
have more than 3 times higher probability, and women below 30 more than twice
as high probability of not being allowed to visit any of the places. At the same time,
older women have the highest probability of being allowed to visit all 6 places. Among
those married and with higher education, 36 per cent of the women in the oldest
age group are predicted to be allowed to visit all 6 places, compared with 28 per
cent of middle aged women, and 12 per cent of women in the youngest age group.
If a young woman in addition is unmarried and lives with a low-income family, she
only has a 7 per cent probability of being allowed to visit all the places. Thus, older
women, independently of marital status and education, are most likely to be allowed
to visit all of the 6 places. At the same time, older women, together with women in
the youngest age group are most likely not to be allowed to visit any of the 6 places.
Low household income also seems to lead to less freedom of movement for women.
Is it is only the women themselves who perceive there to be restrictions on their
freedom of movement? The LIPRIL asked both women and men the same questions regarding their opinions about female participation in various aspects of social life. Figure 9.7 depicts the current situation.
246
Figure 9.7 Attitudes to female participation in public life by gender. Per cent of persons aged
15 and over who agree with the views listed (n=3,560).
...live alone in her own apartment
Male
Female
...be a minister or parliamentarian
...be member of a municipal council
...vote in elections
...run a business
...drive cars
...participate in voluntary social activ.
take higher education
...work outside the house
0
20
40
60
80
100 Per cent
With the exception of the right to live on her own, a significant majority of
the Palestinian population in Lebanon believes that a woman should have the right
to take part in important aspects of public life (be members of municipal councils, be ministers, participate in social activities, take higher education, etc). Men
are generally more sceptical to female participation than the women themselves.
Note for instance that while 81 per cent of the women believe women should be
allowed to work outside the home, only 51 per cent of the men agree. Similarly,
82 per cent of the women think they should be allowed to drive cars, compared
to only 61 per cent of the men. However, the level of acceptance of female participation varies not only between men and women, there are also great variations
among social groups.
In order to compare attitudes to female participation and freedom of movement
between social groups, we have computed an index where persons who say that
women should be allowed to do all of the 9 things listed in Figure 9.7 are given the
value 9, and persons who say that women should not be allowed to participate in
any of the listed activities are given the value 0. We can thus give a mean score for
the number of activities various groups think women should be allowed to do. The
results are presented in Figure 9.8.
As already mentioned, the main difference in attitudes to what women should
be allowed to do is between men and women. On average, women say they should
be allowed to do 6.8 of the listed activities, while men on average think women
should participate in only 5.3 of these. One in four men thinks that women should
be allowed to do less than 4 of the listed activities, but less than 1 in 10 women agree.
Age has relatively little effect on women’s attitudes, while differences are marked
between older men, who are rather positive, and younger men, who are among the
most negative. There is only little differentiation between rich and poor individuals
247
Figure 9.8 Attitudes to women’s freedom of movement. Mean number of activities women
should be allowed to do (among the 9 activities listed in Figure 9.7) by gender, education, age
and household income. Population aged 15 and over. Bars show differences from the overall
mean of 6 activities.
Below 30
Male
Female
30-44
45 and above
First income quintile
(lowest)
Fifth income quintile
(highest)
Elementary education
or less
Higher education
4
4,5
5
5,5
6
6,5
7
7,5
Number of
8 activities
in this regard. The most positive group, however, is those with higher education,
where the differences are particularly large for men. Women who experience few restrictions on their own freedom of movement are among the strongest supporters
of female participation in social life. However, even women who are not allowed to
visit any of the places listed above, are more positive to female participation than
the average male.
9.5 Domestic Violence
More than Half Accept a Man Beating his Wife
on Certain Occasions
The LIPRIL asked both men and women whether they see it as appropriate for a
husband to hit or beat his wife under given circumstances. To increase the reliability of the answer, and to avoid respondent embarrassment, these questions were only
asked if the interviewer was alone with the respondent at the time of the interview.
Thus, only 32 per cent of the male, and 49 per cent of the female respondents answered these questions. This may produce some bias in the data, and the results
should be interpreted with care. However, we feel that the questions reveal some
interesting trends in attitudes to violence against women today (Figure 9.9).
Women express acceptance of violence against women more often than men.
Forty per cent of the women and 47 per cent of the men oppose the beating of
women in all the occasions listed, i.e. 60 per cent and 53 per cent respectively say
248
Figure 9.9 Attitudes to violence against women by gender. “It is (sometimes or always) appropriate for a husband to hit or beat his wife if she…”. Percentage that agrees with the statement in the population aged 15 and over (n=2,454).
Male
Female
if she does not care for the children in
an "adequate" way
if she does not respect his family
if she goes out in public unaccompanied
if she does not do household chores
properly
if she does not have meals prepared
properly or on time
if she deliberately disobeys what he
asks of her
if she "talks back" or speaks in a hostile
way to him
...if she behaves in a way he dislikes
either at home or in public
0
10
20
30
40
50 Per cent
that it is appropriate for a man to beat or hit his wife in at least one of these situations. However, attitudes vary significantly with education, age and income. In
Figure 9.10, one of these questions is depicted, (whether it is appropriate for a
man to beat his wife if she does not respect his family) and is displayed for various
social groups.
Persons with higher education express much lower acceptance of violence
against women than any other group. Persons aged 30-44 are more sceptical than
both the younger and older generations. Older women are most likely to express
acceptance, as almost 50 per cent say it is appropriate for a man to beat his wife
on this occasion. There is also less acceptance of violence against women in high
Figure 9.10 Persons agreeing that it is always or sometimes appropriate for a husband to beat
his wife if she does not respect his family, by gender, age, level of education, income and place
of residence. Per cent of population aged 15 and over. Bars show differences from the overall
average of 32.5 per cent.
Men
Women
Below 30
30-44
45 and above
Elementary education
or less
Higher education
Highest income quintile
Lowest income quintile
10
15
20
25
30
35
40
45
50
Per cent
249
income households, but among both the richest and poorest groups of households
women are much more likely to accept violence than men.
9.6 Attitudes Towards the West
As in most other societies, the Arab world is under continuous cultural pressure
with regard to its future direction. Influences from the Western world are often
debated, where arguments influenced by pan-Arab, Islamic and other orientations
and movements challenge western cultural influence and political models through
literature or satellite transmissions. What are the opinions of the Palestinians in
this regard; should the influence from the West be welcomed or rejected?
Limited Acceptance of Western Ideals
The LIPRIL respondents were asked to express their opinion regarding 5 questions
on Western influence, and could agree totally, agree conditionally or disagree.
The absolute majority of the Palestinian camp population have a positive attitude
to technology transfers from the developed world, and half the population support
a transformation of the political system toward the model of the developed countries. Respondents are much more sceptical to western lifestyles, and in particular, uncensored access to international television. The responses to the 5 questions
are, contrary to what we expected, not strongly associated with each other2. For
Figure 9.11 Attitudes to Western influence. Persons who agree (unconditionally) to the statements listed. Per cent of population aged 15 and over.
Should technology from the Developed
countries be used more widely in
Lebanon?
Should the Arab countries become more
like the Developed countries in political
systems?
Should foreign (non-Arabic) books be
translated into Arabic and sold in
Lebanon?
Should the Arab countries become more
like the Developed countries in lifestyle?
Is it proper that people have access to
international television through satellite
dishes
0
2
20
An index of the 5 questions gives the alpha value of 0.62.
250
40
60
80
100
Per cent
Table 9.4 Attitudes to influences from the developed world. Persons who agree (unconditionally). Logistic regressions (n=3,091).
Should foreign
books be
translated into
Arabic and sold
in Lebanon?
B
Odds
(exp B)
Should
technology
from the
developed
countries be
used more
widely in
Lebanon?
Should the Should the Arab
Is it proper
Arab
countries
that people
countries
become more
have access to
become more
like the
international
like the
developed
TV through
developed
countries in
satellite
countries in
political
dishes?
lifestyle?
systems?
B
Odds
(exp B)
B
Odds
(exp B)
B
Odds
(exp B)
B
Odds
(exp B)
-0.05
0.95
0.34*
1.40*
0.50*
1.66*
Fifth income quintile
(richest 20%)
0.01
1.01
0.03
1.03
Secondary or higher
education
0.33*
1.39*
0.34*
1.40* 0.05
1.05
0.04
1.04
0.02
1.01
-0.40*
0.67*
0.88
1.18
-0.02
0.97
-0.17
0.84
0.52*
1.68*
Men
Aged 15-29
-0.12
0.36*
0.17
1.42* 0.44*
1.55*
0.30*
1.35*
0.26*
1.30*
* Significant at a 0.05 level.
example, only half of those positive to the Western lifestyles express unconditional acceptance of international television. The only group that stands out with consequently more positive attitudes to influences from the developed world are persons below 30. However, the differences (effects) are not very strong (Table 9. 4).
Persons with secondary or higher education are more likely to be in favour of technology transfers and the translation of books, but there is no significant relationship between education level and attitudes to Western lifestyles, political systems
and international television. The more affluent segment of the population is more
likely to approve of Western political systems and international TV.
251
252
Chapter 10 Putting the Pieces Together
Ole Fr. Ugland
10.1 Introduction
In chapter one, we pointed out that living conditions represent resources that individuals and households can utilise in shaping their future. In everyday life, individual resources in terms of health, education, employment, income etc. are utilised at
community markets and with local infrastructure in order to improve living standards. To the degree that resources tend to cumulate, for good or for bad, heaping
patterns may indicate mechanisms that are important in shaping current living
conditions and thus identify how processes can be influenced in attempts at changing these situations. Hence our focus in this report has been directed both towards
patterns of heaping of good and adverse living conditions among individuals and
households, as well as the community characteristics within which they are observed
(Figure 1.2).
For ease of presentation and analysis, the various living condition resources have
been emphasised in separate chapters. At the same time, chapter 1 underscores that
it is the way the various characteristics combine that produces the final distribution
in level of living. In this final chapter, we summarise the elements from the previous chapters, by drawing a broad and general picture of living conditions among
the Palestinians in camps and gatherings in Lebanon. Along the way we also visit 2
households, and let the community leaders share their own views on the most pressing needs.
Limited Availability of Infrastructure
Departing from the geographical distribution of the availability of community infrastructure, we have seen that the majority of the refugees today live in either city
suburbs or in rural areas, where the largest population shares are located in the Saida and Tripoli camps. Most locations are characterised by limited availability of
markets and infrastructure. The highest infrastructural coverage is seen for sanitation, which is more or less universal, while markets and economic infrastructures
are the scarcest. However, and partly contrary to what is seen in Lebanon at large,
253
variations in community markets and service infrastructure are typically seen within geographical regions rather than across them. That is, taking into account the
fact that gatherings are generally less equipped than camps, which is again partly
related to their area size.
Current living conditions should thus be seen in relation to a general lack of
infrastructure and business opportunities. Such lack is in some instances compensated by the possibility of accessing services in other communities nearby, as seen
for many of the smaller gatherings. Likewise, household members abroad are frequent, and their remittances often crucial to survival of their family members in
Lebanon. Nonetheless, 8 in 10 households characterise economic opportunities in
their environment as “very poor”.
Individual Activity Associated with Infrastructure Access
Rather than Availability
Heaping of market and infrastructure availability is, however, only to a limited degree associated with variations in living standards across individual community
members. This is again largely due to variations in the way individuals actually utilise “arenas for social interaction”, voluntary or involuntary. Elderly persons for example, and in particular old females, usually have little schooling experience, thus
remain illiterate and outside both the labour market and other economic arenas.
Social restrictions on female freedom of movement often prevent younger, and in
particular unmarried, women from participation. In consequence, good and adverse
living conditions tend to cumulate across households within their respective communities, and are related to variations in the household member’s utilisation of markets and infrastructure. As is typically observed in most societies, household heads
endowed with limited resources often tend to be accompanied by a relative lack of
resources among other household members as well, and vice versa.
It is questioned whether households may compensate their lack of resources by
networking. Informal social neighbourhood networks are frequently used with regard to the practical day-to-day management or economic survival among the most
adverse households. Likewise, economic networks stretch abroad to migrant household members. On the other hand, social participation seems to accompany other
resources, thus enforcing social exclusion among households with the scarcest resources at the outset.
Significant Need for International Assistance
The various chapters have underscored the limitations facing the Palestinian population in Lebanon related to their status as non-citizens, and hence their dependen254
cy on assistance from the international community for their survival. To a large extent
their future depends on outside political forces over which they have little control.
UNRWA is today crucial to the well-being of the population, both as major
provider of education and health facilities as well as provider of economic assistance to the families mostly in need. A similar role is also played by the PRCS in
the field of health services. Additionally the many NGOs working among the refugees today cater for a major share of available infrastructure. Still most community
services are given a low ranking by the community leaders, especially outside the
fields of sanitation and education. Health and medical services are today the most
frequently addressed areas for future assistance by the community leaders, where high
user fees appear as a significant barrier to utilisation.
10.2 Market and Infrastructure Availability
The majority of the Palestinian refugees in camps and gatherings in Lebanon live
outside the areas typically associated with the lowest living standards in the Lebanese population, such as Nabatieh, Akkar or the northern part of Bequaa (UNDP
1997). This does not necessarily imply that they are among the better off.
In chapter 1, we looked at the importance of market and infrastructure availability. In order to profit from their skills, households and individuals need “arenas
for social interaction” in their community, where skills can be applied. Hence young
people require educational institutions in which they can utilise their educational
liabilities. Utilisation of educational qualifications requires a labour market where
skills can be utilised for economic output. Money can be invested in the housing
market for better housing conditions, etc. We start this summary by taking a closer
look at the general availability of social and economic infrastructure.
Most Refugee Communities are Urban
Looking at the map in chapter 1 (Figure 1.1), we have seen that the refugee communities are scattered across Lebanon, in particular along the coastline. Six in 10
communities are urban, 3 in 10 are located in city centres and about 3 in 10 are
seen in city suburbs. The remaining 4 in 10 are found in more or less equal proportions in either urban areas outside the larger cities, or in rural areas. At the same
time, a distinction is indicated between camps and gatherings. While both community types have an equal share in the city centres, camps are more likely to be located in urban areas outside the cities, while more gatherings are located in the city
suburbs or in rural areas.
255
Most Communities Characterised by Limited Community
Infrastructure Availability
To what degree does the geographical distribution of the communities reflect variations in the availability of markets and infrastructure? Lebanese mohafazats are
clearly distinct with regard to the provision of infrastructure, where the areas of
Baalbek-Hermel and Nabatieh in particular are suffering from a lack of infrastructure (UNDP 1999). Furthermore, as non-Lebanese residents, Palestinians do not
have immediate access to many of the public services provided for the Lebanese
population. In addition, and as seen in chapter 7, upwards of three-quarters of
the Palestinian communities have experienced infrastructure and service facility
damages from armed conflict during the 1980s, of which about 10 per cent has
never been repaired. Finally, UNRWA services are usually restricted within their
mandate areas in the refugee camps.
In order to summarise the situation as regards infrastructure availability, we have
added the 79 different markets and service types mapped by the LIPRIL in the 54
various refugee communities1, and classified them within the fields of health, education, sanitation, and social and economic services. The summary allows for a rough
comparison of community characteristics (Table 10.1).
The table displays the number of services available within camps and gatherings
across geographical regions. The second far right column shows the total number
of services mapped by the LIPRIL within each service field. The columns labelled
“All” show the number of services actually available within all camps and gatherings, while the far right column shows the number of services available within camps
and gatherings as percentage of the total services mapped. Most services mapped relate
to the health, social and education sectors. As indicated in the various chapters above,
the lowest availability is observed for economic infrastructure (13 per cent of mapped
Table 10.1 Communities by distribution of infrastructure and region. Average number of services available and total service coverage in per cent.2
Beirut
Tripoli
Bequaa
Saida
Tyre
All
Service type/Region
Number of services
mapped (%
coverage G/C)
G
C
G
C
G
C
G
C
G
C
G
C
Sanitation
5
4
4
3
6
5
5
1
4
4
5
3
6
Social
3
7
5
11
8
7
5
9
4
7
5
8
21
(24 / 38)
Health
4
13
4
25
11
16
6
16
4
16
5 16
27
(19 / 59)
Education
2
3
3
5
6
3
3
5
2
5
3
4
17
(18 / 24)
Economic
1
1
2
4
1
0
1
3
0
1
1
1
8
(13 / 13)
15
28
18
46
33
31
19
33
14
34
18 33
79
(23 / 42)
Number of communities 10
4
4
2
5
1
12
2
11
3
42 12
Total services
G = gatherings, C = camps.
1
2
Three small gatherings in the Tripoli area were not mapped systematically in this way.
Average numbers are rounded to the nearest integer.
256
(83 / 50 )
services are available in both camps and gatherings respectively). Most Palestinians do not have banks or other credit institutions within their immediate reach,
and this is also the case for marketing outlets such as local co-operatives, district
markets or public market depots. Generally, the most frequently available economic
infrastructures are the local market, which is found in 20 per cent of the communities, and micro-credit, which is observed in 35 per cent (not displayed). In contrast,
sanitation services are generally the most widely covered (83 per cent of services are
found in the camps and 50 per cent of services found in the gatherings). We have
seen in the previous chapters that 8 to 9 in 10 communities are provided with water, electricity, sewage, and refuse collection systems.
In between these 2 extremes, we find social, health and education services, with
decreasing order of frequency. With regard to social services, the most commonly
available ones (not displayed) are small grocery shops available in 90 per cent of the
communities, charitable associations available in 69 per cent, ration centres in 50
per cent and houses of worship available in 59 per cent of communities. Other services such as libraries, feeding centres, fire stations or cinemas are rare. With regard
to health institutions, we find a mixture of UNRWA, PRCS and private services.
UNRWA clinics, pharmacies and nurses are found in 4 out of 10 communities.
PRCS nurses are observed in 6, physicians in 4 and clinics in 3 out of 10. Furthermore, private physicians are observed in 4 out of 10 communities, and private nurses
in more than half of them. Educational institutions are largely provided by UNRWA, while NGO kindergartens are seen in 4 out of 10 communities. Literacy
programmes are available in 1 out of 10, UNRWA primary and intermediate schools
in 4, while other private or public schools are relatively few. It should be noted,
however, that the mapping of service availability does not take into account the
service quality. We will return to this issue below.
Returning to the distribution across geographical areas, we first note a general
distinction between camps and gatherings. Gatherings generally face the lowest service coverage. This is partly due to their area size, as a gathering in some instances is
limited for example to a single building. It is also partly due to the fact that many
gatherings represent settlements in buildings that are not intended for living, are
suffering from years of maintenance neglect, and are outside the UNRWA mandate
areas. At the same time, the bias against gatherings is largely accounted for by the
absence of health services. These are 3 times the more frequent in the camps compared to the gatherings. Although other services also tend to be more frequently
available in the camps, differences between camps and gatherings are generally
smaller in the other fields than they are for health services.
Looking at the distribution across camps and gatherings within geographical
areas, we find the lowest service availability in the Tyre gatherings, followed by the
Beirut gatherings. However, the difference is not very large compared to the other
257
gatherings, except for Bequaa gatherings, which demonstrate access to twice as
many services. This is the case for most service fields, and in some instances puts
the Bequaa gatherings above the level of the camps in other regions. In particular,
this service accumulation reflects the relatively wide distribution of education services in this area, both public and private, and at both the primary, preparatory and
secondary levels. Additionally, this area is relatively speaking better equipped with
UNRWA schools and UNRWA health services such as clinics, pharmacies and physicians. On the other hand, the widest overall service coverage is seen in the Tripoli
camps with an average of 46 services. This position is again largely accounted for
by a wide diffusion of health services. In terms of sanitation, for example, Tripoli
camps actually have lower service availability than many of the gatherings. Beirut
on the other hand is relatively disadvantaged. We have seen that UNRWA schools
have less presence in the Beirut communities than in the other areas, particularly
since we find here many small gatherings located outside the UNRWA mandate area.
Finally, urban areas outside the larger cities tend to be the best equipped, although
differences are again not very large (not shown). City centre communities actually
turn out to have the lowest overall score, partly due to the presence of many lowstandard gatherings here. Comparing area types across the regional districts, variations are somewhat more pronounced than between camps and gatherings.
Community Services Cumulate
To the degree that community market or service availability is regionally distinct,
we expect it to cumulate within communities. As described in chapter 1, our main
interest is with the 3 patterns of heaping, compensation or lack of association. To
look for such links, and due to the large number of indicators included, we will in
this chapter apply the multidimensional analysis technique of factor analysis. The
basic principle inherent in this technique is that it identifies patterns of heaping and
compensation when the number of single indicators is large. Through measures of
statistical association it reveals characteristics that tend to be associated with each
other, for good or for bad. This is accomplished in 2 steps. First the analysis identifies the various patterns of association, if any, and then combines the associated elements into new single dimensions that appear as combinations of the original and
multiple characteristics. In short, the analysis attempts to reduce the large number
of indicators to a smaller set of new common indicators, based on the closest statistical associations between them.3
3
The analysis in this chapter is conducted on the population aged 15 and over only, in order to make
the analysis consistent throughout. Information on education and economic activity is asked for
people over 6 years old and 15 years old respectively. The youngest individuals were excluded as they
are deliberately omitted from registrations along several dimensions critical to this analysis.
258
Table 10.2 Community markets and infrastructure services. Factor loadings (n=54).
Factor 1: Community infrastructure
Social
.32
Health
.31
Education
.28
Economy
.26
Sanitation
-.07
Eigenvalue 2.97
Explained variance 59.5%
The analysis reveals a clear pattern of heaping, as all the indicators included turn
out to centre around one single dimension of ”community infrastructure”. Persons
living in a community with good health service coverage, for example, also tend to
be well covered by education, social and economic services, and vice versa. At the
same time, sanitation services in many instances tend to compensate for the lack of
other services, as these are available in most communities regardless of other infrastructure. Examining the degree of association between the various indicators (not
displayed), the strongest cumulative effect is seen between social and health facilities. Communities with many social services also tend to be provided with several
health services, and vice versa. However, we also find some cases of lack of association, as seen between sanitary services on the one hand and social, health and economic services on the other. While we have seen above that sanitation services are
generally covered in most communities, their widespread availability is partly linked
to the fact that many Palestinian communities are located in Lebanese environments,
where sanitation infrastructure is already provided for the Lebanese population.
Many of the Beirut gatherings, for example, are located in suburban areas where
water and sewage is provided for the general population, or in dwellings that have
been left by the Lebanese.
Most Communities Inhabited by Persons of Same Origin
in Mandatory Palestine
A final pattern of community heaping is related to population origin. Previous studies have demonstrated that many Palestinian communities are centred around a
common origin in Mandatory Palestine. This may partly be caused by their administrative location at the time of arrival. Partly it represents the need for the establishment of social networks to compensate for the lack of infrastructure and economic means. As described in chapters 2 and 8, camp dwellers in particular show
frequent neighbourhood clustering along similar areas of origin. Gatherings are more
recently established and settled in predominantly Lebanese areas, and show more
259
dispersed areas of origin. That is to say that 70 per cent of the entire population
have relatives coming from Safad or Akkar. With regard to the presence of Lebanese, chapter 7 reveals that Tyre is the most homogeneous area in this respect, where
all communities are predominantly Palestinian. The contrast is striking compared
to Bequaa, where 8 in 10 communities are also inhabited by Lebanese. We will see
below that the question of origin actually also implies social or economic interaction among community members.
10.3 Market and Infrastructure Utilisation
Following the distribution of markets and infrastructure, the next question raised
is to what degree community members actually benefit from this availability. In
chapter 1 we underscored that arena utilisation is typically regulated by selection
mechanisms. Even when there is universal availability of a certain service, regulations, norms and traditions imply that some people have easier access than others.
Hence utilisation may vary between service types as well as with people’s socio-economic background.
Demographic Transitions Affect the Population Size,
its Composition and Geographical Distribution
First, the utilisation of markets and infrastructure within each community is determined by the community population size and its composition. While initially determined by the administrative distribution of the refugee camps, the current population proportions have since then been shaped by changes in fertility, mortality
and migration. Accompanying a general process of “modernisation”, chapter 2 describes a situation where both mortality and fertility have been falling rapidly to low
levels. In particular, the age of marriage is high, while the proportion of females
remaining single is exceptionally large. The rapid decline in the proportion of married women in fact accounts for a large proportion of the fertility decline, although
this development is also paralleled by recent expansions of family planning services. Secondly, the population has experienced large movements into and out of the
camps, mainly due to the civil wars. Finally, many Palestinians have left Lebanon,
as seen by the vast majority of households that have relatives living abroad. Consequently, households are relatively small in size for a camp population, while a relatively high proportion is female headed. Today the largest population shares are seen
in Saida, followed by Tripoli, Tyre, Beirut and Bequaa. This implies that the majority are residing in residential or agricultural areas, while a handful are located in
260
mainly commercial areas. It should be borne in mind though that Lebanon is a
relatively small country, implying that most Palestinians will be located in a city
or in its immediate neighbourhood.
Individual Resources Cumulate, but Little Association
with Community Infrastructure
In order to assess the impact of individual interaction with community markets and
infrastructure, the analysis in this report has examined the degree to which individual living standards tend to vary both between geographical areas and between areas with low or high availability of infrastructure.
Summarising the observed patterns of heaping of good and adverse situations,
we have selected a few indicators similar to those applied in the description of the
communities themselves (Table 10.3). The table maps the presence of living condition problems in the adult population, within the fields of health, education and
economic activity. The most commonly observed problems are linked to the lack
of economic activity, which affects more than 6 in 10. Similarly, the lack of education is prominent, as only 3-4 in 10 have continued their education beyond the basic
level. Almost 3 in 10 struggle with diseases. Otherwise, 1 in 10 face a health problem that also affects mobility, while 1 in 10 is illiterate. Two-three in 10 have ended
up doing unskilled peddling or similar kinds of low prestigious jobs. The striking
picture from the Table is, however, the general similarity observed across both regions and across the camps and gatherings within them. This goes for both the lack
Table 10.3 Absence of individual living condition resources by region and community type.
Various indicators. Per cent of population aged 15 and over, and average index score.
Resource / Region
Beirut
G
C
Disease
30
Mobility problem
13
No formal education
Illiteracy
Tripoli
Bequaa
Saida
Tyre
G
C
G
C
G
C
G
24
21
21
25
37
25
26
10
10
8
15
14
11
14
46
38
29
31
29
32
23
14
11
6
11
8
8
13
61
65
65
65
63
69
63
All
C
G
C
29
31
27
25
13
15
12
12
38
42
38
34
36
13
13
16
12
13
66
70
61
65
64
Health
Education
Economic activity
No economic activity
Low status occupation
23
23
20
17
20
16
19
22
7
14
16
19
Total index score
1.9
1.7
1.5
1.5
1.6
1.8
1.5
1.8
1.7
1.7
1.7
1.7
N
444
1,443
140 2,207 275
187
924
2,863 766 1,919 2,584 8,619
G = Gathering, C = Camp.
261
of each type of resource, but also for the cumulation of adverse situations, as seen
from the index score in the bottom line.4
The next question raised is thus what patterns of heaping take place, and to what
degree are they associated with the availability of markets and infrastructure (Table
10.4).
The analysis identifies 3 underlying dimensions that summarise the situation with
regard to individual and community resources. The first dimension is again linked
to community infrastructure. All the community characteristics are associated with
this dimension, while at the same time none of the individual characteristics show
any association. This reflects the fact that individual variations in living standards
are only connected with variations in their community infrastructure to a limited
degree. This is also seen when examining particular individual qualifications by their
respective services (not displayed). For example, education levels are not generally
the highest in communities with the highest presence of educational institutions,
or the lowest in communities with the lowest availability. Similarly, labour force
participation and occupational standards vary only to a small degree between communities with high and low availability of markets and economic infrastructure, the
way they are measured by the LIPRIL.
On the other hand, the table reveals significant heaping in terms of health conditions, educational achievements and occupational status, which are closely related to age and gender respectively, and which underscore the importance of arena
Table 10.4 Individual resources and community infrastructure. Factor scores (n=12,003).
Infrastructure availability
Social services
Health services
Education services
Economic services
Sanitation services
Individual resources
Health problem
Low education
Economic inactivity
Age
Gender
Eigenvalue
Explained variance
4
Factor 1:
Community
infrastructure
Factor 2:
Health and
education
Factor 3:
Economic
activity
0.26
0.32
0.23
0.28
-0.2
-0.02
-0.01
0.03
-0.01
-0.03
0.01
0
-0.02
0
-0.01
0
0.02
0
0
0
2.9
29 %
0.41
0.41
-0.01
0.47
-0.04
1.8
18 %
-0.05
0.03
0.58
-0.03
0.59
1.4
14 %
The index is a simple additive count of adverse situations across the 6 indicators. The score thus
ranges from 0 to 6, where 0 indicates the best situation and 6 the most adverse situation.
262
utilization described in chapter one. Let us briefly summarise these patterns with
reference to the preceding analysis.
Health Problems Associated with Old Age
The fact that bad health is associated with old age does not come as a surprise. Perhaps the most interesting aspect in this regard is what elements of the health situation turn out to be the most prominent. As seen in chapter 3, it is particularly when
it comes to chronic diseases that the age or lifecycle effect takes precedence. Males
as children and young adults are better off than females, while males face more problems at old age, notably above the age of fifty, than females do. This is partly related to the fact that men are noticeably more troubled by lasting illness due to Lebanon’s history of conflict and warfare.
Furthermore, while the indicator adopted here is a simple assessment based on
current sufferings or illness, we have seen in chapter 3 that the picture is actually
quite complex. Psychological distress, for example, is prominent. From a list of 7
symptoms, 4 have affected roughly half of the adult population. Three in 10 adults
report 5 out of 7 symptoms of mental distress registered in the survey. Only 1 in 6
report no symptoms of psychological distress whatsoever.
In general, men, individuals with a post-secondary degree and individuals living in high-income households report the best health. At the same time, about 3 in
10 Palestinians are regular smokers, and smoking is especially prominent among
men. Nonetheless, and regardless of disabilities, acute health problems and psychological distress, 4 in 10 Palestinians consider their own health to be quite satisfactory, while almost half of the population say it is very good.
Educational Disparities Follow Generational Divides
Similar to health differences, educational achievements are also closely associated
with age differentials in the population. The strong divide observed in chapter 4,
between the education levels of parents and their offspring, reflects the relatively
recent character of the educational system. In a longer-term perspective over the last
decades, a significant enrolment increase is observed. Today most children enrol at
school. The trend has been particularly strong for women, although a significant
proportion of the youngest females never complete primary education. Hence men
are more likely to enrol, to continue beyond the primary level and in particular to
continue to the secondary or higher levels. Yet every fourth man has never completed
primary education.
At the same time, significant educational dropout is identified. Between ages
7-9, almost every child is enrolled, but the enrolment rate drops rapidly to 6 in
263
10 at age 15, and to less than 3 at age 18. The trend is particularly prominent
among boys. While dropout after the age of 16 is partly linked to the lack of secondary education institutions, this does not create distinct heaping patterns, as it
is the same for everyone. At the same time, dropout is not explained solely by the
alternative costs of education as only 2 in 10 boys outside school at this age actually work.
Non-enrolment and dropout thus in turn affect literacy. Every 1 in 4 women
and 1 in 8 men over the age of 15 are illiterate. Illiteracy is particularly high in
women over 44, among which 7 in 10 cannot read or write.
A poor household
While our analysis in this chapter relies on aggregate figures for all households, we
have paid a typical “poor” household a visit. Here is its story:
This household consists of 3 females: a wife in her sixties, her teenage daughter and
an elderly family relative. Both adults came from Safad in 1948, and the daughter
was born in Lebanon. The husband has passed away. While the daughter is still unmarried, the relative is a widow. The household has several relatives in the neighbourhood and in other camps in Lebanon. Seven close household members live
abroad: all are males aged 21-45 and working in Europe or in the USA.
Their dwelling is a dar made of blocks and built by the household itself, in a Southern camp. The road leading to the house has no street lighting and is partly inaccessible to cars. The dwelling has a garden, veranda and 3 rooms, 2 of which are
used for sleeping and 1 is an independent kitchen. The house is connected to an
electricity network, and faces power cuts from time to time. However, the household uses gas for cooking and does not have any form of heating. The dwelling has
an indoor toilet, and sewage is connected to a septic tank. Refuse is disposed in an
UNRWA container. Drinking water is piped into the dwelling, although the household faces daily problems with the supply.
None of the household members have passports or travel documents. Only the
daughter has ever attended school (an UNRWA school). She left, however, after completing basic education, due to war incidents. Since then she has undertaken training at an NGO centre. While both adults are illiterate, the daughter can read and
write.
None of the household members are economically active. The wife looks after the
house, the elderly relative is disabled, and the daughter is not allowed to work by
her mother. Furthermore, both adults suffer from long-lasting illness. Hence the
household has no labour income, and lives on only LL 760,000 received from relatives abroad and LL 240,000 received in the form of UNRWA grants. The household
has faced deterioration in income since the previous year. Additionally, the household has no savings and very low affordability, while according to their own assessment they are “neither rich nor poor”. They are, however, able to raise LL 200,000
through their family network in case of emergencies.
264
Significant Gender Differences in Employment
The final heaping pattern is associated with economic activity and gender. However, while our main initial hypothesis was that labour market access as such would
be limited, due to significant legal and institutional constraints, the hypothesis has
only been partly confirmed. As depicted in chapter 5, Palestinian labour force participation patterns largely reflect the patterns of the Lebanese population as a whole,
and in general for other countries in the region. As such, it is rather the type of work
performed by employed Palestinians that is the most characteristic trait.
First, while overall labour market participation is low, it is basically a male phenomenon. While most men are labour active, the time of their entry into the labour market is partly related to their marital status and partly to their educational
aspirations. These factors affect both the qualifications they bring with them and
their timing for entering the labour market. Although educational careers delay entry,
skills acquired seem to be readily convertible in the labour market in terms of occupational prestige. That is, for the small segment that actually takes higher education and who can find employment relevant to their skills. The most striking difference compared to the workforce in Lebanon as a whole, seems to be the general
absence of a higher stratum of upper middle and high-level professionals, as registration in professional syndicates is only permitted for Lebanese citizens. Furthermore, jobs in general are typically not regulated and are frequently exposed to environmental hazards.
Female labour force participation is thus low, although at about the same rate
as in the neighbouring countries or in Lebanon in general. The majority of women
are first students, and then become full-time housewives. The small group of women who actually enter the labour market, have usually continued to higher education, and are employed by IGOs or NGOs in the health, education and social service industries. Here working conditions are typically formalised, regulated and are
often relatively well paid.
At the same time, chapter 5 has revealed significant under utilisation of labour,
in terms of persons working less hours than they actually wish. Although the problem is not necessarily much bigger than in Lebanon in general, it is nonetheless
important as it mainly affects the youngest segments of the population.
Heaping of Individual Living Standards Takes Place
within Regions
While the association between community infrastructure availability on the one
hand, and individual resources on the other is relatively week, this implies that most
of the variations in individual living standards are seen within regions and communities. The explanation, as indicated above, may be linked to the relatively short
265
distances in Lebanon, where smaller refugee communities interact with larger ones.
Hence those from the smaller gatherings in the Beirut city centre will move to one
of the larger suburban camps for services. For example, with regard to health services, we have seen in chapter 4 that 34 per cent of those actually ill report to have
received medical assistance within the hara or neighbourhood, 29 per cent travelled
within the locality or town, while 37 per cent went to another locality or town. In
particular, persons living in gatherings have the most difficult access to health assistance, as roughly 6 in 10 have had to travel from their place of living to the nearest or another town. Similar patterns are observed for education services. Sixty-five
per cent of the population in the city suburbs and 27 per cent in city centres have
access to literacy programmes. Children in smaller rural gatherings often commute
to a nearby camp for schooling. Furthermore, about half of the economically active population are employed outside their own community. Finally, UNRWA services are the most frequent in the urban areas and city centres.
Little Compensation Through Social Participation
We have seen above that the clustering of community infrastructure is accompanied by similar clustering of households originating from the same area in mandatory Palestine. At the same time, chapter 1 emphasises the importance of social
participation to well-being, as it generates social contact, social “learning” and general emancipation. While the above analysis reveals prominent differences with regard to educational achievements and labour market participation between men and
women, both old and young, these variations at the same time reflect differences in
social participation.
As seen in chapter 9, variations in infrastructure utilisation partly represent prevailing norms and values, and partly reflect legal constraints. First, while Palestinians in Lebanon are classified as foreigners, they are excluded from the right to citizenship or to vote (unlike for example in Jordan). It has also traditionally been
difficult to obtain travel documents, sometimes restricting public life to withincommunity activity. Thirdly, media consumption is low. On average, 6 in 10 report to have received news from radio, TV or newspaper, which is low compared to
other Palestinian refugee populations. Characteristics such as high education, male
gender, age 30-44 and high income are associated with the highest degrees of news
consumption and organisational participation. Hence low socio-economic status
in terms of health, education and occupation tends to be enforced by low levels
of social participation.
266
10.4 Household Resources
Having examined the availability of community markets and services, and the way
individuals interact with them, we can now turn to the distributive outcome among
households. While there is clear evidence of heaping in terms of arena utilisation
among community inhabitants, the question remains whether such heaping is also
enforced at the household level, and how this accords with the accumulation of social
and economic infrastructure. Do variations in individual living standards cumulate
within households, or is the lack of means by some members compensated for by
the empowerment of others? The latter would be the case if less fortunate individuals, such as the elderly, children, persons with ill health, those with little education, the unemployed etc., are supported by other household members who hold
more assets.
Little Regional Differentiation Between Households
In order to identify possible patterns of heaping of good and adverse situations across
households, we start again by examining a few selected indicators across regions and
community types (Table 10.5).
Table 10.5 Household resources and region. Various indicators. Per cent of households experiencing an adverse situation.
Resource / Region
Household head
Gender (female)
Education (basic)
Economic activity (outside
labour force)
Household characteristics
Age dependency ratio (> 1)
Gender ratio (< 1)
Dwelling standard
Crowding
(1 or more persons per room)
Infrastructure index
(2 or less of 4 items)
Housing problems index
(3 or more of 5 problems)
Economic wealth
Income
(lowest income quintile)
Wealth index
(less than 7 of 19 items)
Total index score
(average number of problems
- range 1-10)
n
Beirut
Tripoli
Bequaa
Saida
Tyre
All
G
C
G
C
G
C
G
C
G
C
G
C
22
88
23
76
6
64
14
68
17
55
22
79
14
52
15
71
23
83
20
77
18
68
17
73
45
43
36
35
34
49
37
41
49
36
41
39
48
45
44
38
39
27
43
40
49
41
42
39
53
37
46
38
42
49
49
43
48
42
45
55
24
25
21
21
31
23
27
19
23
17
26
20
11
4
20
11
49
15
36
10
63
30
41
14
59
65
51
62
39
74
48
49
47
63
51
59
38
46
46
57
33
52
33
48
65
61
43
53
42
33
30
49
34
36
17
29
59
48
37
39
5.8
5.6
6.4
5.5
6
5.1
6.6
5.8
4.7
5
5.8
5.5
120 426
33
628
156
115
255
861
228
547
792 2,577
267
The indicators applied cover the household income, wealth, crowding, gender balance, age dependency and dwelling standard, in addition to labour force participation, education level and the gender of the household head. At the outset we
would expect the most advantageous households to be located in the areas with
the best infrastructure coverage.
Starting with the overall situation with regard to each indicator (the far right
column), we see that it is educational disadvantages among household heads that
constitute the most common problem, as about 7 in 10 heads have basic or less
education. Similarly, about 5 in 10 households face an adverse situation with regard to housing problems, age dependency and an overbalance of female members, as well as low economic wealth. The least frequent problems in this respect
are household infrastructure, female household heads and crowding, which affect
2 in 10 households.
Finally, examination of the frequency of the various problems across geographical
regions again confirms the pattern of regional similarity. Differences with regard to
the types of living conditions affecting the population are far more significant than
the occurrence of regional disparities with regard to the same kind of problem.
Similar to the individual resource index, the bottom line in the table depicts the
aggregate household living conditions problem score, summarising problematic situations occurring across the 10 different indicators.5 The average score across all
households is 5.8 in the gatherings and 5.5 in the camps. This implies that the situation is not very different between the 2 area types, while at the same time households in both areas experience an adverse situation with regard to more than half of
the criteria. Furthermore, regional differences across camps and gatherings are small.
The most adverse situations (highest scores) are observed for the Tripoli and Saida
gatherings. The best situation, relatively speaking, is observed in the Tyre gatherings and the Bequaa camps.
Good and Adverse Living Standards Heaping Within Households
Attempting an identification of broad and general differences in living conditions,
we can now link household resources to community infrastructure availability and
individual resources. Once again we are mainly looking for the 3 patterns of heaping, compensation or lack of association.
So far, our hypothesis of a close association between community infrastructure
availability and individual resources is not confirmed, while there is considerable
5
The index is a simple additive score, summarising the adverse situations, and does not take into
account that for example household incomes may be a greater determinant in deciding the overall
household living standard than the gender of the household head.
268
heaping across individuals. The main question is thus whether these heaping patterns cumulate further within households, or whether the lack of resources among
some household members is compensated by the resourcefulness of others. We continue the analysis from above, adding the household indicators to the factor analysis (Table 10.6).
Inclusion of the household characteristics adds another 3 dimensions to our
picture, although the pattern from the previous analysis is largely maintained. Again,
we will take a closer look at the most prominent heaping patterns with reference
to the previous chapters.
Table 10.6 Community, individual and household characteristics. Factor scores. Varimax rotation (n=12,003).
Factor/Indicators
Factor1:
Infrastructure
availability
and dwelling
standard
Factor 2:
Factor 3:
Factor 4:
Factor 5:
Individual
health
Household Household Individual
and
head
financial economic
education resources
situation
activity
Factor 6:
Household
composition
Infrastructure
availability
Social services
0.25
-0.03
0.01
0.02
0
Health services
0.31
-0.01
0
-0.04
0
0.01
0
Education services
0.22
0.01
0
0.08
0
0
Economic services
0.27
0
0.02
0.05
0.02
0
Sanitation services
-0.18
0.03
0.02
0.11
0.02
-0.04
Household resources
0.03
0.35
-0.18
-0.11
0.09
High dependency ratio
Low gender ratio
-0.02
0
-0.08
0.05
-0.07
-0.04
0.59
Female head
0.01
-0.13
-0.56
0.07
-0.1
0.12
Head=low education
-0.02
-0.08
0.32
0.14
0.18
0.23
Head= not econ. active
-0.01
0.36
0.06
-0.01
-0.03
Little infrastructure
0.13
High density
0
Environmental
problems/few savings
Low income
0
0.02
-0.06
0.05
-0.05
-0.03
-0.04
0.03
-0.09
0.01
-0.55
0.01
0.05
-0.07
0.39
0.01
0.14
0.03
0.03
-0.05
0.48
0.01
-0.02
Health problem
-0.01
0.4
0.11
-0.01
Low education
0.02
0.41
-0.03
0.01
-0.02
-0.13
-0.03
Individual resources
Economic inactivity
0
0
0.09
-0.08
0.56
Age
0.01
0.47
0.07
0.13
0.01
0.08
Sex
-0.01
-0.02
-0.01
0.06
0.56
-0.01
3
1.9
1.6
1.6
1.5
1.3
15.1
9.4
7.9
7.8
7.6
6.4
Eigenvalue
% explained variance
-0.01
0
269
Household Resources Linked with Community Infrastructure
Through Dwelling Standards
The first and most prominent factor with regard to variations in living standards is
still community infrastructure. High availability of one type of infrastructure also
implies good access to others. At the same time, community infrastructure availability is only weakly related to most of the household resources.
Exceptions are dwelling characteristics describing variations in the physical infrastructure where many housing amenities for natural reasons reflect variations in
the availability of neighbourhood infrastructure. As seen in chapter 7, most households have got drinking water and have water piped directly into the household,
regardless of region. Yet rural areas have better overall access to amenities, which is
partly explained by the wider amenity distribution in camps compared to gatherings. However, rural areas usually face less reliability in supply. Following chapter
7, households in general have good access to electricity. At the same time, nearly all
have independent kitchens and toilet facilities within the residence. However, other housing infrastructure, such as connection to sewage and refuse collection, is lacking all over, and the reliability of electricity and drinking water disposal is quite low.
Almost half of the households report frequent interruptions in electricity services,
and experience unstable water and/or drinking water supply. Furthermore, refuse
disposal is particularly a problem in the gatherings. North-south differences are
visible in electric instability in the Northern camps, while drinking water instability is more pronounced in the South. Households in the Northern camps are generally better equipped with sewage and septic tanks than households in the South.
Individual Health and Education Partly Linked to
the Gender of the Head
The strong association between health, education and age observed above is maintained, and still comes out as the second most important dimension. While for
natural reasons health tends to deteriorate with increasing age, we have also seen
above that school enrolment is a rather recent phenomenon and as such has produced significant differentiation in educational skills among young and old. We see
now, however, that these dimensions are also partly related to the gender of the
household head, as members of households with a female head tend to be lower
educated than members of households headed by a male.
270
An affluent household
Our second visit is with a randomly selected “affluent” household, which in many
respects demonstrates a striking contrast to our previous visit to the poor household:
This household lives in a Bequaa community. It consists of 2 members, a husband and
wife, both in their middle ages. He is a Palestinian while his wife is a foreigner. They
have a limited number of relatives in Lebanon, but several in the home country of
the wife. He is originally a West Bank refugee from 1967 and came to Lebanon in
1983. He is not registered with UNRWA. Both have passports.
The couple lives in an apartment building, rented from a private company. It is built
with blocks, consisting of 4 rooms and a balcony. Two rooms are used for sleeping.
The dwelling has an independent kitchen, private bathroom and toilet. It is connected to an electricity grid and water and sewage networks, although they face some
instabilities in the supply. In terms of energy consumption, they use gas for cooking, diesel for heating and electricity for water heating. Housing rent is LL 125,000/
month.
Both household members have been enrolled at school. She left after basic education due to lack of interest, but has followed vocational handicraft courses at an
NGO centre. He is a university graduate and still attends graduate courses financed
by a grant.
Both household members are economically active. She works as a technician in a
private company and he is professionally employed by a social organisation, in addition to holding a second job. The couple has no real health problems and the husband is covered by health insurance.
The household receives an annual LL 30 million in employment income, and has experienced an income increase since the previous year. It reports high affordability
although the couple cannot afford to spend several weeks away from home on
holiday. Additionally, they both have savings and precious metals. They have most
of the consumer durables reported by the LIPRIL except for satellite dish, video camera, computer and motorbike. They rate themselves among the well off in Lebanon.
Female Headed Households Demonstrate Low Education and
Limited Labour Force Participation
The third dimension reveals heaping of educational and occupational status with
regard to gender based differences in the labour market. In chapter 5, we noted that
economic activity among the heads is associated with the gender of the head as such.
Chapter 4 describes a situation where female heads tend to have lower education
than male heads, given the tendency of educational achievements to decline with
increasing age, particularly for females. Table 10.6 reveals that low education levels
271
of the head are also associated with a similar situation for other household members.
Economic Wealth the Most Important Household Indicator and
Linked to Education
The fourth heaping pattern is associated with household income and wealth. As seen
in chapter 6, households with high incomes, as expected, also tend to possess more
household items and consumer durables. One should however bear in mind the
overall difficult situation in the current Lebanese economy. Still trying to recover
from 15 years of civil war, most households struggle to survive, Palestinian and
Lebanese alike. As depicted in chapter 6, Palestinian household incomes are generally low, reaching an annual average of only LL 5.5 million. While a few households
reach the income level of the Lebanese middle class, the overall majority is found
among the poorest households in Lebanon.
We have also seen in chapter 6 that most households are dependent on employment income, in particular from wages, and that wages increase in importance as
one moves up the income scale. However, there is a relatively weak association between the total household income and the economic activity status of the head. This
is partly explained by the limited income diversification observed in the labour
market, except for 2 small segments of relatively high income-earning administrative and service workers on the one hand and low income-earning farmers on the
other. Another important factor in this regard is the total number of economically
active household members available, i.e. households that manage to engage one or
more members, often a female, in one or more of the administrative and service
occupations, will be better off. Households relying on a single income earner, or
family members working in agriculture, will be less fortunate in this regard.
At the same time, non-labour incomes such as transfers are also vital, especially
to low-income households. Among the highest income-earning households, transfers are typically received as supplementary remittances to labour income. To the
lowest income-earning ones they frequently constitute social support, and also account for a vital part of the total household income.
Furthermore, the table reveals an association between the household income and
the education level of the head. In chapter 5, we have seen that households with
high incomes generally also tend to have a head with secondary or higher education. The association observed between economic wealth and the dwelling standard (problems index) confirms that low-income households also have the most adverse housing conditions (heat, dust, humidity etc.), as illustrated in chapter 7.
Finally, low income is associated with a high number of dependent household members versus economically active ones. With wages as the most frequent income source,
272
and a relatively high degree of labour under utilisation, household labour market
attachment is a critical factor in determining the household income.
Large Households Have Low Economic Dependency,
High Dwelling Standards and High Incomes
The final pattern of heaping is associated with the household composition, in terms
of crowding and dependency. It is not surprising that crowding is shown to be important to the distribution of living standards. As seen in chapter 7, approximately
30 per cent of camp refugees live in crowded housing conditions. Crowding is,
however, less of a problem among refugees in Lebanon than elsewhere in the region,
in particular with regard to the camps. This is partly due to the relatively smaller
household size found among camp dwellers in Lebanon. Nonetheless, large households (10 or more persons) in both camps and gatherings are frequently associated
with high levels of crowding.
Furthermore, we see now that the household size is also associated with its income. For obvious reasons, incomes generally rise and fall with the expansion and
contraction in the number of economically active household members across the
household life cycle, peaking with middle-aged household heads.
Households Have Extensive Family Networks
We have seen above that households of the same origin in Mandate Palestine tend
to gather in Lebanon. In addition to infrastructure or market interaction, households also typically connect with their community through formal and informal
social networks. Most of the households are nuclear families settled among relatives
with whom there is frequent contact. While about 8 in 10 households form nuclear families, 9 in 10 have relatives living nearby. One in 2 households actually have
more than 10 relatives nearby. Additionally, 1 in 3 marriages are entered into between persons related by kinship prior to marriage, and among married persons
forming nuclear households 1 in 2 persons have the same geographic origins and
family origins in Lebanon or Palestine as their spouse. Finally, frequent patterns of
mutual daily support connect households within the community. Hence the connectedness of family networks and types of exchanges are likely to increase the wellbeing among households in the network. Household members, who engage in
mutual exchanges of help with family, are more likely to report higher well-being
than the average. Conversely, female and elderly headed households, mobile households and households with limited socio-economic resources are more often isolated from, and have less frequent contact with extended kin.
273
To summarise, there are clear patterns of heaping and compensation between
households. At the same time, these patterns are only loosely associated with patterns of heaping of community infrastructure. Household variations in living standards tend to cut across variations in the distribution of community services.
10.5 Future Needs
Following the analysis of individual living conditions resources and community
arenas for social interaction, the final element of our conceptual framework (Figure
1.2) relates to the influence from national and international actors. The various
chapters in this report have stressed the limitations facing the Palestinian population in Lebanon related to their status as non-citizens, and hence their dependency
on assistance from the international community for their survival. To a large extent
their future depends on outside political forces over which they have little control.
The design of development policies or assistance schemes generally speaking, has
to meet individual expectations in 2 ways (NOU 1993:44-45): on the one hand by
preventing immediate living condition problems, on the other by increasing the
possibility of realising own wishes and life projects. In chapter 1 we underscored
the challenge inherent in tracing the exact mechanisms that operate to produce the
observed heaping of good and adverse situations, and hence the most liable ways of
intervening with outside assistance. Hence we will now give the final word to the
community leaders and listen to their own assessment of the current situation, and
of future needs.
Most Services Low Rated
The LIPRIL has visited the community leaders in all but 3 of the investigated communities, and have asked them about their own priorities and preferences for service needs. First they were asked to give their own assessment of health, education
and sanitation services in the community (Table 10.7).
Table 10.7 Community service assessment by region. Per cent of communities ranging services
as very or rather satisfactory.
Beirut
Tripoli
Bequaa
Saida
Tyre
Total
Sanitation services
78
67
100
50
14
35
Education services
37
67
33
50
21
30
Health/medical services
14
0
33
14
7
13
n
14
6
6
14
14
54
274
In table 10.1, we have seen that sanitation services are generally the most widely
covered, while the coverage of health and education services is low. Hence services
are generally given a low rating by the community leaders. About 3 in 10 community leaders rank sanitation and education services as satisfactory, and only 1 in 10
give this ranking to health services. The ranking thus to some degree reveals a gap
between the availability and quality of services as such, as health services are generally speaking more frequently available. At the same time, we have seen that sanitation services to some degree compensate for the lack of other infrastructure. Sanitation is also the highest ranked among the 3 service types, although there is
significant variation across regions. This may indicate that sanitation services compensate for the lack of other services both in terms of quality and quantity.
In Bequaa, every community is characterised by satisfactory sanitation services.
In Tyre, this is the case for about 1 in 7, which also accords with the general availability of services in these regions. With regard to education services, almost 7 in
10 communities rate these as satisfactory in Tripoli, while the same is true for only
2 in 10 in Tyre. On the other hand, not a single Tripoli community is characterised by satisfactory medical services, which is in sharp contrast to the general high
availability of health services in this region. However, it is still Tyre that demonstrates
the lowest rankings overall, in accordance with our figures for service availability above.
Health Services the Most in Need
In addition to the service ranking, community leaders were asked to identify the
most urgent needs within the same 3 fields of education, health and sanitation
(Figure 10.1).
The Figure lists the 10 most frequently reported issues from a longer list of about
twenty items within each field. Starting with sanitation services, these generally
appear as the least frequently addressed issues among the 3 sectors, in accordance
with our indicators of availability and standard above. The most frequently addressed
problem among the sanitation issues is shortage of drinking water. In chapter 7, we
have seen that several households, also those with water piped into the household,
rely on vendors for drinking water. The second most frequently addressed sanitation problem is lack of sewage pipes and lack of household connections to sewage.
Closely behind, follows shortage of financial resources for service expansion, the
frequency of refuse collection and general sanitation maintenance.
Turning to health and medical services, these are generally the most frequently
addressed issues. High user fees are reported by 9 in 10 communities, and appear
as the overall most frequently addressed problem. User fee rates may also be seen in
relation to the generally low income-level of most households. This is followed by
shortage of medicine, lacking insurance and lack of emergency services.
275
Sanitation
Medical equipment
Finances for expansion
Shortage of rehabilit. services
Shortage of physicians
Shortage of clinics
Shortage of hospitals
Lack of emergency serv.
Lack of insurance
Shortage of medicine
High user fees
Education
Lack of health inspectors
Lack of skilled personnell
Lack of drink.water pipes
Garbage containers
Facility maintenance
Freq. of garbage collection
Finances for expansion
Lack of househ.connection
Lack of sewage pipes
Shortage of drinking water
Health
Figure 10.1 Community service needs by region. Fields considered the most important for
improvement as assessed by local informant. Per cent of all communities (n=54).
Shortage of nurseries
Shortage of libraries in sch.
Shortage of labs in schools
Shortage of prim.schools
Shortage of KGs
Skilled teachers
School playground
Books & equipment
Classroom overcrowdedness
Lack of scholarships
0
10
20
30 40 50 60 70 80
Per cent of communities
90
100
Turning finally to education services, the lack of scholarships and classroom overcrowding are the most frequently reported problems. These are followed by shortages in books and equipment as well as a shortage of school playgrounds. Thus, needs
refer to standards of existing institutions rather than the availability of educational
institutions as such, which may again reflect the overall high enrolment rate at the
lowest educational levels. That is to say, except for the fact that 3 in 10 leaders indicate the shortage of primary schools, which may refer to the need for many children to travel long distances to reach school.
276
References
ACS 1998. Conditions de Vie des Menages en 1997. Etudes Statistiques No. 9,
Fevrier. Beirut: Administration Centrale de la Statistique.
Al-Madi, Yousef 1996. Demographic, Economic and Social Characteristics of
Palestinian Refugees in Gatherings in Lebanon compared with Camps. Mimeo,
Damascus: Palestinian Central Bureau of Statistics and UNICEF.
Arnold, F. 1990. “Assessment of the quality of birth history data in the Demographic and Health Surveys”, in Assessment of DHS-I Data Quality. DHS
Methodological Reports, I. Colombia, Maryland: Institute for Resource
Development, pp. 83–111.
Awad, T. and M. Arneberg 1998. “Work and Working Conditions”, in HanssenBauer, Jon, Jon Pedersen and Åge Arild Tiltnes (eds.)
Besson, Y. 1996. UNRWA and its Role in Lebanon. Paper presented at the Lebanon Conference organized by the Centre for Lebanese Studies and the
Refugee Studies Programme, Queen Elizabeth House on 27th–30th September 1996.
Bjørndal, Arild 1992. “Hvordan står det til? Om bruk av egenrapportert helse i
medisinsk forskning”, Tidsskrift for Norsk Lægeforening, Vol. 112, No.
23:3013–3016.
Blacker, J. 1994. “Some thoughts on the evidence of fertility decline in Eastern
and Southern Africa”, Population and Development Review, 20:200–205.
Blau, P. 1964. Exchange and Power in Social Life, Exchange and Power in Social Life,
New York: Wiley.
Blome-Jacobsen, Laurie, Sami Khoury and Siri Størmer 1998. “Children and
Youth”, in Hanssen-Bauer, Jon, Jon Pedersen and Åge Arild Tiltnes (eds.)
Bohrnstedt, George W. and David Knoke 1994. Statistics for Social Data Analysis.
Itasca, Illinois: F.E. Peacock Publishers.
Bongaarts, J. and G. Feeney 1998. “On the temp and quantum of fertility”,
Population and Development Review, 24:271–291.
277
Bott, Elisabeth 1971. Family and Social Network. Roles, Norms, And External
Relationships in Ordinary Urban Families. New York: The Free Press.
Clark, Lee Anna and David Watson 1991. “Theoretical and Empirical Issues in
Differentiating Depression from Anxiety”, in Becker, Joseph and Arthur
Kleinman (eds.), Psychosocial Aspects of Depression, Hillsdale, New Jersey:
Lawrence Erlbaum Associates, Publishers.
Cleary, Paul D. 1997. “Subjective and objective measures of health: which is better
when?”, Journal of Health Services Research and Policy, Vol. 2, No.1, January:
3–4.
Cochrane, S. H. 1979. Fertility and Education: What Do We Really Know? Baltimore:
Johns Hopkins University Press.
Coleman, James S. 1971. Resources for Social Change: Race in the United States.
Berkley: University of California Press.
Dahl, Robert 1984. “Politisk deltakelse”, in Hagtvet, Bernt og William Lafferty
(ed.), Demokrati og demokratisering, Oslo: Aschehoug.
Deeb, Mary E., Françoise Ghorayeb, Tamar Kabakian, Mayada Kanj and John
Jabbour 1997. “Reproductive and Child Health”, in Mary Deeb (ed.),
Beirut: A Health Profile 1984–1994, Lebanon: American University of
Beirut.
Deming, W.E. 1960. Sample Design in Business Research. New York: John Wiley.
DOS and MI 1998. Jordan Population and Family Health Survey 1997, Calverton,
Maryland: Department of Statistics (DOS) and Macro International Inc.
(MI).
Drury, David 1996. Sample Design, Eritrean Household Income and Expenditure
Survey. Mimeo. Oslo: Fafo.
Edwards, John N., et al 1994. Household Crowding and Its Consequences. Boulder:
Westview Press.
Ekeh, P. 1974. Social Exchange Theory: The Two Traditions, Cambridge: Harvard
University Press.
Eltigani, E. 1998. Age at onset, spacing, and timing of childbearing in five Arab
countries. Paper presented at the New Arab Demography meeting, Cairo,
Egypt, June.
278
Endresen, L.C. and G. Øvensen 1994. The Potential of UNRWA Data for Research
on Palestinian Refugees – A Study of UNRWA Administrative Data. Fafo report
176, Oslo: Fafo.
Fargues, P. 1989. “The decline of Arab fertility”, Population, An English Selection,
1:147–175.
Fargues, P. and M. Khlat 1989. “Child mortality in Beirut: Six indirect estimates
based on data collected at the time of a birth”, Population Studies, 43:497–
513.
General Commissioner of UNRWA 1999. Report of the General Commissioner of
UNRWA. July 1st 1998 – June 30 1999. New York: UN General Assembly.
Goode, William J. 1963. World Revolution and Family Patterns. London: The Free
Press of Glencoe. Collier-Macmillan Limited.
Hanssen-Bauer, Jon, Jon Pedersen and Åge Arild Tiltnes (eds.) 1998. Jordanian
Society. Living Conditions in the Hashemite Kingdom of Jordan. Fafo report
253, Oslo: Fafo.
Hill, M.A. and E. M. King 1993. “Women’s Education in Developing Countries:
An Overview”, in: Hill, M.A. and E.M. King (eds.), Women’s Education in
Developing Countries – Barriers, Benefits and Policies, pp. 1–50. Baltimore
and London: The Johns Hopkins University Press.
Ibrahim, B. et. al., 1995, “Women’s Autonomy and Gender Roles in Egyptian
Families” in Obermeyer (ed), Family, Gender, and Population in the Middle
East: Policies in Context, Cairo: The American University in Cairo Press.
ILO 1990. Surveys of Economically Active Population, Employment, Unemployment
and Underemployment. Geneva: International Labour Organization.
IPS 1994. Assistance to refugees in the Middle East (Draft final report), Office for
International Policy Services. Refugee Studies Programme, University of
Oxford.
Jain, A. 1981. “The effect of female education on fertility: A simple explanation”,
Demography, 18:577–595.
Karam, Nadim et al 1997. “Utilization of Health Services”, in Deeb, Mary (ed.),
Beirut: A Health Profile 1984 – 1994, Lebanon: American University of
Beirut.
Kharabsheh, Sa’ad and Åge Arild Tiltnes 1998. “Health and Health Services”, in
Hanssen-Bauer, Jon, Jon Pedersen and Åge Arild Tiltnes (eds.)
279
Khawaja, Marwan and Åge Arild Tiltnes 2002. On the margins: migration and living
conditions of Palestinian camp refugees in Jordan. Fafo report 357, Oslo: Fafo.
Kouaouci, A. 1994. “A study of contraceptive practice in Algeria, 1967–87”,
Population, An English Selection, 6:1–22.
Lebanon Ministry of Public Health 1996. Lebanon Mother and Child Health Survey.
Beirut: Ministry of Public Health, Ministry of Social Affairs and the Arab
League.
Lerner, Daniel 1965.The Passing of Traditional Society. New York: The Free Press.
Lesthaeghe, R. and C. Jolly 1995. “The start of the sub-Saharan fertility transition:
Some answers and many questions”, Journal of International Development,
7:25–45.
Mackenbach, J. P. et al 1994. “The Determinants of Excellent Health: Different
from the Determinants of Ill Health?”, International Journal of Epidemiology, Vol. 23, No. 6:1273–1281.
Mc Cue, Helen 1994. Widows and Orphans of Peace. A Report on Widows in Burj
El Baranjeh Palestinian Refugee Camp, Beirut, Lebanon. Mimeo.
McDowell, Ian and Claire Newell 1996. Measuring Health: A Guide to Rating Scales
and Questionnaires. New York: Oxford University Press.
Meier, Gerald M. 1989. Leading Issues in Economic Development. Fifth edition.
Oxford: Oxford University Press.
Ministry of Social Affairs/UNDP 1998. Mapping of Living Conditions in Lebanon:
Analysis of the Housing and Population Database. Beirut: Ministry of Social
Affairs, and United Nations Development Program (UNDP).
MoSA 1997. Population and Housing Survey 1994–96. Description of the data file.
Mimeo. Beirut: Ministry of Social Affairs.
Moum, Torbjørn 1992a. “Self-Assessed Health Among Norwegian Adults”, Soc.
Sci. Med., Vol. 35, No. 7:935–947.
Moum, Torbjørn 1992b. Quality of Life and Health in the General Population:
Philosophical, Methodological and Empirical Issues. PhD. Dissertation,
Department of Behavioural Sciences in Medicine, University of Oslo.
Murray, Joanna, Graham Dunn and Alex Tarnopolsky 1982. “Self-assessment of
health: an exploration of the effects of physical and psychological symptoms”, Psychological Medicine, Vol. 12:371–378.
280
National Institution for Social Care and Vocational Training 2000. Internal Special
Report, March 2000, Beirut.
NOU 1993. Levekår i Norge. Er graset grønt for alle? Norwegian Public Documentation Series No 17, Oslo: Universitetsforlaget.
NPA 2000. Guide to NGOs Active in Palestinian Camps in Lebanon. Beirut:
Norwegian People’s Aid and Welfare Association (NPA).
Nuwayhid, Iman et al 1997. “Morbidity, Mortality, and Risk Factors”, in Deeb,
Mary (ed.), Beirut: A Health Profile 1984–1994. Lebanon: American
University of Beirut.
Pavot, William and Ed Diener 1993. “Review of the Satisfaction With life Scale”,
Psychological Assessment, Vol. 5, No. 2:164–172.
PCBS 1997. The Health Survey in the West Bank and Gaza Strip, Main Findings.
Ramallah: Palestinian Central Bureau of Statistics.
PCBS 1998. Women and Men in Palestine: Trends and Statistics. Ramallah: Palestine Central Bureau of Statistics.
Pedersen, Jon 1995. Sample Design, Jordan 1995 Living Condition Survey. Mimeo.
Oslo: Fafo.
Pedersen, Jon 1998. “The JLCS Sample”, in Hanssen-Bauer, Jon, Jon Pedersen
and Åge Arild Tiltnes (eds.)
Ross, Catherine E. and Chia-ling Wu 1995. “The Links Between Education and
Health”, American Sociological Review, Vol. 60, October:719–745.
Ryff, Carol D. and Burton Singer 1998. “The Contours of Positive Human
Health”, Psychological Inquiry, Vol. 9, No. 1:1–28.
Sayigh, Rosemary 1994. Too Many Enemies? London & New Jersey: Zed Books
Ltd.
Sayigh, Rosemary 1995. “Palestinians in Lebanon: (dis)solution of the refugee
problem”, Race & Class, 37, 2.
Shorter, Edward 1976. The Making of the Modern Family. London: Collins, St.Jame’s
Place.
Shryock, H. and J. Siegel 1976. The Methods and Materials of Demography. Orlando: Academic Press.
281
Singlemann, J. 1993. “Levels and trends of female internal migration in developing countries, 1960–80”, in UN, Internal Migration of Women in Developing Countries, pp. 77–93. New York: United Nations.
SSB 1993. Sosialt Utsyn. Statistics Norway, Oslo, Kongsvinger.
Tambs, K. and T. Moum 1993. “How well can a few questionnaire items indicate anxiety and depression?”, Acta Psychiatrica Scandinavica, Vol. 87:364–
367.
Throne-Holst, Marina 1996. Palestinians in Lebanon. A study commissioned to
the Swedish Ministry of Foreign Affairs. Mimeo.
Titmuss, Richard M. 1958. Essays on “the welfare state”, London: Gerorge Allan
and Unwin.
Uehara, E., 1990, “Dual Exchange Theory, Social Networks, and Informal Social
Support”, American Journal of Sociology, 96(3): 521–527.
UNDP 1996. Human Development Report 1997. Oxford: Oxford University Press.
UNDP 1997. A Profile of Sustainable Human Development in Lebanon. Beirut:
United Nations Development Programme.
UNDP 1999a. Development Cooperation, Lebanon. Beirut: United Nations
Development Programme.
UNDP 1999b. Human Development Report 1999. Oxford: Oxford University Press.
United Nations 1983. Manual X: Indirect Techniques for Demographic Estimation.
New York: United Nations.
United Nations 1987. Fertility Behavior in the Context of Development. New York:
United Nations.
UNRWA 1996. Fact Sheet. Beirut: United Nations Relief and Works Agency for
Palestine Refugees in the Middle East.
UNRWA 1999. Impact of Financial Crisis and Austerity Measures on UNRWA’s
Education and Health Programmes. Gaza: United Nations Relief and Works
Agency for Palestine Refugees in the Near East, Policy Analysis Unit, HQ.
UNRWA 1999a. Statistical Yearbook 1997–98, Amman: UNRWA/UNESCO Department of Education.
UNRWA 1999b. Education Programme, Facts & Figures. UNRWA/UNESCO
Department of Education.
282
UNRWA1999c. Vocational and Technical Education Programme (VTE) – Objectives,
Development, Future Outlook 1998/99. UNRWA/UNESCO Department of
Education.
UNRWA 2000a. Annual Report of the Department of Health 1999, Amman:
UNRWA Headquarters.
UNRWA 2000b. Report of the Commissioner-General of the United Nations Relief
and Works Agency for Palestine Refugees in the Near East, 1 July 1999–30 June
2000, New York: United Nations.
USCR 2000. Trapped on All Sides. The Marginalisation of Palestinian Refugees in
Lebanon. Washington D.C.: The US Committee for Refugees.
WHO 1989. Health principles of housing. Geneva: World Health Organisation.
WHO 1995. The World Health Report 1995: Bridging the gaps. Geneva: The World
Health Organisation.
WHO 1999. The World Health Report 1999: Making a Difference. Geneva: The
World Health Organisation.
World Bank 1993. Human Resources and Social Policy, 6. The World Bank.
World Bank 1993. The Social Dimensions of Adjustment Program: A general Assessment. The SDA Steering Committee, Washington D.C.
World Bank 1999. World bank Development Report 1999/2000. Oxford University
Press.
Zakharia, Leila and Samia Tabari 1996. Palestinian Women in Lebanon: Health, Work
Opportunities and Attitudes. Paper presented at the Palestinians in Lebanon
Conference organized by the Centre for Lebanese Studies and The Refugee Studies Programme, Queen Elizabeth House on 27th–30th September
1996.
Øvensen, Geir 1994. Responding to Change. Trends in Palestinian household economy.
Fafo report 166, Oslo: Fafo.
283
284
Annex1: The LIPRIL Sample
Ole Fr. Ugland1
1 Introduction
The Survey of Living Conditions Among Palestinian Refugees in Lebanon (LIPRIL)
covers the Palestinian refugee population residing in refugee camps and relatively
homogeneous refugee areas (“gatherings”) in Lebanon.
The design parameters for the LIPRIL sample were as follows:
1. A sample size of 4,000 households and 15-20,000 individuals was indicated in
the Terms of Reference.
2. The sample should allow comparison of living conditions among relevant subgroups such as women, children, female-headed households, vulnerable or poor.
3. The sample should be representative nationally: It should be possible to give
estimates at the national level.
4. It should be possible to divide the sample into separate reporting domains respectively:
a) The 3 larger geographical areas of the North, the Central areas and the South
b) The administrative Governorates of Lebanon grouped as (1) Beirut and the
Mountains; (2) the North; (3) the Bequaa; (4) Saida; and (5) Nabatiyeh and
Tyre.
c) The larger camps. Separate analyses for the smallest camps would not be possible.
1. The questionnaire defines the following ultimate sampling units:
a) Households - The information giver is a responsible adult (RA) in the household, usually the head of household or his spouse.
1
Part 3 is written in association with Siri Størmer, who also assisted in the mapping and counting of
the survey population. The author would like to thank Jon Pedersen for valuable comments to an
earlier draft. See also Pedersen 1998.
285
b) All members of households for data on general characteristics of those individuals (age, sex, economic activity, education). The information provider is the RA.
c) A randomly selected individual (RSI) for data that only the individual can report about himself or herself (attitudes, some health questions).
d) Women in the household for data on fertility, family planning and children. To
establish male fertility and male attitudes to family planning the RSI is interviewed.
e) Children - For health and environmentally related questions the information
provider is the mother or other caretaker.
Prior to the LIPRIL no exact enumeration of the total number of Palestinian refugees residing in Lebanon was available, to assist in the implementation of these criteria. A number of situations exist that contribute to this lack of knowledge about
the exact number of Palestinian refugees in Lebanon. First, although various population-records exist (UNRWA registers and the registers of the Lebanese Directorate for Refugees), they report different population numbers due to differences in
reporting procedures.
Second, the area is characterised by considerable internal population moves and
international migration.
Third, given the political sensitivity related to the enumeration of the Palestinian population in Lebanon as such, no census has been conducted, and attempts at
obtaining complete enumeration has been difficult.
Fourth, partly due to difficulties in accessing the camps themselves, little work
has so far been done in these areas concerning the efficiency of various sampling
designs.
On the other hand, the Palestinian Bureau of Statistics and Natural Resources
(PCBS) was preparing a census on the Palestinian population in Lebanon at the same
time as the LIPRIL was designed. Thus, the LIPRIL profited from the possibility
of conducting the sample frame design in association with the PCBS, with regard
to field mapping and the provision of household listings.
2 Target and Survey Population
The target population for the survey is all Palestinians residing in Lebanon regardless of whether they live in camps or not, and regardless of their current nationality
or registration status. Also non-Palestinians living in the refugee communities are
targeted. Practical constraints limit, however, the actual survey population in some
respects.
286
2.1 Refugee Definitions
According to the UNRWA definition, a Palestinian refugee is “a person who, as a
result of the establishment of the state of Israel, took refugee elsewhere in Palestine
(the West Bank and Gaza Strip), Lebanon, Syria and Trans-Jordan prior to 1 July
1952, and who was deemed in need”. Patrilineal descendants of this individual are
also included.
The survey aims at inclusion of all Palestine refugees currently staying in Lebanon, regardless of the time of entry and regardless of whether they have been settling temporarily in other countries.
2.2 Legal classifications
Palestinians living in Lebanon are classified according to 4 legal categories, with
immediate consequences for their socio-economic situation (Throne-Holst 1996):
• Lebanese nationals: Palestinians who have obtained Lebanese citizenship since
1950. They enjoy the same rights and privileges as all other Lebanese citizen.
• Refugees registered with UNRWA and the Lebanese authorities: There is no Lebanese legislation dealing with the specific case of the Palestinian refugees. Under
Lebanese classification, Palestinian refugees without Lebanese citizenship fall
under the category of “foreigners who do not carry documents from their countries of origin”. Refugees from 1948, who are registered with UNRWA and the
Directorate General for Refugee Affairs, receive permanent residency status and
carry Refugee Documents.
• Refugees registered with the Lebanese authorities but not with UNRWA: Palestinians who arrived after 1948 or who in other respects do not fulfil UNRWA’s requirements may be registered with the Directorate General for Refugee Affairs
only. Their status is that of a temporary resident, and they are issued LaissezPassers as travel documents.
• Unregistered refugees: Palestinians who were deported from the Occupied Territories or otherwise entered Lebanon through unofficial channels, and are not
registered with UNRWA or the Lebanese Directorate General for Refugee Affairs.
The LIPRIL covers all Palestinian refugees included under these definitions, regardless of registration status. Registration with UNRWA and the Directorate are flagged
in the survey questionnaire, according to information provided by the households.
287
2.3 Place of residence
The place of residence of the Palestinian refugees has decisive consequences for the
delimitation of the survey population. The survey distinguishes between 3 categories of locations;
a) Camps: Among refugees residing in camps, the “de jure” camp border is clearly
defined. But considerable numbers of refugees reside in the immediate outside
vicinity of this official camp border, partly mixed with the Lebanese population.
Different population groups in Lebanon tend, however, to live separately. Fortunately local informants or organisations working in the camps have a fairly
clear picture of where the Palestinians are located. In cases of doubt, local residents are able to identify Palestinian and non-Palestinian households. Thus it is
possible to draw a “de facto” camp borderline, including among the camp dwellers also Palestinians who live in this immediate outside vicinity of the camp. The
survey applies this “de facto” borderline definition of the camps, based on walking
along the camp borderlines and exact identification of Palestinian households
along the way.
b) Gatherings: In addition to the camp population, many Palestinian refugees live
outside the camps in “gatherings”. Gatherings are relatively autonomous refugee communities, for example communities constituting smaller villages along
the highway north of Tyre, communities living together in the same multi-storey building in urban areas, and so on. To identify the gatherings, the survey
applies the criteria that a gathering should include a minimum of 25 households,
living closely enough together to enable listing an mapping of them within the
same block (the smallest geographic survey unit). The identification of the gathering borderline was done by walking and along the borderline and identifying
Palestinian and non-Palestinian households, the same way as for the camps.
c) Outside camps and gatherings: There are Palestinians in Lebanon that live outside
both camps and gatherings, and who are scattered among the Lebanese population. These were not traceable within the LIPRIL survey budget, and are thus
excluded from the survey population. They are, however, often among the relatively speaking well off, as they have managed to buy their own flats outside the
refugee communities. This implies a potential bias in the LIPRIL sample, as
compared to a random sample of the total Palestinian refugee population in
Lebanon, prior to the selection of respondents.
The number of non-Palestinians residing inside the camp borders is significant in
some refugee camps, in particular in Shatila, Burj El Barajneh and Dbayeh. NonPalestinians are included in the survey population if they live in one of the (de fac-
288
to) refugee camps or gatherings. The questionnaire identifies their nationality, and
non-Palestinian households (households where all members are of non-Palestinian
origin) are excluded from the reporting
3 Sample Design
Following the above definitions, the Palestinian population is partly distributed in
refugee camps scattered across the administrative Governorates, partly they are intermingled with the Lebanese population outside the camps. The LIPRIL sample
is drawn from the complete listing of the population living in camps and gatherings, by a stratified 1 stage linear systematic design.
3.1 The sample frame
Following the geographical identification, the LIPRIL sample frame is an area based
household listing. Figures were provided in association with the PCBS during their
initial preparation for a 1998 census of the Palestinian population in Lebanon. It is
a listing of all Palestinian households in the refugee camps and gatherings (as defined above).
The basic parameters of the sample frame design are as follows:
1. Camps and gatherings were identified by local NGOs and other relevant informed persons working among Palestinians in the field. In total 57 communities were identified, 12 refugee camps and 45 gatherings.
2. Upon identification of the locations, each location was carefully checked to identify its de facto border. Again, local informants were utilized extensively to identify Palestinian and non-Palestinian households along the borderlines.
3. All households residing in each location, and all their members, were listed.
As the LIPRIL is the first survey to be sampled from this frame, no other information was available in order to judge it’s precision. During the survey fieldwork a few
new gatherings were located, one small community south of Tyre and one in the
Mountains. They are however quite small, and unlike to meet the criteria for being
considered as gatherings due to this.
289
3.2 Stratification
Stratification implies dividing the population exhaustively into mutually exclusive
groups, based on available information, to improve the precision during sample
selection and reduce costs. Since the aim of the survey is to map living conditions
among Palestinian refugees residing all over Lebanon, geographic stratification and
stratification across camps and gatherings was useful.
As a general rule of thumb, each reporting domain of a living conditions survey
should contain about 1,000 households, in order to enable breakdowns across relevant subgroups within each reporting domain. With a total sample of 4,000 households, and 5 administrative areas, about 800 households would be selected for interviewing within each.
The LIPRIL stratifies the population in camps and gatherings, within each of
the 5 Governorate areas.
A self-weighting sample (a sample with the same proportional distribution across
strata as in the population) would give a very small sample in the smallest reporting area, Bequaa. In addition, the socio-economic characteristics of this area are
unique, due to its proximity to the Syrian border and relatively higher frequency of
intermarriage with Lebanese. Hence collapsing Bequaa with one of the other administrative Governorates would not enable reliable description. Therefore, the
Bequaa was considered to be a separate stratum, and sampled by twice its proportional share of the Palestinian refugee population. The sample sizes for the other
geographical strata were reduced accordingly.
3.3 Selection procedures
Based on the household listing of all camps and gatherings, the LIPRIL design is a 1
stage stratified linear systematic sample.
As the selection of households from several gatherings within Governorate areas involves no further complications (as compared to a regular cluster sample of
gatherings), households belonging to gatherings were selected by the same 1 stage
systematic selection as for the camps.
Moreover, since the survey is based on a full listing of the households within
camps and gatherings, households to be selected were identified by the lists prior to
fieldwork, and not (as is often common) during the interviewing in the field.
Household selection
The household selection is based on the listing of all household units within strata.
The practical undertaking at this step imply:
290
• Listing of all households
• Selection of a fixed number of households, by systematic selection from the list,
starting with a random number.
First a sampling interval is calculated at the stratum (Region/camp/gathering) level,
based on the total number of households in the population (including 1-person
households) divided by the number of households to be selected. A random starting point is determined between the fixed number 1 and the sampling interval. The
starting-point case is the first selected household.
The household population list is grouped by the same strata, and households
are listed sequentially within strata. Then, one counts down the list until the sampling interval is reached, and chooses that case. The procedure is repeated until all
the required numbers of households are selected for the stratum.
Selection of individuals within households
All ever married women and a randomly selected individual (RSIs) among household members 15 years or older, were asked separate sets of questions.
The selection of RSIs involves a separate sampling stage. RSIs were selected by
the interviewer in the field, according to a selection procedure described by Deming (1960:240-1). The method consists of attaching a table with pre-determined
random selection of household members, to each questionnaire. The table is constructed to apply regardless of household size.
In the questionnaire household roster, a unique identification number is attached
to each household member. The interviewer lists the eligible household members
on the random number table according to a set of pre-specified rules, and selects
the person that the table tells her to select. Barring active cheating, the interviewer
has no influence on what person to select.
4. Selection Probabilities
4.1 Selection probabilities
The computation of selection probabilities follows the basic one-stage sample
described above, in both camps and gatherings. Notation used in the following is
given in table A1.
291
Table A1: Notation
Symbol
Meaning
N
Population count
n
Sample count (as per the sample allocation)
na
Sample count (as actually obtained)
P
Selection probability
I
Sampling interval within the list
l
Superscript to indicate listed count
s
Index of stratum
h
Index of household
I
Index of randomly selected individual
a
Index of randomly selected adult
d
Index of individual within the household
The selection probability for a household within a stratum is the following:
Equation 1:
ps , h =
ns
N
In order to decide the sampling interval, the formula is:
Equation 2:
Is =
N sl
ns
The selection probability for individuals in the case where all individuals of a specific category are selected in the households (e.g. all household members, all women) is equal to the selection probability for the household. Thus:
Equation 3:
ps , h , d = p
However, the selection probability for the randomly selected individual of the household is different. In these cases a person who is member of a household with few
persons in his or her category, has greater chance of being selected, than a person
292
who lives in a household with many other persons of the same category. Since the
person is selected from the household by simple random sampling, but only among
the adults, the selection probability is simply the household probability multiplied
by the selection probability of adult household members within the actual household to all adult household members.
4.2 Sample weights
As mentioned above, the sample is disproportionate across geographical strata. The
(unweighted) sample is of sufficient size to provide reliable data for each Governorate area (with some modifications for Bequaa), for camps and gatherings respectively, as well as for the largest refugee camps. This goes for most of the population
variables that are included in the survey.
The sampling weights used for estimation are usually of 2 types. Expansion
weights create estimates equivalent to real numbers in the population. Relative weights
retain the sample size and only adjust the relative contribution of each unit of analysis (household or individual) to the total population.
The LIPRIL adopts relative weights only, one for the household members and
another for the RSI. They are both calculated simply as the inverse of the selection
probability:
Equation 4:
Wri=pi/n
Where Wri denotes the relative weight for the i-th respondent, and the other notations are as in table 2.
In other words, the sum of the weights corresponds to the total sample. The
relative weights are however not applied directly in the estimation of survey results,
as they are both further adjusted for non-response (to be discussed further below).
5 Response Rates
Response to the interviewers in the field is equally important as the selection criteria. In particular if non-response is systematic the survey results will be biased. This
may happen if, for example, some particular geographic areas or subgroups with
interest to the survey topic tend not to answer. Depending on the volume and characteristic of non-response, it may be corrected by non-response adjustment.
293
The total sample size is decided upon by taking into account the possible reduction of the net sample size due to non-response. In practice, surveys conducted in
developing countries in general, and on Palestinian refugees in particular, demonstrate very high response rates, typically ranging from 95-98 per cent. It was, however, taken into account that population mobility is high in this community.
Two different types of non-response are usually taken into consideration. Unit
non-response yields to the sampling unit as such, - the household or a household
member. Item non-response relates to missing information about 1 or more sub items
for the units, as for example absence on 1 of the questionnaire sub-sections or individual questions. Let us take a closer look at each in turn.
5.1 Unit non-response
Unit non-response represents households missing from the survey database as compared to the sample. As mentioned initially, the survey covers 5 types of units; the
household, all household women (including ever-married women 15-54 years of
age), a randomly selected individual, youth (5-15 years of age) and children (aged
less than 5 years).
Table A2: Non-response types in the LIPRIL.
Non response type
Number of
households
Total sampled households
4,001
Households resolved (Total minus those with indeterminate status)
3,996
Households in scope (identified, eligible and non-vacant)
3,834
%
Resolved rate (Resolved/Total)
99.9
In scope rate (In scope/Resolved)
95.9
Non-existent rate (Non-existent/Resolved)
1.5
Temporary out of scope rate (Vacant + ineligible / Resolved)
2.7
Refusal conversion rate (Refusals converted / Refusals + converted)
44.8
No contact rate (Undetermined + no contact / Undetermined + in
scope)
2.6
Non-response rate (Undetermined + Refusals + No contact /
Indeterminate + in scope)
2.6
Residual non-response rate (No usable information / in scope)
0.2
Response rate (complete / in scope)
Refusal rate (Refusal / in scope)
294
96.1
0.8
According to field-instructions, the questionnaire cover page was filled in for all
households, regardless of the outcome of the interview. The information thus gives
us a complete picture of what has actually taken place during the field visit, and
reports on various failures to complete fully the interview. Table A2 displays household non-responses by their reason.
The survey was carried out in the field 4 months after the completion of the
PCBS census enumeration. Consequently, one would expect that most households
selected for interviewing would also be identified in the field for interviewing.
The classification of responses involves 2 steps. First, households that do not
belong to the sampling frame are flagged. These are either non-existing in the field,
found to be non-eligible when contacted, or are vacant. As seen from the table, the
proportion of households registered as outside the sampling frame (scope) is small,
and 96 per cent of sampled households were identified. Household moves are frequent, in particular in the urban Beirut refugee camps, where most unidentified
households are accounted for. Vacancies account for the majority of households
falling outside the sampling frame, followed by nonexistent households.
Secondly, eligible households identified in the field may refuse to be interviewed
or be found not to be home (interviewers were instructed to re-visit the household
twice in such instances). Again refusals are negligible. Initial refusals were typically
due to the general political sensitivity of the survey, and many respondents were
converted when the interviewer returned together with the supervisor to elaborate
further on the survey purpose. About half of those initially refusing were converted. In some instances it was impossible to reach the household, even though it’s
location was identified. Among eligible households, non-contacts account for about
2/3, and refusals for 1/3 of non-interviews. In general both the no-contact rate and
the non-response rate are small.
The LIPRIL response rate of 96 per cent confirms the very high response rates
typically encountered in the Middle East for such kinds of surveys. The rate differs
considerably from most such surveys conducted in the Western World where response rates typically are about 40-50 per cent.
Finally, we have seen that the survey involves 4 sub-samples; all ever-married
household women above 15 years of age, youth, children and a randomly selected
individual. Hence these sub-samples are due to the same problems in terms of identification and completion of an interview. Table A.3 displays response rates for the
various sub-samples.
295
Table A.3: Response rates for survey sub-samples. Actual sample sizes.
Sub-sample
Number of possible
respondents
N
%
Responses
N
No useful
information
No
contact
Refusal
%
N
%
N
%
N
%
0.3
5
0.1
3
0.1
Women
4,062
100
4,042
99.5
12
Youth
4,946
100
4,894
98.9
-
-
-
Children
2,345
100
2,306
98.3
-
-
-
Randomly selected
individual
3,711
100
3,687 99.4
6
0.1
11
0.3
8
0.2
For the ever-married women and RSIs, reasons for non-response are recorded on
their respective questionnaire cover pages. In general, most eligible persons are interviewed. Among women we observe a relatively speaking higher number of “no
useful information”, which typically implies that the women is of very old age and
is difficult to interview. For the RSIs “no contact” is the most frequent reason for
non-interview. These cases will include individuals who are difficult to find at home,
such as working persons or youth.
In addition, the sections for youth and children record some slight shortfall as
well. The number of possible respondents is calculated from the household roster.
Non-responses in these cases are partly due to shortfall in the interview of the mother
or caretaker.
In general, non-response from the sub-populations is negligible.
5.2 Item non-response
Overall item non-response is, with a few exceptions, low in the LIPRIL. Usually less
then 10 respondents are lacking from each question. One of the questions typically
associated with item non-response – household incomes – lacks information from
only 63 households.
However, the quality of the information recorded for a couple of other questions,
is lower than in other similar surveys conducted in the region:
Birth dates: Recording of birth dates is complete (including both day, month and
year) only for half of the household members. This can partly be ascribed to the
overall low literacy among Palestinians in Lebanon. The same problem is also encountered in the registration of exact birth dates for ever-born children.
Upper arm circumference: The final printed version of the questionnaire did not
include an open bracket for recording of the first decimal digit. Correction for this
was attempted by informing each interviewer that the first digit had to be recorded
296
in order for the information to yield meaningful information. Interviews conducted
during the first days, however, went uncorrected. Moreover, the digit recording
also demonstrates a relatively high degree of digit-preference, for digits of 5 or 0.
Household incomes: Information on household incomes is usually difficult to
collect. Problems of both recall error as well as estimation of barter items usually
imply underestimation. The survey included 2 sets of questions on the income reporting. The first was a probing list of 22 different incomes. The second was a general question on the total income earned by the household. Holding the 2 questions
against each other, it was possible to investigate errors due to misreporting of individual incomes or punching errors during data entry. Still, with no other reliable
sources of comparison, it is difficult to assess the magnitude of underreporting.
Typically it amounts to 20-30 per cent in surveys of this kind.
6 Sampling and Non-sampling Errors
Since the estimates derived in the survey are based on a sample rather than the entire population, they are subject to sampling variability, which determines their reliability. The estimates are subject to both sampling and non-sampling errors.
6.1 Non-sampling errors
Sources of non-sampling error include non-response, respondent errors, interviewer errors, coding mistakes, and data entry mistakes. Efforts were made to reduce these
types of error to a minimum. These include a two-week extensive interviewer training
course, supervisor re-visit to 10 per cent of interviewed households for quality assurance, immediate supervisor re-checking of questionnaires returned from the field,
in-built range and consistency checks in the data entry program as well as extensive
final database cleaning by criss-cross data tabulation.
Prior to fieldwork, the questionnaire and other fieldwork instruments were tested
on a 50-household pilot survey.
Nonetheless, it is difficult to give a single precise estimate on the non-sampling
error magnitude.
297
6.2 Sampling errors
There is always sampling error present in survey results whenever a sample rather
than the entire population is surveyed. However, sampling error is controlled by the
sample size and the sample design, and can thus be precisely estimated.
The basic parameters affecting the LIPRIL sample, as compared to a simple
random one is the stratification across geographical areas and final weighting. While
stratification usually decreases sampling error, weighting will increase it.
The design effect can be calculated to estimate the exact net effect of these deviations from a simple random sample. However, no design effects have been calculated for this survey.
298
Difficult Past, Uncertain Future
In 1948, one hundred thousand Palestinians fled to Lebanon from what is
today Israel to find refuge from the war. Temporary camps were established
to provide them with immediate shelter, while UNRWA was established to
cater for their basic needs.
More than half a century later, the refugees are still in Lebanon, and they
have grown in number. While some are well integrated into Lebanese society,
the majority live on the borderline of that society; tolerated, but not integrated. Most reside in camps that are still precarious settlements, or they live
in clusters of Palestinian homes outside the camps.
The Palestinian refugees in Lebanon are commonly described as facing the
worst living conditions of the Palestinian refugees in the region. Limited
employment opportunities, scant economic resources as well as difficult
access to basic health and social services are among the factors accounting for
this situation. However, little empirical information has so far been available
to document their social and economic situation in a coherent fashion.
Based on a comprehensive household survey, this report pictures current
living conditions among the Palestinian refugees in Lebanon. Wide in
context, the report documents the situation in terms of demography, health,
education, employment, social networks and public life.
The survey was implemented jointly by the Palestinian Central Bureau of
Statistics, Damascus, and Fafo Institute for Applied International Studies,
Oslo. It benefited from both the acceptance of the Lebanese Government and
the participation of the refugees themselves. The project was sponsored by
the Royal Norwegian Ministry of Foreign Affairs.
P.O.Box 2947 Tøyen
N-0608 Oslo
www.fafo.no/english/
Fafo-report 409
ISBN 82-7422-398-5
ISSN 0801-6143


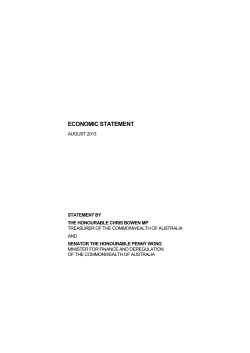
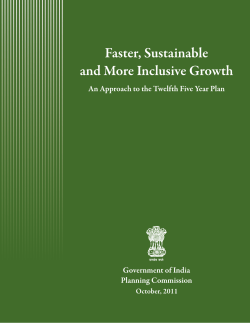


© Copyright 2026