
Effects of compound-specific transverse mixing on steady
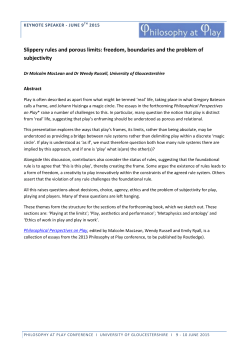
Advances in Water Resources 54 (2013) 1–10
Contents lists available at SciVerse ScienceDirect
Advances in Water Resources
journal homepage: www.elsevier.com/locate/advwatres
Effects of compound-specific transverse mixing on steady-state reactive
plumes: Insights from pore-scale simulations and Darcy-scale
experiments
David L. Hochstetler a, Massimo Rolle a,b,⇑, Gabriele Chiogna c, Christina M. Haberer b,
Peter Grathwohl b, Peter K. Kitanidis a
a
Department of Civil and Environmental Engineering, Stanford University, Stanford, CA, USA
Center for Applied Geosciences, University of Tübingen, Tübingen, Germany
c
Department of Civil and Environmental Engineering, University of Trento, Trento, Italy
b
a r t i c l e
i n f o
Article history:
Received 20 September 2012
Received in revised form 13 December 2012
Accepted 17 December 2012
Available online 27 December 2012
Keywords:
Compound-specific transverse dispersion
Mixing
Plume length
Reactive transport
Pore-scale modeling
Dilution index
a b s t r a c t
Transverse mixing is critical for reactions in porous media and recent studies have shown that to characterize such mixing at the Darcy scale a nonlinear compound-specific parameterization of transverse
dispersion is necessary. We investigate the effectiveness of this description of transverse mixing in predicting reactive transport. We perform pore-scale numerical simulations and flow-through laboratory
experiments to study mixing-limited reactions with continuous injection of reactants that result in
steady-state reactive plumes. We consider product mass flux and reactant plume lengths as metrics of
reactive transport. This study shows that the nonlinear parameterization of transverse dispersion consistently predicts both product mass flux and reactant plume extents across two orders of magnitude of
mean flow velocities. In contrast, the classical linear parameterization of transverse dispersion, assuming
a constant dispersivity as a property of the porous medium, could not consistently predict either indicator with great accuracy. Furthermore, the linear parameterization of transverse dispersion predicts an
asymptotic (constant) plume length with increasing velocity while the nonlinear parameterization indicates that the plume length increases with the square root of the velocity. Both the pore-scale model simulations and the laboratory experiments of mixing-limited reactive transport show the latter
relationship.
Ó 2012 Elsevier Ltd. All rights reserved.
1. Introduction
Reactive transport is crucial to the study of many subsurface
problems such as the fate and transport of contaminants, nuclear
waste disposal, carbon dioxide sequestration, and water–rock
interactions. Over the past three decades, numerical modeling
has been used to improve both prediction of the fate of species
and understanding at a fundamental level the physical, geochemical, and biological processes that interact and control reactive solute transport (e.g., [1,2]).
In many reactive transport scenarios in porous media, insufficient mixing is the factor that limits mass transformation, as has
been shown by model-based and experimental investigations
(e.g., [3–9]). In particular for the steady-state case with a
⇑ Corresponding author at: Department of Civil and Environmental Engineering,
Stanford University, Stanford, CA, USA.
E-mail addresses: [email protected] (D.L. Hochstetler), mrolle@stanford.
edu (M. Rolle), [email protected] (G. Chiogna), christina.haberer
@ifg.uni-tuebingen.de
(C.M.
Haberer),
[email protected]
(P. Grathwohl), [email protected] (P.K. Kitanidis).
0309-1708/$ - see front matter Ó 2012 Elsevier Ltd. All rights reserved.
http://dx.doi.org/10.1016/j.advwatres.2012.12.007
continuous source, transverse mixing critically affects contaminant
degradation and thus determines the length of the plume. Transverse mixing is usually modeled through a Fickian relationship that
involves a transverse dispersion coefficient composed of pore diffusion and mechanical dispersion terms. The classical formulation
of transverse dispersion, commonly known as the Scheidegger
parameterization [10], suggests a linear relationship between
mechanical dispersion and the mean flow velocity. This linear relationship is parameterized with a coefficient with dimensions of
length known as the dispersivity, which is thought to be a characteristic of the porous medium [11]. However, a number of studies
have indicated a nonlinear relationship exists between transverse
dispersion (Dt [L2T1]) and the average flow velocity (u [LT1])
[12–15]. Chiogna et al. [15] demonstrated through bench-scale laboratory experiments that in the direction transverse to flow, both
pore diffusion and mechanical dispersion are dependent on the
specific diffusive properties of the transported solutes. They developed an empirical relationship for Dt based on the statistical model
of Bear and Bachmat [16] to fit the data of three different tracers
with unique diffusivities. The formula for Dt illustrates that
2
D.L. Hochstetler et al. / Advances in Water Resources 54 (2013) 1–10
transverse mechanical dispersion nonlinearly depends on the
Péclet number (Pe ¼ ud=Daq [–], where d is the average grain size
[L] and Daq is the aqueous diffusion coefficient [L2T1]) (see Eq.
(6)). These experimental findings reflect physical processes occurring at sub-continuum scales, such as the development of compound-specific concentration gradients in pore channels [17]. In
order to better understand such sub-continuum processes, porescale models are important tools to capture the relevant physical
mechanisms and illuminate the interactions and effects of such
mechanisms on flow and solute transport (e.g., [18,19]). A number
of recent studies have addressed transverse mixing at the pore
scale considering conservative transport [20], reactive transport
of dissolved species [21–26], and reactive systems involving mineral precipitation and dissolution [27–29].
This is a study on reactive transport and, in particular, the effect
that transverse dispersion has on mixing-limited scenarios. We use
an approach that combines insights from pore-scale simulations
and flow-through laboratory experiments in order to gain an improved understanding of the impact of sub-continuum processes
on macroscopic reactive transport. We focus on steady-state reactive plumes which typically originate from a continuous release of
contaminants into groundwater and whose length is a parameter
of primary interest in practical applications (e.g., [30–33]). Specifically, our research objectives are to: (1) evaluate the appropriateness of a nonlinear compound-specific description of Dt in random
porous media and its direct application to reactive transport; (2)
assess the performance of a nonlinear compound-specific parameterization of Dt in predicting mixing-limited reactive transport
across a range of relevant groundwater flow velocities; (3) compare the capability of the proposed parameterization of Dt to predict product mass fluxes and reactive plume extents to that of
the linear parameterization commonly used for the description of
solute transport in porous media. Our numerical and experimental
results indicate the importance of characterizing transverse dispersion with a nonlinear compound-specific parameterization in order
to adequately understand and predict mixing-limited reactive
transport.
2. Problem setup
2.1. Pore-scale modeling
Flow and transport in natural porous media formations can be
very complex, making it difficult to characterize and model. For instance, the modeling of flow topology in heterogeneous threedimensional systems is challenging using both continuum and
pore-scale formulations. Furthermore, despite recent advances in
computing power and the concurrent ability to take advantage of
parallel computing to solve large problems, three-dimensional
pore-scale transport problems are still computationally very burdensome (often prohibitively so). However, in several situations,
two-dimensional representations can capture most of the physics
and still provide useful insight (e.g., [29]). Therefore, we use twodimensional pore-scale porous media models to simulate flow
and reactive transport. Since the problem is two-dimensional, the
solid particles are effectively circles and will be referred to as
grains for the remainder of the manuscript. Three different porous
media characterized by small, medium, and large grains were created. Each porous medium consists of grains randomly selected
from a truncated lognormal distribution (Table 1) that captures
the range of grain sizes of the corresponding bench-scale experiments performed by Rolle et al. [17]. The distribution was discretized and binned into 21 diameters of equal linear increments (see
Fig. 1). The grains were then arranged in a quasi-random manner
following the procedure of Yang et al. [34]; for the sake of
Table 1
Geometric mean (d) and standard deviation (r) of lognormal distribution of grain
diameters from which porous media were generated. Also, the porosity (g) for each of
the final porous media.
Experimental setup
d (mm)
r (mm)
g (–)
Small grain sizes
Medium grain sizes
Large grain sizes
0.25
0.625
1.25
0.15
0.20
0.25
0.389
0.396
0.400
completeness, we describe our modified approach. First, an array
of grain locations is initialized, which by choice is based on an
anisotropic distribution of grain locations and a porosity of 0.40,
considering only the mean grain diameter. Second, each grain size
is determined based on random sampling of the truncated distribution of grain sizes described above. Finally, the algorithm iteratively checks for overlap of grains and moves overlapping grains
away from each other so that a minimum distance exists between
grain boundaries. This results in mildly-disordered porous media
with porosities very close to 0.40 (Table 1). On the continuum
(i.e., Darcy or REV) scale, the porous media are homogeneous and
there is no spatial correlation of grain sizes.
Fig. 1 illustrates the resulting large-grain porous medium,
which has a length of 7.25 cm and a width of 4 cm (2 cm6 y
6 2 cm). The porous domain is discretized into 1.86 million finite
elements that range in size from 3 to 67 lm. The flow, transport,
and reactions are solved using the finite-element software COMSOL Multiphysics 4.2a. Both conservative multi-tracer simulations
as well as reactive transport simulations are performed for velocities that cover a comprehensive range of realistic groundwater
flows: 0.1 to 10 m/d.
2.2. Bench-scale experiments
Flow-through reactive transport experiments were performed
as part of this study to investigate the effects of transverse mixing
on the extent of steady-state reactive plumes. The experimental
setup was described in detail in previous publications (see
[31,35]) and a summary is provided here for completeness. The
setup consists of a quasi two-dimensional flow-through chamber
with 11 inlet and outlet ports and a porous medium filled with
glass beads of different diameters: d = 0.2–0.3 mm (from Olsson
[36]) and d = 1.0–1.5 mm. An alkaline solution with concentration
of 0.001 M NaOH was injected through the middle inlet port into
an ambient acidic solution of 0.01 M HCl which was injected
through the surrounding ports. The acid/base reaction between
the two solutions is very fast (i.e., the intrinsic kinetic reaction rate
is very large) and, therefore, mixing-controlled. The inlet concentrations were selected such that the length of the steady-state
alkaline plume was shorter than the experimental setup. The solutions were prepared using deionized water and contained a pH
indicator with a concentration of 3 106 M. The experiments
were repeated using two different pH indicators: bromophenol
blue (BPB) and methyl orange (MO). Both indicators have a similar
pH range where they change color (3.0 < pH < 4.6) but they have
distinct aqueous diffusivities (Daq;BPB ¼ 3:8 1010 m2/s and
Daq;MO ¼ 5:5 1010 m2/s) [37]. The length of the steady-state reactive plume was defined as the distance between the injection port
and the downstream end of the color plumes (e.g., [31]).
3. Modeling approach
The pore geometry is known and the Reynolds number is much
smaller than one, so the flow within the pores of the porous media
is described by the steady-state linear Stokes equation, where only
the change in potential energy and viscous dissipation terms
D.L. Hochstetler et al. / Advances in Water Resources 54 (2013) 1–10
3
Fig. 1. Large-grain porous medium with flow and transport boundary conditions (left). The grains are white and the color of the pore space indicates the magnitude of the
velocity field for a flow problem with an average velocity of 1 m/d. The plot on the right shows the grain size density (blue bins) and the truncated lognormal pdf (red line)
from which it was sampled to obtain the grains that populate the medium. (For interpretation of the references to color in this figure legend, the reader is referred to the web
version of this article.)
appear, and by the continuity equation for incompressible flow
[38]. These are given by Eqs. (1) and (2), respectively,
qg r/ þ lr2 u ¼ 0
ð1Þ
ru¼0
ð2Þ
3
where q is the density of the fluid [ML ], g is the acceleration due
to gravity [LT2], / is the hydraulic head (qpg þ z) [L], where p [ML1
T2] is pressure and z is elevation [L], l is the dynamic viscosity
[ML1T1], and u is the velocity vector [LT1]. Steady-state flow
from left to right is induced by a pressure difference, dp, and there
is no flux across the top and bottom boundaries of the domain, and
no-slip boundary conditions are applied at the solid–liquid interfaces along the grain boundaries (Fig. 1).
Steady-state solute transport at the pore scale is defined by the
advection–diffusion–reaction equation:
r ðuci Þ r Daq;i rci ¼ Ri
u
@ci
@ 2 ci
Dt 2 ¼ Ri :
@x
@y
ð5Þ
ð3Þ
where u is the velocity determined by Eq. (1), and ci ; Daq;i , and Ri are
the solute concentration [ML3], aqueous diffusion coefficient
[L2T1], and reaction term [ML3T1], respectively, for species i.
For conservative transport, which is discussed in Section 4, Ri ¼ 0.
In Section 5 we consider transport with irreversible bimolecular
reactions. The corresponding reaction term is:
Ri ¼ jcA cB :
and cB ¼ cB;0 over jyj > w=2 and cB ¼ 0 elsewhere on the boundary.
For all other boundaries (including the internal solid–liquid interfaces), the normal concentration gradients are assumed to be zero,
resulting in a strictly advective flux at the outflow boundary, and
zero fluxes at the other boundaries (Fig. 1).
For this work, we are interested in both the pore-scale results
and how we might predict the corresponding (reactive) transport
results under varying flow conditions at the continuum Darcy
scale. Continuum models are universally used in transport modeling including the upscaled advective–dispersive (–reactive) equations. For the given steady-state setup, mean flow is in the x
direction and the transport results are not sensitive to the longitudinal component of the dispersion tensor [39,40]. The governing
equation can then be simplified as follows:
ð4Þ
where j is the intrinsic (i.e., well-mixed or batch) reaction rate constant [M1L3T1]. For the two reactants, A and B, the reaction term
is a sink, and for the product, C, the reaction term is a source.
For both conservative and reactive transport simulations, the
inlet boundary (x ¼ 0) is subdivided into two sections: jyj 6 w=2
(labeled source in Fig. 1) and jyj > w=2 (labeled ambient in Fig. 1),
with the source width w ¼ 1:1 cm. For the conservative simulations, the inlet boundary condition is Dirichlet with ci ¼ ci;0 over
jyj 6 w=2 and ci ¼ 0 elsewhere on the boundary. For the reactive
simulations, Dirichlet boundary conditions are also set with
cA ¼ cA;0 over jyj 6 w=2 and cA ¼ 0 elsewhere on the boundary,
4. Conservative transport results
In this section, we examine the behavior of conservative tracers
in order to evaluate the transverse dispersion coefficient for a
number of flow scenarios. The results are then used to determine
the best-fit parameters for linear and nonlinear parameterization
of Dt . The different parameterizations will be used to predict reactive transport using continuum models in Section 5. Simulations
with average flow rates of 0.1, 0.25, 0.5, 1, 3, 5, 7.5, and 10 m/d
for conservative species with the diffusive properties of fluorescein
(Daq ¼ 4:8 1010 m2/s) and oxygen (Daq ¼ 1:97 109 m2/s) were
conducted for each of the three porous media. This results in Péclet
numbers of Pe ¼ 0:15—60:3; Pe ¼ 0:37 151; Pe ¼ 0:73 301, for
the small, medium, and large grain domains, respectively. In order
to determine the transverse dispersion coefficient for each simulation, we fit the 2-D steady-state analytical solution [39] to the
pore-scale concentration profile. This procedure was repeated to
obtain a best-fit Dt for every simulation with a distinct tracer
and flow velocity.
4
D.L. Hochstetler et al. / Advances in Water Resources 54 (2013) 1–10
The nonlinear parameterization of Dt , which was inspired by
the statistical model of Bear and Bachmat [16] and was developed
in the previous works of Chiogna et al. [15] and Rolle et al. [17],
takes the form:
Dt ¼ Dp þ Daq
!b
Pe2
ð6Þ
;
Pe þ 2 þ 4d2
where Dp is the pore diffusion (Dp ¼ Daq =s, where s is the tortuosity
[–]) [L2T1], d is the ratio between the length of a pore channel and
its hydraulic radius [–], and b is an empirical exponent which
captures the extent of incomplete mixing [–]. The tortuosity was
determined by computing the flux from the aqueous diffusion
across the pore-scale domain, JD;ls ¼ gðDaq =sÞdc=dx, and comparing
it to the flux for a completely porous domain of the same size,
JD;l ¼ Daq dc=dx [11, Section 4.8.2]. The same fitting procedure that
was used in our previous work (explained in detail in Section 4 of
[17]) was applied to determine b and d. The mean values and the
95% confidence intervals of these parameters are reported in Table 2
for each of the three porous media considered.
In a recent study, Rolle et al. [17] analyzed bench-scale laboratory experiments with the same small, medium, and large grain
sizes and used periodic pore-scale modeling to understand the
physical processes responsible for the compound-specific nature
of transverse dispersion even at higher Pe. Periodic models are useful for studying physical processes (e.g., [41]), but cannot capture
the full variability of a random system, particularly at high flow
velocities. In fact, for our pore-scale domain, the new models with
randomly-packed grains provided improved results over the previous periodic models [17]. These new results are consistent with the
lab and modeling results reported in that prior study, but with
higher precision (tighter confidence intervals) and values closer
Table 2
Fitted parameters for Eq. (6) for the numerical multitracer experiments.
Small grain
Medium grain
Large grain
b (–)
d (–)
Mean
95% CI
Mean
95% CI
0.51
0.47
0.47
0.50–0.53
0.45–0.48
0.44–0.50
4.7
4.8
5.7
4.5–4.9
4.5–5.1
4.7–6.6
10 1
10 0
Dt/ud [−]
t
ð7Þ
We also examine the Dt values computed using this model, where
the transverse dispersivity, at , is a constant. The classical statistical
models of de Josselin de Jong [42] and Saffman [43] predict that
at ¼ 163 d. This linear model is represented by the dashed line in
Fig. 2, which clearly does a poor job of matching the data for
Pe > 1 where mechanical dispersion is relevant. Fig. 3 illustrates
the two different parameterizations by analyzing the numerical
data from the large-grain pore-scale simulations. Fig. 3(a) shows
all data along with the nonlinear parameterization using the best
fit values of d ¼ 5:7 and b ¼ 0:47, which fit both distinct data sets
well into the high flow velocity and mechanical dispersion dominated scenarios. This could not be achieved with a linear parameterization, which would predict a single line with a steeper slope for
both compounds at high flow velocities. Fig. 3b illustrates the dispersivities determined from Dt for the velocities at which mechanical dispersion, and therefore dispersivity, is relevant. Classical
theory suggests that all the data points in Fig. 3(b) should provide
a constant at (i.e., a horizontal line), but it is clear that the data
show a different behavior. Previous laboratory studies [13,14] reported transverse dispersivity values dependent on velocity. Our
multitracer results confirm that at decreases with increasing flow
10 1
Fl − d=0.25 mm
O2 − d=0.25 mm
Fl − d=0.625 mm
O2 − d=0.625 mm
Fl − d=1.25 mm
O2 − d=1.25 mm
Linear D
(a)
Nonlinear D
t
−1
Fl − d=0.25 mm
O2 − d=0.25 mm
Fl − d=0.625 mm
O2 − d=0.625 mm
Fl − d=1.25 mm
O2 − d=1.25 mm
Linear Dt
(b)
10 0
Nonlinear D
t
10 −1
10
−2
10
10 −2
Dt ¼ Dp þ at u:
Dt/ud [−]
Random pore-scale model
to those determined from the randomly-packed laboratory experiments (see Table 2 of [17]).
To jointly analyze the three data sets, we plot the inverse dyDt
namic Péclet number ud
for each of the simulation data on a single plot (Fig. 2(b)) and juxtapose it to the same plot for the
laboratory data from Rolle et al. [17] (Fig. 2(a)). To examine all laboratory data with a single parameterization of Dt , we set the exponent capturing the nonlinear behavior to b ¼ 0:5, which is
representative of the average of all experiments. The same value
of b was determined for the pore-scale multi-tracer simulations.
The geometric parameter d was 6.2 and 5.0 for the laboratory
and pore-scale results, respectively. The resulting nonlinear
parameterization of Dt is shown by the solid lines in Fig. 2(a) and
(b). Both the experimental and numerical results lie on the nonlinear parameterization curve with minimal scatter, confirming the
appropriateness of Eq. (6).
A much more common approach to characterizing transverse
dispersion is the linear parameterization [10]:
10 0
10 2
Pe [−]
10 4
10 −2
10 −2
10 0
10 2
10 4
Pe [−]
Fig. 2. Results of multitracer bench-scale laboratory experiments (a) and numerical simulations (b) comparing the inverse dynamic Péclet number versus the Péclet number.
Both sets of results include two tracers, Fluorescein and Oxygen, and three porous media (small, medium, and large grains). Points are measured data, the continuous line is
3
from Eq. 6 using the mean of the fitting parameters (for the experimental and the numerical), and the dash-dot line is from Eq. (7) with at ¼ 16
d. The laboratory results (a) are
from [17].
5
D.L. Hochstetler et al. / Advances in Water Resources 54 (2013) 1–10
−5
−7
10
12
transverse dispersivity [m]
Fluorescein
Oxygen
(a)
−8
t
D [m2/s]
10
−9
10
−10
10
10
0
10
1
10
2
(b)
11
10
9
8
7
6
5
4
−1
10
x 10
0
2
u [m/d]
4
6
8
10
u [m/d]
Fig. 3. Dispersion determined for the numerical simulation with large grains. Transverse dispersion as a function of the flow velocity with the lines given by Eq. (6) (a) and
transverse dispersivity, as defined by Eq. (7) (b). The dispersivities from the 1 m/d and the 10 m/d experiments are highlighted in red. (For interpretation of the references to
color in this figure legend, the reader is referred to the web version of this article.)
velocity and clearly show the dependence of dispersivity on the diffusive properties of the solute.
The decrease in at with increasing velocity is due to the incomplete mixing that occurs within pores at higher velocities; the
square root (b 0:5) in the mechanical dispersion term of the nonlinear parameterization of transverse dispersion (Eq. (6)) actually
describes this phenomenon. The difference in at between the two
compounds is due to the amount of incomplete mixing determined
by the interaction between advection and diffusion in the pore
space [17] and, again, is accounted for by including the diffusivity
in the mechanical dispersion term of Eq. (6).
In the following section, we analyze how the choice of transverse dispersion parameterization affects predicting reactive transport for the large-grain case with a continuum model. In practice,
one may perform a tracer test with a conservative tracer in order
to determine upscaled transport parameters (i.e., average velocity
and dispersion) for the environment of interest. In the case of a linear parameterization, a range of dispersivity values exist that depend on the compound and the mean flow velocity at which the
tracer test was performed. For illustrative purposes, we choose
the dispersivities determined from the fluoroscein and oxygen conservative tracer pore-scale simulations for the average velocities of
1 m/d and 10 m/d (the points highlighted in red in Fig. 3(b)).
Selecting the 1 m/d and 10 m/d results covers the range of dispersivities seen in the conservative results. For each of these four simulations, we use the at determined by the linear dispersion model
to predict reactive transport in a continuum model. In the case of
the nonlinear parameterization, the parameters b and d are determined from the tracer tests (Table 2). This parameterization is also
used in a continuum model for reactive transport prediction, and
the results are compared to those from the linear parameterization.
5. Reactive transport results
To compare the performance of continuum reactive transport
models that use either a linear or nonlinear transverse dispersion
parameterization, we examine the mass flux of the reaction product and the extent of the steady-state reactive plumes. We also
study the amount of mixing required to degrade the reactant
plumes for each of the unique pore-scale models. As was done
for the conservative tracer tests, analysis of both lab and numerical
results is performed for a range of flow velocities from less than
1 m/d to 10 m/d.
To focus on mixing-limited reactions, we consider reactions
with very fast kinetics such that they are instantaneous. With the
intrinsic kinetic rate constant set to j ¼ 2 105 M1 s1, an
increase in j has no effect on the steady concentration results;
thus, reactions can be considered effectively instantaneous. In each
of the reactions, we consider an irreversible reaction of compounds
A and B reacting to form compound C:
A þ B ! C:
ð8Þ
In a typical groundwater reactive transport problem, A may be a
contaminant that acts as both the carbon source and the electron
donor, B would be the electron acceptor, and C would be an inert
product of the reaction. For our pore-scale simulations, the
reactants A and B have the same diffusive properties of the tracers
used in the conservative tests (Daq;A ¼ 4:8 1010 m2/s, Daq;B ¼
1:97 109 m2/s), and the product C has the same aqueous
diffusivity as A.
5.1. Product mass flux
For groundwater contamination problems, it is useful to quantify the mass flux of a reaction product and its spatial variation.
Therefore, we measure the mass flux of the product in the porescale model as a function of distance from the source of the contaminant and do the same for the continuum models (Fig. 4). The
mixing ratio, X [–], is defined as the volumetric ratio of injected
solution in the mixture with the ambient water. The critical mixing
ratio, X crit [–], is the particular value of X at which the concentrations of the reactants A and B are in the stoichiometric ratio of
the reaction: X crit ¼ fA cB;0 =ðfB cA;0 þ fA cB;0 Þ, where fA and fB are the
stoichiometric coefficients [44]. In this section, the inlet conditions
and stoichiometry are set such that X crit ¼ 0:67.
Fig. 4 shows how well the different continuum model results
compare to that of the pore-scale for three reasonable flow velocities at which transverse mechanical dispersion is significant compared to pore diffusion: u ¼ 1 m/d, u ¼ 5 m/d, and u ¼ 10 m/d.
When pore diffusion is the dominant component of transverse dispersion, the parameterization of Dt is irrelevant since the differences in the mechanical dispersion component are negligible. For
clarity, the results from the linear model based on the tracer tests
of different velocities are split into two different plots: the top row
includes the continuum results using dispersivities from the
u ¼ 1 m/d conservative tracer test and the bottom row includes results using dispersivities from the u ¼ 10 m/d conservative tracer
test. Each plot includes the pore-scale results and the continuum
model results for the nonlinear Dt .
Several conclusions can be drawn from the product mass flux results in Fig. 4. Considering predictions made with the linear model
based on the u ¼ 10 m/d tracer tests (Fig. 4(d)–(f)), using the constant dispersivity at based on the A tracer test always resulted in
6
D.L. Hochstetler et al. / Advances in Water Resources 54 (2013) 1–10
Fig. 4. Top image: normalized concentration of product (C) for the scenario with X crit ¼ 0:67, fast kinetics (j ¼ 2 105 M1 s1), and mean velocity of 1 m/d. The plots show
product mass flux from pore-scale and the continuum models with fast kinetics to predict the pore-scale results, with different average velocities: 1 m/d (a,d), 5 m/d (b,e), and
10 m/d (c,f). The top row includes predictions using dispersivities determined from conservative tracers at a mean velocity of 1 m/d (a,b,c), and the bottom row includes
predictions using dispersivities from conservative tracers at a mean velocity of 10 m/d (d,e,f).
an under-prediction of product mass flux and using the at based on
the B tracer tests resulted in an over-prediction of the product mass
flux. For the high-flow velocity scenario, both continuum models
using a linear Dt parameterization based on the u ¼ 1 m/d tracer
tests significantly over-predict the product mass flux (Fig. 4(c)).
Sometimes the results using a linear Dt parameterization were reasonably close to the pore-scale results; this happened when the
flow conditions were identical to those at which the dispersivities
were determined (e.g., Fig. 4(a)). However, the predictions using
the nonlinear Dt parameterization still were consistently better.
Also, predictions for flow conditions different than the tracer test
used to determine at can be significantly worse than using the nonlinear Dt parameterization on the continuum scale. Ultimately, over
the range of flow conditions considered, only the continuum model
using the nonlinear Dt (Eq. (6)) was able to predict, with reasonable
accuracy, the product mass flux observed in the pore-scale
simulations.
5.2. Extent of plumes
We also compare the ability of the different Dt parameterizations to predict the extent of steady-state plumes. For the results
shown, we consider the plume boundary to be where the concentration of A is one-thousandth of the source concentration (i.e.,
cA =cA;0 ¼ 0:001).
In order to test a full range of velocities and examine plume
lengths shorter than the horizontal dimension of the large-grain
porous medium domain, we set X crit ¼ 0:91 for the remainder of
the results. Fig. 5 illustrates the plume extent in the porous
medium where the mean flow velocity is 5 m/d. The bottom part
of the figure compares the profile of the same pore-scale result
with the predicted profiles using the nonlinear Dt continuum
model and the four linear Dt continuum models using the values
of at selected above. Fig. 6 presents the same type of plume profiles as shown in the bottom of Fig. 5 and displays them for the
D.L. Hochstetler et al. / Advances in Water Resources 54 (2013) 1–10
7
Fig. 5. Contaminant (A) plume with X crit ¼ 0:91, mean flow velocity of 5 m/d, and fast kinetics (j ¼ 2 105 M1 s1), and the end of the plume indicated by the dashed line
(at x = 5.6 cm). The top details the normalized concentration of A in the large-grain porous medium. The bottom shows the plume extent (cA =cA;0 ¼ 0:001) for the pore-scale
model (black dots) and five continuum models using transport parameters based on pore-scale results.
different scenarios illustrated for the product mass flux analysis
(Fig. 4).
Examination of the plume profiles reveals some interesting
points. The linear model using the at from the B tracer test with
u ¼ 10 m/d does a very good job of predicting plume lengths for
u 6 3 m/d (less than 10% relative error) (see Fig. 6(d)). The next
best results from a linear Dt parameterization compared to the
pore scale is when the dispersivity from both the A and the B tracer tests with u ¼ 1 m/d is used for u 6 1 m/d (Fig. 6(a)). However,
the plume extent for higher velocities is considerably underpredicted with the same two dispersivity values (Fig. 6(b) and
(c)). The plume extent predicted using the linear model with dispersivity from the A tracer test at u ¼ 10 m/d was consistently
and significantly larger than that of the pore-scale model
(Fig. 6(d)–(f)). The relative error was even more than 50% at
u = 5 m/d (Fig. 6(e)). Similar large relative errors (> 50%)
were found for a range of moderate flow velocities: 3 m/d
6 u 67.5 m/d (results not shown).
As was seen in the product mass flux predictions, over the range
of flow velocities tested, only the continuum model using the nonlinear Dt was able to accurately predict the plume extent. In particular, for u P 0:5 m/d, the plume lengths predicted using this
dispersion model were within 3% of the true plume lengths obtained in the pore-scale model.
Fig. 7a summarizes the complete set of plume length analysis
that was performed for the numerical simulations. The measured
plume lengths from the large-grain pore-scale model are shown
by the dots while the lines show the predictions based on the continuum-scale models using nonlinear and linear Dt parameterizations. It is clear that only the nonlinear Dt parameterization is
able to capture the behavior observed in the pore-scale simulations
over the range of considered velocities. The predictions using the
linear parameterization of Dt show a different trend with increasing velocity.
For the laboratory experiments (Fig. 7(b)), the observed plume
lengths depend on the transverse mixing of different species. As
a pragmatic approach, we use the analytical solution for the plume
length proposed by Cirpka et al. [31] under the assumption that an
equivalent Dt can be defined in order to describe reactive mixing in
the system:
L¼
uw2
16Dt ðinverfðX crit ÞÞ2
:
ð9Þ
Thus, from the observed plume lengths, we determined equivalent
Dt coefficients. Furthermore, using Eq. (6), we can derive an equivalent aqueous diffusivity for each of the four reactive systems. The
lines in Fig. 7(b) show the plume length as a function of the flow
velocity based on Eq. (6) (with b and d already determined from
conservative experiments of Rolle et al. [17]) and Eq. (9) using the
equivalent aqueous diffusivities for each of the systems. These lines
capture the trend of the experimental data. For both porous media,
the measured plume lengths for the pH indicator BPB are longer
than the equivalent plume lengths for MO. We attribute this
8
D.L. Hochstetler et al. / Advances in Water Resources 54 (2013) 1–10
U = 1 m/d
(a)
0.5
0
(c)
0.5
linear (A,u=1)
linear (B,u=1)
−0.5
−1
U = 10 m/d
1
(b)
y [cm]
y [cm]
U = 5 m/d
1
pore−scale
nonlinear D t
0.5
y [cm]
1
0
−0.5
0
2
4
6
−1
8
−0.5
0
5
x [cm]
(d)
0
5
10
x [cm]
1
1
(e)
linear (A,u=10)
0.5
−1
10
x [cm]
pore−scale
nonlinear Dt
1
0
(f)
0.5
0.5
0
−0.5
−1
y [cm]
y [cm]
y [cm]
linear (B,u=10)
0
−0.5
0
2
4
6
−1
8
0
−0.5
0
5
x [cm]
−1
10
0
5
x [cm]
10
x [cm]
Fig. 6. Extent of the contaminant plume for pore-scale and the continuum models to predict the pore-scale results. The figure illustrates scenarios with different average
velocities: 1 m/d (a,d), 5 m/d (b,e), and 10 m/d (c,f). The top row includes predictions using a linear parameterization of Dt with the dispersivities determined from
conservative tracer tests at a mean velocity of 1 m/d (a,b,c), and the bottom row includes predictions with dispersivities from conservative tracer tests at a mean velocity of
10 m/d (d,e,f).
12
35
BPB sm gr obs
BPB sm gr sim
MO sm gr obs
MO sm gr sim
BPB lg gr obs
BPB lg gr sim
MO lg gr obs
MO lg gr sim
(a)
30
8
6
pore−scale
nonlinear Dt
4
plume length [cm]
plume length [cm]
10
linear (A,u=1)
linear (B,u=1)
linear (A,u=10)
linear (B,u=10)
2
0
0
5
10
25
20
(b)
15
10
5
0
15
0
2
4
u [m/d]
6
8
10
u [m/d]
Fig. 7. Plume lengths for a range of average flow velocities. Results from pore-scale large-grain numerical results (dots) and predicted plume lengths using continuum models
with different parameterizations of Dt (a). Reactive lab experiments for small (d ¼ 0:2—0:3 mm) and large (d ¼ 1 1:5 mm) grain sizes using BPB and MO as pH indicators (b).
difference to an effect of the species-specific diffusive properties of
the pH indicators used in the experiments.
For both the numerical pore-scale simulations and the laboratory experiments, the plume lengths are increasing with the square
pffiffiffi
root of the flow velocity ( u) when mechanical dispersion becomes dominant. Considering equivalent diffusive/dispersive
properties of the reactants, it is also clear that the nonlinear
parameterization of Dt predicts this scaling of the plume length
pffiffiffi
with u based on Eq. 9. On the contrary, the same equation indicates that a linear parameterization of Dt erroneously predicts an
asymptotic, constant plume length with increasing velocities. For
example, when u 1 m/d, transverse dispersion is dominated by
the mechanical dispersion term such that Dt ¼ at u. Thus, the
plume length predicted for larger and larger velocities remains
constant and independent of u:
L¼
w2
16at ðinverfðX crit ÞÞ2
:
ð10Þ
We believe these results also have implications for other reactive
transport scenarios for which analytical solutions have been used
to describe steady-state reactive plume lengths (e.g., [30,32,45]).
D.L. Hochstetler et al. / Advances in Water Resources 54 (2013) 1–10
−6
10
d = 0.25 mm
d = 0.625 mm
d = 1.25 mm
−7
CDI
10
−8
10
−9
10
10 −1
10 0
10 1
u [m/d]
Fig. 8. Critical dilution index (CDI) computed over a range of flow velocities for
different porous media (small, medium, and large grain diameters).
5.3. Critical dilution index
Appropriate measures of mixing are important to understand
and describe reactive transport in porous media. For continuous
injections, the flux-related dilution index has been shown to quantify mixing by measuring the effective volumetric flux over which a
conservative solute mass is distributed [35]. In ah two-dimensional
i
problem, the flux-related dilution index, EQ ðxÞ L2 T1 , is defined
as:
Z
EQ ðxÞ ¼ exp uðx; yÞ pQ ðx; yÞ ln½pQ ðx; yÞdy
ð11Þ
where pQ ðx; yÞ is the hflux-related
probability density function of a
i
conservative species LT2 :
pQ ðx; yÞ ¼ R
cðx; yÞ
:
uðx; yÞ cðx; yÞdy
ð12Þ
In an attempt to extend this concept to reactive transport, Chiogna
et al. [46] defined the critical dilution index which quantifies the
amount of mixing necessary to degrade a reactive plume. Therefore,
for a reactive steady-state plume, the critical dilution index is defined as EQ ðx ¼ LÞ, where L is the length of the plume and the reference conservative tracer used to compute EQ has the same mass flux
and diffusive properties as the reactant A and is transported in the
same velocity field.
Here, we test the hypothesis that, for reactive compounds continuously injected in parallel in porous media, scenarios with the
same stoichiometry and source flux conditions will require the
same amount of mixing to completely degrade a contaminant
plume and, thus, have the same critical dilution index. Using the
reactive transport results, we compute the critical dilution index
for a range of flow velocities for the three pore-scale porous media:
small, medium, and large grains. Fig. 8 shows the critical dilution
index computed for the scenarios whose plume lengths are within
the porous medium domain. For each flow scenario, where the
source flux is the same, the critical dilution index is also the same.
This means that while the plume lengths are different for different
porous media due to the impact of grain size on transverse dispersion, the amount of mixing that takes place to reach those plume
lengths (i.e., the amount of mixing to degrade the reactive plume)
is the same; thus, this confirms the above-stated hypothesis.
6. Conclusions
In this work, we provide an extensive analysis of conservative
and reactive transport, controlled by transverse mixing, across a
9
range of relevant groundwater flow velocities in order to determine the impact of transverse dispersion parameterization on
the ability to make accurate transport predictions.
The pore-scale conservative tracer results for the randomlypacked porous media provide further evidence of the validity of
nonlinear parameterization of transverse dispersion with an improved agreement with previous laboratory experiments. The nonlinear parameterization is capable of capturing the effect of
incomplete mixing in the pore channels, which is critical in determining the amount of reactions that may occur in the domain. The
linear parameterization of Dt does not capture this effect. Furthermore, our tracer tests indicate that in the framework of a linear
model of Dt , the transverse dispersivity is not constant for a given
porous medium but depends on both flow conditions and diffusive
properties of the species.
Our pore-scale modeling and experimental results clearly show
that the nonlinear parameterization of transverse dispersion based
on conservative tracer data can be directly applied to accurately
predict reactive transport. For both product mass flux and reactant
plume lengths, the nonlinear parameterization of transverse dispersion consistently provides a very good prediction across a range
of relevant groundwater flow velocities. Both the pore-scale simulations and the laboratory experiments of reactive transport show
steady-state plume lengths increasing with the square root of the
mean flow velocity. This result is predicted by using the nonlinear
Dt parameterization in a continuum model, whereas the linear Dt
parameterization predicts an asymptotic (constant) plume length
with increasing velocity.
Moreover, our results provide extensive evidence of the limitations of using a linear model of transverse dispersion for predicting
reactive transport. In contrast to predictions using our parameterization, using the classical linear parameterization of Dt could not
consistently predict either product mass fluxes or plume lengths
with great accuracy. The adequacy of the linear parameterization
of Dt is constrained to the specific flow conditions at which the tracer test was performed and to the specific diffusive properties of
the selected tracer. Thus, the linear parameterization of Dt assuming a constant dispersivity has limited predictive capability and
should be used with caution in both conservative and reactive
transport contexts.
Both the conservative and reactive transport results illuminate
the critical role of molecular diffusion. Diffusive processes occur
at the small-scale of a pore channel but, as demonstrated in our
modeling and experimental investigation, are important at larger
macroscopic scales. In fact, diffusion has a significant impact on
dilution and reactive mixing and on the metrics (e.g., flux-related
dilution index and critical dilution index) used to correctly quantify these fundamental processes for the fate of solutes in the subsurface. There has been recent recognition of the nonlinear
behavior of Dt , but the adoption of a nonlinear parameterization
is still very limited in hydrogeology. The outcomes of this study
illustrate the need to account for compound-specific diffusion
and mixing limitations in parameterizing transverse dispersion,
especially if the goal is to predict reactive transport.
Acknowledgments
D.L.H. and P.K.K acknowledge funding for this research by the
National Science Foundation under project EAR-0736772, ‘‘Nonequilibrium Transport and Transport-Controlled Reactions’’. Student funding for D.L.H. from Government support and awarded
by DoD, Air Force Office of Scientific Research, National Defense
Science and Engineering Graduate (NDSEG) Fellowship, 32 CFR
168a, is also acknowledged. M.R. acknowledges the support of
the Marie Curie International Outgoing Fellowship (DILREACT project) within the 7th European Community Framework Programme.
10
D.L. Hochstetler et al. / Advances in Water Resources 54 (2013) 1–10
We thank the reviewers for their helpful comments which have
improved the manuscript.
References
[1] Steefel C, DePaolo D, Lichtner P. Reactive transport modeling: an essential tool
and a new research approach for the earth sciences. Earth Planet Sci Lett
2005;240(3–4):539–58. http://dx.doi.org/10.1016/j.epsl.2005.09.017.
[2] Ginn T, Wood B, Nelson K, Scheibe T, Murphy E, Clement T. Processes in
microbial transport in the natural subsurface. Adv Water Resour
2002;25:1017–42. http://dx.doi.org/10.1016/S0309-1708(02)00046-5.
[3] Davis G, Barber C, Power T, Thierrin J, Patterson B, Rayner J, et al. The variability
and intrinsic remediation of a BTEX plume in anaerobic sulphate-rich
groundwater. J Contam Hydrol 1999;36:265–90. http://dx.doi.org/10.1016/
S0169-7722(98)00148-X.
[4] Cirpka O, Frind E, Helmig R. Numerical simulation of biodegradation controlled
by transverse mixing. J Contam Hydrol 1999;40(2):159–82.
[5] Rolle M, Clement T, Sethi R, Di Molfetta A. A kinetic approach for simulating
redox-controlled fringe and core biodegradation processes in groundwater:
model development and application to a landfill site in piedmont, Italy. Hydrol
Process 2008;22(25):4905–21. http://dx.doi.org/10.1002/hyp.7113.
[6] Bauer R, Rolle M, Kürzinger P, Meckenstock R, Griebler C. Two-dimensional
flow-through microcosms – versatile test systems to study biodegradation
processes in porous aquifers. J Hydrol 2009;369:284–95. http://dx.doi.org/
10.1016/j.jhydrol.2009.02.037.
[7] Prommer H, Anneser B, Rolle M, Einsiedl F, Griebler C. Biogeochemical and
isotopic gradients in a BTEX/PAH contaminant plume: model-based
interpretation of a high-resolution field data set. Environ Sci Technol
2009;43(21):8206–12. http://dx.doi.org/10.1021/es901142a.
[8] Rolle M, Chiogna G, Bauer R, Griebler C, Grathwohl P. Isotopic fractionation by
transverse dispersion: flow-through microcosms and reactive transport
modeling study. Environ Sci Technol 2010;44(16):6167–73. http://dx.doi.org/
10.1021/es101179f.
[9] Haberer C, Rolle M, Liu S, Cirpka O, Grathwohl P. A high-resolution noninvasive approach to quantify oxygen transport across the capillary fringe and
within the underlying groundwater. J Contam Hydrol 2011;122(1–4):26–39.
http://dx.doi.org/10.1016/j.jconhyd.2010.10.006.
[10] Scheidegger A. General theory of dispersion in porous media. J Geophys Res
1961;66:3273–8.
[11] Bear J. Dynamics of fluids in porous media. Environmental science
series. American Elsevier; 1972.
[12] Delgado J, Carvalho J. Lateral dispersion in liquid flow through packed beds at
pe < 1400. Transp Porous Media 2001;44:165–80.
[13] Klenk I, Grathwohl P. Transverse vertical dispersion in groundwater and the
capillary fringe. J Contam Hydrol 2002;58(1–2):111–28.
[14] Olsson A, Grathwohl P. Transverse dispersion of non-reactive tracers in porous
media: a new nonlinear relationship to predict dispersion coefficients. J
Contam
Hydrol
2007;92(3–4):149–61.
http://dx.doi.org/10.1016/
j.jconhyd.2006.09.008.
[15] Chiogna G, Eberhardt C, Grathwohl P, Cirpka O, Rolle M. Evidence of
compound-dependent hydrodynamic and mechanical transverse dispersion
by
multitracer
laboratory
experiments.
Environ
Sci
Technol
2010;44(2):688–93. http://dx.doi.org/10.1021/es9023964.
[16] Bear J, Bachmat Y. A generalized theory on hydrodynamic dispersion in porous
media. In: IASH symposium on artificial recharge and management of aquifers,
Haifa, Israel, vol. 72, 1967; p. 7–16.
[17] Rolle M, Hochstetler D, Chiogna G, Kitanidis P, Grathwohl P. Experimental
investigation and a pore-scale modeling interpretation of compound-specific
transverse dispersion in porous media. Transp Porous Media
2012;93(3):347–62. http://dx.doi.org/10.1007/s11242-012-9953-8.
[18] Tosco T, Marchisio D, Lince F, Sethi R. Extension of the Darcy–Forchheimer law
for shear-thinning fluids and validation via pore-scale flow simulations.
Transp Porous Media 2012. http://dx.doi.org/10.1007/s11242-012-0070-5.
[19] Davison S, Yoon H, Martinez M. Pore scale analysis of the impact of mixinginduced reaction dependent viscosity variations. Adv Water Resour
2012;38:70–80. http://dx.doi.org/10.1016/j.advwatres.2011.12.014.
[20] Bijeljic B, Blunt M. Pore-scale modeling of transverse dispersion in porous
media. Water Resour Res 2007;43(W12S11). http://dx.doi.org/10.1029/
2006WR005700.
[21] Acharya R, Valocchi A, Werth C, Willingham T. Pore-scale simulation of
dispersion and reaction along a transverse mixing zone in two-dimensional
porous media. Water Resour Res 2007;43(W10435). http://dx.doi.org/
10.1029/2007WR005969.
[22] Willingham T, Werth C, Valocchi A. Evaluation of the effects of porous media
structure on mixing-controlled reactions using pore-scale modeling and
micromodel experiments. Environ Sci Technol 2008;42(9):3185–93. http://
dx.doi.org/10.1021/es7022835.
[23] Willingham T, Zhang C, Werth C, Valocchi A, Oostrom M, Wietsma T. Using
dispersivity values to quantify the effects of pore-scale flow focusing on
enhanced reaction along a transverse mixing zone. Adv Water Resour
2010;33(4):525–35. http://dx.doi.org/10.1016/j.advwatres.2010.02.004.
[24] Tartakovsky A, Tartakovsky G, Scheibe T. Effects of incomplete mixing on
multicomponent reactive transport. Adv Water Resour 2009;32(11):1674–9.
http://dx.doi.org/10.1016/j.advwatres.2009.08.012.
[25] Tartakovsky A. Langevin model for reactive transport in porous media. Phys
Rev E 2010;82. http://dx.doi.org/10.1103/PhysRevE.82.026302.
[26] Hochstetler D, Kitanidis P. The behavior of effective reaction rate constants for
bimolecular reactions under physical equilibrium. J Contam Hydrol
2013;144:88–98. http://dx.doi.org/10.1016/j.jconhyd.2012.10.002.
[27] Tartakovsky A, Redden G, Lichtner P, Scheibe T, Meakin P. Mixing-induced
precipitation: experimental study and multiscale numerical analysis. Water
Resour Res 2008;44(W06S04). http://dx.doi.org/10.1029/2006WR005725.
[28] Yoon H, Valocchi A, Werth C, Dewers T. Pore-scale simulation of mixinginduced calcium carbonate precipitation and dissolution in a microfluidic pore
network.
Water
Resour
Res
2012;48.
http://dx.doi.org/10.1029/
2011WR011192.
[29] Molins S, Trebotich D, Steefel C, Shen C. An investigation of the effect of pore
scale flow on average geochemical reaction rates using direct numerical
simulation. Water Resour Res 2012;48(W03527). http://dx.doi.org/10.1029/
2011WR011404.
[30] Liedl R, Valocchi A, Dietrich P, Grathwohl P. Finiteness of steady state plumes.
Water Resour Res 2005;31.
[31] Cirpka O, Olsson A, Ju Q, Rahman M, Grathwohl P. Determination of transverse
dispersion coefficients from reactive plume lengths. Ground Water
2006;44(2):212–21. http://dx.doi.org/10.1111/j.1745-6584.2005.00124.x.
[32] Liedl R, Yadav P, Dietrich P. Length of 3-d mixing-controlled plumes for a fully
penetrating contaminant source with finite width. Water Resour Res
2011;47(W08602). http://dx.doi.org/10.1029/2010WR009710.
[33] Cirpka O, De Barros F, Chiogna G, Rolle M, Nowak W. Stochastic flux-related
analysis of transverse mixing in two-dimensional heterogeneous porous
media. Water Resour Res 2011;47(W06515). http://dx.doi.org/10.1029/
2010WR010279.
[34] Yang A, Miller C, Turcoliver L. Simulation of correlated and uncorrelated
packing of random size spheres. Phys Rev E 1996;53(2).
[35] Rolle M, Eberhardt C, Chiogna G, Cirpka O, Grathwohl P. Enhancement of
dilution and transverse reactive mixing in porous media: experiments and
model-based interpretation. J Contam Hydrol 2009;110(3–4):130–42. http://
dx.doi.org/10.1016/j.jconhyd.2009.10.003.
[36] Olsson AH. Investigation and modeling of dispersion–reaction processes in
natural attenuation groundwater. Ph.D. thesis, Eberhard-Karls Universität of
Tübingen, Tübingen; 2005.
[37] Worch E. A new equation for the calculation of diffusion coefficients for
dissolved substances. Vom Wasser 1993;81:289–97.
[38] Kundu P, Cohen I. Fluid mechanics. 4th ed. Academic Press; 2010.
[39] Domenico P, Palciauskas V. Alternative boundaries in solid waste
management. Ground Water 1982;20(3):303–11.
[40] Srinivasan V, Clement T, Lee K. Domenico solution – is it valid? Ground Water
2007;45(2):136–46. http://dx.doi.org/10.1111/j.1745-6584.2006.00281.x.
[41] Porter M, Valds-Parada F, Wood B. Comparison of theory and experiments for
dispersion in homogeneous porous media. Adv Water Resour
2010;33(9):1043–52. http://dx.doi.org/10.1016/j.advwatres.2010.06.007.
[42] de Josselin de Jong G. Longitudinal and transverse diffusion in granular
deposits. Trans Am Geophys Union 1958;39:67–74.
[43] Saffman P. A theory of dispersion in a porous medium. J Fluid Mech
1959;6(3):321–49.
[44] Cirpka O, Valocchi A. Two-dimensional concentration distribution for mixingcontrolled bioreactive transport in steady state. Adv Water Resour 2007;30(6–
7):1668–79. http://dx.doi.org/10.1016/j.advwatres.2006.05.022.
[45] Ham P, Schotting R, Prommer H, Davis G. Effects of hydrodynamic dispersion
on plume lengths for instantaneous bimolecular reactions. Adv Water Resour
2004;27:803–13.
[46] Chiogna G, Cirpka O, Grathwohl P, Rolle M. Transverse mixing of conservative
and reactive tracers in porous media: quantification through the concepts of
flux-related and critical dilution indices. Water Resour Res 2011;47(W02505).
http://dx.doi.org/10.1029/2010WR009608.


© Copyright 2026