ABC
docz
Explore
Log in
Create new account
Download
Report
business and industrial
company
annual report
2014 Annual Report - Investors
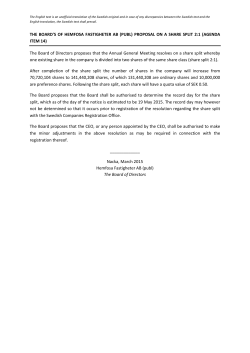
AGENDA ITEM 14
Factsheet
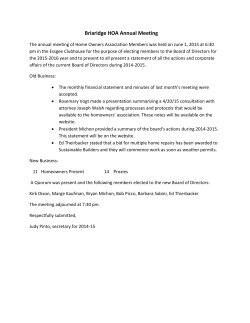
Annual Meeting.docx 05-2015 - Briaridge Homeowners Association
29 December 2014 Manager Announcements Company
IMSWorkX Elects Board of Directors
Fund Name BetaShares Australian Dividend Harvester Fund
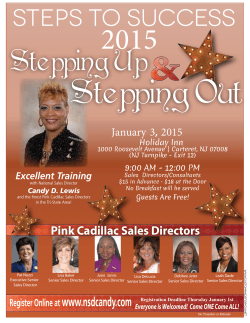
to Flyer
Gender Diversity in Boards of Directors
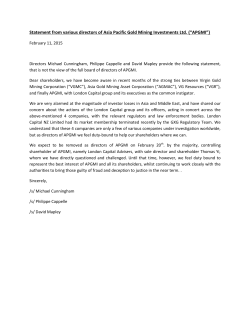
Letter to shareholders
How to Enter an Equity Order o NetX360®
© Copyright 2026
About abcdocz
DMCA / GDPR
Report