
29th Annual Conference Employee Benefits Institute
www.employeebenefitsinstitute.com 29th Annual Conference Employee Benefits Institute Thursday, April 30, 2015 Overland Park Convention Center 6000 College Blvd. Overland Park, Kansas 66211 2015 Institute Chairperson: Michelle Kelly Kansas City Southern Railway Kansas City, Missouri Co-sponsored by the Employee Benefits Institute of Kansas City, Inc. and University of Missouri-Kansas City School of Law © Copyright 2015 by Employee Benefits Institute of Kansas City, Inc. No use is permitted which would infringe the copyright. This practice manual should be cited as: 29th Annual Conference of the Employee Benefits Institute of Kansas City 29th Annual Conference of the Employee Benefits Institute Co-sponsored by the Employee Benefits Institute of Kansas City, Inc. and University of Missouri – Kansas City School of Law Continuing Legal Education Thursday, April 30, 2015 Overland Park Convention Center Overland Park, Kansas This program is approved for the following Continuing Education Credits To receive the proper credits please follow the instructions below. Continuing Legal Education Credit Kansas: Missouri: 8.0 hours – Fill out the Kansas CLE form when you leave. 8.4 hours – Self-report CLE hours directly to the Missouri Bar SHRM Credit 7.0 PDC’s – Pick up the SHRM credit certificate at the completion of the program HRCI Credit 6.25 General Hours – Pick-up the HRCI credit certificate at the completion of the program Insurance Credit Missouri General Insurance – 8.0 Kansas General Insurance – 8.0 To receive insurance credit please be sure to stop at the registration desk and **Sign-in before the program starts and Sign-out at the end of the program. For Missouri we do need your SS# or producer number to file insurance credit. Failure to provide one of these numbers may result in not receiving credit. Failure to Sign-in and Sign-out will result in no insurance credit received Enrolled Agent Credit 8.0 Hours – Sign in on the appropriate form and provide you PTIN. Credit will be filed online by the provider and a certificate sent to you. CPE/CPA credit 8.0 Hours ( 1.0 Tax & 7.0 Specialized Knowledge and Apps) To receive CPE/CPA please sign-in and sign- out on the appropriate sheets located at the registration desk. A certificate will be e-mailed to you. Employee Benefits Institute of Kansas City Scholarship In 2011, in recognition of our 25th anniversary of providing outstanding employee benefits education in Kansas City, EBI established the Employee Benefits Institute of Kansas City scholarship at the University of Missouri Kansas City School of Law. This scholarship provides books and materials for students enrolling in the Deferred Compensation course taught by Professor Chris Hoyt and attendance for the students at our annual conference. The EBI scholarship is ongoing and enhances the study of employee benefits in the Kansas City area. We offer a heartfelt thank you to all conference attendees, underwriters, and exhibitors for enabling EBI the opportunity to invest in the local employee benefits professional community. 29th Annual Conference Employee Benefits Institute April 30, 2015 We gratefully acknowledge our Sponsors: Aetna Aflac Broker Channel Arthur J. Gallagher & Co. MHM Retirement Plan Solutions OneAmerica Polsinelli PC Blue Cross Blue Shield of Kansas City Sageview Advisory Group BOK Financial Spencer Fane Britt & Browne LLP Empower Retirement Stinson Leonard Street LLP Haynes Benefits PC The Cottonwood Group LLC Humana The Newport Group Husch Blackwell LLP Towers Watson KCCBA ~ Kansas City Compensation & Benefits Association United Healthcare Lathrop & Gage LLP Lockton Companies Unum Utz,& Lattan LLC Wells Fargo Institutional Retirement & Trust 29th Annual Conference Employee Benefits Institute April 30, 2015 Exhibitors Aetna SageView Advisory Group blooom SHRM of Greater Kansas City Bukaty Companies Taben Group Cigna The Newport Group Delta Dental of Missouri The Todd Organization Empower Retirement TIAA-CREF Fidelity Investments Transamerica Retirement Solutions KCCBA ~ Kansas City Compensation & Benefits Association U.S. Bureau of Labor Statistics Manning & Napier U.S. Department of Labor Employee Benefits Security Administration Mariner Retirement Advisors UMB Healthcare Services MassMutual Retirement Services United Healthcare Lincoln Financial Group OneAmerica Purchasing Power Valic Financial Advisors Vanguard Vision Service Plan Worksite Benefit Associates 29th Annual Conference Employee Benefits Institute Thursday, April 30, 2015 Table of Contents (PAGE NUMBERS REFER TO THE NUMBER LOCATED IN THE UPPER RIGHT CORNER OF THE PAGE.) THE DC BUZZ REPORT ...................................................................................................................................... 1 Presenter: Tami Simon, Buck Consultants LLC, A Xerox Company BEHAVIORAL FINANCIAL WELLNESS ........................................... Material not available at time of printing Presenter: Peter Dunn, Pete the Planner A. SPECIALTY DRUGS TREND: SOLUTIONS AND STRATEGIES TO MANAGE ................................................ 25 Presenter: Jason Dohm, Express Scripts B. RETIREMENT PLAN TARGET DATE FUNDS ................................................................................................ 41 Presenter: Anna Rathbun, CBIZ Retirement Plan Services ERISA ENFORCEMENT UPDATE ................................................... Material not available at time of printing Presenter: Tim Hauser, Deputy Assistant Secretary for Program Operations – Employee Benefits Security Administration C. PRIVATE HEALTHCARE EXCHANGES PANEL ........................................................................................... 61 Moderator: Jim Overman, Hallmark Cards Panelists: Tresia Franklin, Hallmark Cards Jill Korsh, Deloitte Consulting LLP Julie Adamik, Mercer D. BEST PRACTICE FEE DESIGN AND DISCLOSURE FOR QUALIFIED RETIREMENT PLANS ....................... 81 Presenter: Paul Staples, Summit Strategies Group E. TOTAL HEALTH MANAGEMENT EMPLOYER PANEL ............................................................................... 87 Moderators: Melissa Haskins, Mercer Matt Smith, Humana Panelists: Candice Gwin, MS Children’s Mercy Hospital and Clinics Jana Goolsby, City of Olathe Haley Akin, Garmin International F. RETIREMENT FOR REAL: LESSONS LEARNED FROM TEN YEARS OF RETIREMENT PERSPECTIVE ..................................................................................................................................... 169 Presenters: Deb Rosenberg, Stiles Financial Services, Inc. Katie B. Lewis, Retired Consultant and Educator HEALTHCARE STRATEGIES DISCUSSION WITH EXECUTIVE VICE PRESIDENT, CONAGRA FOODS, INC. . 189 Facilitator: Rick Kahle, Lockton Companies Presenter: Nicole Theophilus, Executive Vice President, ConAgra Foods, Inc. 1 Spring Fever: Blossoming Benefits Buzz Tami Simon, JD April 30, 2015 Agenda • • Beltway Buzz – The year ahead for health plans – ACA – Tax reform – The year ahead for retirement plans – Blooming opportunities What employers are buzzing about: Getting beyond the tactical – Future workforce strategy – +A number speaks 1,000 words – Do you have a people strategy? – The multi-generational workforce – Financial wellness – Engagement The information contained in this presentation and any accompanying documents does not constitute legal advice; consult with your legal and tax advisors before applying this information to your specific situation. 2 April 30, 2015 Proprietary 1 2 Beltway Buzz The Year Ahead for Employer-Sponsored Health Plans and the ACA • The Affordable Care Act will continue to dominate the Congressional agenda – Possible exception is wellness program legislation—although, legislation not likely until after the EEOC issues guidance – Rumor that GINA guidance will also be coming soon • Two types of ACA legislation and a significant court case lie ahead − Full ACA repeal attempts—unlikely to pass the Senate − Technical modifications/targeted repeal—e.g., H.R. 30 − Would revise the ACA’s definition of full time employee (from 30 to 40 hours per week) − Passed the House of Representatives; could not attract enough votes in the Senate to avoid filibuster − President Obama threatened to veto the legislation − King v. Burwell 4 April 30, 2015 Proprietary 2 3 Affordable Care Act—The King Case The Supreme Court is likely to issue a decision in King v. Burwell in June • Case challenges the availability of tax credits for the purchase of health coverage in the 34 federal marketplace states • A decision disallowing the credits would likely disrupt the individual markets in those states Legislative response? • Congress and the White House would probably try to reach a legislative solution – although if a solution is not reached by the end of 2015, the decision and its consequences would probably become part of the 2016 presidential election • The House and Senate are likely to unveil proposed legislation in May or June that would respond to a possible adverse decision in King 5 April 30, 2015 Proprietary Prospects for Tax Reform in 2015 Tax reform is unlikely to pass the finish line this year • Both sides are looking for common ground for a policy victory • Neither, however, is likely to agree to the other’s general goals for tax reform • Tax reform is still important to watch: legislation is iterative; and individual provisions that raise money may be recycled for other legislation 6 April 30, 2015 Proprietary 3 4 Employee Benefits in Tax Reform Favorable tax rules for employee benefits are likely to be viewed as a source for revenue • The tax exclusions for employer provided retirement and health coverage are among the largest tax expenditures according to CBO and JCT • Retired Chairman Dave Camp (R-MI) released a tax reform plan in 2014 that gives an example of the types of possible changes for employee benefits − Roth treatment of 401k contributions in excess of half of the contribution limit - $144 billion − Freezing retirement plan contribution and benefit limit COLAs for ten years - $63 billion − Stricter rules on when nonqualified deferred compensation is recognized as income and restrictions on deductions for top executive pay - $25 billion 7 April 30, 2015 Proprietary The Year Ahead for Retirement Plans Legislative areas to watch in 2015 for retirement plans 1. Multiemployer pension plan legislation 2. PBGC premium hikes 3. Revenue needs 4. Senator Orrin Hatch’s reform proposal 8 April 30, 2015 Proprietary 4 5 Blooming Opportunities • “Must-pass legislation” may provide an opportunity to include proposals that would otherwise be filibustered or vetoed • Appropriations legislation to fund the federal government for FY 2016; must be passed by October 1, 2015 to avoid a shutdown • Possible benefits/employment provisions: ‒ ACA’s definition of full-time employee (raising from 30 to 40 hours) ‒ NLRB “quickie” election rules ‒ DOL’s proposed fiduciary rules 9 April 30, 2015 Proprietary What Employers are Buzzing About: Getting Beyond the Tactical 5 6 Considerations for Future Workforce Strategy Top trends impacting workforce strategy • Millennials and GenZ entering the workforce • Globalization of labor supply • Difficulty recruiting employees with base-level skills Challenges building a workforce that meets future needs • Low level employee longevity and loyalty • Limited access to adequate technology • Lack of qualified leadership ©2014. SAP/SuccessFactors/Oxford Analytics. All rights reserved. “Used with permission of SAP SE” 11 April 30, 2015 Proprietary Forecast of the World Population for 2100 By Continent 2100* 0 500 1000 1500 2000 2010 Population in millions 2500 3000 3500 4500 5000 4,712 Asia 4,165 4,185 Africa 1,031 639 Europe 740 467 South America 394 513 North America 347 228 Central America Oceania 4000 161 70 37 • Note: Worldwide; 2010 • Source: United Nations; ID 272789 12 April 30, 2015 Proprietary 6 7 Employment Rate by Age and Country Employment Rate by Age Group, % in Same Age Group - 2014 100 90 80 70 60 50 40 30 20 10 0 15-24 year olds 13 25-54 year olds 55-64 year olds Proprietary April 30, 2015 Global Age Watch Index Overall Ranking in 2014 100 93.4 90 88.3 87.9 87.5 86.3 86 80 85.3 83.5 82.6 80.7 80.1 77.6 76.1 76 75.8 Ranking value 70 60 50 40 30 20 10 0 • Note: Worldwide. • Source: Global AgeWatch Index; HelpAge; ID 274462 14 April 30, 2015 Proprietary 7 8 Do you have a people strategy? • • • Does your workforce help your organization meet its business goals? Do you have an overarching people strategy that is the north star for all HR, compensation and benefit strategies? Did you make workforce changes because of the ACA? – Avoid benefit obligations by restructuring jobs – Re-organize, re-design, or re-deploy people / work / jobs / functions to avoid or mitigate benefit obligations – Consider impact on associate value proposition and related messaging 15 April 30, 2015 Proprietary The Multi-Generational Workforce Generation Core Values & Perception of Work Career Key Motivators Communication Work Environment • Dedication and selfsacrifice • Experience is the best teacher • Respect authority • Obligation • Loyal • Respect for experience • Top-down • Formal and written • Conformity, blending, unity … team • “We first” mentality • Work is an anchor • Workaholic • Competitive • Personal growth and involvement • Opportunity • Feeling valued and needed • Person-to-person • Success is visible; trophies, plaques, certificates, etc. • Fun and informality (success on own terms) • Contractual • Freedom to innovate • Autonomy • Direct and immediate Gen X (born 19651979) • Concerned about work/life navigation • Do not automatically comply with leaders • Make decisions, evaluate risks and manage dilemmas • Eager to experiment and work as a team to solve problems • Prefer to avoid difficult people rather than engaging them constructively • May or may not desire long-term employer relationships • Decrease in career ambition in favor of more family time, and less travel/pressure • Flexible and persistent • Social • Means to an end Gen Y/ Millennial (born 19802000) • Engaging with bright, creative people • Voice and email • Want a lot of feedback • Desire flexible work arrangements • Believe work output should be evaluated, now how it’s done • Highly skilled in social networking and team activities Matures (born 19091945) Baby Boomers (born 19461964) * Adapted, in part, from Capital H Group 16 April 30, 2015 Proprietary 8 9 Aligning Total Rewards by Generation Compensation Benefits • Matures and Baby Boomers are more interested in traditional compensation forms • Gen X and Y want market competitive compensation balanced with non-traditional rewards • Organizations should be creative with the design of their benefits/compensation programs and policies (flexible schedules, telecommuting, tuition reimbursement, development, etc.) – enabling choice Work Environment Training and Development • Gen X and Y desire a fun, social and informal work environment, rely on technology and direct communications • Mentoring programs are a “win – win” • Office space should respect older generations but encourage collaboration by all generations • Technology and cultural norms encourage face-toface and electronic communications to foster collaboration and minimize frustration and misunderstanding • Matures weight experience and longevity heavily with support from formal training programs • Baby boomers believe they will get ahead if they work hard • Gen X and Y tend to be more team based and interested in innovative problem solving • Developmental assignments and team initiatives should be cross-generational; programs should capitalize on the experience and hard work of matures and boomers 17 April 30, 2015 Proprietary Financial Wellness is All The Buzz • • • • What is your role in helping employees successfully save for retirement (should be consistent with your people strategy)? Health care spending affects retirement savings…are you making that link for your employees? Will executive retirement benefits need realignment? As healthcare continues to move toward a defined contribution approach, what will be the interplay with defined contribution retirement savings? 18 April 30, 2015 Proprietary 9 10 How do you socialize? 19 April 30, 2015 Proprietary Additional Resources 10 11 Resources Resources on http://www.services.xerox.com/hr-consulting Go to: • Research and insights > FYI • Research and insights > Legislate • Research and insights> Podcasts • Research and insights > Surveys 21 April 30, 2015 Proprietary Questions 11 12 Contact Information Tami Simon, JD Managing Director, Knowledge Resource Center Managing Director, Career Practice Buck Consultants LLC, A Xerox Company 1800 M Street NW, Suite 502N Washington, DC 20036 202.962.7832 [email protected] The information contained in this presentation and any accompanying documents does not constitute legal advice; consult with your legal and tax advisors before applying this information to your specific situation. 23 April 30, 2015 Proprietary ©2014 Xerox Corporation and Buck Consultants, LLC. All rights reserved. Xerox® and Xerox and Design® are registered trademarks of Xerox Corporation in the United States and/or other countries. Buck Consultants® is a registered trademark of Buck Consultants, LLC in the United States and/or other countries. 12 13 Volume 6 | Issue 15 | April 17, 2015 Healthcare Focus of Returning Congress; Legislative Fixes to NLRB Election Rule Proposed Congress returned from its spring recess this week, and three congressional panels held hearings on the impact of the Affordable Care Act on taxpayers, employers and IRS operations. Medicare legislation was passed by Congress and is expected to be signed into law by the president. Also, labor committee chairs unveiled legislation that would significantly alter the NLRB’s new union representation election rules that took effect earlier this week. In this article: Healthcare | Labor and Employment Healthcare Congressional panels held three hearings this week examining the impact of the Affordable Care Act (ACA) on taxpayers, employers and IRS operations: Workplaces. A subcommittee of the House Education and the Workforce Committee heard testimony on the impact of the ACA on workplaces. Several business owners testified that the employer shared responsibility provisions of the reform law are limiting their hiring plans and creating onerous recordkeeping burdens. One business owner focused on costs added by ACA fees and mandates — such as the PCORI fee and the requirement to cover adult children until age 26 — and also expressed concern that a large number of employers would be subject to the excise tax on high-cost plans (the “Cadillac” tax, effective in 2018). The business owner also expressed concern about the reform law’s definition of full-time employee — noting that employers do not typically consider an employee who works 30 hours per week to be full-time. One trade organization focused on the excise tax and increased costs — for example, testifying that the tax is projected to apply to 17% of all US businesses in 2018, including 38% of large employers. In contrast to the other witnesses, one small business owner testified that the ACA has stabilized its insurance premiums and offered more options for coverage. Individual mandate and employer shared responsibility. A subcommittee of the House Ways and Means Committee held a hearing on the shared responsibility provisions of the ACA for individuals and employers. One policy expert testified that repealing the individual mandate could lower premium costs (if combined with other reforms, such as repealing the 3:1 age rating restriction that applies to coverage in the individual market) and that provisions applicable to employers will lead to slower job growth and greater reliance on part-time workers. Another . 1 14 Volume 6 | Issue 15 | April 17, 2015 expert highlighted the rationales behind various ACA requirements and the cost of repeal. For example, the witness observed that the employer shared responsibility requirement is designed to maintain the existing system of employer-provided coverage and discourage employers from dropping coverage — and that repealing the requirement is estimated to increase the uninsured population by up to one million and reduce government revenues by $150 billion. A small business owner in the fast food industry testified that his premiums for employer-provided coverage have risen 60% over the last four years (single coverage now costs $6,400 annually and family coverage is $19,200), and only 4% of hourly staff have actually enrolled in coverage. IRS operations. The Senate Homeland Security and Governmental Affairs Committee heard testimony from IRS Commissioner John Koskinen on the ACA’s impact on IRS operations. The commissioner testified that despite significant IRS budget cuts ($1.2 billion in reduced funding over the last five years), the IRS has performed reasonably well during the 2015 tax return filing season — the first year in which the individual mandate and the premium tax credits for public marketplace coverage were effective. The commissioner noted that prior to the filing season, the IRS worked with the tax return industry to update tax filing software to reflect new ACA rules, since 91% of tax filers use this type of software to prepare their returns. The commissioner noted that during the filing season, the ACA section of the IRS’ website has had more than 4.4 million visits and the IRS’ automated ACA telephone line has played more than 300,000 recordings. Medicare legislation passes Congress On Tuesday, the Senate passed (92 to 8) H.R. 2 — the Medicare Access and CHIP Reauthorization Act of 2015. Since the House passed the legislation several weeks ago, H.R. 2 heads next to the president — who is expected to sign it. The legislation would change how physicians are reimbursed under Medicare and would provide a two year extension of the Children’s Health Insurance Program (CHIP). As a partial offset to its cost, the legislation contains two provisions that would impact Medicare enrollees in 2018 and 2020: Income-related premium adjustments. Effective in 2018, enrollees in two income brackets would pay higher Medicare Part B and D premiums. Enrollees with income between $133,500 and $160,000 (doubled for a couple) would pay 65% of the premium (up from 50%), and enrollees with income above $160,000 to $214,000 (also doubled for a couple) would pay 80% of the premium (up from 65%). Medigap policies. Beginning in 2020, Medigap policies issued to newly eligible Medicare beneficiaries would be prohibited from covering the Medicare Part B deductible. Note that this change does not apply to employer-sponsored coverage for employees and retirees. H.R. 2 would also repeal information reporting that was originally designed to enforce Medicare’s secondary payor rules. Under these reporting rules, employers are required to respond to questionnaires from HHS seeking identification of Medicare beneficiaries with group health coverage. This reporting is no longer necessary since group health plans now directly report individuals with group health plan coverage to Medicare. Congressional staff prepared a section-by-section explanation of H.R. 2. Labor and Employment Labor committee chairs in both the House and Senate proposed a legislative response this week to the NLRB’s socalled “quickie” or “ambush” election rule that took effect on April 14. The new union election rule significantly alters how the NLRB administers representation elections. Earlier congressional efforts to disapprove the rule before it took 2 15 Volume 6 | Issue 15 | April 17, 2015 effect and block its implementation met with a presidential veto. (Please see our February 13, March 6, March 20, and April 2, 2015 editions of Legislate for more information on the new NLRB rule and the veto of S.J.Res. 8. See also our April 6, 2015 For Your Information on the veto.) Two bills were introduced in the House on Tuesday that would roll back certain key provisions of the NLRB’s new union election procedures — H.R. 1768 (the Workforce Democracy and Fairness Act) and H.R. 1767 (the Employee Privacy Protection Act). Companion legislation for both bills (S. 933) was introduced in the Senate to amend the National Labor Relations Act with respect to the timing of elections, pre-election hearings, and the identification of pre-election issues, and to require that lists of eligible voters be provided to the NLRB. H.R. 1768 would: Prohibit union representation elections from taking place in less than 35 days after the filing of an election petition (the new NLRB rules would permit elections in as few as 11 days) Provide employers with at least 14 days after the filing of a petition to prepare for a hearing before the NLRB, and would allow employers to raise relevant and material pre-election issues — including unit appropriateness, the NLRB’s jurisdiction, and other issues that reasonably could be expected to impact the outcome of the election — at any time prior to the close of the hearing Require the NLRB to rule on critical issues before certifying the results of a representation election — such as voter eligibility and the composition of the bargaining unit H.R. 1767 would require an employer to provide a list of the names of eligible voters and not more than one additional form of personal contact information no earlier than seven days after the Board’s final determination of the appropriate bargaining unit. The bill would require workers to choose in writing the personal contact information (e.g., telephone number, email address, or mailing address) that would be given to union representatives. Passage of these bills is likely if they are brought up for a vote. Because they would significantly alter the NLRB’s new union election rule, the president would almost certainly veto the legislation. Enactment might be possible, however, if the bills are included as part of must-pass legislation later in the year — such as appropriations legislation funding the federal government for FY 2016 (which must be passed by September 30, 2015 to avoid a government shutdown). 3 16 Volume 6 | Issue 15 | April 17, 2015 Authors Drew Crouch, JD, LLM Nancy Vary, JD Produced by the Knowledge Resource Center of Buck Consultants at Xerox The Knowledge Resource Center is responsible for national multi-practice compliance consulting, analysis and publications, government relations, research, surveys, training, and knowledge management. For more information, please contact your account executive or email [email protected]. You are welcome to distribute Legislate® publications in their entireties. To manage your subscriptions, or to sign up to receive our mailings, visit our Subscription Center. This publication is for information only and does not constitute legal advice; consult with legal, tax and other advisors before applying this information to your specific situation. ©2015 Xerox Corporation and Buck Consultants, LLC. All rights reserved. Xerox® and Xerox and Design® are trademarks of Xerox Corporation in the United States and/or other countries. Buck Consultants® and Legislate® are trademarks of Buck Consultants, LLC in the United States and/or other countries. BR 11291 4 17 Volume 6 | Issue 12 | March 27, 2015 Buck Consultants on Capitol Hill; House and Senate Pass Budget Resolutions This week, Buck Consultants — a Xerox Company — testified on Capitol Hill about the need for consistent federal guidance on wellness programs. The hearing also featured testimony on legislation that would bring more transparency to EEOC enforcement actions and provide a safe harbor for employers to use criminal background checks as required by federal, state, or local law. Both chambers of Congress also passed budget resolutions this week, and held hearings on the Obama Administration’s FY 2016 employment and labor budget request. The House also passed Medicare legislation that would increase premiums for certain enrollees and limit benefits paid by Medigap plans. In this article: Healthcare | Retirement | Labor and Employment Healthcare Wellness programs and changes to Medicare were the focus in Congress this week. Wellness Programs Tami Simon testified on March 24 before a congressional committee on the need for legislation or clear EEOC guidance on wellness programs. Tami is the Managing Director of the Knowledge Resource Center and the Career practice at Buck Consultants — a Xerox Company. Tami testified before the Workforce Protections Subcommittee of the House Education and the Workforce Committee on behalf of the American Benefits Council — of which Buck Consultants is a member. Collectively, the Council’s members either sponsor directly or provide services to employee benefit plans that cover more than 100 million Americans. ACA Turns 5 The Affordable Care Act (ACA) turned five on Monday — March 23, 2015. The Senate Finance Committee held a hearing marking this anniversary — with Republicans criticizing the reform law’s rollout and impact on businesses, and Democrats celebrating the insurance market reforms and health coverage expansions. Tami’s key message for members of Congress was that inconsistent federal regulation is threatening the sustainability of employer sponsored wellness programs. The EEOC has recently initiated enforcement actions against several such programs — alleging that the use of rewards and incentives to encourage participation in the . 1 18 Volume 6 | Issue 12 | March 27, 2015 programs violates the Americans with Disabilities Act (ADA). These actions also allege that wellness programs that collect genetic information violate the Genetic Information Nondiscrimination Act (GINA). The EEOC lawsuits have had a chilling effect on employersponsored wellness programs. Tami testified in support of H.R. 1189—the Preserving Employee Wellness Programs Act of 2015. Among other changes, the legislation would provide that: The use of rewards and incentives by a wellness program does not violate the ADA — as long as the program satisfies HIPAA’s requirements for health-contingent programs. The collection of information about a disease or disorder of a family member shall not be considered a violation of GINA for another family member participating in the wellness program. What are the prospects for H.R. 1189? It remains to be seen. The EEOC has announced that it will issue guidance in the near future on the application of the ADA and GINA to wellness programs (see our FYI Alert from March 23, 2015 for more information on the EEOC announcement). Congress is likely to wait to see the content of the EEOC guidance before legislating in this area. Medicare The House passed legislation on Thursday (H.R. 2 — the Medicare Access and CHIP Reauthorization Act of 2015) that would change how physicians are reimbursed under Medicare. As a partial offset to its cost, the legislation contains two provisions that would impact Medicare enrollees: Income-related premium adjustments. Effective in 2018, enrollees in two income brackets would pay higher Part B and D premiums; enrollees with income between $133,500 to 160,000 (doubled for a couple) would pay 65% of the premium (up from 50%); and enrollees with income between $160,000 to 214,000 (also doubled for a couple) would pay 75% of the premium (up from 65%). Medigap policies. For newly eligible enrollees beginning in 2020, Medigap policies would be prohibited from covering the Part B deductible. Note that this change does not apply to employer-sponsored coverage for employees and retirees. The legislation would also extend the Children’s Health Insurance Program (CHIP) for an additional two years. Congressional staff have prepared an overview and section-by-section explanation of H.R. 2. While the legislation faces an uncertain future in the Senate — for example, Democrats on the Senate Finance Committee have expressed concern with various aspects of the legislation, the White House has expressed its support. Yesterday’s vote in the House (392 to 37) also revealed significant bipartisan support for H.R. 2 — with 212 Republicans and 180 Democrats voting for the bill’s passage. Retirement For retirement plans, this week’s budget debate in Congress (see sidebar discussion below for more information on the legislation) was notable because there were no new revenue provisions included in the budget legislation to offset the cost of federal spending — for retirement plans or any other deep pockets. A PBGC premium hike and new rules liberalizing when Roth conversions may be made within 401(k) plans were paired with federal budget legislation in the past several years because the provisions raise revenue. (Please see our January 4, 2013 and December 20, 2013 editions of Legislate for more information.) 2 19 Volume 6 | Issue 12 | March 27, 2015 Budget resolutions pass Congress The House passed a budget resolution for FY 2016 on Wednesday — H.Con. Res. 27. The Senate passed its budget resolution (S.Con. Res. 11) today. The resolutions are noteworthy for two reasons. First, they allow reconciliation procedures to be used to repeal and replace the ACA. (Please see our November 25, 2014 and January 16, 2015 editions of Legislate for more information on using the reconciliation process to change the ACA.) Second, the budget resolutions set the top line spending limits for FY 2016 so that the appropriations committees can draft legislation funding the federal government. Appropriations legislation must be enacted before October 1, 2015 to avoid a federal government shutdown. It’s possible that non-budget related provisions may be attached to government funding legislation — such as changes to the ACA. More detail will be available this summer as the appropriations committees draft government funding legislation. Note that Senate procedural rules permit a wide variety of amendments to be considered as part of the budget debate. For example, on Thursday, Senators approved the following amendments to the budget resolution: Sick leave: Approved 61 to 39, the amendment (SA 798) offered by Senator Patty Murray (D-WA) would expand access to paid sick leave by allowing workers to earn seven days of paid leave annually. Pregnancy discrimination: Approved 100 to 0, the amendment (SA 632) offered by Senator Bob Casey (DPA) would prohibit employment discrimination against pregnant women and require employers to offer workplace accommodations. Equal pay: Approved 56 to 43, the amendment (SA 409) offered by Senator Deb Fischer (R-NE) would promote equal pay and prevent retaliation against employees for seeking or discussing wage information. Same-sex spousal privileges: Approved 57 to 43, the amendment (SA 1063) offered by Senator Brian Schatz (D-HI) would ensure that all legally married spouses have access to Social security and veterans benefits after the death of their spouse. Healthcare: Approved 56 to 44, the amendment (SA 692) offered by Senator Tim Scott (R-SC) would increase disclosure of any tax related to the healthcare overhaul as part of health insurance monthly statements. Definition of full-time: Approved unanimously, the amendment (SA 442) offered by Senator Susan Collins (RME) would restore a “sensible” definition of full-time employee for purposes of the ACA. Even though approved, these budget amendments do not have the force of law and require separate legislation to be enacted. Labor and Employment Legislation affecting the EEOC and the president’s FY 2016 budget proposal were the focus of Congress this week for labor and employment. EEOC In addition to considering wellness programs, Tuesday’s hearing in the Workforce Protections Subcommittee also featured testimony on H.R. 548, H.R. 549, and H.R. 550 — three bills that would change the procedures under which the EEOC commences lawsuits involving multiple plaintiffs or systemic discrimination, provide greater transparency 3 20 Volume 6 | Issue 12 | March 27, 2015 on court cases brought by the EEOC and require the EEOC to conciliate in good faith before bringing suit, and permit employers to use criminal background checks if required by federal, state or local law. (See our February 20, 2015 Legislate for more information on these bills.) Much of the testimony and questioning during the portions of the hearing on these three bills focused on criminal background checks. One witness advocated for greater restriction on employer use of criminal background checks, citing the disparate impact on racial minorities given current arrest rate statistics and concerns over stereotyping individuals as unemployable for arrests or convictions that occurred many years ago. Other witnesses questioned restrictions on employer use of background checks and an employer’s discretion to make employment decisions — noting that employers are in the best position to judge which ex-offenders are suitable for their jobs. Administration’s Budget Request A subcommittee of the House Appropriations Committee held a hearing Tuesday on the FY 2016 budget request for the NLRB featuring the agency’s Chairman Mark Pearce and General Counsel Richard Griffin, Jr. The testimony revealed that about 80% of the agency’s budget is for personnel compensation, 10% for rent and security, and 10% for everything else — such as technology expenses. Lawmakers took the opportunity to question the witnesses about the NLRB’s “quickie” election rule — the subject of a joint resolution (S.J. Res. 8) Congress approved last week to block its implementation. (See our March 20, 2015 Legislate for more information on the resolution.) Other questioning focused on the NLRB’s joint-employer standard, its Specialty Healthcare decision, and its recent effort to exert jurisdiction over Indian tribes. A subcommittee of the Senate Appropriations Committee held a hearing Thursday on the DOL budget request for FY 2016, which includes a request for $13.2 billion in discretionary funding and an increase of $41.5 billion in new mandatory spending. (See our February 6, 2015 Legislate for more information on the FY 2016 budget proposed by the White House.) DOL Secretary Thomas Perez testified that the agency is being more strategic about enforcement of wage violations, workplace safety, and protecting worker retirement savings — noting that $1.9 billion was requested in the president’s FY 2016 budget proposal for worker protection agencies. This includes an increase of over $31 million for the Wage and Hour Division — which Secretary Perez said will allow WHD to focus on industries that employ vulnerable workers and are most likely to violate worker protection laws such as minimum wage, overtime, and FMLA rights. Last week, Secretary Perez testified in budget hearings before two House committees. (See our March 20, 2015 Legislate for more information on those hearings.) 4 21 Volume 6 | Issue 12 | March 27, 2015 Authors Drew Crouch, JD, LLM Sharon Cohen, JD Nancy Vary, JD Produced by the Knowledge Resource Center of Buck Consultants at Xerox The Knowledge Resource Center is responsible for national multi-practice compliance consulting, analysis and publications, government relations, research, surveys, training, and knowledge management. For more information, please contact your account executive or email [email protected]. You are welcome to distribute Legislate® publications in their entireties. To manage your subscriptions, or to sign up to receive our mailings, visit our Subscription Center. This publication is for information only and does not constitute legal advice; consult with legal, tax and other advisors before applying this information to your specific situation. ©2015 Xerox Corporation and Buck Consultants, LLC. All rights reserved. Xerox® and Xerox and Design® are trademarks of Xerox Corporation in the United States and/or other countries. Buck Consultants® and Legislate® are trademarks of Buck Consultants, LLC in the United States and/or other countries. BR11291 5 22 Volume 38 | Issue 57 | April 17, 2015 Long-Awaited EEOC Wellness Regulations Released The EEOC has issued proposed regulations that describe ADA requirements for compliant employer wellness programs. The regulations also address the interaction of the HIPAA wellness program rules, amended by the Affordable Care Act, and the ADA — a source of confusion for employers. Generally, the regulations provide that incentives can be offered to employees as long as they meet certain criteria and the maximum incentive offered under an employer’s group health plan is not more than 30% of the total cost of employee-only coverage. This limitation applies to the program generally, regardless of whether it is participatory, healthcontingent, or some combination. While questions remain, these regulations are a step in the direction of creating a more consistent legal framework for employer wellness programs. Final rules will be published after public comments are reviewed by the EEOC. Background Title I of the Americans with Disabilities Act (ADA), which is enforced by the Equal Employment Opportunity Commission (EEOC), prohibits employment discrimination on the basis of disability. Among other things, the ADA restricts when an employer may make disability-related inquiries (e.g., health risk assessments) or require medical examinations (e.g., biometric screenings) unless they are job-related and consistent with business necessity. However, the ADA makes an exception for certain wellness programs. An employer may make disability-related inquiries or conduct medical examinations that are part of a voluntary wellness program (provided medical records are kept confidential and separate from personnel records). Under EEOC enforcement guidance, a wellness program is considered “voluntary” if the employer neither requires participation nor penalizes employees who do not participate. This provision and the lack of definitive guidance from the EEOC has been the subject of controversy for a number of years. In recent months, the EEOC’s regional attorney in the Chicago District Office filed three law suits, alleging that penalties imposed on employees who declined to participate in their employers’ wellness programs violated the ADA. (See our October 30, 2014 and November 4, 2014 FYI Alerts.) Congress has also introduced bills and held hearings focused on clarifying the standards that apply to employer wellness programs. Venting frustrations with litigation and the lack of guidance, some politicians suggested that Congress might act in the absence of EEOC guidance. (See our March 27, 2015 Legislate.) While consistently listed on the EEOC’s regulatory agenda, until now, the agency had failed to issue decisive guidance on financial incentives associated with wellness programs. (See our March 23, 2015 FYI Alert.) 1 23 Volume 38 | Issue 57 | April 17, 2015 Proposed Regulations The proposed regulations amend the existing regulations and interpretive guidance. They discuss ADA compliance and the extent to which employers can offer employees incentives to promote participation in wellness programs that include disability-related inquiries and/or medical examinations. The EEOC adopts the overarching theme endorsed in the ACA (through the HIPAA regulations) that a wellness program must promote health or prevent disease and cannot be subterfuge for discrimination. To that end, the EEOC attempts to reconcile the role of the ADA to limit employer access to an employee’s medical information with the ACA’s goal of promoting wellness. Among other things, the proposed regulations: Define “employee health program” Describe what it means for an employee health program to be voluntary Indicate what incentives employers can offer as part of a voluntary employee health program Outline notice and confidentiality requirements More specifically, the proposed regulations maintain that an employer can make disability-related inquiries and/or conduct medical examinations under a voluntary wellness program. In defining a voluntary program, the regulations provide that incentives, offered under a group health plan to promote participation in a wellness program, can be offered to employees as long as participation is not required, and nonparticipating employees are neither denied coverage under any employer group health plan or benefits package, nor subject to any adverse employment action (e.g., retaliation). For programs provided under the group health plan, an employer can offer incentives up to 30% of the total cost of employee-only (aka self-only) coverage, whether in the form of a reward or penalty. Additionally, the employer must provide employees with a notice that describes the medical information that will be collected, with whom it will be shared, how it will be used, and how it will be kept confidential. The proposed regulations include special rules for smoking cessation programs. A smoking cessation program that only asks employees if they use tobacco (e.g., an honor system) would not be considered an employee health program that includes disability-related inquiries or medical examinations, and would not be subject to the EEOC incentive limitation. However, a biometric screening or other medical examination that tests for the presence of nicotine or tobacco is a medical examination and the financial incentive limitation rules (e.g., maximum of 30% of employee-only coverage) would apply. Questions Remain For years, the employer community has questioned how the ADA applies to wellness programs. While these proposed regulations address many of the concerns, questions remain and further clarification will be needed. For example: The proposed regulations do not address how the 30% maximum incentive (based on the total cost of employee-only coverage) applies when an employee’s family members also participate in the wellness program and are enrolled in the group health plan. Thus, it is unclear how the incentive limit applies to wellness programs available to employees and their families. Hopefully final regulations will clarify that the 30% maximum may be based on the cost of the family coverage. 2 24 Volume 38 | Issue 57 | April 17, 2015 The proposed regulations do not address how employer wellness programs comply with the Genetic Information Nondiscrimination Act (GINA). The EEOC indicates that future rules will describe the extent to which GINA permits employers to condition incentives on a family member’s participation in a wellness program. Additional information The EEOC has asked for public comments by June 19 on the proposed regulations generally, as well as on some specific issues. Additional guidance and information include: Press Release Fact Sheet for Small Business Questions and Answers document Wellness Programs and Workplace Wellness Programs Report (RAND). In Closing There is little doubt that public comments on these proposed regulations will abound since their final version could have a significant impact on employer wellness programs. In the meantime, employers should seek counsel with their trusted advisors to determine what, if any, changes need to be made to their wellness programs in light of the proposed rules. We will discuss the EEOC’s guidance in broader detail in a future For Your Information publication. Authors Sharon Cohen, JD Tami Simon, JD Produced by the Knowledge Resource Center of Buck Consultants at Xerox The Knowledge Resource Center is responsible for national multi-practice compliance consulting, analysis and publications, government relations, research, surveys, training, and knowledge management. For more information, please contact your account executive or email [email protected]. You are welcome to distribute FYI® publications in their entireties. To manage your subscriptions, or to sign up to receive our mailings, visit our Subscription Center. This publication is for information only and does not constitute legal advice; consult with legal, tax and other advisors before applying this information to your specific situation. ©2015 Xerox Corporation and Buck Consultants, LLC. All rights reserved. Xerox® and Xerox and Design® are trademarks of Xerox Corporation in the United States and/or other countries. Buck Consultants®, FYI®, and For Your Information® are trademarks of Buck Consultants, LLC in the United States and/or other countries. 3 25 Specialty Drug Trend Solutions and Strategies to Manage April 30, 2015 1 © 2015 Express Scripts Holding Company. All Rights Reserved. New Specialty Drug Pipeline Proportion of Near-Term Specialty Pipeline Drugs by Indication Significant Specialty Medications Approved During 2014 DRUG 11.1% 27.7% 16.7% 5.6% 5.6% 33.3% Cancer Orphan Conditions Inflammatory Conditions High Cholesterol Hepatitis C Multiple Sclerosis Alprolix INDICATION* Hemophilia B ANNUAL COST (EST.) $400,000 Eloctate Hemophilia A $400,000 Cerdelga Gaucher Disease $300,000 Keytruda Melanoma $150,000 Opdivo Melanoma $150,000 Harvoni Hepatitis C $113,000 Viekira Pak Hepatitis C $100,000 Esbriet IPF $94,000 Ofev IPF $96,000 Lynparza Ovarian Cancer $150,000 *IPF = Idiopathic Pulmonary Fibrosis 2 © 2015 Express Scripts Holding Company. All Rights Reserved. 1 26 Things That Cost $400,000 $150,000 2015 BMW i8 58’ Sail Boat - Used 3 © 2015 Express Scripts Holding Company. All Rights Reserved. Agenda Step 1 Step 2 Step 3 Step 4 Step 5 Step 6 Step 7 Step 8 4 © 2015 Express Scripts Holding Company. All Rights Reserved. 2 27 Drug Trend Over Time 5 © 2015 Express Scripts Holding Company. All Rights Reserved. Commercially Insured Class Review: Specialty Medications Source: Express Scripts 2014 Drug Trend Report 6 © 2015 Express Scripts Holding Company. All Rights Reserved. 3 28 Step 1: Manage Non Specialty Aggressively 7 © 2015 Express Scripts Holding Company. All Rights Reserved. Step 2: Optimize Plan Design Formulary Comparison Tier Traditional Focus Specialty Focus Accredo & Retail Copayment 1 Generic N/A N/A 2 Preferred Brand N/A N/A 3 Non-Preferred Brand N/A N/A 4 N/A Generic 10% - 15% (up to $100 Max) 5 N/A Preferred Brand 20% (up to $250 Max) 6 N/A Non-Preferred Brand 20% or Not Covered Note: Biosimilars are evaluated upon market entry DON’T FORGET TO ALIGN SPECIALTY WITH MEDICAL 8 © 2015 Express Scripts Holding Company. All Rights Reserved. 4 29 Specialty Plan Designs • Consider increasing member cost share to combat escalating specialty drug prices, but be mindful of impact to utilization 0.14 0.12 0.1 0.08 Average PMPY Specialty Utilization 0.06 0.04 0.02 0 $0-$100 $101-$250 $251-$500 $501+ Average Member Specialty Copay 9 © 2015 Express Scripts Holding Company. All Rights Reserved. Provide Proactive Copay Assistance CHARITABLE RESOURCE ASSISTANCE • Caring Voice Coalition • Chronic Disease Fund® • Patient Access Foundation • Patient Services Inc.® $240M IN ASSISTANCE IN 2014 • Patient Advocate Foundation • 130+ more Patient Is Offered or Expresses Need Patient Feedback Copay Team Determines Best Options Helps Patient Through Enrollment Process Order Completion and Shipping -“Thank you so much for all of your help and patience. You have no idea what a big help this is and what a blessing it is.” 10 © 2015 Express Scripts Holding Company. All Rights Reserved. 5 30 History Repeats Itself Non-Specialty Therapy Class Timeline One Multiple Generics Brand Competitors Specialty Therapy Class Timeline One Multiple Biosimilars Brand Competitors 11 © 2015 Express Scripts Holding Company. All Rights Reserved. Near-Term Biosimilar Pipeline BIOSIMILAR ANTICIPATED APPROVAL DATE* BRAND MANUFACTURER PATENT EXPIRATION INTENDED USE Zarxio (filgrastim Sandoz) Pending Amgen (Neupogen) Nov. 10, 2013 Neutropenia Remsima (infliximab – Celltrion/Hospira) August 8, 2015 Janssen (Remicade) Sept. 4, 2018 Rheumatoid Arthritis and other Inflammatory Conditions Pegfilgrastim (Apotex) August 17, 2015 Amgen (Neulasta) Oct. 20, 2015 Neutropenia Retacrit (epoetin alfa – Hospira) October 16, 2015 Amgen (Epogen), Janssen (Procrit) June 6, 2015 Anemia Zarxio may be one of the first biologics approved using the FDA’s biosimilars pathway Continue to support use of the most CLINICALLY APPROPRIATE and COST-EFFECTIVE medications * Approval or launch may be delayed due to litigation 12 © 2015 Express Scripts Holding Company. All Rights Reserved. 6 31 Step 3: Utilization Management Step Therapy Drug Quantity Encourages use of clinically effective, front-line medications before second-line medications Aligns dispensing quantity with FDA-approved dosage guidelines and other supportive evidence Right Drug Right Patient Prior Authorization Right Amount Ensures clinically appropriate use of medications 13 © 2015 Express Scripts Holding Company. All Rights Reserved. ExpressPAth and ePA Simple, Intuitive Tools to Streamline PA Process Simple Speedy Smooth • Reduces administrative demands • Online benefit checks • Simple and intuitive user interface • Pharmacy and medical prior auth in one spot • Real-time approvals • Up to 11X faster than manual prior authorization* • Less time phoning and faxing for prior auth • In many cases requests automatically approved • Prescriber can check status online anytime • Faster, transparent process minimizes gaps in patient care ePA Within EMR ePrescribing tool ELECTRONIC PRIOR AUTHORIZATION Streamlined prior authorization process ExpressPAth® Web browser portal *http://business.comcast.com/internet/business-internet/plans-pricing 14 © 2015 Express Scripts Holding Company. All Rights Reserved. 7 32 Step 4: Formulary Management 2 0 1 5 Erythropoiesis Stimulating Agents Hyaluronic Acid Derivatives Biologics – Injectable TNFAntagonist (removed 1 exclusion) Protease Inhibitors for Hepatitis Other Direct Acting Antivirals for Hepatitis Interferon Beta Medications for Multiple Sclerosis Pegylated Interferons Growth Hormones Follitropins 19 SPECIALT Y EXCLUSIONS 2 0 1 4 EXCLUSIONS EXPANDED FURTHER IN 2015 TO MANAGE GROWTH IN SPECIALTY DRUG SPEND Biologics – Injectable TNFAntagonist Interferon Beta Medications for Multiple Sclerosis Pegylated Interferons Growth Hormones Follitropins 12 SPECIALT Y EXCLUSIONS 15 © 2015 Express Scripts Holding Company. All Rights Reserved. Inflation Predictability Negotiate caps at set rates with a large percentage of contracted drugs providing protection against substantial drug price increases. 25% 20% Our average cap is 58.5% 15% 10% less than the market inflation rate 5% 0% Average Inflation Cap Average 16 © 2015 Express Scripts Holding Company. All Rights Reserved. 8 33 Hepatitis C NATIONAL PREFERRED FORMULARY Hepatitis Cure Value Program Accredo provides greater care for patients and more value for plans to achieve optimal outcomes Hepatitis C Formular y Changes National Preferred Formulary exclusions offer maximum value with minimal disruption Better Care More Access Greater Value 17 © 2015 Express Scripts Holding Company. All Rights Reserved. PCSK9 Inhibitors THE FACTS • Estimated $12K IMPACT MODELING annually • Self injected antibody • Extremely effective CLINICAL MANAGEMENT • No drug interactions and Client-specific, proactive modeling of costs based on specific-use scenarios Initial patient education and injection training Adherence and therapy optimization fewer side effects • Mid-2015 approval UTILIZATION MANAGEMENT Prior Authorization solution • Broad indication likely • No initial outcomes data FORMULARY MANAGEMENT Evaluate preferred product strategy as market expands 18 © 2015 Express Scripts Holding Company. All Rights Reserved. 9 34 The Future is Costly and Complex Top 10 Drugs in Pipeline or Recently Launched Drug 80% of the oncology drugs in the pipeline are breakthrough therapies Projected Annual Cost of Cancer Opdivo® Various Keytruda® Various Ibrance® Breast 4.6 3.4 2.7 2.1 neratinib Breast venetoclax ABT-199 CLL, various MDPL3280A Lung (PD-L1) MED14736 Lung, Various AZD-9291 Lung rociletinib Lung LEE011 Breast $21B 2020 ($b) 1.9 1.6 1.4 1.2 1.1 1 by 2020 19 © 2015 Express Scripts Holding Company. All Rights Reserved. Oncology Brands Going Off Patent Oncology Patent Expirations Brand Patent Expiration Generic Biosimilar Epogen® /Procrit® 6/6/15 Neupogen® Expired Trelstar® 7/7/15 Targretin® Capsules 7/9/15 Neulasta® 10/20/15 Gleevec® 2/1/16 Rituxan® 4/7/15 Lupron Depot® 12/13/16 12/31/18 Arranon® 6/13/17 Erbitux® 2/12/18 Clolar® 7/14/18 Herceptin® 6/18/19 Avastin® 7/4/19 Zytiga® 20 © 2015 Express Scripts Holding Company. All Rights Reserved. 10 35 The Oncology Puzzle: Piecing Together a Smarter Solution Oncology Market Trends • Higher Demand for Cancer Services • Growing Oncology Pipeline & Increasing Costs • Medical vs Pharmacy Management Current Pieces of the Oncology Solution New Opportunities in Oncology • Utilization Management • Formulary Management • MBM/MCM/ODS • RationalMed • Oncology TRC • Palliative Care • Precision Medicine • Fair Drug Pricing Balance rising costs with specialized clinical needs of oncology patients 21 © 2015 Express Scripts Holding Company. All Rights Reserved. Step 5: Pharmacy Selection Value Service Care The most effective drugs at the right price Deep understanding, accountability and action Supportive, easy experiences tailored to your needs Smarter solutions enabled by experience and scale give you better control and guaranteed results Clinical innovation to benefit clients and patients Compassionate 1:1 care for those with the most complex, chronic and rare conditions 22 © 2015 Express Scripts Holding Company. All Rights Reserved. 11 36 Members Are Directed to a Specific TRC Based on their most complex condition TRC Data Analytics Engine TRC Assignment Rare and Specialty Real-time Pharmacy Oncology Medical Claims HIV / Immunology ConditionSpecific Therapy Management and Enhanced Patient Counseling Diabetes Laboratory Tests Cardiovascular Health Questionnaires Pulmonary Neuroscience Medical Conditions Women’s Health Self-Reported General 23 © 2015 Express Scripts Holding Company. All Rights Reserved. Disease Centric Specialty Model WHITESTOWN DUBLIN & COLUMBUS Oncology RA&I BYFIELD Fertility MS WILLINGBORO INDIANAPOLIS HIV Transplant Pulmonary WARRENDALE MEMPHIS Rare Hepatitis RA&I Endocrine PAH Immune Disorders NASHVILLE Bleeding Disorders LAKE MARY Hepatitis LEGEND Home Location HIV ORLANDO MS Support Location 24 © 2015 Express Scripts Holding Company. All Rights Reserved. 12 37 TRC Impact — Specialized Care for Multiple Sclerosis MS-specific care and counseling to help patients achieve the BEST POSSIBLE OUTCOMES 32% 39% $3K Higher adherence Lower likelihood of ER visits and hospitalizations Lower annual healthcare expenses S p e c i a l i z a t i o n Foc u s One-on-one clinical assessments with nurses Thorough gap-in-care intervention outreach Proprietary depression screening Complete evidence-based regimen review Unique online support, including MSNeighborhood.com 25 © 2015 Express Scripts Holding Company. All Rights Reserved. Therapy Management Example Monitoring ESAs (MESA) program FDA-approved Package Inserts for erythropoeisis-stimulating agents (ESA) products (Procrit®, Epogen®, Aranesp®) have safety warnings • Data capture: HGB prior to refill • Program intervention: Outbound fax to prescriber; Intervention by pharmacist is recommended if • HGB ≥ 11–12 • Laboratory data was > eight weeks old • An average of $1,200 saved per intervention at ~120 successful interventions/month • Program averages $145,000 direct drug cost avoided monthly (total mail channel BOB) MESA saved payers $1.2M in direct drug costs in eight months; over $1.7M annualized. 4.4% Total ESA Drug Spend is avoided because of MESA 26 © 2015 Express Scripts Holding Company. All Rights Reserved. 13 38 Specialty GlowPack Adherence Pilot PA I N P O I N T: Nonadherent MS patients often experience mobility issues, fatigue, vision problems and pain S O L U T I O N : Provide MS patients realtime adherence support through the MS Therapeutic Resource Center K E Y M E A S U R E S : Increased adherence GlowPacks via the Accredo Pharmacy increase adherence for participating MS patients by 5.0% © 2015 Express Scripts Holding Company. All Rights Reserved. Pilot subject to change 27 Variable Copay Pilot Program: Sovaldi Example Sovaldi with Standard Benefit Design and NO Copayment Assistance TOTAL COST PER FILL $28,000 PLAN PAYS $25,200 MEMBER PAYS $2,800 COPAYMENT CARD PAYS $– Standard benefit design with a 10% coinsurance for brand specialty and $5,000 max out-of-pocket for the member the plan would pay $25,200 Sovaldi WITH Copayment Card and Standard Benefit Design TOTAL COST PER FILL $28,000 PLAN PAYS $25,200 MEMBER PAYS $5 COPAYMENT CARD PAYS $2,795 Apply the copay assistance from Sovaldi, that same plan design the member pays $5 and the copay card picks up the $2795 Sovaldi with Copayment Card and NEW Benefit Design (sets copay variably to card max.) TOTAL COST PER FILL $28,000 • For Sovaldi, the copay would be set to $5600 for the member, PLAN PAYS $23,000 but the member never pays that, because Accredo® ensures MEMBER PAYS $5 the member is signed up on the copay card COPAYMENT CARD PAYS $4,995 • Now the payment looks like this: Member pays $5, copay card covers $5,000 (the max out-of-pocket) and the plan ends up paying $23,000, saving $2200 per fill for this one drug 28 © 2015 Express Scripts Holding Company. All Rights Reserved. 14 39 Step 6: Channel Management MEDICALLY BILLED SPECIALTY-DRUG CHALLENGES MEDICAL CHANNEL MANAGEMENT SOLUTION • Lack of program control • Limited reporting and utilization management • Inconsistent clinical protocols between pharmacy and medical • J-code billing format • Delays in billing • Better visibility and control of specialty spending • Increased savings from coverage and therapy management • Real-time adjudication • Tracks spending at NDC level • Improved reporting 47% OF ALL SPECIALTY DRUG SPEND is billed through the medical benefit 29 © 2015 Express Scripts Holding Company. All Rights Reserved. Step 7: Specialty Trend Guarantee Specialty Drug Trend Guarantee ACTUAL TREND LOWER THAN GUARANTEE AMOUNT Client Keeps X% Express Scripts Keeps X% 14.5% ACTUAL TREND HIGHER THAN GUARANTEE AMOUNT Client Keeps X% Express Scripts Keeps X% 15.25% © 2015 Express Scripts Holding Company. All Rights Reserved. Client Pays X% On Target No Action Needed 16% On Target No Action Needed 16.5% 17 % Express Scripts Pays X% Express Scripts Pays X% 17.75% Client Pays X% 18.5% 30 15 40 Step 8: Don’t Forget About The Medical Benefit When better control through the A pharmacy benefit is available 1 Medical Channel Management 2 Medical Utilization Management Applying traditional pharmacy B benefit management tools, in the medical benefit 3 Site-of-Care Management 4 Reimbursement Management Uniquely clinical solutions for C complex disease states 5 Oncology Decision Support ON AVERAGE, CLIENTS SAVE BETWEEN 10% and 15%, BACKED BY A GUARANTEE 31 © 2015 Express Scripts Holding Company. All Rights Reserved. 16 41 Navigating through Target Date Funds Due Diligence Process Anna Rathbun, Director of Research CBIZ Retirement Plan Services Target Date Talk 1. 2. 3. 4. Purpose of today’s discussion: Risk Management Retirement Landscape Target Date Landscape Target Date Funds (General Characteristics, Product Differentiation) 5. Due Diligence Guidance for the Plan Sponsor 1 42 Risk Management • Navigating the various risks on the road to retirement – Savings/Accumulation Risk – Participant Risk – Market Risk – Interest Rate Risk – Inflation Risk – Longevity Risk Risk Management • Navigating the various risks in providing a defined contribution plan – Minimize the Plan Sponsor’s fiduciary risk – Establish a process to help fiduciaries assess these target date instruments – Document the process 2 43 RETIREMENT LANDSCAPE Backdrop • Trend of younger generations not being ready for retirement – Shift from pension to 401(k)s – Savings rate, in general, is lower for younger generation (compared to early boomers) – Increase in Social Security’s normal retirement age from 65 to 67 – Slow decline in real rates 3 44 Backdrop • As of December 2014, NRRI update shows half of population still falling short, “at risk” • “At risk” means that they fall at least 10% short of funds for maintaining their pre‐retirement lifestyle We have a declining trend of retirement solvency THE RISE OF TARGET DATE FUNDS 4 45 Target Date Trends • At year‐end 2013, approx. $618 billion was invested in target date mutual funds • The percentage of total plan assets invested in target date funds: – 2007: – 2010: – 2013: 4.2% 8.2% 13.2% Source: PSCA’s Annual Survey of Profit Sharing and 401(k) Plans Target Date Trends • This growth is added by ease of use, as well as the increase in QDIA designation – 2007: – 2010: – 2013: 48.8% 53.1% 72.1% Source: PSCA’s Annual Survey of Profit Sharing and 401(k) Plans 5 46 Target Date Trends • While QDIA status for other balanced/risk‐based funds went down – 2007: – 2010: – 2013: 37.0% 38.7% 21.4% Source: PSCA’s Annual Survey of Profit Sharing and 401(k) Plans Target Date Funds: Basic Philosophy • Why have target date funds become popular? • Addresses behavioral issues in investing: Status quo bias • “Dynamic” asset allocation based on time horizon and automatic rebalancing • Takes the anxiety out • With one option, we address 4 of the 6 risks involved in retirement savings: market risk, interest rate risk, inflation risk, longevity risk. 6 47 CHARACTERISTICS AND PRODUCT DIFFERENTIATION Characteristics • Glide Path: Systematic shifting/adjusting of asset allocation over the lifespan of each fund Source: Vanguard Target Retirement Series 7 48 Characteristics • “To” versus “Through” – J.P Morgan v. TIAA‐CREF • “Active” versus “Passive” – Vanguard v. many others – Blended options (PIMCO) Characteristics • Aspects of market risk – Asset Allocation • Equity • Fixed Income – Glide Path • American Funds Source: Morningstar Direct 8 49 Characteristics • Underlying Holdings – Type of Underlying Holdings: • Individual Securities (Wells Fargo), Proprietary Funds (T. Rowe Price), Sub‐Advised Funds (MassMutual) – Number of Underlying Funds • Less than 10 (Vanguard: 5 Funds) • 10 – 20 (BlackRock: 13 Funds) • Greater than 20 (Fidelity Freedom: 26 Funds) DUE DILIGENCE FOR SELECTION AND MONITORING OF TDF’S 9 50 Guidelines for Plan Sponsors 1. Department of Labor Guidelines 2. Selection of Target Date Series A. Population related data B. Investment related data 3. Example Department of Labor • Tips on fulfilling the fiduciary duties required (2013) 1. Establish a process for comparing and selecting TDFs 2. Establish a profess for the periodic review of selected TDFs 3. Understand the fund’s investments – the allocation of different asset classes, individual investments, and how these will change over time 10 51 Department of Labor 4. Review the fund’s fees and investment expenses 5. Inquire about whether a custom or non‐proprietary target date fund would be a better fit for your plan 6. Develop effective employee communications 7. Take advantage of available resources of information to evaluate the TDF and recommendations you received regarding the TDF selection 8. Document the process Due Diligence • Selecting a target date series – Understand the demographics of your plan – “Human Capital” vs “Financial Capital” • e.g. TIAA‐CREF Life Cycle Funds 11 52 Due Diligence What is the purpose of your DC Plan? What is the overall risk tolerance of your plan participants? Are you more concerned with limiting volatility during the accumulation phase or minimizing longevity risk during distribution / retirement phase? Or both? Due Diligence Is there a defined benefit pension? What is closest to the average tenure of your plan participants? Do your participants generally take out a lump sum at retirement? Or do they typically remain invested and take distributions from within the plan during retirement? 12 53 Understanding the Investment Vehicles – Asset Allocation • Vanguard’s asset classes (5 funds) • Vanguard’s sub‐asset classes (broken down) – Digging deeper into the sub‐asset level • How diversified is the equity portfolio? • How diversified is the bond portfolio? • What is the quality of the bond portfolio? Understanding the Investment Vehicles Source: Vanguard Target Retirement Series 13 54 14 55 Risk/Return • Return and Risk must be explored together • Some industry measurements of risk – Standard deviation (3‐year? 5‐year? 10‐year?) – Beta – Downside risk Risk/Return • What is driving the “good” performance? Could there be hidden underlying risk in the funds? – Beta – Sharpe ratio – Sortino ratio • Active Management: Am I getting what I am paying for? – – – – Fees Active Return Alpha Information ratio 15 56 Example • Company XYZ is a national entity in the financial services industry. • Its participant base is approximately 5000 • Mitigating longevity risk is an important issue. Offering a high‐performing, competitive target date option was a priority. • “Through,” rather than “to” option was chosen due to the committee’s desire to take care of the participants through the retirement years Example • The plan already had a target date option, TDF “A,” which satisfied the preliminary criteria of the committee • As a part of an on‐going due diligence study, another target date fund (TDF “B”) was chosen to compare the merits of retaining TDF “A” 16 57 Example • TDF “A” and TDF “B” are both managed by highly regarded, large investment companies • Both companies offer excellent mutual fund offerings • Both companies have reputable managers whose tenure is some of the longest with their companies in the industry • Both target date funds have an excellent performance history Example • Standard performance and risk comparison (as of 3/31/2015) 3 Yr Perf 12.59 12.59 11.61 9.75 7.34 5 Yr Perf 11.46 11.47 10.82 9.53 7.69 5 Yr Rank 7 4 4 2 19 Standard Deviation (3 Yr) 9.27 9.31 8.59 7.31 5.70 Standard Deviation (5 Yr) 13.37 13.40 12.58 10.70 8.33 Downside Deviation TDF A 2050 TDF A 2040 TDF A 2030 TDF A 2020 TDF A 2010 1 Yr Perf 8.09 8.05 7.44 6.30 4.80 TDF B 2050 TDF B 2040 TDF B 2030 TDF B 2020 TDF B 2010 7.80 7.74 7.60 6.50 5.84 13.50 13.49 13.15 10.54 8.42 11.57 11.59 11.44 9.71 8.35 3 2 1 1 1 8.58 8.53 8.21 6.36 4.86 11.81 11.77 11.33 8.66 6.26 1.21 1.18 1.59 1.89 1.77 1.21 0.90 1.22 0.87 0.86 *Past performance does not guarantee future returns **Source: Morningstar Direct 17 58 Example • Relative Performance and Relative Risk Alpha 3 YR Alpha 5 YR 3 Yr Beta 5 Yr Beta TDF A 2050 0.02 0.03 1.08 1.08 Tracking Error 3 YR Tracking Error 5 Yr 0.37 0.65 TDF A 2040 ‐0.01 ‐0.03 1.16 1.19 0.48 0.79 TDF A 2030 ‐0.05 ‐0.08 1.22 1.28 0.54 0.90 TDF A 2020 ‐0.09 ‐0.10 1.30 1.32 0.54 0.83 TDF A 2010 ‐0.11 ‐0.10 1.23 1.24 0.38 0.56 TDF B 2050 0.16 0.13 1.00 0.96 0.31 0.53 TDF B 2040 0.14 0.08 1.06 1.05 0.31 0.41 TDF B 2030 0.11 0.05 1.16 1.15 0.45 0.58 TDF B 2020 0.08 0.07 1.12 1.07 0.34 0.40 TDF B 2010 0.08 0.13 1.03 0.92 0.31 0.42 Alpha: excess returns by the active manager Beta: Relative Risk. Volatility compared to the market. Tracking Error: How closely the fund follows the index or category *Source: Morningstar Direct Example • Ratios TDF A 2050 TDF A 2040 TDF A 2030 TDF A 2020 TDF A 2010 Sharpe 3 YR 1.32 1.32 1.32 1.30 1.26 Sharpe 5 Yr 0.88 0.87 0.88 0.90 0.92 Sortino 3‐Yr 2.30 2.28 2.27 2.21 2.09 Sortino 5 yr 1.46 1.46 1.46 1.51 1.56 TDF B 2050 TDF B 2040 TDF B 2030 TDF B 2020 TDF B 2010 1.52 1.53 1.54 1.60 1.68 0.98 0.99 1.01 1.11 1.31 2.77 2.78 2.80 2.96 3.25 1.67 1.68 1.72 1.93 2.41 Information Ratio Information Ratio (3) (5) 1.35 0.59 1.33 0.59 1.35 0.56 1.23 0.46 ‐0.73 ‐0.67 2.00 2.03 2.15 2.05 0.18 0.87 0.88 0.96 1.05 0.01 Sharpe: excess return per unit of risk Sortino: excess return per downside risk Information ratio: excess returns per unit of tracking risk taken by the active manager *Source: Morningstar Direct 18 59 Example Higher Performance Higher Rank Lower Standard Deviation Lower Downside Deviation Higher Alpha / Lower Beta Lower Tracking Error Higher Sharpe, Sortino, and Information ratios Risk Management • Navigating the various risks for the participant on the road to retirement • Navigating the various risks for the plan sponsor 19 60 Thank you for your attention Anna Rathbun, Director of Research CBIZ Retirement Plan Services [email protected] 216‐520‐6622 20 CLIENT PERSPECTIVE p.10 AT A GLANCE p.8 PRIVATE EXCHANGE MODELS p.6 MARKET CHANGES p.4 THE EMPLOYER’S ROLE p.2 B R I E F AON.COM/HEALTHEXCHANGES A AON. AON AON.C AO O ON ON.C ON. N.C N..C COM OM OM/H OM/ OM/HE M//HE M/H M/HE //H HE H EA AL ALT ALTH ALTHE LTHE LTH LT L THE T TH HE H EX EXCH XCHAN XCHA XCH XC CH CHAN CH CHA HAN HA AN AN NGE GE GES G ES E S Unlocking Your Health Care Strategy VOL. 2 CHANGES TODAY B U S I N E S S 61 2 are actively seeking ways to transfer more accountability and responsibility for health decisions to employees. Helping them adopt health-focused behaviors ultimately reduces costs and volatility. It also gives employees greater control over their health coverage choices. Momentum is building behind this approaching health benefits have been prompted by the out-of-control health care costs facing them and their employees. Since 2006, overall costs have increased 63 percent; employer costs have increased 51 percent and employee costs 91 percent.3 The affordability gap continues to widen and there is no evidence that this trend is likely to abate. raise health awareness and track health behaviors. a myriad of mobile apps and wearable devices that driven straight to consumers’ fingertips, thanks to management programs. Better health is being with predictive modeling and advance care contracts and are tackling chronic conditions providers more accountable with outcome-based care delivery. Meanwhile, insurers are holding by consolidating and vertically integrating medical records. Hospitals are staying competitive more easily meet new requirements for electronic Doctors are aligning with major health systems to health care reform, and the evolution of technology. transformation brought on by cost pressures, The entire U.S. health care industry is undergoing health benefits really mean. to add value by broadening the scope of what Today’s employers are under increasing pressure value both experience and personalization. environment. Younger employees, in particular, one-size-fits-all group health plans is diluted in this representing Millennials. The value of traditional, five generations by 2020, with over 50 percent ethnicities, and financial states, and will include Today’s workforce is a growing mix of races, Changes in the Workforce different solutions. care choices and also to embrace new and the driver’s seat when it comes to their health consumer is showing a willingness to take movement, especially because the new health Amid all these developments, employers Many of the changes in how employers are Changes in the Health Delivery System The Rise of Consumerism Economic Pressures Today in the United States, employer-sponsored health benefits are the source of coverage for more than 149 million individuals.1 Fueled by many factors, including rising costs, legislative changes, new provider models, and evolving market forces, the health care industry is undergoing a transformation. And as health care evolves, so must the employer’s role in it. What has not changed, however, is employers’ belief that health benefits are a key differentiator for talent. In fact, most large employers plan to continue offering coverage in spite of the uncertainties in the health care market.2 To keep pace with the changing environment, employers must rethink their role in health coverage: how they sponsor, structure, and deliver health benefits, and how they manage costs while keeping employees healthy, productive, and satisfied. the Employer’s Role in Health Coverage Kaiser Commission on Medicaid and the Uninsured, 2014. 2 Aon Hewitt 2014 Health Care Survey. 3 Aon Hewitt Health Value Initiative. 4 Aon Hewitt 2014 Health Care Survey. 1 ETHINKING XCHANGES TODAY Business Brief 95% OF EMPLOYERS PLAN TO CONTINUE PROVIDING HEALTH CARE BENEFITS TO ACTIVE EMPLOYEES IN THE NEXT THREE TO FIVE YEARS 4 holistic view of health. 3 AON.COM/HEALTHEXCHANGES coverage is beginning to evolve to support this well-being of employees. Employer-sponsored overall physical, emotional, financial, and social distinct areas: health increasingly refers to the “health” and “insurance” as two related but single concept, employers are now viewing Instead of “health insurance” considered as a Evolving Definition of Health Care PERCENT XCHANGES TODAY Business Brief 62 5 Responses to Market Changes of the most promising ways for employers to embrace a defined commitment strategy along with additional components, such as HDHPs, them to manage potential increases in coverage costs by capping their upfront expenditure. curator of the employee health experience. to help mitigate upward cost trends and hold support and wellness programs. employees and are providing health care decision employers recognize the burden this will place on smarter cost-value decisions for themselves. Many approach will put pressure on employees to make strategy) in the next three to five years. This 6 employees only an HDHP (a “total replacement” percent of employers are considering offering has been a key challenge, so as many as 42 decisions.5 Employee enrollment in these models 75% of respondents to the Aon Hewitt 2014 Health Care Survey offered PPOs. Aon Hewitt 2014 Health Care Survey. 8 Aon Active Health Exchange Enrollment Data. 9 Accenture 2014 — Growing Pains for Private Health Insurance Exchanges. 6, 7 5 health care costs and volatility for employers. expand employee choice while controlling or voluntary benefits. These solutions help use of incentives, cost limits, and elective commitment approach may include the even stimulate behavior change. A defined- empowerment over health coverage, and benefits can drive a sense of employee Providing a defined commitment for health from provider of defined benefits to committed high-deductible health plans (HDHPs) as a way employees more accountable for their health increases as part of total rewards. This trend is part of a larger shift in the employer’s role offered, employers are increasingly turning to 7 benefits as a form of compensation and manage this approach allows employers to treat health premiums. Often called a defined commitment, amount they will contribute toward health plan defined benefit strategy to defining the dollar 37 percent of employers plan to shift from a costs. But over the next three to five years, their contributions or subsidies on health plan 5 AON.COM/HEALTHEXCHANGES THE NUMBER OF PEOPLE ENROLLED IN PRIVATE EXCHANGES IS EXPECTED TO JUMP FROM 1 MILLION TO 40 MILLION BY 2018 9 MILLION MILLION combinations of familiar and innovative elements. of a spectrum of solutions featuring varying benefit choices. Exchanges themselves are part but also give the employee control over their support the employer’s efforts to constrain costs of HDHPs.8 Private health exchanges not only have seen a 30 percent increase in the adoption employers who have moved to a private exchange of health coverage options. For example, some benefits while offering their employees a range that help companies evolve their role in health Private health exchanges have emerged as one subsidy approach to health benefits. This allows At present, 77 percent of companies base Private Health Exchanges Employers are also increasingly embracing a fixed- XCHANGES TODAY Business Brief Defined Commitment are still the most common health plan design While preferred provider organizations (PPOs) Trends and Innovative Cost-Containment Strategies Employers are adopting many new strategies to evolve their health care benefits, contain costs, and improve their employees’ health. EMPLOYER XCHANGES TODAY Business Brief 63 XCHANGES TODAY Business Brief who insures and underwrites the coverage. The carrier strategy determines whether benefits will be offered through a single insurance carrier priorities, there are a number of factors to consider when comparing exchange options. Here are some preliminary questions to ask: approach the two most distinct differences In particular, they may determine how you how you evaluate new health exchange models. Your answers to these questions will shape we can accomplish on our own? • Can the exchange deliver value beyond what vendor management, and administration? responsibility over health care plan design, • How important is it that my organization retain in the form of a fixed subsidy? • Am I comfortable defining my commitment and managing in-year volatility? 3. A robust benefits platform designed for efficiency, reliability, and scale. 2. Decision-support tools during enrollment and advisory or advocacy services post-enrollment. 1. Employee communications to educate and help with change management. When choosing an exchange partner, consider how much support you and your employees will receive in the form of: OTHER FACTORS TO CONSIDER choice and competition built into the solution. or multiple carriers, which impacts the level of strategy. The funding strategy is a choice of for your active employees. Based on those • How important are annual cost predictability between the models: funding and carrier The first step should be to assess your priorities Private health exchanges offer employers more new tools and options than ever for improving cost control and predictability, fostering employee choice and accountability, and redefining health benefits altogether. But with so many solutions to sort through, how do you select the right one for your company? Evaluating Private Exchange Models THE KEYS TO 6 carriers. When the employer chooses, employees may still be offered some choice of national or regional carriers based on cost-competitive carrier contracts negotiated by the exchange in each of self-insured exchange solutions may even be already built into an employer’s self-insured traditional plan. service quality high. AON.COM/HEALTHEXCHANGES mechanisms for keeping costs competitive and a single-carrier exchange, however, is that the The result is a sustainable marketplace with built-in carrier for their health care benefits. What’s new in bend the overall health care cost trend downward. Many large organizations already leverage a single and also uses the power of consumer choice to This structure maximizes free-market competition more choice. cost predictability and offering employees a more hands-off approach while gaining administration. They allow employers to take offering pre-designed plan menus with bundled carrier exchanges are generally based on a mix of regional and national carriers. Multi- employees, a multi-carrier exchange may offer Depending on the geographic distribution of by providing more competitive options to them. for coverage choices more fully to employees A multi-carrier exchange shifts the responsibility networks, and coverage levels. offering plans with various price points, provider insurance carriers. Carriers compete side-by-side, from multiple plan options but also from multiple consumerism occurs. Employees choose not only with employees, an even bigger shift toward SINGLE-CARRIER Carrier Approach and reducing the overall cost of medical coverage. these expenses by increasing cost predictability today’s exchange models have more than offset added costs like state taxes. However, some of viewed as more expensive because of certain Historically, a fully insured approach has been modifying their plan designs to reduce costs. freed from the administrative burden of continually employers less control over plan design, they are designs are fixed and state-filed. While this gives Also, in a fully insured environment the plan cost predictability become possible. In this environment, risk transfer and real annual commitment is truly defined on an annual basis. covering incoming claims. Therefore, defined underwrites the policies, assuming the cost of In a fully insured exchange model, the insurer region. When the multi-carrier choice rests employees have the choice between multiple have a fixed, pre-designed structure. Some aspects FULLY INSURED on the exchange, either the employer or the some control over plan design while others may from several insurance providers. Depending coverage by offering a choice of plans available change to traditional employer-sponsored Multi-carrier exchanges introduce a significant MULTI-CARRIER desire to offer more choice to their employees. mostly in response to small and mid-size employers’ insurance carriers themselves, have come about carrier exchanges, offered primarily by the meet the needs of the employee group. Single- these solutions may be customized and priced to want to be in plan design and cost negotiation, insurance. Depending on how involved employers move away from a one-size-fits-all model of health from which to choose, allowing employers to carrier offers employees a range of plan options 7 Certain self-insured exchanges may allow employers plans, and restrictive care management programs. carrier discounts, buy-downs to high-deductible driven primarily by a combination of optimizing they are incurred. In this scenario, cost savings are unpredictable since employers pay for claims as will be. The overall cost of health care remains premiums are only an estimate of what ultimate costs strategy, the fixed subsidies made toward employee while an employer can opt for a defined commitment many of the same benefits and risks. For example, similar to traditional self-insured plans, they include options for managing evolving needs. Because they’re self-insured exchange solutions do offer some new Although self-insuring health coverage isn’t new, SELF-INSURED Funding Strategy XCHANGES TODAY Business Brief 64 XCHANGES TODAY Business Brief HIGH • Defined commitment in a fully insured model caps annual employer health care costs • Competition between carriers puts downward pressure on cost trend MODERATE • Multiple plans offered by two or more carriers • Employees choose the plan—and sometimes carrier—that best suits their needs MODERATE • Employer may leverage standardized plan designs with some level of customization • Employer may leverage one or more carriers based on cost-competitive carrier contracts negotiated by the exchange in each region MODERATE • Employer may define their commitment in the form of a fixed subsidy but is still ultimately responsible for paying claims as they come in • Allows companies to implement some features of a fully insured private exchange while retaining additional flexibility over plan design • Employees have more choice over their health plan • Simplified administration through standardized features like plan design • Minimal annual cost predictability • Less flexibility over plan design when compared to more traditional models • Depending on model, choice of carrier could be limited to the employer and not the employee LOW TO MODERATE • Multiple plans offered by a single carrier • Employees choose the plan that best suits their needs MODERATE • Some ability to customize plan design • Carrier selected by employer HIGH • Defined commitment in a fully insured model caps annual employer health care costs • Minimal change or disruption • Employees have some choice over their health plan • Employer cost predictability year-over-year via defined commitment • Incentives for health plan to manage cost and quality of care • Any added costs (e.g., state tax) need to be offset by the solution • State mandated benefit requirements • Lack of carrier competition to drive down costs • Limited ability to customize plan design LOW TO MODERATE • Multiple plans offered by a single carrier • Employees choose the plan that best suits their needs HIGH • Plan design customized by employer • Carrier selected by employer LOW • Employer may define their commitment in the form of a fixed subsidy but is still ultimately responsible for paying claims as they come in • Minimal change or disruption • Employees have some choice over their health plan • Ability to completely customize plan design • Lack of annual cost predictability • Minimal simplification of administration of plan design • Limited ability for employer to manage costs long term • Lack of carrier competition to drive down costs COST PREDICTABILITY ADVANTAGES DRAWBACKS EMPLOYER CUSTOMIZATION LEVEL EMPLOYEE CHOICE LEVEL Companies that want to offer greater employee choice from multiple carriers and simplify their administrative burden through a standardized plan design while still maintaining a self-insured funding model Companies looking for better cost predictability, greater employee choice, and more simplified administration Companies seeking to increase employee choice by offering a menu of plan design options IDEAL FOR • Minimal flexibility for plan design or carrier customization • Any added costs (e.g., state tax) need to be offset by the solution • State mandated benefit requirements • Carriers incentivized to stay competitive on price and service, minimizing the long-term cost trend • Employees empowered to take control with unprecedented choice of plans and carriers • Reduces employer risk • True annual employer cost predictability • Standardized plan designs • Competing carriers contracted by the exchange provider LOW • Multiple plans offered from multiple carriers • Employees choose the plan and carrier that best suit their needs HIGH Companies looking to maximize cost predictability and reduce their risk through a truly competitive market that transfers risk to the insurance carrier while increasing employee choice Solutions that leverage multi-carrier competition and employee choice within a fully insured model to create a new market for employer-sponsored health care that offers greater cost predictability Solutions that start to move employers away from customizable health care strategies to more standardized solutions that offer greater employee choice across plan and carrier options within a self-insured funding model Solutions that also share traits with traditional strategies, but in addition to introducing greater employee choice over plan options, move employers to a defined commitment strategy for greater cost predictability Solutions that most closely resemble traditional employer-sponsored health care strategies but that introduce greater choice to employees through multiple plan offerings from a single carrier FULLY INSURED OVERVIEW SELF-INSURED FULLY INSURED MULTI-CARRIER Private exchanges combine new and existing health care strategies in various ways for different benefits and results. Here’s a side-by-side look at how two key elements, funding and carrier strategies, combine to create a spectrum of solutions that employers can leverage to meet both business and employee needs. XCHANGES TODAY Business Brief SELF-INSURED SINGLE-CARRIER a Spectrum of Exchange Models at a Glance EVALUATING 8 9 65 XCHANGES TODAY Business Brief CFO, RICOH AMERICAS CORPORATION Gary Crowe 10 11 Aon Active Health Exchange™? us comfortable that a smooth transition was possible. well. Aon’s decision-support tools, along with health plan designs that were already familiar to us, ultimately made concerned about transitioning 25,000 employees to an exchange and wanted a provider who could manage it of plan options was broad enough to meet a wide variety of needs and financial constraints. Finally, we were very Secondly, from an employee benefits perspective, we were most interested in a multi-carrier model. The range Ultimately, because risk mitigation was one of our goals, we decided a fully insured model best met our needs. First from a financial perspective, the option to move from self- to fully insured generated a robust discussion. based on three key criteria: financial cost, employee health care benefits, and employee transition to a new format. well-grounded in our overall goals and desired outcomes for the year. We evaluated private exchange options At Ricoh, Finance works closely with HR. Before we began evaluating exchanges, our HR and Finance teams were and employees? their coverage and more actively manage both their wellness and health care costs. engagement. Overall, I think the wellness program and the exchange have encouraged employees to reassess the exchange to coincide with the launch of a new wellness program, and we’ve seen increased employee opportunity to educate employees on how to better manage their health benefits. We timed the launch of Regarding employee response, I think the exchange has been very well received. The transition created an our costs increased at a lower rate than I was expecting. during the current year. As with most companies, our overall health care costs did increase this year. However, From a financial perspective, being fully insured has meant that the costs have been much easier to forecast A: Learn more or sign up to receive future issues at aon.com/healthexchanges. Email us at [email protected]. CONTINUE THE CONVERSATION WITH US. opportunities are worth looking into. AON.COM/HEALTHEXCHANGES HR, and senior management. Finally, consider all your options. From a risk management perspective, the new The transition is not a low-impact event. Make sure that the project team has the right support from Finance, consider the impact of the transition and how well the exchange provider can support your employees. I’d say well-defined objectives and a strong partnership with HR are crucial to the evaluation process. Next, evaluating private health exchanges? Q: What recommendations would you have for other CFOs and organizations A: Q: What impact has the transition to an exchange had on your business A: Q: How did Ricoh evaluate the available exchange solutions and choose the impetus to consider a fully insured strategy. Private exchanges provide a new, viable option for managing costs. have experienced the pros and cons. But until the advent of private health exchanges, there had been little real exchanges and becoming fully insured. We’ve been self-insured for a number of years, so we understand and impending changes in the law and were actively researching new alternatives to our self-insured model, including provide market-leading health care benefits while effectively managing overall costs. We were well aware of the Q: What led to Ricoh considering a private health exchange? A: Like most companies, employee health care is one of our biggest expenses. Every year we re-examine how to best XCHANGES TODAY Business Brief 66 © 2015 Aon plc [email protected] AON.COM/HEALTHEXCHANGES Aon Active Health Exchange group health insurance services available through Hewitt Insurance Brokerage LLC, in CA DBA: Hewitt of Illinois Insurance Agency, LLC; in California, License No: 0D28774; in Arkansas, License No: 248773. Aon Hewitt empowers organizations and individuals to secure a better future through innovative talent, retirement, and health solutions. We advise, design, and execute a wide range of solutions that enable clients to cultivate talent to drive organizational and personal performance and growth, navigate retirement risk while providing new levels of financial security, and redefine health solutions for greater choice, affordability, and wellness. Aon Hewitt is the global leader in human resource solutions, with over 30,000 professionals in 90 countries serving more than 20,000 clients worldwide. For more information on Aon Hewitt, please visit aonhewitt.com. About Aon Hewitt 67 68 Private Exchanges Jill Korsh, Director, Deloitte Consulting LLP April 30, 2015 69 Private Exchanges: Concept The exchange owns the “mall” and health plans and other carriers compete for “retail space” within the exchange to offer products and services to customers Customers Exchange Health Plans/ Insurance Carriers Responsibility for benefit plan design and plan management transitions from the employer to the exchange 2 Copyright © 2015 Deloitte Development LLC. All rights reserved. . 70 Private Exchanges: Functions Performed Educate individuals about their health insurance options Offer market-competitive pricing among the participating insurers Allow individuals to “shop and compare” based on price, quality, and other factors Provide transparent and easy to understand products and services Provide customer service and help for individuals with benefits questions Through the “Exchange” marketplace individuals can view available options and prices, and enroll in coverage 3 Copyright © 2015 Deloitte Development LLC. All rights reserved. . 71 Exchanges: Types Individual Private Exchanges Population Type and Ownership Insurance Carriers Members Delivery Funding 4 Group Private Exchanges Public Exchanges Under Age 65 As Defined by the Affordable Care Act Retail or Private Private Public Exchange Sponsor Exchange Sponsor State or Federal Single or Single or Multiple Multiple Under Age 65 Over Age 65 Individuals Employers Exchange Provider Insurance Company Multiple Indivduals – 2014 Employers Small Employers – 2014 Large Employers – 2017 Exchange Provider Insurance Company State or Federal Exchange Software Solution Participant Premiums Participant Premiums Employer Contributions Employer Contributions Fully Insured Self or Fully Insured Participant Premiums Tax Credits/Subsidies Copyright © 2015 Deloitte Development LLC. All rights reserved. . 72 Exchanges: Employer Choices and Control Public Exchanges Low 5 Private Exchanges: Private Exchanges: Individual Insurance Products Group Insurance Products Private Exchanges: Single Carrier Products Employer Control Non Exchange Models High Copyright © 2015 Deloitte Development LLC. All rights reserved. . 73 Private Exchanges: Employer Objectives Reduced Healthcare Costs Controlled, Predictable Healthcare Costs Flexibility and Choice in Benefits Engaged Healthcare Decision-Making Reduced Retiree Healthcare Liability High Quality Benefits and Services Sustained Compliance Best-in-class Delivery Solutions Lessened Administrative Burden Alignment With Organizational and Talent Strategies 6 Enhanced Level of Services Flexibility in Delivery Model Copyright © 2015 Deloitte Development LLC. All rights reserved. . 74 Private Exchanges: Value Proposition Increase Plan Choice and Variety Control Employer Healthcare Costs and Reduce Healthcare Liability Lessen Administrative Burden Enhance Ease of Compliance 7 Copyright © 2015 Deloitte Development LLC. All rights reserved. . 75 Private Exchanges: Independent Advisory Services • As a top-tier consultancy without a Private Exchange product, we are unique in our independent advisory consulting Independence Experience Integrated Solution 8 • No commissions or third-party payments are accepted for our services • Deep experience and lessons learned leading engagements with some of the largest, high-profile, early-adopter organizations to date • Consulting leader in strategy and business case development, Private Healthcare Exchange vendor evaluation, implementation and change management • Practitioners with expertise in Private Exchange strategy, program design, sourcing, implementation, as well as employee benefits, actuarial science, HR service delivery, talent management, HR analytics, communications and change management Copyright © 2015 Deloitte Development LLC. All rights reserved. . 76 Contact Information Jill Korsh Director Deloitte Consulting LLP [email protected] (612) 397-4336 Jill A. Korsh, MBA, is a Director in Deloitte Consulting’s Human Capital practice and co-leads its Employer Private Healthcare Exchange Consulting services. She has 20 years of health and welfare employee benefits and human resources consulting experience and has consulted with numerous employers regarding the strategy, design, and delivery of employee benefit programs. Her expertise includes working with clients to execute employee benefit plan delivery strategies relating to evolving marketplace exchange solutions. She has led engagements providing private exchange consulting services to large clients and has served as an industry expert and advisor regarding private exchange service delivery. Ms. Korsh received her Bachelor’s degree (with distinction) from the University of Wisconsin – Madison. She has a Master’s degree in business administration, with a Certificate in Human Resource Management from the University of St. Thomas in Minneapolis, Minnesota. 9 Copyright © 2015 Deloitte Development LLC. All rights reserved. . 77 About Deloitte Deloitte refers to one or more of Deloitte Touche Tohmatsu Limited, a UK private company limited by guarantee (“DTTL”), its network of member firms, and their related entities. DTTL and each of its member firms are legally separate and independent entities. DTTL (also referred to as “Deloitte Global”) does not provide services to clients. Please see www.deloitte.com/about for a detailed description of DTTL and its member firms. Please see www.deloitte.com/us/about for a detailed description of the legal structure of Deloitte LLP and its subsidiaries. Certain services may not be available to attest clients under the rules and regulations of public accounting. Copyright © 2015 Deloitte Development LLC. All rights reserved. 36 USC 220506 Member of Deloitte Touche Tohmatsu Limited 78 Private Healthcare Exchanges – Making Informed Choices Many employers are Increasingly Investigating Exchange Solutions as Early Adopters Express Satisfaction Many employers with large part-time populations or higher average costs have implemented Private Healthcare Exchanges for their active employees or retirees. A recent Goldman Sachs report predicts a significant shift to exchanges in 2016 and steady adoption over the next several years. Will the Private Exchange Model Really H e l p Reduce Costs? Exchanges commonly promote savings realized from an increased buying pool and market competition, but principal cost drivers for employer-sponsored plans are: Healthcare Plan Cost Drivers Health of covered population Effectiveness of wellness & disease management Mandated benefits Provider discounts Demand for medical services Number and mix of members covered Administrative expense and taxes An analysis of these factors can help determine potential future savings, but other costs will need to be evaluated in determining if there is a positive business case for change including impact on headcount, needed adjustments to t h e overall benefits service delivery model, revised costs in ongoing advisory services, and change management i n v e s t m e n t s . Which Exchange is Right for My Organization? Designed and executed properly, the Private Healthcare Exchange solution may position an employer to meet the challenges of rising costs, while offering broader choices of healthcare options. While Exchanges b e l i e v e t h e y c a n offer an enhanced benefit solution, a thoughtful process is needed to confirm a business case, find the right administrative partner, and implement an effective solution. In just a few years, the Private Exchange marketplace has grown from a single vendor to more than 30. The low barriers to market entry and resulting rapid growth have created a panoply of operating models, contributing to the complexity of evaluating the Exchange opportunity. The right Exchange partner for your organization depends on your requirements and evaluation criteria. Considerations range from fully-insured to self-insured arrangements, scope of plans included in the Exchange, available carriers in the Exchange, and the providers’ willingness to offer fee transparency, attractive contract terms, and strong performance standards. 79 Deloitte is Positioned to Provide Guidance Independence 69% of surveyed large employers state it is very important their advisor is independent of any exchange they are considering. Implementation • • • • • • Implementation planning Project management Risk management Quality assurance Future state design Change management and communications As the only leading consultancy that has not developed a Private Exchange product, we p r o v i d e independent, objective advisory services with respect to Private Exchange products. There are no commissions or thirdparty payments for our services. Our focus is on helping our clients fulfill their individual requirements and expectations. What if a Private Exchange is Not Right for My Company at This Time? Experience We have advised small and large employers, federal agencies, state governments, and healthcare providers on the full spectrum of healthcare management – from cost management to ACA impact to program compliance. We offer deep experience and lessons learned from engagements with some of the largest early-adopter organizations to date. Our experience keeps us close to the marketplace and we understand the capabilities and constraints of the leading service providers. Our Approach We can provide tailored support for your Private Exchange efforts, or can support a specific initiative such as strategy, provider selection, or implementation. Strategy • • • • Strategic goals and objectives Funding analysis Business case development Transition roadmap If a Private Exchange strategy is not right for your organization, our breadth of experience can help you find other alternatives to your core objectives - healthcare cost management, strong service delivery, and program compliance. Contact Information For a discussion about Private Exchange considerations and the marketplace, please contact one of our advisory leaders: Jill Korsh [email protected] (952) 221-2432 Rick Wald [email protected] (612) 397-4601 Selection • • • • • Customized request for proposal Proposal evaluation Independent financial modeling Stress-testing assumptions Contract negotiation support As used in this document, "Deloitte" means Deloitte Consulting LLP, a subsidiary of Deloitte LLP. Please see www.deloitte.com/us/about for a detailed description of the legal structure of Deloitte LLP and its subsidiaries. Certain services may not be available to attest clients under the rules and regulations of public accounting. This publication contains general information only and Deloitte is not, by means of this publication, rendering accounting, business, financial, investment, legal, tax, or other professional advice or services. This publication is not a substitute for such professional advice or services, nor should it be used as a basis for any decision or action that may affect your business. Before making any decision or taking any action that may affect your business, you should consult a qualified professional advisor. Deloitte shall not be responsible for any loss sustained by any person who relies on this publication. Copyright © 2015 Deloitte Development LLC. All rights reserved. 80 Mercer Marketplace A complete solution Employee Technology Employee Communications Plan Design Bundled Consulting MERCER Call Center Administration FSA/HSA/COBRA Consolidated Billing Compliance 0 81 Best Practice Fee Design and Disclosure for Qualified Retirement Plans The Employee Benefits Institute TOPICS FOR DISCUSSION ● Bundled versus unbundled service models. ● Pros and cons of asset‐based versus fixed‐dollar recordkeeping fees. ● Different approaches to paying for recordkeeping services. ● Considerations when engaging a financial advisor. ● How best to benchmark plan fees. ● Sponsor/participant disclosure requirements and best practices. 1 1 82 The Employee Benefits Institute BUNDLED VS. UNBUNDLED SERVICE MODELS ● Bundled Arrangement: ● Unbundled Arrangement: — Single firm provides all services — Greater control and flexibility — Traditional model for decades — Eliminates conflicts — Efficient and cost‐effective — May require use of proprietary products — Conflicted, lacks objectivity — Not necessarily higher cost — The emerging standard — Cannot select best provider in each area — Contrary to best practices, ERISA issues 2 The Employee Benefits Institute RECORDKEEPING FEE STRUCTURES ● A well‐constructed program starts with a competitive and fair recordkeeping fee structure. ● Distinguish WHAT you pay from HOW you pay. ● Two primary methods 1. Asset‐Based (e.g., .25% on all assets) 2. Fixed‐Dollar (e.g., $50 per participant, flat $250,000 per year) 3 2 83 The Employee Benefits Institute LIFESPAN OF AN ASSET‐BASED FEE STRUCTURE * Assumes 10% annual plan asset growth, 5,000 participants and a 25 bps revenue requirement. 4 The Employee Benefits Institute REVENUE SHARING ● Using fund revenue has the following considerations: — Can lead to surplus/deficits if revenue share is not pegged to recordkeeping fee. — Participants with identical balances can pay different fees for the same recordkeeping services. — Fiduciaries must focus on revenue share when selecting funds, limiting the opportunity set and forcing compromise. 5 3 84 The Employee Benefits Institute PRACTICAL IMPLICATIONS OF REVENUE SHARE MODEL ● 40 Years old ● 65 Years old ● $250k account balance ● $1,000,000 account balance ● Frequently meets with local rep ● Lives in West Palm Beach, no local rep ● Maintains a 60%/40% allocation to Vanguard S&P 500 and PIMCO ● 25% Principal Large Cap Growth/25% Dodge & Cox Stock Fund/50% Stable Value ● Neither fund has revenue share ● Pays $1,450 per year for quarterly statements and monthly distribution checks ● Pays zero for recordkeeping services ● What compels Jim to stay in the Plan? 6 The Employee Benefits Institute FIXED‐DOLLAR FEES HAVE DRAWBACKS TOO ● New participants and those with small account balances are sensitive to a fixed‐dollar fee. ● Participants with large account balances benefit by paying a disproportionately smaller percentage of their account balance. 7 4 85 The Employee Benefits Institute RECORDKEEPER FEE STRUCTURE CONSIDERATIONS ● There is no single answer, use the structure that works best for your population. ● There is no recordkeeper “shopping guide” to evaluate fees. ● Hire an independent third party (fiduciary) to benchmark the fee every 3‐5 years. ● Beware of comparisons based on Form 5500 data as they exclude implicit fees. ● Per‐participant equivalent (versus % of assets) is the best way to standardize. ● ERISA does not require participants pay the lowest fee possible, just that the fee is reasonable and competitive for the services provided. ● Document everything! 8 The Employee Benefits Institute ADVISOR SELECTION AND FEES ● Sponsors are increasingly using a third‐party advisor to: —Assist in meeting their fiduciary responsibilities. —Provide investment expertise and a broad marketplace perspective. —Serve as a co‐fiduciary. —Improve the overall quality of the plan. ● Advisor fee structures vary considerably. —Asset‐based fees are common. —Fixed‐dollar fees are preferable. —Fees can be paid from plan assets. 9 5 86 The Employee Benefits Institute ERISA 404(A)(5) AND 408(B)(2) DISCLOSURES 10 The Employee Benefits Institute CONCLUSIONS ● The marketplace has moved away from bundled service arrangements. ● Choose the best recordkeeper, money manager and advisor, separately. ● Distinguish between WHAT you pay and HOW you pay for recordkeeper services. ● Determine the revenue model that works best for your plan. ● Engage a third‐party advisor as a fiduciary to help. ● Know what you are paying all your service providers. ● Request 408(b)(2) disclosures even if you are not subject to ERISA. ● Document everything! 11 6 87 The mission of the For the Health of It! Wellness program is to inspire and empower individuals to take responsibility for their own health by supporting and encouraging physical, social, emotional and mental renewal or purpose driven behavior. This shall foster a culture that supports healthy lifestyle choices and overall balanced well-being for all Garmin associates. 1 88 2 89 Take CARE Wellness Program – Mission Statement • To empower the employee’s of Children’s Mercy to Take CARE of themselves by providing: – Health awareness – A supportive environment – Tools to make positive changes 1 90 Take CARE Wellness Program – Achieving Wellness One Step at a Time Program components: • In May 2008, introduced TakeCARE wellness program • Encompasses all core health and welfare plans (health, disability, life, EAP) • Hired Onsite Wellness Program Manager • Partner with Health Management Vendor to provide annual Health Risk Appraisal and Biometric Screenings Take CARE Wellness Program – Achieving Wellness One Step at a Time Program components: • Points Based Incentive Program – Employees and covered spouses and domestic partners each earn up to $400 in Health Account • Health Coaching – onsite and telephonic • Onsite Fitness Classes • Onsite Wellness Center 2 91 Communication is Key • Partner with Internal Communications – Wellness Communications Plan – Take CARE Newsletter – Communications from Executive Team – Managers Emails – Daily E‐News – Mailings to Home Program Success - Culture • Joined the Partnership for a Healthier America – Made the healthy food commitment – Eliminated the sale of added sugared beverages January 1, 2013 – All fryers will be eliminated by end of year 2015 3 92 Program Success - Culture Onsite Employee Wellness Center • Primary Care • Preventive Care • Urgent Care • Lab Services • Onsite pharmacy • Occupational Health Services • Wellness Room Program Success ‐ Intervention • Partnered with the Employee Wellness Center to provide an onsite Diabetes Management program. • Seven week targeted intervention for those who have diabetes or care for someone with Diabetes • Goal – remove the barriers to care! 4 93 2015 Objectives • Partner with Strategic Planning to connect the Take CARE Program to CMH strategic objectives • Develop new programming options to ensure continuation of incremental improvements • Explore new ways to incentivize participation – Reward health improvement 5 94 By Jana Goolsby, PTA, CPT Wellbeing Coordinator Demographics • • • • • 860 FTE Local Government Johnson County, KS Age 42 Male 1 95 Goal “The City’s wellness program goal is to provide employees with resources to put their health first, from the moment of hire to the point of retire” Olathe Works Well • • • • • • • • • Moment of hire: Post‐offer employment testing (POET) Onsite health & wellness center for employees, spouses, dependents, and retirees on the City’s health plan Participation based incentive program to complete an annual HRA & biometric health screening Outcome based incentive program to maintain and/or improve health risk results Data utilized to model health plan management, disease management, outreach programs, and quarterly/monthly initiatives 17 FREE fitness classes available for employees Department specific programs Standing work stations Employee Wellness Committee 2 96 97 98 99 100 101 102 103 104 105 106 107 108 HERO EMPLOYEE HEALTH MANAGEMENT BEST PRACTICES SCORECARD IN COLLABORATION WITH MERCER© ANNUAL REPORT 2014 109 2 2 110 A MESSAGE FROM THE HERO AND MERCER SCORECARD TEAM LEADERS With this report, we look back with satisfaction on Version 3 of the HERO Scorecard while looking forward to even greater success with Version 4, which launched in June 2014. First, let’s recall how far we have come. HERO and Mercer launched Version 3, the first online Scorecard, in 2009. More than 1,200 employers completed it, and many used it more than once to track progress over time. We published 18 commentaries using Scorecard data, looking at how specific best practices contribute to better outcomes. Articles citing Scorecard data, including a validation study showing that Scorecard participants with higher scores had lower medical claim costs, have appeared in peer-reviewed journals. Contributing immensely to this success have been the Scorecard Preferred Providers, now numbering 10 — these are organizations that use the Scorecard with their clients and serve as our advisors, lending their knowledge and experience to ensure that the Scorecard best meets employers’ needs. We have been thrilled with how well Version 3 was received and are proud of its role in advancing the use of best practices in employee health management programs. But the health management field has not been static — far from it — so we had to change, too. The HERO Scorecard Version 4 is the result of more than a year of discussions (and sometimes debates) among a panel of employee health management (EHM) experts, with review and input from some of the best thinkers in the field. We have added questions on practices that either did not exist or were just emerging when Version 3 was created — for example, outcomes-based incentives and gamification strategies. We have also been able to use our findings on which best practices have the biggest impact to shift emphasis in both the number of questions asked and the number of points allocated. TABLE OF CONTENTS THE HERO BEST PRACTICES SCORECARD: A PROGRESS REPORT.. 3 A FIRST LOOK AT VERSION 4 DATA .... 5 CAN THE HERO SCORECARD PREDICT HEALTH CARE COST TRENDS AND EMPLOYEE HEALTH RISKS?................ 8 STRATEGIC PLANNING — A PATH TO GREATER HEALTH IMPACT.......... 10 UNDERSTANDING THE IMPORTANCE OF ORGANIZATIONAL SUPPORT...... 12 THE ROLE OF STAKEHOLDER AND EMPLOYEE ASSESSMENT IN GUIDING EHM PROGRAMS............................. 14 WELLNESS CHAMPION NETWORKS ASSOCIATED WITH MORE SUCCESSFUL PROGRAMS................ 16 We are excited that nearly 100 employers completed the new Scorecard in just its first three months, and in this report we share a sneak preview of some of the aggregated responses, along with commentaries based on Version 3 results. Although it will take time to rebuild our benchmarking database to its former size, with a solid infrastructure in place and the learning curve behind us, we expect to power up very quickly. We believe you will agree that the up-to-the-minute inventory of EHM best practices, enhanced by what we have learned from hundreds of Scorecard participants over the past five years, will make the new Scorecard an even more valuable tool for the industry. We thank you for your interest and support. Jerry Noyce CEO, HERO Steven Noeldner, PhD Partner, Mercer 1 111 2 112 THE HERO BEST PRACTICES SCORECARD: A PROGRESS REPORT Both a self-assessment tool and an ongoing research survey, the HERO Best Practices Scorecard helps employers, providers, and other stakeholders identify and learn about employee health management best practices. The online Scorecard questionnaire is divided into six sections representing the foundational components that support exemplary EHM programs. While no inventory of best practices will include all innovative approaches to EHM, the Scorecard includes those most commonly recognized by industry thought leaders and in published literature. Employers answer detailed questions about their EHM strategy program design, administration, and experience. Once they submit their responses, they are immediately sent an email with their overall score and scores for each section. This brief report also includes the average score for all respondents nationally and for three employer size groups so that employers may compare themselves to a peer group. The Scorecard also includes a separate section on program outcomes. Responses in this section do not contribute to an organization’s best practices score but are used for benchmarking and to study relationships between specific best practices and outcomes. THE SCORECARD DEVELOPMENT: AN ONGOING COLLABORATION OF THE EHM COMMUNITY The Scorecard was first developed in 2006 in consultation with authoritative sources on EHM best practices, including the Health Project’s C. Everett Koop National Health Awards criteria, the WELCOA Well Workplace Awards criteria, Partnership for Prevention’s Health Management Initiative Assessment, and the Department of Health and Human Services’ Partnership for Healthy Workforce 2010 criteria. In 2009, HERO and Mercer collaborated to update the Scorecard content and scoring system and make it widely available for the first time in a web-based format — Version 3. Again, a broad panel of experts was recruited to assist with the questions and the scoring system, which was developed using a consensus-building exercise. Panel members distributed 200 points across the Scorecard questions based on his or her judgment about their relative importance to a successful EHM program. (“Successful” was defined as able or likely to improve total health care spend.) Given limited evidence on the impact of specific programmatic elements on health care cost trend, the contributors offered their scores based on the best research available, as well as their experience and anecdotal evidence. Work on Version 4 began in 2013. A core team overhauled the Scorecard questions and an additional panel of experts reviewed their work (all contributors are listed on the HERO website). Analyses of Scorecard Version 3 data were used to refine the scoring system, although, particularly with the newer best practices, panel members again relied on judgment and other available research. Version 4 was released in June 2014. As you will read in the case studies included in this report, some employers find the greatest value of the Scorecard by simply using it as an inventory of health management best practices compiled by leaders in the field. Others find that comparing their scores to national norms helps validate current strategies, identify opportunities for improvement, and set goals for improvement. 3 113 With the Scorecard, learning is a two-way street. When employers complete the Scorecard, they are also feeding a rapidly growing database with information about their program strategy, design, and management — and about the participation levels and outcomes their program achieves. Data from the earlier version of the Scorecard have been used for benchmarking and research. Five studies based on analyses of the Version 3 database are presented in this report; they examine such topics as the role of organizational support in successful EHM programs and whether wellness champion networks are associated with higher participation rates and behavior change. (A complete list of the commentaries based on Version 3 data, with synopses, is available on the HERO website: http://www.the-HERO.org.) In addition, an article describing a study that examined the claims data of HERO Scorecard participants and found that higher scores were related to lower medical plan costs was published earlier this year in the Journal of Occupational and Environmental Medicine (Goetzel et al, 2014;56(2):136–144). employers easy access to the latest best thinking on how to build a successful program and a way to share information about their programs with one another. The Scorecard Preferred Provider Program, launched in 2011, extends the reach of the Scorecard by allowing qualified organizations in the EHM field to make it available to clients on their own websites. Currently, 10 organizations participate. Each organization is provided with a custom link to the Scorecard, along with website content, template marketing materials, and training to assist in rolling out the Scorecard to its clients. At the end of each quarter, members are provided with a database of all Scorecard responses received through their own custom links (with individual company identifiers if the respondent has granted permission). The members participate in regular calls to provide feedback on the Scorecard and the Preferred Provider Program. THE HERO SCORECARD PREFERRED PROVIDERS Comprehensive benchmark reports that provide the aggregated responses to every question asked in the Scorecard are also available. Drawn from the full Scorecard database, these benchmark reports compare program strategy, design, and outcomes for all Scorecard respondents and for groups based on industry, size, and geographic location. Currently, benchmark reports based on Version 3 data may be purchased through the HERO website; we expect that reports based on Version 4 data will be available by the end of 2014. THE SCORECARD PREFERRED PROVIDER PROGRAM Broad employer participation is a priority for the HERO/ Mercer Scorecard team for two reasons. First, a bigger database can support more and better research. But just as important is the goal of advancing the field of EHM by giving Alere Health Blue Cross/Blue Shield of North Dakota Capital BlueCross Healthy Fit Healthyroads Kaiser Permanente Mayo Clinic Mercer Providence Health Care StayWell As of June 2014, participation in Version 3 of the Scorecard (now closed) had grown to more than 1,200 employers, with good representation of large, midsize, and small organizations. As of September 2014, more than 80 employers have completed Version 4. Scorecard Respondent Profile (Version 3) Number of respondents All employers Distribution of respondents by best practices score 1,284 Employers with fewer than 500 employees 341 Employers with 500–4,999 employees 558 Employers with 5,000 or more employees 362 161–200 points, 1–40 points, 5% 11% 131–160 points, 16% 41–70 points, 19% 101–130 points, 26% 71–100 points, 24% Note: Percentages do not total 100 due to rounding. 4 114 A FIRST LOOK AT VERSION 4 DATA Beth Umland Director of Research for Health & Benefits, Mercer Taken together, the differences between Versions 3 and 4 of the HERO Scorecard tell the story of how the field of EHM has evolved over the past five years. While employers who have completed the prior version of the Scorecard will recognize many of the questions, about half of the questions are new or substantially revised. Key changes include: • New questions on incentives, including outcomes-based incentives and intrinsic reward strategies. • New questions on participation strategies to drive engagement, including the use of mobile apps and devices, challenges, and other social networking strategies. • Updated questions on program design, including more detailed questions on lifestyle coaching. • New questions on program integration, including disability and safety programs. • A new section on program outcomes, with quantitative questions permitting the study of return on investment/ value of investment. • Additional demographic questions for more precise benchmarking. In addition, the scoring system has been modified to shift points away from programs and participation strategies to organizational culture, program integration, and measurement. As a result, the same company might receive significantly different scores in Versions 3 and 4 of the Scorecard. When we launched Version 4, we assumed that, in general, average scores would be lower relative to Version 3 scores, reflecting the addition of relatively recent best practices not yet in common use. More than 1,200 employers had completed Version 3 before we took it offline in June 2014, and by the end of August 2014 about 80 organizations had completed Version 4. Clearly, it is too soon to draw conclusions about the state of EHM programs based on this relatively small sample. However, we can provide some early results that suggest how far the industry has moved in the past few years — with the caveat that any numbers cited here will likely change as the database grows. The Version 4 data represent the current status of programs in 2014, while the Version 3 data include information collected as early as 2009 from Scorecard completers (when employers have responded multiple times, the database includes only their most recent response). STRATEGIC PLANNING Past analyses of Scorecard data have shown that employers with a formal, written strategic plan for EHM in place were more likely to report that their program had helped to reduce health risks and lower medical plan cost. Just over half of the new Version 4 respondents (53%) have a formal strategic plan in place, compared to 44% of the Version 3 respondents. In both groups, participation is the most common measurable objective included in the plan. Version 4 respondents are somewhat more likely to include financial objectives — which, in past studies of Scorecard data, have been shown to increase the likelihood of positive financial outcomes. The Version 4 Scorecard includes a new objective — employee satisfaction, morale, and engagement — and half of the respondents with strategic plans say this measure is included in their plan. This section also includes a new question to gauge whether leaders understand the strategic importance of EHM: “To what extent is your EHM program viewed by senior leadership as connected to broader business results?” About a third responded “To a great extent,” while 17% reported that it is not seen as connected at all to results. Once we have accumulated enough responses, it will be valuable to compare the program outcomes between these two groups of employers. ORGANIZATIONAL AND CULTURAL SUPPORT Expanding on the leadership and organizational support components of Version 3, the Version 4 Scorecard incorporates critical organizational and cultural support strategies for EHM. For example, Version 4 asks about specific policies that support this commitment, such as allowing employees to use work time for physical activity 5 115 (36% of respondents do) or stress management (28% of respondents do). While 60% say that healthy food choices are available at the workplace, surprisingly, only 57% of respondents have a tobacco-free workplace or campus. More than a third of Version 4 respondents say that their company vision or mission statement supports a healthy workplace culture. Analyses of Scorecard Version 3 data have shown that when leaders participate in EHM programs, participation rates are higher and outcomes are better. However, there was no improvement in this best practice from Version 3 (53% of respondents said leaders actively participate) to Version 4 (51%). And only 32% of Version 4 respondents say that leaders are role models for prioritizing health and work/life balance (for example, they do not send email while on vacation, they take activity breaks during the work day, and so on). PROGRAMS Version 3 of the Scorecard asked detailed questions about core EHM programs targeted to at-risk or chronically ill individuals. In recognition of the importance of creating a culture of health within an organization, Version 4 added questions about health behavior change programs that are offered to all individuals eligible for EHM, regardless of health status. Fully three-quarters of respondents offer these types of programs, and many incorporate new technologies and social strategies to promote engagement. Using Technology and Social Strategies to Promote Engagement 6 Program incorporates use of tracking tools such as a pedometer, glucometer, or automated scale 46% Program is mobile supported (e.g., allows individuals to monitor progress and interact via smartphone) 39% Program incorporates social connection (e.g., allows individuals to communicate with, support, and/or challenge other individuals to form teams) 44% PROGRAM INTEGRATION Version 4 respondents still have plenty of room for improvement in terms of ensuring that their EHM programs are effectively integrated with each other, the health plan, the safety program, and disability programs. For example, just 29% of Version 3 respondents said that “stakeholders are required to provide warm transfer of employees to another program.” Similarly, just 33% of Version 4 respondents say that “EHM partners provide warm transfer of individuals to programs and services provided by other partners.” Furthermore, only 21% of Version 4 respondents say that the EHM program is integrated in any way with disability programs. PARTICIPATION STRATEGIES Participation strategies, which include communication and incentive design, significantly affect participation rates and program outcomes. Our past research had shown that financial incentives help drive participation rates, but communication efforts are even more strongly related to positive health and financial outcomes. Branding the EHM program with a unique name and logo was found to be especially helpful in earlier analyses, but only 59% of Version 4 respondents use this tactic, little changed from 56% of Version 3 respondents. Looking at incentive design, nearly three-fourths of Version 4 respondents use some type of financial reward or penalty in connection with the program, with most of these incentives (nine out of 10) communicated as rewards. While incentives for participating are the most common, a third of respondents that use incentives say that employees have a financial incentive to achieve, maintain, or show progress toward specific health status targets. Respondents report that, on average, 59% of eligible employees earn at least some of the available incentive and 42% earn the maximum incentive. While financial incentives are widely used, 33% of respondents say that their engagement strategy intentionally includes a focus on increasing employees’ intrinsic motivation to improve or maintain their health. The majority use some type of social strategy to build engagement. For example, 67% use competitions or challenges, and 40% connect participation to a cause. This is an area that we will study closely as the database grows, as participation strategies are diverse and best practices are still being determined. 116 MEASUREMENT AND EVALUATION To continually improve an EHM program, an employer needs to measure its performance. Despite the importance of measurement and evaluation, this work is still challenging for employers. Fewer than half of Version 4 respondents believe that their data management and evaluation efforts are contributing significantly to the success of their program. While 68% capture participation data and 61% look at health care utilization and cost data, about half use health risk data and only 20% use productivity data to evaluate EHM performance. outcomes — not just financial returns. The metrics included within the Version 4 Scorecard reflect the measures outlined within the HERO/Population Health Alliance Program Measurement and Evaluation Guide: Core Metrics for Employee Management. The inclusion of these recommended measures within the outcomes section of the Version 4 Scorecard will not only allow HERO to guide employers in their measurement but also provide a valuable benchmark to HERO Scorecard completers. Although it is too soon to report on the outcomes data collected in Version 4, we expect to use these results to evaluate the impact of using EHM best practices more precisely than was possible in the past. OUTCOMES One of the big challenges facing the EHM community is proving the value of investment. One of the goals of the new Scorecard is to assist in this task by providing employers with a set of metrics to use in measuring the full range of EMPLOYER SCORECARD EXPERIENCE: CAPITAL BLUECROSS For more than 75 years, Capital BlueCross has served residents and businesses in central Pennsylvania and Lehigh Valley as the region’s leading health insurer. Additionally, employers turn to Capital BlueCross to develop, implement, and evaluate worksite wellness programs. The premise of worksite wellness programs is to apply strategies that promote good health and lower the risk of chronic disease. These programs have the power to lower health care costs, decrease absenteeism, and increase productivity. Capital BlueCross believes that it helps organizations create effective worksite wellness programs by working from the inside out. The organization views its efforts to help employees live healthier as a key component of the employee engagement strategy for business success. The HERO Scorecard has been a valuable tool for the organization’s Wellness Committee and supportive senior management, as they have worked together with employees to build a comprehensive wellness program that garnered top favorability scores in a recent employee engagement survey. “Just from the nature of our work to improve the health of the community, we have always maintained a focus on the health of our own employees,” says Gina McDonald, senior health coach at Capital BlueCross. “As with most organizations, however, it has been an evolutionary process to build the robust worksite wellness program we have at our company today. Fortunately, we have a senior leadership team that believes in the importance of creating a culture of health and an employee base willing to embrace it.” Capital BlueCross’ wellness program has grown to provide a comprehensive array of traditional programs and services with high participation, as well as state-of-the-art mobile applications and both digital coaching and face-to-face health coaching. Nutrition-related classes and collaborative efforts with the food service vendor have been wellreceived, as have self-defense classes for the predominantly female workforce. The rewards structure has evolved over time, gradually shifting emphasis to taking action to improve one’s health from participating in awareness campaigns and self-reported activities. Achieving and maintaining high levels of mid-management support are aided by a CEO who regularly highlights the importance of employee wellness at company-wide management meetings. “Using the HERO scorecard as a benchmark each year has enabled Capital BlueCross to identify areas of strength and areas of augmentation within our programming,” says McDonald. “Now we have quantitative data that support our worksite wellness offerings, changes, and improvements. Simply put, the HERO Scorecard provides us a trusted framework for employee wellness programming and continued improvement. That’s important to Capital BlueCross, because our workforce truly is our most important asset.” 7 117 CAN THE HERO SCORECARD PREDICT HEALTH CARE COST TRENDS AND EMPLOYEE HEALTH RISKS? Ron Z. Goetzel, PhD Truven Health Analytics Originally published January 2014 In 2013, HERO commissioned Truven Health Analytics and Emory University to conduct a research study that would examine the HERO Scorecard’s ability to predict health care cost trends for large employers, as well as their employees’ risk profiles. The study was published in the Journal of Occupational and Environmental Medicine in February 2014, in an article authored by researchers at Truven Health and Emory University and several HERO members, including Jessica Grossmeier, Shawn Mason, Dan Gold, Steve Noeldner, and David Anderson. Funding for the research was provided by HERO Research Partners Charter Members, including Alere, HealthFitness, Healthways, Kaiser Permanente, Plus One Health Management, Prudential Financial, StayWell Health Management, and University of Pittsburgh Medical Center. WHY DID HERO COMMISSION THIS STUDY? We know that well-designed, comprehensive, and evidencebased workplace health promotion programs can improve the health risk profile of employees and lower their health care costs. However, too few US employers provide effective programs, often because they lack the tools and knowledge to design and implement world-class EHM programs. The HERO Scorecard was developed to help employers measure the extent to which their programs align with industry best practices. The Scorecard is now one of the most widely used organizational health assessment tools, with over 1,000 employers completing the survey. Employers who complete the survey use their scores to evaluate their program’s success, but until now, they did not really know whether a good score could predict outcomes important to businesses — health care cost trends and employees’ health risks. 8 This study tested the validity of the HERO Scorecard by asking a question: Are higher scores on the tool associated with reductions in health care costs? The study also looked at the Scorecard’s ability to predict changes in employee health risks. HOW DID WE CONDUCT THE STUDY? The study team identified organizations that completed the HERO Scorecard and contributed medical claims and health risk data to the Truven Health MarketScan databases. MarketScan contains longitudinal, fully integrated, and de-identified person-level claims data (inpatient, outpatient, drug, lab, and health risk assessment) collected from Truven Health employer clients. We isolated the data for the 33 HERO Scorecard contributors identified and then measured their employees’ annual health care expenditures and health risks for the period of 2009–2011. Over 700,000 employees from the 33-company sample were studied across three years. First, we looked at overall cost and health risk trends for these employers and then separated the experience of companies scoring “high” on the HERO Scorecard (with scores between 100 and 200) compared to those scoring “low” (with scores of 0–99). We developed a multiple regression model to predict health care costs and employee health risks based on employers’ high or low scores. WHAT DID WE FIND? In general, the 33 companies in our study scored higher in each of the six sections of the HERO Scorecard and overall compared to the “average” HERO Scorecard respondent. This is likely because the study sample group comprised Truven Health clients that are generally larger companies with more extensive resources and “know how” to direct at workplace health promotion programs. 118 Predicted Average Annual Health Care Expenditures (Adjusted to 2012 Dollars) for Organizations With High and Low HERO Scores $3,100 $3,050 $3,000 $2,950 $2,900 $2,850 $2,800 $2,750 $2,700 2009 2010 (% change from 2009) 2011 (% change from 2010) Low $3,048 $3,050 (0.1%) $3,051 (0.0%) High $2,948 $2,901 (-1.6%) $2,855 (-1.6%) When comparing the low-scoring to high-scoring HERO companies, those with low scores maintained their health care spending while organizations with high scores experienced an average of a 1.6 percentage point annual reduction in health care expenditures during the study period (adjusted for medical inflation). We also found that low-scoring organizations had more employees at high risk at the start of the study period, compared to organizations with high HERO scores. However, over the three-year study period, organizations with low HERO scores achieved significantly greater reductions in three of the four risk factors studied (obesity, high blood pressure, high total cholesterol, but not high blood glucose) when compared to organizations with high HERO scores that also reduced their employees’ health risks but at a slower pace. WHAT CONCLUSIONS CAN BE DRAWN FROM THE STUDY? Organizations scoring high on the HERO Scorecard experienced better (reduced) health care cost trends compared to low HERO scoring companies. Interestingly, almost all of the organizations achieved either a reduction in health care costs or stabilization in those costs during the study period. This may be because these companies were more focused on managing employees’ health and related costs, which may have prompted them both to complete the Scorecard and to seek solutions to the root causes of increasing health care costs and poor health among their employees. Our analysis of health risk trends was limited by the small number of organizations contributing health risk data on their employees to the MarketScan databases. In this secondary analysis, we found that low-scoring companies achieved greater reductions in three out of four health risks studied when compared to the high-scoring companies, but these low scorers had employees at higher risk at baseline. In the Journal of Occupational and Environmental Medicine article, we discuss some possible explanations for these results, but, in the end, we concluded that the small number of employers in the study (especially in the health risk analysis) limits our ability to draw broad generalizations from the data. As might be expected, we call for additional research on the predictive power of the HERO Scorecard. In sum, building and validating an organizational assessment tool takes time and effort. The HERO Scorecard has undergone extensive scrutiny by experts and laypersons alike, and will continue to be refined and enhanced. Its widespread adoption by the business community speaks to its ease of use and face validity. While more testing is certainly needed, employers can today confidently employ the Scorecard to design, implement, and evaluate their worksite health promotion programs. 9 119 STRATEGIC PLANNING — A PATH TO GREATER HEALTH IMPACT Seth Serxner, PhD, MPH Chief Health Officer and Senior VP of Population Health, OptumHealth Originally published January 2013 Over the past few years, employers have been increasing their investment in EHM, adding new programs and offering employees financial rewards for participating. Among employers completing the HERO Scorecard in 2009–2010, the median EHM program cost per eligible person per month was $10; among those responding in 2011–2012, it was $13. However, the use of formal strategic planning for EHM has not kept pace, and some employers may be missing an important opportunity to maximize their growing investment in EHM. The HERO Scorecard assesses six broad dimensions of EHM best practices: strategic planning, leadership engagement, program-level management, programs, engagement methods, and measurement and evaluation. Each of these sections is scored individually. A recent analysis of the HERO Scorecard database looked at both respondents’ section scores and individual best practices within each section to gauge their impact on various measures of EHM program performance. As discussed below, this analysis suggests that strategic planning is a critical success factor in engaging employees, improving health, and achieving health care cost savings. STRATEGIC PLANNING ACTIVITY The Scorecard section on strategic planning asks employers about their use of best practices, such as having a written plan, measurable objectives, and strategies for addressing different portions of the population. At the end of the section, employers are asked to rate the effectiveness of their planning process. More than half of respondents — 57% — said they did not have a formal written strategic plan regarding EHM, and 18% take planning one year at a time. Only 25% have a multi-year strategic plan in place. These findings seem surprising since most business decisions involving significant human capital and financial investment occur within a strategic business planning context. Why would investment in EHM be any different? This finding sets the context for the results of the self-assessment question — almost half (47%) of respondents do not believe that their strategic planning for EHM has been effective. 10 EHM: Relatively Few Employers Plan Ahead Have a formal, written, strategic plan for EHM Have a long-term plan (2 or more years), 25% Have an annual plan only, 18% Don’t have a formal plan, 57% STRATEGIC PLANNING IMPACT ON ENGAGEMENT, HEALTH, AND COST SAVINGS While strategic planning may seem like an obvious element in successful program implementation and outcomes, this analysis pointed to a direct relationship between the two. In fact, of the six best-practices categories, strategic planning was among the top three in terms of driving greater engagement, improved health, and medical plan savings. Strategic planning had the greatest impact on health improvement of all the categories. Nearly nine out of 10 respondents who rated their organization as having very effective or effective strategic planning for EHM (86%) reported seeing health improvement, compared to only 5% of those who rated their strategic planning as ineffective. These two groups also reported very different health assessment participation rates (a key measure of employee engagement) — 59% of eligible employees compared to 35% for those rating their strategic planning as, respectively, effective and ineffective. Only the use of incentives had a bigger impact on health assessment participation rates. 120 Finally, effective strategic planning was also closely linked to medical plan cost savings, with only communications and incentives having stronger relationships. One important reason employers with strategic plans report better outcomes is that many of these plans include measurable objectives. Most (85%) include objectives for program participation, while 71% include objectives for health risk reduction and 56% include financial objectives. Overall, strategic planning, which in many cases drives communications strategy, leadership involvement, employee engagement, and programming, is a critical best practices that can often be overlooked in the rush to “get started” and just implement a program — and then be overlooked again as the program grows from a small initiative to a significant investment. This analysis supports the importance of the strategic planning process to increase the likelihood of achieving positive program outcomes. EMPLOYER SCORECARD EXPERIENCE: THE VALLEY HEALTH ALLIANCE The Valley Health Alliance (VHA) was established in 2013 by five employers* within the Colorado Roaring Fork Valley to foster health care and wellness activity that: • Is affordable and accessible. • Focuses on improved health, appropriate care, and controlled costs. • Fosters collaboration among employers, providers, and patients. • Is financially sustainable for employees, employers, and providers. As a first step, the VHA engaged in a three-year pilot project focused on creating a culture of health within its community, taking an evidence-based, best-practices approach. The launch of the HERO Scorecard Version 4 was well-timed for the VHA, as it helped each member organization identify priorities for enhancing population health. In an effort to establish a baseline, identify opportunities, and prioritize the strategic approach, each of the five VHA employer organizations completed the HERO Scorecard with assistance from Mayo Clinic Global Business Solutions, a HERO Scorecard Preferred Provider. “The process allowed each organization to identify strengths and opportunities within each best practices area and aggregate VHA data to identify key opportunities to accomplish specific goals,” says Jennifer Flynn, MS, Mayo Clinic strategy consultant. After reviewing its HERO Scorecard results, the VHA decided to develop a brand and work on creating a strong image for the organization. It will also launch campaigns around health risk assessments, biometric screenings, and flu shots, as well as capture key metrics to use for strategic planning going forward. As executive director of the VHA, Kathleen Killion noted that “the HERO Scorecard allowed VHA to identify best practices that are already in place, opportunities for collaboration, and enhancements that can significantly impact the success of our initiative.” The VHA is now armed with actionable data to strategically focus its efforts on the needs and health of the community and build a culture of health. *Aspen School District, Aspen Skiing Company, Aspen Valley Hospital, City of Aspen, Pitkin County 11 121 UNDERSTANDING THE IMPORTANCE OF ORGANIZATIONAL SUPPORT Jennifer Flynn, MS Strategy Consultant, Mayo Clinic Originally published April 2013 Although supporting the health and well-being of employees might seem to be a given within organizations that provide EHM programs, we are learning that organizational support is a key factor in program effectiveness. Experts in the field have been working to define the elements of organizational support and demonstrate how the degree of support (type, quantity, and quality) correlates with program outcomes. Organizational support can be defined as the degree to which an organization commits to the health and well-being of its employees. Furthermore, the formal and informal programs, policies, and procedures within an organization that “make the healthy choice the easy choice” are recognized as the deliberate steps that define organizational support. Recognized as an important dimension of an organization’s culture, companies have begun to focus on organizational support within their overall strategy and programming in an effort to create a “culture of health.” The Scorecard assesses many of the foundational elements of organizational support — which are by no means found in all organizations. For example, 34% of Scorecard respondents report that their corporate mission statement supports a healthy workplace culture. Senior leadership participates in program initiatives in 52% of Scorecard organizations. Employees are recognized for healthy behaviors in 50%. Fitness facilities or walking trails are provided by 60%. While no one best practices will make or break a health management program, analysis of the Scorecard database suggests that programs that incorporate the most organizational-support best practices are the most likely to report overall program success. ORGANIZATIONAL SUPPORT LENDS ITSELF TO GREATER USE OF BEST PRACTICES Using the HERO Scorecard database, an analysis was conducted to test the hypothesis that companies that provide a greater degree of organizational support reap 12 the benefits of better outcomes. Three degrees of organizational support were created (low, medium, and high), based on the use of best practices in the areas of leadership support, employee involvement, supportive environment, health policies, programs/resources, strategy, and rewards. We learned that those companies that report a higher level of organizational support not only have an overall higher score on the HERO Scorecard but also have higher scores within each section of the Scorecard. In other words, the companies that provide a greater degree of organizational support are stronger in all best practices areas. GREATER ORGANIZATIONAL SUPPORT, BETTER OUTCOMES Many companies judge the success of their programs based on employee participation and engagement, positive health trends, and improvement in health care spend. When we reviewed these outcomes for companies with high organizational support and compared them to those with a low degree of support, we found that the average participation in health assessments, biometrics screenings, disease management programs, and lifestyle change programs increased as the degree of organizational support increased. Participation Rates Rise With the Level of Organizational Support for Health Program component Average program participation rate Low support Moderate support High support Health assessment 30% 46% 59% Biometric screenings 33% 45% 53% Disease management programs 15% 24% 27% Lifestyle change programs 13% 21% 28% 122 In addition to participation, we also found that companies with higher degrees of organizational support reported greater success in managing health trend and cost spend: 71% of companies with a high score in organizational support reported a slight or significant improvement in health risk, in comparison to 23% for those companies with a low score in organizational support. In addition, 27% of companies with a high organizational support score reported that the program has had a substantial positive impact on medical trend, in comparison to 9% of companies with a low organizational support score. High-scoring companies also collected more data for the management of their programs and reported program performance more frequently to key stakeholders. The role of organizational support in creating a culture of health is drawing a great deal of attention among those working in EHM today. This analysis helps confirm the value of support by the organization and its importance in achieving positive outcomes. EMPLOYER SCORECARD EXPERIENCE: UNIVERSITY OF SAN DIEGO As a nationally ranked Catholic university, the University of San Diego (USD) is committed to advancing academic excellence, expanding liberal and professional knowledge, creating a diverse and inclusive community, and preparing leaders dedicated to ethical and compassionate service. This commitment extends to faculty and staff. USD found value in completing the HERO Scorecard prior to the implementation of an EHM program. USD has always offered wellness-related events to its employees. However, in 2012, the Human Resources department took the first steps to create a comprehensive, coordinated program, called Being Well @USD. USD worked in tandem with its carrier partners to design the program. It was through its relationship with Kaiser Permanente that USD first learned of the HERO Scorecard. USD’s first use of the HERO Scorecard, taken prior to any actual implementation, resulted in a low score — 64 out of 200 points. The Being Well @USD team understood the value of a baseline from which it could chart progress. Furthermore, the team understood that the Scorecard could serve as a valuable primer to EHM because each question in itself is a best practices. During the first program year, the team focused on improving USD’s score on the sections in which it scored low, in particular Programs and Engagement Methods. Prior to the start of the program’s second year, the team used the HERO Scorecard again, achieving a score of 159. Besides serving as a design and implementation guide, the HERO Scorecard, with its strong research base, lent muchappreciated academic credibility. As Nina Sciuto, director of employee relations for USD, states, “We knew generally where we wanted to go with Being Well @USD, but the HERO Scorecard gave us definitive directions to get there. In the process, it also has given us both more confidence and a more robust picture of what the program really could be.” 13 123 THE ROLE OF STAKEHOLDER AND EMPLOYEE ASSESSMENT IN GUIDING EHM PROGRAMS Rebecca K. Kelly, PhD, RD The University of Alabama Originally published July 2013 To build or expand an EHM program, it is important for organizations and their leaders to understand their current program. An organizational assessment can help determine the progress, limitations, and future strategies and goals for a program. To be most effective, the assessment should look not only at current wellness programming but also at the many factors that affect it: workplace culture, leadership support, environment, communication methods, employee health benefits and policies, and access to data to evaluate the program. Ideally, comprehensive EHM assessments are done prior to developing new initiatives and then repeated every two to three years to measure progress and to identify opportunities for improvement. The Scorecard was designed to help organizations gather information about their EHM programs and to provide them aggregate information for use in benchmarking — on national, regional, industry, and employer size bases. As best practices evolve, so does the Scorecard, and a significant revision was released this year with Version 4. The HERO Scorecard and other employee health assessment instruments emphasize the importance of leadership engagement and employee involvement. One way to build engagement among leaders and employees is by actively involving them in the assessment process. This can be accomplished in a number of ways, including key stakeholder interviews, focus groups, and employee surveys. These assessment tools are described below. KEY STAKEHOLDER INTERVIEWS The purpose of the key stakeholder interview is to better understand the link between business operations and employee health and performance while identifying potential causes of poor health and loss of productivity. Key stakeholders usually include the chief executive officer or president, chief financial officer, and one or more vice presidents. Results from the interviews help shape a program’s overall mission, goals, and strategy. Interview questions usually include gathering information about the organization’s current commitment to, and understanding of, employee health as it relates to business operations; the 14 current participation and involvement in programs from all levels of the organization; an understanding of what success in optimizing employee health looks like and how stakeholders would like it measured; and perceptions of critical health issues. Key findings from the interview should be summarized and reported to the stakeholders and used in strategic planning for the program. FOCUS GROUPS Employee focus groups can help organizations elicit suggestions for ways that EHM programs may better meet the needs of employees and their family members. Each focus group is usually composed of an experienced facilitator and six to 10 individuals, with enough groups conducted to ensure good representation from across the organization. The focus group session will usually last up to one hour. Focus groups can serve as an opportunity to collect information on the health and wellness issues about which employees are concerned, as well as to explore options for the best delivery of programs and services, which may include individual coaching sessions, group classes, online courses, self-guided study programs, books, or brochures. Additionally, key questions include barriers to participation in current program offerings and methods to help gain additional support for the program. This feedback will help organizations better design effective communication tools and health improvement opportunities that best meet employee needs and preferences. EMPLOYEE SURVEYS AND DEMOGRAPHIC ANALYSIS To better understand the opportunities for enhancing participation levels, program managers should consider important employee and plan member demographics. Working with the organization’s human resources, finance, and health and safety departments allows an organization to capture data on employees and dependents based on gender, age, educational level, and job role, as well as information on absenteeism due to personal illness, health care costs, and worker’s compensation costs for the previous three years. This information assists in the design of health and safety interventions. 124 Another aspect of program planning is to explore health disparities that may exist among people of varying race, ethnicity, gender, age, income level, and geographic location. In considering the demographic profile of an organization, several significant issues must be considered in disseminating information and resources. Health resources must be provided to address differences in health literacy and be time sensitive to attract all segments of the workforce. Efforts must also be made to target health improvement solutions not only for the employee but also for the employee’s spouse and family members. Methods Used to Learn About Employee Health Needs Fewer than 500 employees 5,000 or more employees 87% 78% 73% In addition to gathering data from employee surveys, an organization may want to consider gathering health care cost data. By gathering these data, an organization can identify the most critical health issues for its particular workplace based on the category of disease and cost of medications. Information may include a review of the past three years for health care claims and other health-related information. The majority of the HERO Scorecard respondents — 81% — have assessed employee health needs. However, fewer than half of these assessments included focus groups or employee surveys. Interestingly, the largest employers are the least likely to use surveys or focus groups. Among respondents with 5,000 or more employees, most say they use claims data (73%) and health risk assessments (87%) to learn about their employees’ health needs, while just 42% use employee interest surveys or focus groups. Among employers with fewer than 500 employees, 63% use employee interest surveys or focus groups; 78% use health risk assessments, but just 39% use claims analysis. Although smaller employers may not have the technology platforms or access to health-related claims information, such as medical claims and disability data, they have higher rates of participation in employee interest surveys and focus groups. If they are not already doing so, larger employers may wish to consider enhancing their current efforts by incorporating such surveys and focus groups into their assessment process. 63% 42% Health risk assessments Employee interest surveys or focus groups 39% Claims analysis The role of stakeholder and employee assessment in shaping an organization’s employee health goals and strategy, and ultimately in creating a healthy work environment and culture, continues to be a valuable opportunity for all organizations. 15 125 WELLNESS CHAMPION NETWORKS ASSOCIATED WITH MORE SUCCESSFUL PROGRAMS Jessica Grossmeier, PhD, MPH Vice President of Research, HERO Originally published October 2013 Many US-based companies create employee wellness champion or health ambassador networks to build grassroots support for their health management programs. Of 1,154 organizations that completed a HERO Scorecard, 52% reported having such a network in place. One reason that nearly half of the responding organizations have not established wellness champion networks might be that there is little research on their effectiveness. Much of the existing effectiveness research is based on models in which individuals are trained to provide support for peers addressing a specific health need (such as weight management or diabetes selfcare), rather than to encourage good health practices and participation in local-level wellness programs (The Art of Health Promotion, September/October 2013). Additional research is needed to support the value proposition and outcomes associated with this broader wellness champion role. An analysis of HERO Scorecard responses was conducted to determine whether organizations with wellness champion networks had higher participation rates in programs, better health outcomes, or better financial cost impacts than organizations without wellness champion networks in place. Of the organizations represented in the analysis, approximately a fourth (26%) had fewer than 500 employees. While about half of respondents had wellness champion networks, 29% reported having an organized network of individuals at most worksite locations with formal internal communication channels and periodic meetings — in other words, a very robust initiative — while 23% reported having wellness champions at some worksite locations who received internal communications. As might be expected, those with higher overall HERO Scorecard scores were more likely to have the most robust wellness champion networks. When the respondents were divided into three groups of equal size based on score, 53% of those in the highest category of HERO Scorecard scores had the most robust level of wellness champion support, compared to only 9% of the lowest-scoring organizations. 16 Since larger organizations tend to have higher scores, the analysis was stratified based on organization size. Unlike trends observed for many of the health management practices in the HERO Scorecard, smaller organizations were more likely to have the most robust levels of wellness champion network support for their EHM program in every score category. In the highest-scoring category, smaller organizations were about 11% more likely than larger organizations to have an organized wellness champion network. One reason for this may be because smaller organizations have fewer locations, making the network easier to develop and manage. Respondents are asked to provide program participation rates and an assessment of the impact of their program on health risk and medical plan cost; about 400 employers provided responses to these optional questions. An analysis of this data found little association between the level of wellness champion support and participation rates in various program components. However, in examining the influence of wellness champion networks on outcomes, a much stronger association was observed. Since the earlier descriptive analysis indicated that organizations with higher levels of support also had higher HERO Scorecard scores, a stratified analysis was conducted based on organizations with the highest category of scores. Among organizations with an organized wellness champion network or wellness champions at some locations, 61% reported significant impacts on health risks, compared to only 35% of organizations that recruit volunteers or with little or no grassroots support. Similarly, 56% of organizations with the highest levels of support reported a substantial positive impact on medical trend, compared to 44% of organizations with the lowest levels of support. While the lack of association between wellness champion support and participation rates may be surprising, this analysis is consistent with findings reported in a research study published in the Journal of Occupational and Environmental Medicine. The study was based on HERO Scorecard data for 57 companies working with a single national provider of wellness programs. As was reported 126 Employers With Wellness Champion Networks Report Better Outcomes Have seen significant improvement in: Health risks Medical trend Employers with robust wellness champion networks 35% 28% Employers with wellness champions at some locations 26% 28% Employers that recruit volunteers to help with EHM activities 14% 23% Employers with little or no grassroots support for EHM 21% 21% here, the researchers found that use of a wellness champion network was strongly associated with behavior change, but they did not detect a significant association with participation rates in telephonic coaching programs. CONCLUSION While firm conclusions cannot be drawn from these correlational analyses, the results provide preliminary support for the value of wellness champion networks. The data demonstrate that organizations with an organized wellness champion network have better health and financial outcomes. It would be helpful to better understand the roles and responsibilities of wellness champions as well as determine the mechanisms underlying the observed relationships. 17 127 For further information, please visit our websites at: www.the-HERO.org www.mercer.com Copyright 2014 HERO and Mercer LLC. All rights reserved. 13491-HB-240912 128 2015 wellness trends report 2015 Annual Trends and Opportunities Report GCHHVKQEN 0215 These non-insurance services are provided by Humana Wellness. 129 Table of Contents Wellness and your organization 2 Trend #1: The consumerization of health data and its impact on wellness 3 Trend #2: Organizational wellness is getting more organized 5 Trend #3: Workplace stress in America: Why wellness is needed 7 About us 9 Wellness and your organization Workplace wellness, at its core, is policy or programming designed to support healthy behavior in the workplace and improve employees’ health. Recent population trends, such as the rise of conditions like obesity and diabetes, have contributed to crippling healthcare cost increases for organizations and their employees. And the trend continues: One study found that the average healthrelated costs for an employee have risen again by 6.7 percent in 2014, in comparison with the previous year.1 This report will highlight major trends and opportunities in the wellness space. You will find insights about the biggest wellness news stories in 2014, and their ramifications for 2015 and beyond. 2 Trend #1: The consumerization of health data and its impact on wellness 130 What’s happening Consumer-driven health data has been on the rise, thanks to wearable technology such as Fitbit bands and smartwatches like the Apple Watch, as well as health apps, which are projected to be downloaded and used by at least 500 million users by 2015.2 While wearable technology and apps have been more and more popular in recent years, the health and wellness sector of these markets has experienced similar growth.3 In one survey of 1,000 consumers, almost half reported they were “very” or “somewhat” likely to buy a wearable within the next year, the most popular choice being fitness bands (45 percent).4 Many health-related apps monitor traditional markers of physical health like exercise and diet, but the next phase of this trend may focus on mental health. Most have not been made commercially available yet, but those in development are being designed to take advantage of a smartphone’s capabilities. These apps’ capabilities are mainly tracking, using methods such as analyzing a person’s voice and speech on the phone, phone usage patterns, GPS locators, light and sound sensors, and accelerometer, all to record possible hints into the behaviors and moods of a person who may be dealing with depression, bipolar disorder, or other mental health conditions.5 What this means for employers People are becoming more comfortable with self-monitoring and sharing about their health and behaviors Research indicates that a growing majority of people are willing to share health data about themselves with employers.6 Employers can leverage this rich source of information to better design, implement, and promote their wellness programs to meet the needs and preferences of their workers. Common wellness app features Half of smartphone owners have downloaded at least one health-related app, and one in five regularly uses such an app.* Leaderboards/ competitions with friends Gamification Social media connectivity Beautiful interface design Goal Setting Does your workplace wellness program offer these features? * Dan Witters and Sangeeta Agrawal. “How Mobile Technology Can Improve Employees’ Well-Being.” Gallup, Business Journal, posted November 3, 2014, accessed November 14, 2014. http://www.gallup.com/businessjournal/179111/mobile-technology-improve-employees.aspx 3 131 Other good news is that adopters are beginning to view this technology as a way to improve their health and well-being. These programs and devices offer features such as health and wellness challenges, leaderboards, goal setting, and connectivity with social media apps like Facebook and Twitter. According to Gallup, half of smartphone owners have downloaded at least one health-related app, and one in five regularly uses such an app.7 Employers are competing with these offerings for the attention (and engagement) of their employees Employers will need to “keep up” if they want better engagement. That means employers will have to offer tools, resources, and programs with engaging features like gamification, social networking, and quality interface design. One strategy is to take advantage of the great solutions offered in the consumer health market. Many of these consumer products and services partner with wellness program providers. As an example, Humana has more than 20 partners, like Apple, FitBit, Runkeeper, Jawbone UP, MyFitnessPal, Weight Watchers, and Garmin, expanding the features and mobile tracking capabilities of Humana’s health and wellness offerings.8 A report found that 41 percent of employees perceive “lack of time” as their biggest obstacle to There’s a flip side to the growing popularity of these commercial wellness products… employees may use them instead of the wellness programs their employers offer. participating in wellness.9 Employees want added convenience in their wellness program, and some may already be using consumer health tech in their personal lives. A flexible wellness program can connect these dots. For example, a wellness incentives program would be more valuable if it partners with various mobile pedometer apps that track steps. Those employees may already have those apps downloaded, so they would be asked to do little in order to participate in this particular facet of the program. “Employees are looking for a wellness program that helps simplify their life – that is the draw of wearable technology and phone applications,” says Mark Bailey, president of the Bailey Group. “The self-monitoring devices keep employees focused on what is truly important (like managing weight, eating better, increasing activity), and eliminate the redundant task of reporting their health behaviors to their employer. If employers choose to integrate this technology into their existing programs, they should expect to reinvigorate their programs and reap the benefits of flexibility and authentic data.”10 On the other hand, with so many innovations available to Americans every day – streaming of movies to multiple devices, mobile apps that can measure your heart rate, synching your to-do list from your phone to your computer and vice versa – people are embracing technology as the standard, not the exception. Are you providing your employees with digital solutions that are just as convenient, intuitive, and engaging? “Employers need to invest resources into technology, whether it’s by connecting their wellness offerings with consumer solutions or building online portals or apps from within,” says Kristine Mullen, segment vice president of Wellness Strategies and Solutions at Humana.11 “Make the user experience pleasant and convenient. Think fast loading times, synching of data across different devices or platforms, visually appealing layouts, and engaging and easy-to-read language.” Takeaways There are several best practices employers can utilize to address the growing trend of health data sharing. 1. “If you can’t beat ’em, join ’em.” Choose workplace wellness solutions that connect or partner with popular consumer offerings. With these links, you design a wellness solution set with an added dimension of familiarity, convenience, and flexibility for your employees. 2. Consider the end-user experience when developing/engaging digital platforms for employees. If you want employees to be engaged with their wellness program, provide them with website portals, apps, and other digital platforms that are convenient, intuitive, and enjoyable to use. 4 132 3. Anticipate that more informed and interested employees will want to collaborate with you about wellness efforts in the future. “In the past, employers purchased wellness products and made these offerings available to the employee with incentives or disincentives for participation,” says Mullen.12 “In the future, the employees will be coming to the employer and expressing how they want to engage in wellness as they become more educated and informed. The key to success is whether you can accommodate the employees based on their preferences in how they engage in a wellness program. It’s all about meeting the employees where they are in their wellness journeys.” Trend #2: Organizational wellness is getting more organized What’s happening Workplace wellness has become more established and widespread According to one survey, about half of all U.S. employers with at least 50 employees – including a majority of large employers – offer at least one wellness program to their workers.13 Overall, they express confidence that wellness programs make a difference when it comes to lowering medical claims, absenteeism, and factors linked to worker productivity. In addition, the Affordable Care Act (ACA) has played a role in encouraging the increase in workplace wellness. For example, the law supports employers who provide wellness programs by supplying grants or policy flexibility, such as allowing employers to charge workers who smoke up to 50 percent more in health insurance premiums.14 There’s an increased need for measurement Despite employers’ confidence, there is a growing need for measuring the impact of wellness programs. According to the Society for Human Resource Management (SHRM), only half of employers assess the effectiveness of their wellness programs, and about 20 percent measure the return on investment (ROI).15 In another employer survey, only 53 percent report that they use workers’ health data as a part of designing or tracking the results of a wellness program.16 How to measure a culture of health Is your organization supporting a culture of health? In what ways are you succeeding or failing? Start by looking at these big factors. Worksite environment Work policies Does the built environment make it easier for employees to cope with stress, be more active, and take the occasional break? Are your work policies aligned with wellness goals? Does your strict dress code get in the way of fitness Friday? Metrics Senior management Learn more about the level of your workforce’s health from healthcare claims and employee surveys. Are your leaders setting an example? Have you looked at these factors to develop a wellness program right for your organization? 5 Some employers have a great deal of data, but are unsure what to do with it 133 Alternatively, some employers do have access to information collected from their wellness programs, such as self-submitted employee data, aggregate reports stemming from a workforce’s health assessment/biometric screening results, and healthcare claims. But as Towers Watson notes, “Many organizations that do collect data do not integrate and analyze them for corporate decision making.”17 Failing to leverage data is a lost opportunity to design and enhance wellness programming. What this means for employers Employers need expertise and tools to understand their unique needs No two companies are completely alike. An international company in the finance industry with knowledge workers scattered at multiple sites across the globe would not have much in common with a trucking company at one rural location in the Midwest. It would make perfect sense for their wellness programs to be different, reflecting the needs and preferences of their respective workforces. According to the Society for Human Resource Management (SHRM), a wellness program roadmap should be developed with understanding of • Workplace policies and environment • Metrics (e.g., health claims data) • Senior management leadership and commitment18 A concrete first step to developing a strategy is to make use of a company-wide wellness assessment that covers these very areas. Wellness experts at organizations like Humana and others can help employers learn about • Which employee behaviors and lifestyle factors are costing them money • Designing a wellness program that will suit their specific organization’s goals and culture • Developing a strategy to execute a wellness program Without a comprehensive look at the present state of the company’s culture and drivers of costs, how could an employer create and implement a wellness program that will deliver? Most organizational assessments will analyze your health claims data, but you can also examine policies, evaluate worksites, interview senior leaders, and more, to capture a realistic snapshot of your organization’s current state and to develop a wellness strategy that takes into account your existing programs and benefits, work culture, and organizational goals. Devote resources to the planning, implementation, and promotion of your wellness programs. Designate a team or staffer, or hire a consultant to establish or strengthen your culture of health. For example, wellness expert consultants can work within the worksite environment, whether it’s promoting a wellness campaign in the break room with flyers or sending emails out to remote workers with steps on how to participate from home. You can’t make culture happen without the people: A study with the National Small Business Association found that the most cited barrier to installing a wellness program is “lack of interest among employees.”19 One company bucked this trend by achieving a 100 percent active participation rate with HumanaVitality. In this case, having organizational leadership act as wellness “champions” played a key role in driving engagement. The vice president of human resources met with employees one-on-one about the program, and employee communications about the wellness initiative came straight from the company president.20 Employers are finding that having a wellness culture champion can make all the difference in growing an employee population that is truly engaged in caring for their well-being. 6 134 Finally, continually evaluate and adjust wellness programs on a regular basis. Your workforce is always changing, and the wellness strategies you have in place today may not be right a year or five years from now. Wellness experts at companies like Humana provide consultations to help employers discover programming options and make modifications to meet organizational goals and the needs of their employees. Takeaways 1. The measuring stick for wellness shouldn’t be just healthcare claims costs. Look to organizational goals, worksite evaluations, employee performance reviews, unscheduled absences, and more, to evaluate the well-being of your workforce and to influence the design of wellness solutions. 2. Don’t just tell employees that they have health issues – give them easy access to assistance that addresses those issues. About 60 percent of large employers use some type of health appraisal, but experts say it’s only the first step to a health intervention.21 In a 2013 consensus, several national health experts recommend that these appraisals should be followed up with “personal goal setting” and consultation with a health educator.22 Knowing their own state of health creates a baseline of knowledge for employees, and grants them an opportunity for a “teachable moment” to improve their well-being. 3. Instead of shopping for various wellness offerings, first take a broad look at the organization to examine its culture, values, and goals. “It’s all about creating a wellness program that complements the unique identity of your organization,” says Dr. Carlos Mora of the Center for Positive Organizational Studies at the University of Michigan.23 “A nonprofit may value low-cost, high-outcome wellness ideas. An employer with multiple worksites may embrace a digital wellness challenge so all can participate. A start-up may want to explore a digital detox campaign (where employees are expected to stay off their work computers and email for a time) so their employees can achieve better work-life balance. You can look to others for inspiration, but only methodical measurement will help you identify wellness opportunities that make sense for your organization specifically.” Trend #3: Workplace stress in America: Why wellness is needed What’s happening Workers in the U.S. feel more and more overwhelmed by work, finances, and everyday responsibilities More than one-third of all U.S. workers suffer from chronic work stress.24 Stress is also a problem all around the globe. In an international Towers Watson study, employers from 15 different countries unanimously rated stress as the top health concern for their workers.25 High stress leads to lower employee engagement Overwhelmed employees are less likely to participate in wellness programs, and they may generate less work output and meaningful contributions, to boot. Did you know that employees who experience high levels of financial stress have lower levels of productivity and more absences from work, according to one study?26 Stress can make people less mentally focused, less compliant with work policies, and more physically unhealthy. The study also cites the fact that highly stressed employees miss an average of 16 days per year, as opposed to 10 days a year by employees who report low levels of stress. According to a Gallup report that looked at 49 publicly traded companies, “organizations with a critical mass of engaged employees outperformed their competition, compared with those that did not maximize their employees’ potential.” The companies with more satisfied, personally involved employees had higher earnings per share.27 Stress can lead to poorer employee health The link between stress and poor physical health has been documented for a long time. One estimate finds that 75 percent to 90 percent of visits to the doctor are due to health complaints associated with stress.28 Even the Occupational Safety and Health Administration (OSHA) issued an official statement in 2013 that stress is a workplace hazard.29 7 135 What this means for employers Stress costs employers money Stress doesn’t just drive poor physical health; it also triggers or worsens mental illness and substance abuse, which can cost employers as much as $100 billion a year, according to some estimates.30 Research shows that highly stressed people drink more, smoke more, and eat less nutritious foods.31 When you rack up all the estimates, stress is costing employers hundreds of billions of dollars a year, in both direct and indirect healthcare costs, such as lost productivity. However, the majority of employers who have established workplace wellness do not have anything in place to address stress. Wellness is a prime stress buster Employers from 15 different countries unanimously rated stress as the top health concern for their workers.* Here are some wellness-inspired ideas to tackle stress. Offer stress relief, meditation, or resilience topics at the next lunch ‘n learn. Reduce distracting noise in the worksite using white noise machines or signage and messages to remind employees to be considerate toward colleagues. Consider allowing headphone usage for workers who require a great deal of mental focus. During long meetings, institute a “brain break” every 45 to 60 minutes so attendees can recharge. Add decorations or spaces to the worksite to elevate employees’ moods, such as live plants, an aquarium, “privacy pods,” or recliners and rocking chairs in common areas. Try a “digital detox” over the weekend so employees are not checking emails or working seven days a week. Post inspirational messages and jokes in the break room, on the walls, and as marquee text screensavers on your employees’ computers. Stress is a big driver of unhealthy behavior. Does your wellness program have an answer for employee stress? * “The Business Value of a Healthy Workforce: A Global Perspective.” Towers Watson, published June 2014, accessed December 4, 2014. http://www.towerswatson.com/en/ Insights/IC-Types/Survey-Research-Results/2014/02/stayingatwork-report-business-value-of-a-healthy-workforce Employers can provide solutions for stress Wellness isn’t just about exercise and nutrition. Think of it as a way to treat the whole person, not a symptom or a specific problem. In order to truly support employees and to get them better engaged in working on their health, employers need to implement a culture of wellness. In a global survey conducted by Towers Watson, employers indicated they already sensed that, stating “Workplace Health Culture” is their top priority.32 It takes more than the wellness program itself for people to change their behavior. Shifts in policy and management practices should align with the stated goals of the organization. 8 136 “Organizations can help inoculate employees against stress,” says Dr. Randy Martin, director of the Employee Assistance Program at Humana EAP and Work-Life Services,33 “by promoting true breaks from work in the evenings and weekends. Hosting wellnessoriented lunch-and-learn seminars with free healthy foods and beverages also helps employees feel cared for while teaching them positive self-care tips and tools. Leaders, managers, and supervisors should continually remind employees of the wellness programs, or even better, ‘walk the walk’ and use them themselves, and tell their employees about these experiences.” Employers can support employee stress relief with exercise-incentivizing programs and challenges, providing healthful snacks in break rooms, encouraging downtime in the evenings and during weekends (Humana, for example, promotes “digital detox” on weekends where people in most positions are encouraged not to email or work on their computers), and by enthusiastically marketing EAP and work-life services – no-cost help for employees who need support. We view wellness as more than a benefit for employees; it’s a business strategy. Healthier, more productive employees have more to contribute to an organization – and to its bottom line. Takeaways 1. A culture of wellness should offer solutions for stress. Do your work policies reflect a culture of wellness? Or do they contribute to a stressful environment with little support for employees? 2. Leverage existing benefits or add new ones that can help address the mental, emotional, financial, and legal well-being of employees. Integrating these programs can help address the complex interplay between physical health and other facets of well-being. 3. Use organizational resources to plan, promote, and implement holistic wellness. Make use of staffing and other assets already embedded within your organization, or hire a consultant for assistance. And always track the success of your wellness programming, so that you may make adjustments as needed to continually meet the goals of your organization. Closing thoughts Workplace wellness is entering into a new stage of maturity and growth. Employers have been learning lessons over the past few years, and are beginning to understand that wellness is more than a way to control the rising cost of healthcare. It’s also a way for employers to offer support and resources for employees to ensure their highest possible performance. Ultimately, workplace wellness is central to critical business success factors like productivity, talent retention, creativity, presenteeism, and more. Plan for the future. Take time to carefully choose and work with a wellness expert to help you design a customized, thoughtful strategy that’s right for your organization. Whether it’s guidance or execution, the right organizational focus and a wellness partner that fits your vision for a culture of health can assist you in building a wellness program that can help your organization realize its full potential. About us Humana is a company whose primary focus is on the well-being of its members and consumers. Humana Wellness provides consultation and key products and services to help your organization become healthier and more productive. 9 137 1. Bruce Japsen, “In 2014, Workers' Share of Health Costs Nearly $5,000 At Large Companies,” Forbes.com, posted October 17, 2013, accessed December 19, 2014. http://www.forbes.com/sites/brucejapsen/2013/10/17/in-2014-workers-share-of-health-costs-nearly-5000-at-large-companies/ 2. Jonah Comstock, “Report: Health app market has a few big winners,” MobiHealthNews.com, posted May 21, 2014, accessed November 14, 2014. http:// mobihealthnews.com/33336/report-health-app-market-has-a-few-big-winners/ 3. Greg Slabodkin, “Personal health, wellness product market to reach $8B by 2018,” Fierce Mobile Healthcare, posted January 3, 2014, accessed December 16, 2014. http://www.fiercemobilehealthcare.com/story/personal-health-wellness-product-market-reach-8b-2018/2014-01-03 4. “Health wearables: Early days,” Health Research Institute and Pricewaterhousecoopers, posted October 21, 2014, accessed December 5, 2014. http://www.pwc.se/ sv_SE/se/halso-sjukvard/assets/health-wearables-early-days.pdf 5. Davey Alba, “How Smartphone Apps Can Treat Bipolar Disorder and Schizophrenia,” Wired.com, posted November 20, 2014, accessed December 18, 2014. http:// www.wired.com/2014/11/mental-health-apps/ 6. “Health Poll: Data Privacy,” Truven Health Analytics and NPR Health, posted November 2014, accessed December 2, 2014. http://truvenhealth.com/Portals/0/NPRTruven-Health-Poll/NPRPulseDataPrivacy_Nov2014.pdf 7. Dan Witters and Sangeeta Agrawal, “How Mobile Technology Can Improve Employees' Well-Being,” Gallup, Business Journal, posted November 3, 2014, accessed November 14, 2014. http://www.gallup.com/businessjournal/179111/mobile-technology-improve-employees.aspx 8. Mullen, Kristine. Personal interview. December 9, 2014. 9. The Economist Intelligence Unit, “Measuring wellness: From data to insights,” EconomistInsights.com, posted September 17, 2014, accessed December 12, 2014. http://www.economistinsights.com/analysis/measuring-wellness 10. Bailey, Mark. Personal interview. January 9, 2015. 11. Mullen, Kristine. Personal interview. December 9, 2014. 12. Mullen, Kristine. Personal interview. December 9, 2014. 13. Soeren Mattke, Hangsheng Liu, John P. Caloyeras, Christina Y. Huang, Kristin R. Van Busum, Dmitry Khodyakov, Victoria Shier, “Workplace Wellness Programs Study: Final Report,” RAND Health, published 2013, accessed December 2, 2014. http://www.rand.org/content/dam/rand/pubs/research_reports/RR200/RR254/RAND_ RR254.pdf 14. Austin Frakt and Aaron E. Carroll, “Do Workplace Wellness Programs Work? Usually Not,” The New York Times, posted September 11, 2014, accessed December 12, 2014. http://www.nytimes.com/2014/09/12/upshot/do-workplace-wellness-programs-work-usually-not.html?_r=0&abt=0002&abg=0 15. SHRM Online Staff, “Survey: Employers Controlling Costs with Wellness Programs,” Society for Human Resource Management, posted May 18, 2012, accessed December 2, 2014. http://www.shrm.org/hrdisciplines/benefits/articles/pages/costs_wellness.aspx 16. The Economist Intelligence Unit, “Measuring wellness: From data to insights,” EconomistInsights.com, posted September 17, 2014, accessed December 12, 2014. http://www.economistinsights.com/analysis/measuring-wellness 17. “The Business Value of a Healthy Workforce: A Global Perspective,” Towers Watson, published June 2014, accessed December 4, 2014. http://www.towerswatson. com/en/Insights/IC-Types/Survey-Research-Results/2014/02/stayingatwork-report-business-value-of-a-healthy-workforce 18. Steven F. Cyboran and Sadhna Paralkar, “Wellness Program ROI Depends on Design and Implementation,” Society for Human Resource Management, posted July 26, 2013, accessed December 2, 2014. http://www.shrm.org/hrdisciplines/benefits/articles/pages/wellness-roi-design.aspx 19. “Workplace Wellness Programs in Small Business: Impacting the Bottom Line,” National Small Business Association and Humana, posted September 27, 2012, accessed December 12, 2014. http://www.nsba.biz/wp-content/uploads/2012/09/wellness-survey-v3.pdf 20. How a Cincinnati firm got 100 percent participation - Cincinnati Business Courier - April 15, 2014 21. Brian Schilling, “Health Risk Assessments: What You Don't Know Can Cost You,” The Commonwealth Fund, posted March 25, 2011, accessed December 12, 2014. http://www.commonwealthfund.org/publications/newsletters/purchasing-high-performance/2011/march-29-2011/featured-articles/health-risk-assessments 22. Stephen Miller, “Groups Offer Guidance on Biometric Health Screenings,” Society for Human Resource Management, posted October 25, 2013, accessed December 12, 2014. http://www.shrm.org/hrdisciplines/benefits/articles/pages/biometric-screenings-guidance.aspx 23. Mora, Carlos. Personal interview. January 13, 2015. 24. “APA Survey Finds US Employers Unresponsive to Employee Needs,” American Psychological Association, posted March 5, 2013, accessed December 3, 2014. http:// www.apa.org/news/press/releases/2013/03/employee-needs.aspx 25. “The Business Value of a Healthy Workforce: A Global Perspective,” Towers Watson, published June 2014, accessed December 4, 2014. http://www.towerswatson. com/en/Insights/IC-Types/Survey-Research-Results/2014/02/stayingatwork-report-business-value-of-a-healthy-workforce 26. Karen Higginbottom, “Workplace Stress Leads To Less Productive Employees,” Forbes.com, posted September 11, 2014, accessed December 4, 2014. http://www. forbes.com/sites/karenhigginbottom/2014/09/11/workplace-stress-leads-to-less-productive-employees/ 27. “State of the American Workplace: Employee Engagement Insights for U.S. Business Leaders,” Gallup, posted June 11, 2013, accessed December 12, 2014. http:// www.gallup.com/services/178514/state-american-workplace.aspx 28. Joseph Goldberg, reviewer, “The Effects of Stress on Your Body,” WebMD, reviewed June 24, 2014, accessed December 4, 2014. http://www.webmd.com/balance/ stress-management/effects-of-stress-on-your-body 29. Joseph Goldberg, reviewer, “The Effects of Stress on Your Body,” WebMD, reviewed June 24, 2014, accessed December 4, 2014. http://www.webmd.com/balance/ stress-management/effects-of-stress-on-your-body 30. Michael Giardina, “EAPs critical in promoting mental well-being,” Employee Benefit News, posted November 26, 2014, accessed December 2, 2014. http://ebn. benefitnews.com/news/ebn_hc_wellness_disease/eaps-critical-in-promoting-mental-well-being-2744872-1.html?utm_campaign=ebn%20daily-nov%2026%20 2014&utm_medium=email&utm_source=newsletter&ET=ebnbenefitnews%3Ae3401967%3A3518102a%3A&st=email 31. Melissa Conrad Stoppler, “Alcohol & Stress: At Risk for Alcoholism?” MedicineNet.com, last reviewed December 9, 2014, accessed January 30, 2015. http://www. medicinenet.com/script/main/art.asp?articlekey=54999 32. “The Business Value of a Healthy Workforce: A Global Perspective,” Towers Watson, published June 2014, accessed December 4, 2014. http://www.towerswatson. com/en/Insights/IC-Types/Survey-Research-Results/2014/02/stayingatwork-report-business-value-of-a-healthy-workforce 33. Martin, Randy. Personal interview. December 18, 2014. These non-insurance services are provided by Humana Wellness. 10 138 Total Rewards and Employee Well-Being Practices A Report by WorldatWork, Underwritten by HealthMine March 2015 139 About WorldatWork® – The Total Rewards Association WorldatWork (www.worldatwork.org) is a nonprofit human resources association for professionals and organizations focused on compensation, benefits, work-life effectiveness and total rewards – strategies to attract, motivate and retain an engaged and productive workforce. WorldatWork and its affiliates provide comprehensive education, certification, research, advocacy and community, enhancing careers of professionals and, ultimately, achieving better results for the organizations they serve. WorldatWork has more than 65,000 members and subscribers worldwide; 95 percent of Fortune 500 companies employ a WorldatWork member. Founded in 1955, WorldaWork is affiliated with more than 70 local human resources associations and has offices in Scottsdale, Ariz., and Washington, D.C. Contact: WorldatWork Customer Relations 14040 N. Northsight Blvd. Scottsdale, Arizona USA 85260-3601 Toll free: 877-951-9191 Fax 480-483-8352 [email protected] WorldatWork Society of Certified Professionals® is the certifying body for six prestigious designations: the Certified Compensation Professional® (CCP®), Certified Benefits Professional® (CBP), Global Remuneration Professional (GRP®), Work-Life Certified Professional® (WLCP®), Certified Sales Compensation Professional (CSCP)™ and Certified Executive Compensation Professional (CECP)™. The WorldatWork group of registered marks also includes: Alliance for Work-Life Progress or AWLP, workspan and WorldatWork Journal. HealthMine, formerly SeeChange Health Solutions, is an expert automated system uniting all health and wellness programs into a single, powerful solution. It incentivizes your members to take preventive actions – keeping your healthy members healthy, and pre-empting members on the cusp of chronic disease. HealthMine also automatically alerts members about key actions for disease management. It empowers health plan administrators with data to improve group health outcomes and manage costs. HealthMine’s proprietary Personal Clinical Engagement platform integrates lifestyle management and disease management. With 1+ million consumers engaged, HealthMine delivers ROI in wellness. In one plan alone, HealthMine has delivered $2.8 million in benefit savings returned to employees in a year, and $5 million in health care cost savings over the past five years. ©2015 WorldatWork Any laws, regulations or other legal requirements noted in this publication are, to the best of the publisher’s knowledge, accurate and current as of this report’s publishing date. WorldatWork is providing this information with the understanding that WorldatWork is not engaged, directly or by implication, in rendering legal, accounting or other related professional services. You are urged to consult with an attorney, accountant or other qualified professional concerning your own specific situation and any questions that you may have related to that. No portion of this publication may be reproduced in any form without express written permission from WorldatWork. 140 Introduction & Methodology This report summarizes the results of a December 2014 survey of WorldatWork members to gather information about current trends in total rewards and well-being practices. The focus of this research is to uncover findings that bring a unique perspective on comprehensive employee wellness programs and their benefits. On Dec. 10, 2014, survey invitations were electronically sent to 6,484 WorldatWork members. Members were selected for specifically noting compensation and benefits or work-life in their titles and/or areas of responsibility as well as indicating a job function code of total rewards. The survey closed on Jan. 16, 2015, with 446 responses, which is a 7% response rate. The data set was cleaned, resulting in a final data set of 414 responses. In order to provide the most accurate data possible, data were analyzed using statistical software. Any duplicate records were removed. Data comparisons with any relevant, statistically significant differences are noted within this report. The demographics of the survey sample and the respondents are similar to the WorldatWork membership as a whole. The typical WorldatWork member works at the managerial level or higher in the headquarters of a large company in North America. The frequencies or response distributions listed in the report show the number of times or percentage of times a value appears in a data set. Due to rounding, frequencies of data responses provided in this survey may not total 100%. WorldatWork conducted a similar compensation practices survey in 2011, which can be viewed on the WorldatWork website. Where possible, historical comparisons from data gathered in the previous survey are shown. Total Rewards and Employee Well-Being Practices WorldatWork 1 141 Table of Figures Demographics Figure 1: Sector ................................................................................................................................................ 4 Figure 2: Organization size .............................................................................................................................. 4 Figure 3: Industry ............................................................................................................................................. 5 Figure 4: Voluntary turnover............................................................................................................................ 5 Elements of Well-Being Figure 5: Employer-sponsored health-care ...................................................................................................... 10 Figure 6: Elements of well-being, overall percentages ................................................................................... 11 Strategy Figure 7: Well-being strategy .......................................................................................................................... 12 Figure 8: Length of time well-being strategy has been in place....................................................................... 12 Figure 9: Reasons for offering well-being programs or initiatives ................................................................. 13 Eligibility Figure 10: Well-being eligibility ..................................................................................................................... 14 Figure 11: Well-being eligibility and employee group ................................................................................... 14 Figure 12: Well-being and personal values ...................................................................................................... 15 Programs and Initiatives Offered and Utilized Figure 13: Employee usage of programs .......................................................................................................... 15 Figure 14: Attraction efforts ............................................................................................................................. 16 Figure 15: Anticipated change ........................................................................................................................ 16 Figure 15a: Reasons for increase in offerings .................................................................................................. 17 Effectiveness Figure 16: Measurement of effectiveness ....................................................................................................... 18 Figure 17: Effect of well-being programs or initiatives ................................................................................... 18 Support for Organizational Well-Being Programs Figure 18: Retention of programs .................................................................................................................... 19 Figure 19: Incentives and penalties for participation or nonparticipation ........................................................ 20 Figure 20: Acceptance and endorsement of well-being .................................................................................. 21 Figure 21: Communication of well-being programs or initiatives ................................................................... 21 Figure 22: Support from line managers and supervisors .................................................................................. 22 Figure 23: Champion of well-being programs or initiatives ............................................................................ 22 Figure 24: Senior management and well-being ................................................................................................ 23 Additional Analysis Figure 25: Well-being continuum .................................................................................................................... 24 Total Rewards and Employee Well-Being Practices WorldatWork 2 142 Figure 26: Number of programs offered and length of time well-being strategy has been in place ................ 25 Figure 27: Well-being continuum and the measured effect of the well-being programs and indicators.......... 25 Figure 28: Well-being continuum and voluntary turnover ............................................................................... 26 Total Rewards and Employee Well-Being Practices WorldatWork 3 143 Demographics Figure 1: “Your organization is:” (n=337) Public sector 12% Private sector, privately held 36% Nonprofit/Notfor-profit 18% Private sector, publicly traded 34% Figure 2: “Please choose the total number of full-time employees (FTEs) your organization employs worldwide:” (n=341) Option Percentage Fewer than 100 employees 7% 100 to 499 19% 500 to 999 10% 1,000 to 2,499 19% 2,500 to 4,999 12% 5,000 to 9,999 12% 10,000 to 19,999 8% 20,000 to 39,999 5% 40,000 to 99,999 7% 100,000 or more employees 2% Total Rewards and Employee Well-Being Practices WorldatWork 4 144 Figure 3: “What is your industry?” (n=341) Industries with less than 2% are not listed in this table. Option Percentage Finance and Insurance 12% Consulting, Professional, Scientific and Technical Services 11% All Other Manufacturing 10% Health-care and Social Assistance 9% Utilities, Oil and Gas 7% Retail Trade 6% Educational Services 5% Public Administration 4% Transportation 4% Pharmaceuticals 3% Computer and Electronic Manufacturing 2% Construction 2% Information (includes Publishing, IT, etc.) 2% Mining 2% Other Services (except Public Administration) 2% Wholesale Trade 2% Other 15% Figure 4: “What is the approximate annual voluntary turnover for employees?” (n=334) 34% 25% 20% 11% 5% 2% 0%-5% 6%-10% 11%-15% Total Rewards and Employee Well-Being Practices 16%-20% 21%-26% 27%-40% 3% 41% or more WorldatWork 5 145 Executive Summary This survey was conducted to identify traditional wellness plans and new trends in employee well-being. The objective was to gauge how many programs and initiatives organizations offer. The survey also focused on how those offerings are expanding to include a more integrated well-being approach beyond one that is related solely to physical health. Employers continue to depend on health and wellness initiatives to curb health-care costs and foster a successful and productive workforce. Ninety-six percent of organizations support well-being components, as shown in Figure 6, and 90% of their active employees, on average, are eligible. (See Figure 10.) Nearly three-quarters (74%) of organizations are increasing or considerably increasing their well-being offerings in the next two years, as shown in Figure 15, with the objectives of impacting health-care costs and increasing productivity as the top reasons for the increase. (See Figure 15a.) Having a strategy in place is an important component. Nearly half (49%) of organizations have a strategy and 54% of those have had one in place for three or more years. (See Figure 8.) It also appears as though source of the primary champions for well-being programs is growing into the senior-management ranks, including the CEO. (See Figure 23.) Consistent with the 2011 findings, most employers would retain their well-being offerings even if they were to stop offering employer-sponsored health-care. (See Figure 18.) Also consistent with 2011 results are the reasons for offering well-being plans; 82% are trying to improve employee health. (See Figure 9.) In addition to testing the broad concept of well-being, WorldatWork was interested in finding out some common themes within organizations that have a more integrated approach to well-being versus those with more traditional wellness programs. Organizations with an integrated approach offer a higher number of well-being programs, as shown in Figure 26, and report lower voluntary turnover rates. However, the prevalence of high turnover rates at traditional wellness organizations has grown since 2011. (See Figure 28.) Elements of Well-Being Of the 96% of organizations that support well-being elements in their organization, three of the top five offerings are Top 5 Well-Being Elements health-related. (See EAP resource and referral 81% Figure 6.) Since 2011, more organizations are Immunizations 72% supporting well-being by offering physical healthWorkplace safety 72% risk assessments (biometrics, physical Mental/behavioral health 70% fitness, etc.) as this has coverage increased by 14 Physical fitness 69% percentage points to 58%, which is a statistically significant result. Total Rewards and Employee Well-Being Practices WorldatWork 6 146 Strategy 49% of organizations stated that they have an employee well-being strategy in place, as shown in Figure 7, and 54% of those organizations have had their strategy in place for three or more years. (See Figure 8.) Organizations have many reasons for offering well-being programs/initiatives, and the top reasons include: improve employee health (82%), decrease medical premiums and claims costs (78%), and perceived value to employees (77%). These reasons are consistent with findings from 2011. (See Figure 9.) The longer an organization has had a well-being strategy in place, the more well-being programs they tend to offer. Organizations with well-being strategies in place for five or more years have a statistically significantly higher average number of programs than those with strategies in place for three or fewer years. (See Figure 26.) Eligibility For the majority of well-being programs, 90% of responding organizations, all active employees are typically eligible to participate in the majority of well-being programs. This is slightly lower than the 94% of organizations that reported widespread eligibility in 2011, which is a statistically significant shift. Spouses or domestic partners is the next largest eligible group (30%). (See Figure 10.) When asked if some programs are only available to select employees or groups, programs available to exempt/salaried employees has increased 4% and executive-only programs has risen 5% since 2011. (See Figure 11.) Programs and Initiatives Offered and Utilized While many of the top wellbeing elements supported are health-related, these findings also indicate a shared distribution among of healthrelated and work-life balance program rankings. (See Figure 13.) Top 5 Utilized Programs 1. Physical health‐risk assessment 2. Workplace safety 3. Flexible schedules 4. Encourage time away from work 5. Physical fitness (exercising) In organizations with existing programs, 74% anticipate an increase or considerable increase to their well-being offerings, while 24% indicate no change. Only 2% expect a decrease in wellbeing program and activity offerings. (See Figure 15.) The principal reason for those predicting an increase in offerings is the impact on health-care costs, which is consistent with findings in 2011. (See Figure 15a.) Total Rewards and Employee Well-Being Practices WorldatWork 7 147 Effectiveness A notable number of organizations are measuring the effectiveness of their well-being programs (72%), and more than half of these are measuring with participation rates (52%).Health-care costs (37%) and employee satisfaction surveys (31%) are also moderately utilized measures. (See Figure 16.) These measurements align themselves well with the reasons for offering these types of programs indicating further the strategic approach to these programs. We continue to see more than a quarter of organizations not measuring anything (28%). Reasons for Offering Well-Being Measurement of Well-Being Improve employee health Decrease medical premiums and claims costs Perceived value to employees 82% Participation rates 52% 78% Health-care costs 37% 77% 31% Increase employee engagement 74% Employee satisfaction surveys Employee awareness programs and employee engagement scores 22% 75% of organizations find employee satisfaction as the most positive measured effect of wellbeing programs, followed by biometric screening (73%), employee engagement (72%) and productivity (71%). (See Figure 17.) Support for Organizational Well-Being Programs Organizations that offer employer-sponsored health-care believe they would keep most of their well-being offerings if they discontinued employer-sponsored health-care. The well-being programs that organizations are most likely to keep fall in the workplace environment and worklife balance categories. Ninety-five percent of organizations would keep workplace safety and 92% would continue to encourage time away from work (vacation, not plugged in) and flexible schedules. The programs with higher drop rates include: resiliency training (29%), mental/behavioral health coverage (27%), and wellness coaching (26%). (See Figure 18.) While many well-being programs are neither incentivized nor penalized for participation, 64% of organizations offer incentives for physical health-risk assessments (biometrics, physical fitness, etc.). Smoking cessation continues to have the highest penalties (17%) followed by physical health risk assessments (11%). (See Figure 19.) 70% of organizations communicate about their well-being programs on a frequent and ongoing basis throughout the year, as shown in Figure 21, and 58% of line managers and supervisors are empowered to and responsible for supporting employees in participating in the offered programs. (See Figure 22.) These findings are consistent with results from 2011. In 2011, the primary champions of promoting well-being as a strategic and important organizational initiative were top HR executives (43%), which remains similar today but at a reduced percentage (35%). Other roles are increasingly taking the driver’s seat including top benefits/total rewards executives (19%), CEO or president (17%), and all senior management (8%). (See Figure 23.) Total Rewards and Employee Well-Being Practices WorldatWork 8 148 Additional Analysis By viewing well-being in an integrated way, organizations may have a better understanding of what these programs and initiatives can do in creating an atmosphere for employees at work and beyond. A well-being continuum was developed based on answers to key questions in this survey, to analyze how organizations perceive employee well-being on a holistic level. In 2014, the continuum revealed that 39% of organizations are operating with an integrated approach to wellbeing, as opposed to a more traditional and less integrated approach. This has shifted from 2011 where 45% of organizations landed on the integrated side of the scale. (See Figure 25.) Integrated well-being organizations are more likely to rate the measured effect on health-care costs extremely positive or positive (73%) compared to traditional wellness organizations (53%). Additionally, integrated well-being organizations are more likely to rate the measured effect on employee satisfaction extremely positive or positive (77%) compared to traditional wellness organizations (68%). (See Figure 27.) High voluntary turnover (11% to 15%) in traditional wellness organizations is greater than those with an integrated approach to well-being by more than 10 percentage points. (See Figure 28.) Total Rewards and Employee Well-Being Practices WorldatWork 9 149 Results and Analysis Elements of Well-Being Figure 5: “Do you offer employer-sponsored health-care?” No 4% No 3% Yes 96% Yes 97% 2011 (n=478) 2014 (n=413) Total Rewards and Employee Well-Being Practices WorldatWork 10 150 Figure 6: “What elements of well-being do you support within your organization? (Check all that apply.) (n=380) Health-Related Work-Life Balance Immunizations 72% 69% Flexible schedules Encourage time away from work (vacation, not plugged in) Community involvement programs Mental/behavioral health coverage 70% Physical fitness (exercising) 56% Smoking cessation 66% Child-care assistance 26% Diet and nutrition Physical health-risk assessment (biometrics, physical fitness, etc.)1 Disease management 61% Elder-care assistance 20% 58% Caregiving assistance 12% 57% Relief from work overload 5% Behavioral/mental health-risk assessment 30% Retirement-Related Financial education (e.g., primary focus on retirement/investment education) Financial advice (e.g., primary focus on retirement/investment advice) Financial wellness (e.g., debt management, budgeting, etc.) 62% 61% Workplace Environment 63% Workplace safety 72% 37% Ergonomics 57% 28% Stress-Related EAP resource and referral 81% Yoga 28% Meditation/mindfulness training 10% Resiliency training 8% Skill-Building Education Wellness coaching 38% Stress management 36% Time management 31% Healthy workplace relationships 19% Behavioral modification 14% Healthy personal relationships 11% Parenting skills 11% Do Not Offer Well-Being Programs We do not offer any well-being programs 4% 1 A statistically significantly larger number of organizations are offering physical health-risk assessments as an element of well-being in 2014 (58%) compared with 2011 (44%). Total Rewards and Employee Well-Being Practices WorldatWork 11 151 Strategy Figure 7: “Does your organization have a strategy when it comes to employee well-being?” No 46% No 51% Yes 54% Yes 49% 2011 (n=447) Figure 8: 2014 (n=365) “How long have you had this well-being strategy in place?” Only participants that responded yes in Figure 7 received this question. Less than 1 year 17% 7% 38% 39% More than 1 year but less than 3 years 23% 3 years but less than 5 years 28% 21% 5 or more years 2011 (n=242) Total Rewards and Employee Well-Being Practices 26% 2014 (n=179) WorldatWork 12 152 Figure 9: “What are the reasons for offering well-being programs/initiatives to your employees? (Check all that apply.)” 85% 82% Improve employee health 77% 78% Decrease medical premiums and claims costs 79% 77% Perceived value to employees Increase employee engagement 72% 74% Improve employee productivity 73% 70% Improve employee retention 64% Drive or support overall culture 61% 64% 61% Reduce absenteeism Improve employee attraction 55% Decrease disability and worker's compensation costs 52% 53% 33% 31% Reduce presenteeism Other 2011 (n=442) Total Rewards and Employee Well-Being Practices 3% 2% 2014 (n=363) WorldatWork 13 153 Eligibility Figure 10: “For the majority of your well-being programs, who is eligible to participate? (Check all that apply.)”2 94% 90% All active employees 29% 30% Spouses or domestic partners 24% 21% Immediate family members Retired employees 7% 6% 6% 10% Select active employees Retired employee dependents Extended family members 3% 3% 2% 1% 2011 (n=444) 2014 (n=364) Figure 11: “Are any of your well-being programs only available to select employees or groups? (Check all that apply.)” 76% 75% We offer all programs to all employees Some programs are only available to exempt/salaried employees We have executive-only programs Some programs are only available to nonexempt/hourly employees Other 7% 11% 5% 10% 2% 3% 11% 9% 2011 (n=425) 2014 (n=345) 2 A statistically significantly lower number of participants cited all active employees as eligible to participate in the majority of well-being programs in 2014 (90%) compared to 2011 (94%). Total Rewards and Employee Well-Being Practices WorldatWork 14 154 Figure 12: “To what degree does your organization support your workforce in defining their strong sense of self or purpose through their beliefs, principles, values and ethical judgments?” (n=362) Degree of organizational support for the workforce On a scale of 0 to 7 0 Not at all 13% 0.1 to 1 1.1 to 2 3% 5% 2.1 to 3 3.1 to 4 9% 4.1 to 5 18% 14% 5.1 to 6 20% 6.1 to 7 20% Strongly support Average value: 4.1 Programs and Initiatives Offered and Utilized Figure 13: “Please rank the well-being programs your organization offers by employee usage.” Lower program rankings indicate greater employee usage. Only programs indicated in Figure 6 were available for ranking by the participants. Health-Related Physical health-risk assessment (biometrics, physical fitness, etc.) (n=191) Work-Life Balance 3.5 Flexible schedules (n=200) 3.9 Physical fitness (exercising) (n=226) 4.6 Immunizations (n=237) 4.9 Encourage time away from work (vacation, not plugged in) (n=196) Community involvement programs (n=179) Diet and nutrition (n=192) 6.3 Child-care assistance (n=83) 7.7 6.7 Work overload (n=8) 8.4 Mental/behavioral health coverage (n=209) Behavioral/mental health-risk assessment (n=83) Smoking cessation (n=202) Retirement-Related 7.2 Caregiving assistance (n=32) 11.3 7.8 Elder-care assistance (n=58) 11.7 Financial education (n=202) 6.7 Workplace safety (n=202) 3.7 Financial advice (n=118) 6.9 Ergonomics (n=181) 6.8 Disease management (n=174) Financial wellness (n=82) 4.0 5.0 7.8 Workplace Environment 9.1 Stress-Related EAP resource and referral (n=269) 5.5 Resiliency training (n=23) 7.1 Yoga (n=85) 8.2 Meditation/mindfulness training (n=28) 9.6 Skill-Building Education Wellness coaching (n=115) 7.6 Stress management (n=118) 8.1 Healthy workplace relationships (n=52) 8.4 Total Rewards and Employee Well-Being Practices WorldatWork 15 155 Time management (n=93) 8.4 Behavioral modification (n=35) 11.1 Healthy personal relationships (n=28) 13.2 Parenting skills (n=32) 14.0 Figure 14: “Does your organization feature well-being programs prominently in your employee attraction efforts?” No 54% No 58% Yes 46% Yes 42% 2011 (n=427) 2014 (n=341) Figure 15: “In your opinion, how do you see the well-being program(s) changing within your organization in the next two years?” Considerable increase in well-being programs and activities offered 16% 13% Increase in well-being programs and activities offered 61% 61% 21% 24% No change Decrease in well-being programs and activities offered Considerable decrease in well-being programs and activities offered 2011 (n=428) Total Rewards and Employee Well-Being Practices 2% 2% 0% 0% 2014 (n=344) WorldatWork 16 156 Figure 15a: “Please rank the following options from principal reason to least significant reason for this anticipated increase.” Only participants that selected “increase” or “considerable increase” in Figure 15 received this question. Ranking Average 2011 2014 330 255 Impact on health-care costs 1.7 2.1 Increased productivity 3.4 2.8 Competitive advantage 2.9 3.0 Demand from employees 3.2 3.5 Lower absenteeism 3.7 3.6 n= Total Rewards and Employee Well-Being Practices WorldatWork 17 157 Effectiveness Figure 16: “How do you measure the effectiveness of the well-being programs offered at your organization? (Check all that apply.)” Participation rates 52% 39% 37% Health-care costs 34% 31% Employee satisfaction surveys 27% 22% Employee awareness of programs 23% 22% Employee engagement scores Screening results 21% 17% Absenteeism rates 21% 16% Disability costs 16% 16% Turnover rates 18% 14% Employee focus groups 9% Programs are too new to measure effectively 13% 8% 8% 7% Productivity 6% 4% Employee reported stress levels Other 58% 3% 2% 30% 28% We don’t measure 2011 (n=426) 2014 (n=340) Figure 17: “What have the measured effect of the well-being programs been?” Employee satisfaction 102 Extremely negative/negative effect 1% 25% Extremely positive/positive effect 75% Biometric screening 56 2% 25% 73% Employee engagement 75 0% 28% 72% Productivity 21 0% 29% 71% n Total Rewards and Employee Well-Being Practices No effect or neutral WorldatWork 18 158 Health-care costs 123 2% 33% 66% Absenteeism rates 54 0% 37% 63% Employee stress 14 7% 36% 57% Disability costs 53 2% 45% 53% Turnover rates 46 4% 52% 44% Support for Organizational Well-Being Programs Figure 18: “If your organization were to no longer offer employee-sponsored health-care, which wellbeing programs would you keep and which would you drop?” Health-Related n Keep program Drop program Don’t know Physical fitness (exercising) 221 80% 9% 11% Immunizations 236 73% 16% 11% Diet and nutrition 196 73% 12% 15% Smoking cessation Physical health-risk assessment (biometrics, physical fitness, etc.) Mental/behavioral health coverage 209 63% 21% 16% 190 58% 25% 17% 218 55% 27% 18% Disease management 179 55% 29% 16% Behavioral/mental health-risk assessment 95 45% 25% 30% n Keep program Drop program Don’t know EAP resource and referral 271 90% 5% 5% Yoga 91 54% 20% 26% Resiliency training 24 46% 29% 25% Meditation/mindfulness training 29 45% 21% 35% n Keep program Drop program Don’t know Financial education 201 85% 6% 10% Financial advice 118 81% 7% 12% Financial wellness 85 69% 9% 21% n Keep program Drop program Don’t know Workplace safety 239 95% 1% 4% Ergonomics 185 88% 5% 7% n Keep program Drop program Don’t know Stress-Related Retirement-Related Workplace Environment Work-Life Balance Encourage time away from work (vacation, not plugged in) Flexible schedules 197 92% 1% 7% 200 92% 3% 5% Community involvement programs 176 90% 3% 7% Caregiving assistance 33 88% 3% 9% Child-care assistance 82 81% 9% 11% Elder-care assistance 56 73% 11% 16% Work overload 13 69% 0% 31% n Keep program Drop program Don’t know Skill-Building Education Total Rewards and Employee Well-Being Practices WorldatWork 19 159 Time management 98 70% 11% 18% Stress management 118 64% 14% 22% Healthy workplace relationships 57 61% 14% 25% Health personal relationships 31 52% 19% 29% Wellness coaching 117 49% 26% 26% Behavioral modification 39 49% 18% 33% Parenting skills 32 41% 25% 34% Figure 19: “For the following well-being programs/initiatives, does your organization offer an incentive for participation or penalties for nonparticipation to employees? (Note: if you incentivize and penalize programs, please select both the offer incentives and require penalties boxes.)” Health-Related Physical health-risk assessment (biometrics, physical fitness, etc.) Physical fitness (exercising) n Offer incentives Require penalties Neither incentivize nor penalize 196 64% 11% 25% 222 43% 1% 57% Diet and nutrition 191 34% 1% 65% Smoking cessation 215 33% 17% 50% Behavioral/mental health-risk assessment 96 21% 3% 76% Disease management 177 17% 2% 81% Immunizations 228 13% 4% 83% Mental/behavioral health coverage 215 3% 0% n Offer incentives Require penalties Yoga 89 20% 0% 97% Neither incentivize nor penalize 80% Resiliency training 26 19% 0% 81% Meditation/mindfulness training 29 14% 0% 86% EAP resource and referral 257 4% 0% n Offer incentives Require penalties Financial wellness 85 9% 0% 97% Neither incentivize nor penalize 91% Financial education 192 6% 0% 94% Financial advice 110 5% 0% n Offer incentives Require penalties Workplace safety 231 12% 7% 96% Neither incentivize nor penalize 81% Ergonomics 173 4% 0% n Offer incentives Require penalties Community involvement programs 172 23% 0% 97% Neither incentivize nor penalize 77% Child-care assistance 81 10% 0% 90% Stress-Related Retirement-Related Workplace Environment Work-Life Balance Total Rewards and Employee Well-Being Practices WorldatWork 20 160 Encourage time away from work (vacation, not plugged in) Flexible schedules 192 5% 1% 95% 193 4% 0% 96% Elder-care assistance 59 3% 0% 97% Caregiving assistance 34 3% 0% 97% Work overload 14 0% 0% n Offer incentives Require penalties Wellness coaching 120 28% 3% 100% Neither incentivize nor penalize 71% Behavioral modification 42 22% 2% 78% Stress management 115 11% 0% 89% Time management 97 6% 0% 94% Healthy workplace relationships 57 4% 2% 95% Parenting skills 35 3% 0% 97% Healthy personal relationships 33 3% 0% 97% Skill-Building Education Figure 20: “Using the rating scale below, how would you rate the overall acceptance and endorsement of employee well-being into the culture of your organization:” (n=331) Degree of acceptance and endorsement of employee well-being On a scale of 0 to 4 0 0.1 to 1 1.1 to 2 2.1 to 3 3.1 to 4 5% 13% 33% 31% 19% Nonexistent Deeply embedded Average value: 2.1 Figure 21: “Do you communicate your well-being programs in a frequent and ongoing basis throughout the year?” No 31% No 30% Yes 69% Yes 70% 2011 (n=411) 2014 (n=330) Total Rewards and Employee Well-Being Practices WorldatWork 21 161 Figure 22: “Are your line managers and supervisors empowered to and responsible for supporting employees in participating in the well-being programs offered?” No 43% No 43% Yes 57% Yes 58% 2011 (n=413) 2014 (n=327) Figure 23: “Who in your organization (if anyone) is the primary champion or driver of the idea that wellbeing is a strategic and important imperative to the organization?” 43% Top HR executive 35% 16% 19% Top Benefits/total rewards executive 14% CEO or president 17% 7% 8% All of senior management 6% 7% No one Employees 3% 3% Chief operating officer (COO) 2% 2% Board of directors 2% 1% Chief financial officer (CFO) Other 1% 1% 7% 6% 2011 (n=413) Total Rewards and Employee Well-Being Practices 2014 (n=327) WorldatWork 22 162 Figure 24: “Which of the following best describes how senior management in your organization views employee well-being programs?” (n=329) Degree of senior management’s view of well-being programs On a scale of 0 to 7 No support 0 0.1 to 1 1.1 to 2 2.1 to 3 3.1 to 4 4.1 to 5 5.1 to 6 6.1 to 7 3% 3% 9% 14% 21% 17% 18% 16% High level of support Average value: 4.2 Total Rewards and Employee Well-Being Practices WorldatWork 23 163 Additional Analysis Well‐Being Integration Continuum A well-being scale was developed based on answers to key questions in the survey. The intention is to analyze how organizations perceive employee well-being on a holistic level. By viewing well-being in a more holistic way, organizations may have a better understanding of what these programs and initiatives can do in creating an atmosphere of well-being for employees both at work and in their personal lives. Supporting the employee both at work and beyond can have positive results for the organization in terms of increased productivity, increased engagement levels, increased employee satisfaction and positive changes in employee behaviors. This differs from organizations that limit employee well-being to more traditional wellness offerings with the sole purpose of lowering health-care costs. Critical issues considered in the continuum scoring include: Number and types of well-being programs offered (42 points possible; programs considered innovative were allotted additional points over some traditional programs) Balance of programs offered (4 points possible) Organizational strategy when it comes to employee well-being (5 points possible) Eligibility for well-being programs (6 points possible) Organizational support for employees when it comes to defining a strong sense of self or purpose through beliefs, principles, values, and ethical judgments (3 points possible) The culture of well-being within the organization (4 points possible) Use of well-being in attraction of new employees (1 point possible) Senior management’s view of well-being (3 points possible) Well-being communication (1 point possible) Line managers and supervisors authorized to support employees when participating in the well-being programs offered (1 point possible). The maximum number of points possible is 70. Organizations scoring between 1 and 34 on the continuum are considered to have “traditional wellness” while those scoring between 35 and 70 have “integrated well-being.” Figure 25: Well-being continuum3 2014 (n=367) 2011 (n=418) Traditional wellness, 61% Traditional wellness, 55% Integrated wellbeing, 39% Integrated wellbeing, 45% 3 The Well-Being Continuum scoring in 2011 was only out of a maximum 68 points. An additional two points were added to the number and types of well-being programs offered category. Total Rewards and Employee Well-Being Practices WorldatWork 24 164 Figure 26: Number of programs offered and length of time well-being strategy has been in place4 17 16 14 18 17 19 16 13 Less than 1 year More than 1 year but less 3 years but less than 5 than 3 years years 2011 (n=242) 5 or more years 2014 (n=179) Figure 27: Well-being continuum and the measured effect of the well-being programs and indicators5 Extremely negative/negative effect No effect or neutral Extremely positive/positive effect Traditional wellness 0% 46% 54% Integrated well-being 0% 20% 80% Traditional wellness 4% 42% 53% Integrated well-being 0% 27% 73% Traditional wellness 6% 56% 38% Integrated well-being 0% 41% 60% Traditional wellness 0% 35% 65% Integrated well-being 0% 38% 62% Traditional wellness 4% 29% 68% Integrated well-being 0% 23% 77% Employee Engagement (n=75) Health-care Costs (n=123) Disability Costs (n=53) Absenteeism Rates (n=54) Employee Satisfaction (n=102) Productivity (n=21) 4 Organizations with a well-being strategy in place for five or more years offer an average number of well-being programs at significantly higher rates (19) than organizations with a strategy in place for less than one year (13) and more than one year but less than three years (16). 5 Statistical significance difference testing was not conducted within groups due to responses less than 30. Total Rewards and Employee Well-Being Practices WorldatWork 25 165 Traditional wellness 0% 0% 100% Integrated well-being 0% 32% 68% Traditional wellness 0% 33% 67% Integrated well-being 2% 23% 75% Traditional wellness 11% 53% 37% Integrated well-being 0% 52% 48% Traditional wellness 0% 0% 100% Integrated well-being 8% 42% 50% Biometric Screening (n=56) Turnover Rates (n=46) Employee Stress (n= 14) Figure 28: Well-being continuum and voluntary turnover6 21% 52% 27% 2014 Traditional wellness (n=194) Integrated well-being (n=127) 33% 32% 35% 36% 34% 2011 Traditional wellness (n=223) 39% 43% 17% Integrated well-being (n=186) 0% to 5% (low) 30% 6% to 10% (medium) 11% to 15% (high) 6 Organizations with traditional wellness in 2014 have statistically significantly greater voluntary turnover for 11% to 15% (high) turnover (52%) than those in 2011 for 11% to 15% turnover (35%). Total Rewards and Employee Well-Being Practices WorldatWork 26 166 Participating Organizations Advantage Sales & Marketing Agnico Eagle Mines Limited Air Canada Alaska Airlines Alaska Communications Alberta Motor Association Alcatel-Lucent AMAG Pharmaceuticals American Bar Association ANSYS Inc. Ariens Co. Astron Solutions Aux Sable Baker Hughes Banner Health Bellstar Hotels and Resorts BICSI Bill Barrett Corp. Blue Cross & Blue Shield of Rhode Island Blue Cross Blue Shield of Arizona Blue Diamond Growers BlueLinx Corp. BP Bridgepoint Education British Sugar Brown Industrial Inc. Brownells Inc. CACI International Canadian Blood Services Canadian Payments Association Capital Metropolitan Transportation Authority Carlson Dettmann Consulting LLC Casino Pauma Central 1 Credit Union Ciena Corp. CIMA+ City of Seattle Cleveland Clinic CNI CO-OP Financial Services Community Hospital Corp. Consolidated Communications COPT Crowe Horwath LLP CSA Group CTI Foods Curtiss-Wright Daymon Worldwide DuPont Eastern Alliance Insurance Co. Eby-Brown Total Rewards and Employee Well-Being Practices Edmonton Kenworth Ltd. Elbit Systems of America Emergency Medical Care Inc. Employers Council Employers Resource Association EPCOR Erie Insurance Evraz Experimental Aircraft Association EZCORP Inc. Federal Express Canada Ltd. Federal Reserve Bank of Richmond FedEx Express Canada Ltd. Fike Corp. Firmenich Inc. Freudenberg North America George Mason University George Washington University Goodman Manufacturing Grand & Toy Ltd. Grand River Hospital Grande Hackensack University Medical Center Helios HR LLC Helmerich & Payne Inc. Henry Schein Hess Corp. Hilltop National Bank Hunter Douglas Inc. ICW Group IM Flash Technologies Immanuel Innovative Compensation and Benefits Concepts Inspirus Inter-Coastal Electronics Inc. Investors Community Bank John Wiley & Sons Singapore Pte Ltd K+S Potash Canada Kingston General Hospital KVH Industries Inc. LAMMICO Lehigh Valley Health Network Lexicon Pharmaceuticals Inc. LifeBridge Health Linbeck Lincoln Investment Planning Lions Clubs International Livingston International Inc. LPK Maersk Oil Maricopa Integrated Health System WorldatWork 27 167 MARTA Masonite International Corp. Matrix Service Co. McDonald's Korea McGraw Hill Financial MGMA MIT Lincoln Laboratory Molina Healthcare Inc. Monitise MVP Health-care NAB NASDAQ National Pen NatureWorks Nautilus Inc. Nolan Financial Nordson Corp. North American Science Associates NorthStar Financial Services Group LLC Novartis NOVEC Nu Skin Enterprises NW Permanente Office Depot Ohio National Financial Services Omaha Public Power District Oman Telecommunication Co. ON Semiconductor OpenText Oswego Health Otterbein Homes Palmetto Health Peabody Essex Museum Pessin Katz Law, P.A. PETRONAS Piedmont EMC Pinnacle Health System Piramal Enterprises Limited PNC Financial Services Group Points Athabasca Contracting LP Press Ganey Associates Prime Therapeutics LLC Principal Financial Group Project HOPE PROS Inc. QBE Raiffeisen-Landesbank Steiermark AG Rakuten.com Red Hat Renewable Energy Systems Americas Inc. Riverside Medical Center Road Scholar Rockwater Energy Solutions Inc. Total Rewards and Employee Well-Being Practices RSA Rytec Corp. Safer Foundation Schindler Elevator Corp. Searles Valley Minerals Shale-Inland Shell Oil Co. Silver Star Brands Singtel Optus Smith & Nephew Solar Turbines SolarWinds St. Lawrence Seaway Management Corp. Staples Canada State Auto Insurance State of Colorado Sunbelt Rentals Swarovski Teck Resources Texas Mutual Insurance Co. TG The Advisory Board Co. The Andersons Inc. The Kansas City Southern Railway Co. The Marcus Corp. The Royal College of Physicians and Surgeons of Canada The University of Texas Health Science Center San Antonio The YMCA of Greater Rochester Thomson Reuters Toshiba America Inc. Town of Gilbert, Ariz. Town of Hilton Head Island TransAlta Corp. Trupanion Umeme UnitedLex Corp. Univar University of Dayton University of Missouri Urban Science Vail Resorts Vantage West Credit Union Vitamix Volunteers of America Volvo Group North America VRG Inc. Waukesha County Wells Enterprises Inc. Western Compensation & Benefits Consultants Woodmen of the World Worldpay US Inc. WorldatWork 28 168 169 RETIREMENT FOR REAL: LESSONS LEARNED FROM OVER TEN YEARS OF RETIREMENT KANSAS CIT Y BENEFITS INSTITUTE K AT I E L E W I S , C E B S , C C P, C R S P K B L C O N S U LT I N G / R E T I R E D DEB ROSENBERG, CEBS, ISCEBS FELLOW, AIF® STILES FINANCIAL SERVICES, INC. APRIL 30, 2015 OUR AGENDA FOR TODAY Perspective - Some statistics The “real story” Lessons learned What it means for you personally What it means for you as an employer Stiles Financial Services, Inc. is a Registered Investment Adviser. Advisory Services offered through Cambridge Investment Research Advisors, a Registered Investment Adviser. Securities offered through Cambridge Investment Research, Inc., Member FINRA & SIPC. Cambridge & Stiles Financial Services, Inc. are not affiliated. 2 1 170 THE REALITY – MORE RETIREES Longevity – we’re living longer 45 million over 65 6 million over 85 Expected continuation of the trend to 2035 75 million over 65 11 million over 85 For a 65 year old couple, 50% chance that one will reach age 92 and 25% chance one will reach age 97 One in four chance to live past 90 One in ten chance to make 95 Katie’s father-in-law on his 93rd birthday Stiles Financial Services, Inc. is a Registered Investment Adviser. Advisory Services offered through Cambridge Investment Research Advisors, a Registered Investment Adviser. Securities offered through Cambridge Investment Research, Inc., Member FINRA & SIPC. Cambridge & Stiles Financial Services, Inc. are not affiliated. 3 THE REALITY - FINANCES EBRI estimates a $4.13 trillion retirement savings deficit for households between age 25 and 64 – expected to increase to $4.38 trillion if Social Security not “fixed” Safety net not so safe? Social Security concerns – funding runs out in 2033 52% of couples and 72% of singles get at least half of their income from SS Maximum benefit at full retirement age = $2,663 in 2015, only $2,025 if claim at age 62 but $3,501 if wait until age 70 Nine out of ten people over 65 receive SS benefits Fewer DB plans 112,000 in 1985, 22,700 in 2013 Mostly public pension vs. private ER Only 11% of private sector workers have a DB and DC plan, 3% have only a DB Employee Benefit Research Institute – March 12, 2015 Wall Street Journal – June 23, 2014 Stiles Financial Services, Inc. is a Registered Investment Adviser. Advisory Services offered through Cambridge Investment Research Advisors, a Registered Investment Adviser. Securities offered through Cambridge Investment Research, Inc., Member FINRA & SIPC. Cambridge & Stiles Financial Services, Inc. are not affiliated. 4 2 171 THE REALITY - FINANCES Expenses don’t necessarily go down 39% of age 55+ households have mortgages Most expenses remain constant – food, clothing, transportation, entertainment, donations 34% of workers have NO retirement savings 51% of workers have NO private pension coverage Risks exist: The market is more volatile – do you want to still have money in stocks? Interest rates are low – return on conservative investments in down Impact of inflation – reduces the value of your money Impact of divorce – division of assets, two households instead of one! Longevity – outliving your savings Timing of retirement – bull or bear market? Stiles Financial Services, Inc. is a Registered Investment Adviser. Advisory Services offered through Cambridge Investment Research Advisors, a Registered Investment Adviser. Securities offered through Cambridge Investment Research, Inc., Member FINRA & SIPC. Cambridge & Stiles Financial Services, Inc. are not affiliated. 5 Ibbotson® SBBI® Stocks, Bonds, Bills, and Inflation 1994–2013 $9.66 $10 Compound annual return • Small stocks • Large stocks • Government bonds • Treasury bills • Inflation 12.0% 9.2 7.0 2.9 2.4 $5.84 $3.89 $1.75 $1.60 1 0.60 1994 1999 2004 2009 Past performance is no guarantee of future results. Hypothetical value of $1 invested at the beginning of 1994. Assumes reinvestment of income and no transaction costs or taxes. This is for illustrative purposes only and not indicative of any investment. An investment cannot be made directly in an index. © 2014 Morningstar. All Rights Reserved. 3 172 THE REALITY - COMMITMENTS Sandwich generation Supporting children and grandchildren 52% provide care to adult children 35% provide care to grandchildren Helping care for parents in their late 80’s+ 16% provide care to parents Continuing to work 55% of Americans now expect to work past age 67 Over 30% of people between ages 65 and 69 are in the workforce Why? Provides a purpose and structure Social aspects Need the money 2013 Merrill Lynch Retirement Study Stiles Financial Services, Inc. is a Registered Investment Adviser. Advisory Services offered through Cambridge Investment Research Advisors, a Registered Investment Adviser. Securities offered through Cambridge Investment Research, Inc., Member FINRA & SIPC. Cambridge & Stiles Financial Services, Inc. are not affiliated. 7 THE REALITY – FOR WOMEN Live longer, need more $ Life expectancy 2-5 years longer Likely to be widowed Caregiving impacts income and benefits Out of the workforce for child care and parental assistance Lower earnings impact income and benefits Shift from DB impacts survivor benefits Fewer sources of income – more dependent on Social Security Source: SSA Office of the Chief Actuary Stiles Financial Services, Inc. is a Registered Investment Adviser. Advisory Services offered through Cambridge Investment Research Advisors, a Registered Investment Adviser. Securities offered through Cambridge Investment Research, Inc., Member FINRA & SIPC. Cambridge & Stiles Financial Services, Inc. are not affiliated. 8 4 173 SOURCES OF RETIREMENT INCOME The “new” three-legged stool for baby boomers Social Security – 41% Employer plans – 19% Less DB, fewer guarantees Personal savings – 18% 4.8% in May 2014, up from 4.5% (US Bureau of Economic Analysis) Income gap – 14% to 26% Replacement ratio – only 59% to 64% Remainder often made up by continued employment income 39% seeking part time employment 24% seeking intermittent employment Stiles Financial Services, Inc. is a Registered Investment Adviser. Advisory Services offered through Cambridge Investment Research Advisors, a Registered Investment Adviser. Securities offered through Cambridge Investment Research, Inc., Member FINRA & SIPC. Cambridge & Stiles Financial Services, Inc. are not affiliated. 9 BIG UNKNOWN - HEALTHCARE The Good: Advances in technology Advances in pharmaceuticals Elimination of diseases and conditions that were previously killers The Bad: Advances are more expensive Fewer of us have retiree medical - <25% More of us in long-term care – EXPENSIVE! 60% of bankruptcies in the U.S. today are related to medical bills! The Unknown: Impact of the Affordable Care Act Medicare funding – needs to be fixed! Stiles Financial Services, Inc. is a Registered Investment Adviser. Advisory Services offered through Cambridge Investment Research Advisors, a Registered Investment Adviser. Securities offered through Cambridge Investment Research, Inc., Member FINRA & SIPC. Cambridge & Stiles Financial Services, Inc. are not affiliated. 10 5 174 KATIE’S STORY – LIVING THE DREAM Timing the Decision! Telling work How much notice? What is too much or too little? Telling coworkers and clients Important for benefit elections, insurance planning, etc. Telling family and friends Clark – 4 months ahead of retirement Katie – left FT employment for a year then taught and consulted 4 more years Felt like vacation the first winter! Stiles Financial Services, Inc. is a Registered Investment Adviser. Advisory Services offered through Cambridge Investment Research Advisors, a Registered Investment Adviser. Securities offered through Cambridge Investment Research, Inc., Member FINRA & SIPC. Cambridge & Stiles Financial Services, Inc. are not affiliated. 11 LIVING THE DREAM Keeping busy! Major league baseball stadiums – all 30 plus updates and new ones A month in Paris River cruises, ocean crossing, other water travel and travel abroad Trips with grandchildren as each reaches age 14 Care for parents Stiles Financial Services, Inc. is a Registered Investment Adviser. Advisory Services offered through Cambridge Investment Research Advisors, a Registered Investment Adviser. Securities offered through Cambridge Investment Research, Inc., Member FINRA & SIPC. Cambridge & Stiles Financial Services, Inc. are not affiliated. 12 6 175 THINGS TO ASK WHILE WORKING When will you stop? • Phasing out or a quick and immediate stop? • Successor training and orientation? Where and how will you live? • One home, two homes, downsize, move or not? What will you do? • Finding your niche • Volunteering, travel, part-time work, family care… What are your sources of income for the remainder of your life? Stiles Financial Services, Inc. is a Registered Investment Adviser. Advisory Services offered through Cambridge Investment Research Advisors, a Registered Investment Adviser. Securities offered through Cambridge Investment Research, Inc., Member FINRA & SIPC. Cambridge & Stiles Financial Services, Inc. are not affiliated. 13 PLANNING THE FINANCIAL PICTURE Annually for 20+ years prior to retirement At income tax time – a good time to pull things together Projections Expenses Investment growth Contributions Income sources Distribution planning Stiles Financial Services, Inc. is a Registered Investment Adviser. Advisory Services offered through Cambridge Investment Research Advisors, a Registered Investment Adviser. Securities offered through Cambridge Investment Research, Inc., Member FINRA & SIPC. Cambridge & Stiles Financial Services, Inc. are not affiliated. 14 7 176 PLANNING WHERE TO LIVE How do we want to live? Housing Multiple homes? Where to homestead? Weather? Activities – golf, volunteering Travel How much? Where? Healthcare accessibility Where are the kids and grandkids? Where are our friends? Stiles Financial Services, Inc. is a Registered Investment Adviser. Advisory Services offered through Cambridge Investment Research Advisors, a Registered Investment Adviser. Securities offered through Cambridge Investment Research, Inc., Member FINRA & SIPC. Cambridge & Stiles Financial Services, Inc. are not affiliated. 15 ACCUMULATION PHASE Needs/wants analysis Project account balances Estimate returns and inflation Review annually since it WILL change Convert to an estimated monthly income, guaranteed to cover basic living expenses Think about life expectancy Our parents lived long lives Running out of money is an important consideration Stiles Financial Services, Inc. is a Registered Investment Adviser. Advisory Services offered through Cambridge Investment Research Advisors, a Registered Investment Adviser. Securities offered through Cambridge Investment Research, Inc., Member FINRA & SIPC. Cambridge & Stiles Financial Services, Inc. are not affiliated. 16 8 177 DISTRIBUTION PHASE TIAA-CREF recommends no more than 4.5% per year Annuitize the amount needed to cover basic expenses using your: Social Security Any DB pension A portion of your DC assets Build in COLA assumptions so your income can increase annually Expect the unexpected Review annually! Stiles Financial Services, Inc. is a Registered Investment Adviser. Advisory Services offered through Cambridge Investment Research Advisors, a Registered Investment Adviser. Securities offered through Cambridge Investment Research, Inc., Member FINRA & SIPC. Cambridge & Stiles Financial Services, Inc. are not affiliated. 17 MEDICARE - BASIC Eligibility begins the 1st of the month in which age 65 is reached Who is primary if still employed? Who is primary from date of retirement until coverage ends? Part A premium for hospitalization = Free if qualify, otherwise up to $407 per month Part B premium for medical insurance = $105-336 per month (varies by income) Part D Premium for prescription drugs = $0-71 per month (varies by income) Resource – www.medicare.gov Stiles Financial Services, Inc. is a Registered Investment Adviser. Advisory Services offered through Cambridge Investment Research Advisors, a Registered Investment Adviser. Securities offered through Cambridge Investment Research, Inc., Member FINRA & SIPC. Cambridge & Stiles Financial Services, Inc. are not affiliated. 18 9 178 OUR MEDICARE EXPERIENCE Since Clark retired at 65, COBRA took me to Medicare eligibility We have the right age difference! If not, coverage is quite expensive for pre-65 Supplemental coverage is by state, and often by country • Coverage away from home can be a challenge to secure • Purchase travel insurance when you’re out of the country or away from your coverage area Stiles Financial Services, Inc. is a Registered Investment Adviser. Advisory Services offered through Cambridge Investment Research Advisors, a Registered Investment Adviser. Securities offered through Cambridge Investment Research, Inc., Member FINRA & SIPC. Cambridge & Stiles Financial Services, Inc. are not affiliated. 19 MEDICARE SUPPLEMENTS Lots of coverage gaps Supplements medical coverage, pharmacy Average premium = $200+ per month Lots of resources: www.medicare.gov www.aarp.org Insurance company websites Financial publications and websites Local library online resources Stiles Financial Services, Inc. is a Registered Investment Adviser. Advisory Services offered through Cambridge Investment Research Advisors, a Registered Investment Adviser. Securities offered through Cambridge Investment Research, Inc., Member FINRA & SIPC. Cambridge & Stiles Financial Services, Inc. are not affiliated. 20 10 179 SOCIAL SECURITY CONSIDERATIONS When to draw? Social Security Normal Retirement Age (SSNRA) Age 62 with reduction Need to meet with SS in person Proof or birth, marriages, divorces, etc. Estimate of final year’s compensation Earnings limitations prior to SSNRA Impacts those who are still working Income limit of $15,720 per year (2015) Every $2 over limit reduces benefit $1 Income limit of $41,880 in year of reaching SSNRA, $1 reduction for every $3 over the limit (month by month) Stiles Financial Services, Inc. is a Registered Investment Adviser. Advisory Services offered through Cambridge Investment Research Advisors, a Registered Investment Adviser. Securities offered through Cambridge Investment Research, Inc., Member FINRA & SIPC. Cambridge & Stiles Financial Services, Inc. are not affiliated. 21 DEFINED CONTRIBUTION ASSETS Qualified plan from current employer • ESOP, 401(k), 403(b), 457 Rollover IRAs from former employers Traditional IRAs from early eighties Miscellaneous assets How much to withdraw? When to withdraw? Stiles Financial Services, Inc. is a Registered Investment Adviser. Advisory Services offered through Cambridge Investment Research Advisors, a Registered Investment Adviser. Securities offered through Cambridge Investment Research, Inc., Member FINRA & SIPC. Cambridge & Stiles Financial Services, Inc. are not affiliated. 22 11 180 PENSION BENEFITS Fortunate that we had! One from current employer, two from plans that had been terminated by former employers for Clark, two for me from former employers Finding them and claiming them – internet search may help a lot Helpful hints: Keep documents Be able to verify employment dates If lost, SSA or PBGC may provide help Can be very challenging if M&A or company termination has occurred Stiles Financial Services, Inc. is a Registered Investment Adviser. Advisory Services offered through Cambridge Investment Research Advisors, a Registered Investment Adviser. Securities offered through Cambridge Investment Research, Inc., Member FINRA & SIPC. Cambridge & Stiles Financial Services, Inc. are not affiliated. 23 PENSION BENEFITS Consider payment form Life Annuity Joint & Survivor Life and Certain Impact of starting early Reductions may be sizeable for early commencement Think through longevity risk – probably the greatest risk If you take a lump sum – how to protect it and make it last Investment risk is much greater this way The Dow day-to-day shouldn’t determine your day-to-day life Stiles Financial Services, Inc. is a Registered Investment Adviser. Advisory Services offered through Cambridge Investment Research Advisors, a Registered Investment Adviser. Securities offered through Cambridge Investment Research, Inc., Member FINRA & SIPC. Cambridge & Stiles Financial Services, Inc. are not affiliated. 24 12 181 EMPLOYER STOCK NUA Treatment – IRC 402(e)(4) Allows distribution in a lump sum in a single tax year Current taxation on the stock’s basis NUA (Net Unrealized Appreciation) taxed as capital gain when stock is sold If rollover to IRA – all taxed as ordinary income Normal investment concerns: Do you want to retain or sell? Is it a good investment? Does it fit in with my retirement investment strategy? Stiles Financial Services, Inc. is a Registered Investment Adviser. Advisory Services offered through Cambridge Investment Research Advisors, a Registered Investment Adviser. Securities offered through Cambridge Investment Research, Inc., Member FINRA & SIPC. Cambridge & Stiles Financial Services, Inc. are not affiliated. 25 “INVESTABLE ASSETS” DECISIONS Continue with current advisors? Assess amount of day-to-day involvement desired – roles played by us past, present and future Consolidate investments with one or more vendors? We had money in 3 plans and 8 IRA vendors Informal RFP to several vendors: Investment philosophy/asset allocation Cost structure Works when away from “home”? Personal chemistry Withdrawal strategy for future years OUR EXPERIENCE – Consolidated to one provider following interview process. Has worked well for ten years at this point! Stiles Financial Services, Inc. is a Registered Investment Adviser. Advisory Services offered through Cambridge Investment Research Advisors, a Registered Investment Adviser. Securities offered through Cambridge Investment Research, Inc., Member FINRA & SIPC. Cambridge & Stiles Financial Services, Inc. are not affiliated. 26 13 182 LONG TERM CARE INSURANCE Do you need it? 35% to 50% will utilize (depending on terms) Self-insure Purchase insurance Ignore and hope for the best Many variables in products Years and level of protection Inflation protection? Setting covered – nursing home, assisted living, home care Spousal benefits – “sharing” OUR EXPERIENCE – Not an investment, but view as insurance. Friends our age have had to use it already! Stiles Financial Services, Inc. is a Registered Investment Adviser. Advisory Services offered through Cambridge Investment Research Advisors, a Registered Investment Adviser. Securities offered through Cambridge Investment Research, Inc., Member FINRA & SIPC. Cambridge & Stiles Financial Services, Inc. are not affiliated. 27 LIFE INSURANCE Do you still need it? Why do you need it? Protection Income for surviving spouse Estate planning Many different types and companies Good information on several websites www.aarp.com www.medicare.gov Insurance company sites OUR EXPERIENCE – Converted to paid –up policies. Really money for funeral expenses, not as part of desired asset transfer to children. Works for us, but maybe not for everyone. Stiles Financial Services, Inc. is a Registered Investment Adviser. Advisory Services offered through Cambridge Investment Research Advisors, a Registered Investment Adviser. Securities offered through Cambridge Investment Research, Inc., Member FINRA & SIPC. Cambridge & Stiles Financial Services, Inc. are not affiliated. 28 14 183 CONTINUING TO REASSESS On-going need to revisit finances and planning • Homes in Minnesota and Florida • Travel • New cars • Family needs • My mom’s death, his dad’s health • Our children and grandchildren Stiles Financial Services, Inc. is a Registered Investment Adviser. Advisory Services offered through Cambridge Investment Research Advisors, a Registered Investment Adviser. Securities offered through Cambridge Investment Research, Inc., Member FINRA & SIPC. Cambridge & Stiles Financial Services, Inc. are not affiliated. 29 SURPRISES FOR US AND FRIENDS Finding the right balance of “work” and “play Finding financial “peace of mind” Dealing with family concerns, both children and parents Stiles Financial Services, Inc. is a Registered Investment Adviser. Advisory Services offered through Cambridge Investment Research Advisors, a Registered Investment Adviser. Securities offered through Cambridge Investment Research, Inc., Member FINRA & SIPC. Cambridge & Stiles Financial Services, Inc. are not affiliated. 30 15 184 THE NEXT TEN YEARS More travel…go go, then slow go, then no go! Health and mobility as well as financial considerations Maintain healthy habits and relationships Marriage, friends, exercise, diet, etc. Consider transitions before they are mandatory My parents, my father-in-law Stiles Financial Services, Inc. is a Registered Investment Adviser. Advisory Services offered through Cambridge Investment Research Advisors, a Registered Investment Adviser. Securities offered through Cambridge Investment Research, Inc., Member FINRA & SIPC. Cambridge & Stiles Financial Services, Inc. are not affiliated. 31 WHAT CAN EMPLOYERS DO? Retirement Plan Design – enhance the value Encourage saving: More is better Auto enrollment, escalation Allow pre-tax and Roth Stretch match Appropriate investments Defaults – diversification to control risk Make it easy – models, TDFs, advice, auto rebalancing Don’t encourage loans Encourage rollovers Stiles Financial Services, Inc. is a Registered Investment Adviser. Advisory Services offered through Cambridge Investment Research Advisors, a Registered Investment Adviser. Securities offered through Cambridge Investment Research, Inc., Member FINRA & SIPC. Cambridge & Stiles Financial Services, Inc. are not affiliated. 32 16 185 WHAT CAN EMPLOYERS DO? Allow group purchasing, where possible, even during retirement Less expensive Long-term care, life and health insurance Educate on employer stock Tax implications Educate on pros and cons of annuity options Evaluate offering in-plan annuities Permanence of choice Lump-sum counseling Stiles Financial Services, Inc. is a Registered Investment Adviser. Advisory Services offered through Cambridge Investment Research Advisors, a Registered Investment Adviser. Securities offered through Cambridge Investment Research, Inc., Member FINRA & SIPC. Cambridge & Stiles Financial Services, Inc. are not affiliated. 33 WHAT CAN EMPLOYERS DO? Education, education, education Develop resources – i.e. projections Start sooner – 55 or 60 is too late Broaden the focus Historically plan information only Different portfolios before and after retirement? Social Security – features and timing Medicare and supplements LTC, budgeting Wills and estate planning Stiles Financial Services, Inc. is a Registered Investment Adviser. Advisory Services offered through Cambridge Investment Research Advisors, a Registered Investment Adviser. Securities offered through Cambridge Investment Research, Inc., Member FINRA & SIPC. Cambridge & Stiles Financial Services, Inc. are not affiliated. 34 17 186 WHAT CAN EMPLOYERS DO? Evaluate feasibility of phased retirement Does it work for your workforce? Impact on retirement plans – i.e. DB formula Impact on income – allow in-service W/D? Develop a target income replacement rate – help participants get there Encourage rollovers! Advisors/planners List of resources Negotiate discounts or help pay? Stiles Financial Services, Inc. is a Registered Investment Adviser. Advisory Services offered through Cambridge Investment Research Advisors, a Registered Investment Adviser. Securities offered through Cambridge Investment Research, Inc., Member FINRA & SIPC. Cambridge & Stiles Financial Services, Inc. are not affiliated. 35 EMPLOYER ISSUES Respect privacy Avoid liability Make education mandatory? Programs during work hours (i.e. paid)? “Is it really my problem” Mobile workforce What’s in it for me? Stiles Financial Services, Inc. is a Registered Investment Adviser. Advisory Services offered through Cambridge Investment Research Advisors, a Registered Investment Adviser. Securities offered through Cambridge Investment Research, Inc., Member FINRA & SIPC. Cambridge & Stiles Financial Services, Inc. are not affiliated. 36 18 187 RESOURCES Financial industry is responding More modeling tools More information on statements Annuity options – add stability In-plan At time of distribution Deferred/Longevity Annuities, i.e. start at age 80 25% of balance up to $125,000 Not subject to RMD rules Stiles Financial Services, Inc. is a Registered Investment Adviser. Advisory Services offered through Cambridge Investment Research Advisors, a Registered Investment Adviser. Securities offered through Cambridge Investment Research, Inc., Member FINRA & SIPC. Cambridge & Stiles Financial Services, Inc. are not affiliated. 37 THANK YOU! Questions? Stiles Financial Services, Inc. is a Registered Investment Adviser. Advisory Services offered through Cambridge Investment Research Advisors, a Registered Investment Adviser. Securities offered through Cambridge Investment Research, Inc., Member FINRA & SIPC. Cambridge & Stiles Financial Services, Inc. are not affiliated. 38 19 188 189 The Employee Benefits Institute of Kansas City ConAgra Foods, Inc. HEALTHCARE STRATEGIES Niki Theophilus Executive Vice President & Chief Human Resources Officer April 30, 2015 ConAgra Foods – benefits strategy journey 1 1 190 ACA compliance – employer impact Establish look back periods 2011 2012 Small business premium tax credits W-2 reporting of employerprovided health care coverage Summary of Benefits and Coverage 2013 Notify EEs of Exchange Employee FSA contributions limited to $2500 Prepare for annual reporting 2014 2015 Wellness tax credit for small ERs; various fees; some plan changes 2016 2017 Exchange reporting Exchanges open to large ERs Federal reporting Penalty Assessment Reconciliation Medicare payroll tax increase for high earners Slide Source: ADP 2018 “Cadillac” Excise Tax (nondeductible 40%) 2 ACA compliance – potential penalties, shared responsibility (employer mandate) 1st Check: Employer has on average 100 full-time employees plus full-time equivalent employees in the prior year? IRC §4980H(a) – “The Big Penalty” Missed Offering Yes 2nd Check: Does the employer offer minimum essential coverage to at least 70% (2015) 95% of its ACA full-time employees and their dependents? Penalties do not apply to small employers. No No Did at least one employee receive a premium tax credit or cost sharing subsidy in an Exchange? Yes Yes 3rd Check: Does the plan provide coverage of at least 60% minimum value? IRC §4980H(b) – “The Lesser Penalty” Missed Affordability No Those employees can choose to buy coverage in an Exchange and may receive a premium tax credit. Yes 4th Check: Do any full-time employees pay more than 9.5% of current year Yes • Box 1 W-2 Wages • Rate of Pay • Federal Poverty Level for self-only coverage The penalty (assessed equal to # of FT ees employed yr (minus 80) times $2,000 annually. EE offered coverage some months = # months employed as FT ee times $167 The amount of the payment for the month = # of FT ees who receive premium tax credit for that month x 1/12th of $3,000 or $250 month, up to a maximum of the total number of full-time employees (minus 30) times $2,000 No 3 There is no penalty payment required of the employer since it offered MEC, affordable, minimum value coverage to % ACA full-time employees. Slide Source: ADP 3 2 191 Some significant numbers … $$$ Impact $100,000,000 Description Missing the “play” mandate by failing to cover 95% of the fulltime work force. For 2015, this percentage is 70% [ $2,000 x 30,000 employees / (1 – 40% Corporate Tax Rate)] $1,500,000 Assuming a 1% government error rate … the impact to the P&L if we can reverse a government affordability penalty [ $3,000 x 30,000 employees x 1% / (1 – 40% Corporate Tax Rate)] $2,700,000 Unnecessarily providing medical care: If 1% of the people coded in the system taking medical care actually worked less than 30 hours per week [ 1% x 30,000 employees x $9,000 average per employee cost ] 4 ACA compliance – exchange notices Required documentation Exchange notices and requests will vary widely by state Slide Source: ADP 5 3 192 ACA compliance – government filings Filings signed by senior Finance officer for calendar year 2015 are due early in 2016 6 6 ACA compliance – ConAgra Foods Annual reporting • Hiring third party with technology for: – Recordkeeping, – Preparing annual reporting – Augmenting our strategy to minimize ACA penalties • New Service Center team (3 employees) to work with third party and implement enrollment strategy Cadillac Tax of 2018 • Maximize use of lower cost groups • No expected impact to ConAgra Foods programs until after 2025 • Awaiting further regulatory guidance Slide Source: ADP 7 4 193 Healthcare Cost Optimization Strategies Cost optimization – PBM strategies Specialty pharmacy • • • Steer specialty drugs to the specialty pharmacy and away from the medical facility when possible Pharmacogenomics - Require DNA testing to ensure drugs will be effective for the individual Place quantity limits on first script fills to ensure patient can tolerate the medication Develop drug delivery rules to apply best medical science possible • • Take advantage of new generics as they become available Implement prior authorization requirements: promote utilization of equally effective lower-cost alternative medications, better quality solutions that come to market Contract pricing components • • • Define what is to be priced as a generic. For example, a drug that has been off patent for six or more months and is produced by two or more manufacturers Capture 90%+ of all formulary rebates Typical contract is for three years. Include a Market Price Check in the last year to explore pricing improvements. 9 5 194 Cost optimization – medical Utilize different network strategies • • • Medical insurance carriers often have more than one network in a region with different negotiated discounts. Choose the lower cost / higher quality network if disruption is low. Patient Centered Medical Home / Accountable Care Organizations: Difficult to administer, but could yield significant results. ConAgra Foods will consider this strategy as it evaluates Private Exchange solutions. Direct contracting: Provider organizations with a large percentage of the market do not typically give discounts to the national insurance carrier. ConAgra Foods is considering expanding its Direct Contracting with Medical providers to achieve better discounts. Healthcare transparency • Provide employees the tools to compare medical services for both cost and quality. For example: – – – • A Castlight user who looked up a procedure and had it within 30 days, spent about 20% less on average than a nonCastlight user Medical inflation at ConAgra Foods for Castlight users was half that of non-users Next, education on past care savings opportunities: Following the purchase of care that has cost above market norms, an email alerts the employee on where care could have been received at a more reasonable rate Medical second opinions: We utilize a third party (Advanced Medical) to review complex cases with medical professionals at the top of their field. With Advanced Medical, we sometimes spend more on a case, but often spend less getting the care right the first time. 10 10 Cost optimization – medical Eligibility Management • • Cover only eligible people for your program. Verify all dependent information at hire as a condition of providing benefits. Do periodic dependent eligibility audits. Consider a spousal surcharge: If an employee’s spouse has medical coverage available from his or her employer, incent the employee to have that spouse use it. Retiree Medical (post age 65) • • • Make your current programs compatible with Medicare Advantage or terminate current programs and use a third party broker to assist employees with buying their own individual Medicare Advantage product Deliver your Rx through an Employer Group Waiver Plan (EGWP). EGWP’s capture government subsidies on Rx purchases The above two strategies reduced ConAgra’s Retiree medical liability by 20% 11 6 195 Cost optimization – wellness Activities vs. progress wellness programs • ConAgra Foods began its wellness journey seven years ago with an activities based program • Year one: Participation was the primary incentive • Year two: In addition to participation, employees received incentive based on wellness activities completed • For the past five years, our program has been progress based • Employees must meet goals, or show progress towards improving, the following five wellness criteria: – – – – – Weight (BMI) Blood Pressure Glucose levels Cholesterol Tobacco use 12 Cost optimization – next generation Private Exchanges • • • • • Technology solution that will make multiple carriers available and make available best negotiated discounts and networks Group buying power to obtain better contracting terms Improved technology and employee buying experience Better care and case management through integrated data flows and processes Implementing an exchange requires thoughtful change management within the organization 13 7 196 QUESTIONS? 8


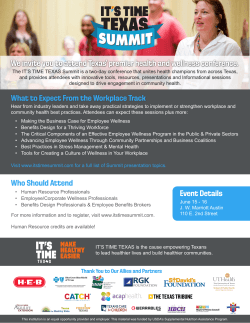

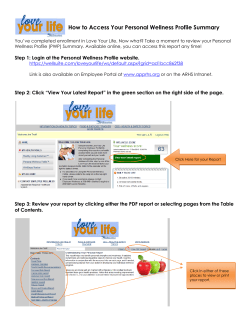


© Copyright 2026