
Poster - Mapping the Via Appia
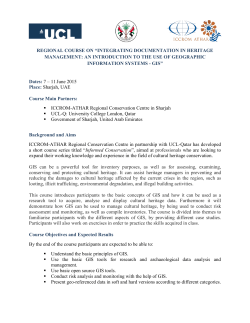
This paper presents an implemented framework for a 3D geographic information system (3D GIS) to facilitate the archaeological research alongside the 5th and 6th mile of the Via Appia near Rome. The 3D GIS allows archaeologists to spatially store, share, visualise and analyse the complex archaeological features in a virtual 3D environment. Furthermore, the 3D GIS allows to include in 3D georeferenced historical images and virtual 3D reconstructions in a scientifically transparent way. At the base of the 3D GIS lies a sophisticated cloud-based data infrastructure, providing various services to different clients ranging from an interactive web viewer to a dedicated desktop viewer. The project has produced a unique research instrument for the archaeologists working in the study area. It provides functionalities and analysis tools which have never been available as such before. Additionally the developed 3D GIS offers, yet unexplored, state of the art opportunities to present the research results to the archaeological research community and the broader public. The archaeological project ‘Mapping the Via Appia’ investigates the 5th and 6th miles of the Via Appia, the ‘Queen of roads’, which was constructed and used from 312 BC onwards. It ran from Rome to the harbour city of Brundisium in the south of Italy. Besides the strategically and economically most important road of the Roman world, it also developed into an elongated necropolis and suburban area, of which countless remains are now scattered all along the road. The ‘Mapping the Via Appia’ project aims • at a thorough inventory and analysis of the Roman interventions in their suburban landscape; • to gain insights into the use of the road after antiquity; • to gain an insight into the modern use of the archaeological park. The framework for the 3D GIS consists of various components which can be grouped in four parts. They are all part of an infrastructure that makes them accessible via the internet as services. The reference point cloud of the study area was laser scanned using Fugro´s DRIVE-MAP service. In order to generate more detailed 3D representations of the archaeological objects, image-based modelling techniques were applied using Visual SfM components. To integrate these captures in the laser point cloud, both automatic and manual alignment functionalities have been implemented. Functionality to identify objects in 3D and to link these to a relational database has been implemented, which is essential to allow the systematical querying of the objects based on their fieldwork attributes. DATA ACQUISITION pictures Topcon footprints DATA PROCESSING DATA STRUCTURE automatic image-based modelling meshes & pictures DESKTOP application OpenSceneGraph point cloud automatic alignment Fugro DRIVE-MAP 3D bounding boxes manual alignment fieldwork analysis relational database APPLICATIONS define sites and objects To systematically analyse the study area, the infrastructure offers processing and viewing services on which both a desktop (based on OpenSceneGraph) and a web client (based on WebGL potree) have been developed. These clients offer functionalities to query the archaeological objects based on their attributes, integrate 2D mapping services, visualise 3D sections and to measure distances, angles and volumes. WEB application Potree PostgreSQL relational database 3D reconstructions To produce archaeological 3D reconstructions, the infrastructure offers functionalities to download sections of the dataset. This allows researchers to use the data in dedicated 3D modelling software. In addition, the infrastructure offers functionality to upload multiple hypothetical 3D reconstructions. These reconstructions are presented as a service, allowing to be visualised in both the web and desktop client. 3D modelling software e.g. SketchUp, Blender, CityEngine historical images Yours? Especially the web viewer offers clear opportunities to share the research results with other scholars and a broader public. The viewer allows people to browse through the dataset in 3D, without having to install software on the local machine. Furthermore we have developed services which are accessible through an Oculus Rift. The 3D GIS for Mapping the Via Appia has been developed in close collaboration with the various archaeologists involved. The system is now in place and ready to be used by our research team, both staff and students. All components developed in the project are open-source and thus available and reusable by other research teams. We invite other researchers to use and enrich the code and components we have developed.


© Copyright 2026