
Co-evolution of Infrastructure and Source Code - An
Co-evolution of Infrastructure and Source Code - An
Empirical Study
Yujuan Jiang, Bram Adams
MCIS lab Polytechnique Montreal, Canada
Email: {yujuan.jiang,bram.adams}@polymtl.ca
Abstract—Infrastructure-as-code automates the process of
configuring and setting up the environment (e.g., servers, VMs
and databases) in which a software system will be tested and/or
deployed, through textual specification files in a language like
Puppet or Chef. Since the environment is instantiated automatically by the infrastructure languages’ tools, no manual
intervention is necessary apart from maintaining the infrastructure specification files. The amount of work involved with such
maintenance, as well as the size and complexity of infrastructure
specification files, have not yet been studied empirically. Through
an empirical study of the version control system of 265 OpenStack
projects, we find that infrastructure files are large and churn
frequently, which could indicate a potential of introducing bugs.
Furthermore, we found that the infrastructure code files are
coupled tightly with the other files in a project, especially test files,
which implies that testers often need to change infrastructure
specifications when making changes to the test framework and
tests.
I.
I NTRODUCTION
Infrastructure-as-code (IaC) is a practice to specify and
automate the environment in which a software system will be
tested and/or deployed [1]. For example, instead of having to
manually configure the virtual machine on which a system
should be deployed with the right versions of all required
libraries, one just needs to specify the requirements for the VM
once, after which tools automatically apply this specification
to generate the VM image. Apart from automation, the fact
that the environment is specified explicitly means that the
same environment will be deployed everywhere, ruling out
inconsistencies.
The suffix “as-code” in IaC refers to the fact that the
specification files for this infrastructure are developed in a kind
of programming language, like regular source code, and hence
can be (and are) versioned in a version control system. Puppet
[2] and Chef [3] are two of the most popular infrastructure
languages. They are both designed to manage deployments on
servers, cloud environments and/or virtual machines, and can
be customized via plug-ins to adapt to one’s own working
environment. Both feature a domain-specific language syntax
that even non-programmers can understand.
The fact that IaC requires a new kind of source code files
to be developed and maintained in parallel to source code and
test code, rings some alarm bells. Indeed, in some respects
IaC plays a similar role as the build system, which consists of
scripts in a special programming language such as GNU Make
or Ant that specify how to compile and package the source
code. McIntosh et al. [4] have shown how build system files
have a high relative churn (i.e., amount of code change) and
have a high coupling with source code and test files, which
means that developers and testers need to perform a certain
effort to maintain the build system files as the code and tests
evolve. Based on these findings, we conjecture that IaC could
run similar risks and generate similar maintenance overhead
as regular build scripts.
In order to validate this conjecture, we perform an empirical case study on 265 OpenStack projects. OpenStack is an
ecosystem of projects implementing a cloud platform, which
requires substantial IaC to support deployment and tests on
virtual machines. The study replicates the analysis of McIntosh
et al. [4], this time to study the co-evolution relationship
between the IaC files and the other categories of files in a
project, i.e., source code, test code, and build scripts. To get a
better idea of the size and change frequency of IaC code, we
first address the following three preliminary questions.
PQ1)
How many infrastructure files does a project
have?
Projects with multiple IaC files have more IaC files
than build files (median of 11.11% of their files).
Furthermore, the size of infrastructure files is in the
same ballpark as that of production and test files, and
larger than build files.
PQ2)
How many infrastructure files change per month?
28% of the infrastructure files in the projects changed
per month, which is as frequently as production files,
and significantly more than build and test files.
PQ3)
How large are infrastructure system changes?
The churn of infrastructure files is comparable to build
files and significantly different with the other file categories. Furthermore, the infrastructure files have the
highest churn per file (MCF) value among the four file
categories.
Based on the preliminary analysis results, we then address
the following research questions:
RQ1)
How tight is the coupling between infrastructure
code and other kinds of code?
Although less commits change infrastructure files than
the other file categories, the changes to IaC files are
tightly coupled with changes to Test and Production
files. Furthermore, the most common reasons for coupling between infrastructure and test are “Integration”
# Chef snippet!
# Puppet snippet !
case node[:platform]!
case $platform{!
when “ubuntu”!
!
‘ubuntu’: {!
!
package “httpd-v1” do!
!
!
package {‘httpd-v1’:!
!
!
version “2.4.12”!
!
!
!
!
!
action: install!
!
!
}!
!
end!
ensure => “2.4.12”!
!
}!
when “centOS”!
!
‘centOS’: {!
!
package “httpd-v2” do!
!
!
package {‘httpd-v2’:!
!
!
version “2.2.29”!
!
!
!
!
!
action: install!
!
!
}!
!
end!
!
}!
end
ensure => “2.2.29”!
}
Fig. 1: Code snippets of Puppet and Chef.
of new test cases and “Updates” of test configuration
in infrastructure files.
RQ2)
Who changes infrastructure code?
Developers changing the infrastructure take up the
lowest proportion among all developers, and they are
not dedicated to IaC alone, since they also work on
production and test files.
II.
BACKGROUND AND R ELATED W ORK
A. Infrastructure as Code
IaC (Infrastructure as Code) makes it possible to manage
the configuration of the environment on which a system needs
to be deployed via specifications similar to source code. A
dedicated programming language allows to specify the environment such as required libraries or servers, or the amount of
RAM memory or CPU speed for a VM. The resulting files can
be versioned and changed like any other kind of source code.
This practice turns the tedious manual procedure of spinning
up a new virtual environment or updating a new version of the
environment (from the low-level operating system installed all
the way up to the concrete application stack) into a simple click
of executing a script. This automation and simplication helps
shorten the release and test cycle, and reduces the potential of
human error.
Currently, Puppet and Chef are the two most popular
infrastructure languages. They allow to define a series of environment parameters and to provide deployment configuration.
They can define functions and classes, and allow users to
customize their own Ruby plug-ins according to their specific
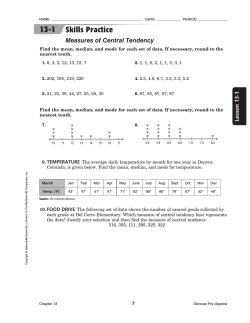
requirements. Figure 1 shows two code snippets of Puppet and
Chef that realize the same functionality, i.e., initializing an
https server on two different platforms (each platform requires
a different version of the server).
B. Related Work
Our work replicates the work of McIntosh et al. [4] who
empirically studied the build system in large open source
projects and found that the build system is coupled tightly with
the source code and test files. In their work, they classify files
into three different categories including “Build”, “Production”,
and “Test”. They also studied the ownership of build files to
look into who spent the most effort maintaining these files.
They observed different build ownership patterns in different
projects: in Linux and Git a small team of build engineers
maintain most of the build maintenance, while in Jazz most
developers contribute code to the build system. In our work, we
added a fourth category of files (IaC) and we focus the analysis
on those files. Hindle et al. [5] studied the release patterns in
four open source systems in terms of the evolution in source
code, tests, build files and documentation. They found that
each individual project has consistent internal release patterns
on its own.
Similar to McIntosh et al. [4], other researchers also
used “association rules” to detect co-change and co-evolution.
Herzig et al. [6] used association rules to predict test failure
and their model shows good performance with precision of
0.85 to 0.90 on average. Zaidman et al. [7] explored the
co-evolution between test and production code. They found
different coupling patterns in projects with different development style. In particular, in test-driven projects there is
a strong coupling between production and test code, while
other projects have a weaker coupling between testing and
development. Gall et al. [8] studied the co-evolution relation
among different modules in a project, while our work focuses
on the relation among different file categories.
Adams et al. [9] studied the evolution of the build system
of the Linux kernel at the level of releases, and found that
the build system co-evolved with the source code in terms of
complexity. McIntosh et al. [10] studied the ANT build system
evolution. Zanetti et al. [11] studied the co-evolution of GitHub
projects and Eclipse from the socio-technical structure point
of view. Our work is the first to study the co-evolution process
between infrastructure and source code in a project.
Rahman et al. [12], Weyuker et al. [13], Meneely et al.
[14] studied the impact of the number of code contributors on
the software quality. Karus et al. [15] proposed a model that
combines both code metrics and social organization metrics to
predict the yearly cumulative code churn. It turns out that the
combined model is better than the model only adopting code
metrics. Bird et al. [16] proposed an approach for analyzing the
impact of branch structure on the software quality. Nagappan et
al. [17] conducted a study about the influence of organizational
structure on software quality. Nagappan et al. [18] predicted
defect density with a set of code churn measures such as the
percentage of churned files. They showed that churn measures
are good indicators of defect density.
Shridhar et al. [19] conducted a qualitative analysis to study
the build file ownership styles, and they found that certain build
changes (such as “Corrective” and “New Functionality”) can
introduce higher churn and are more invasive. Our work is the
first to study the ownership style of infrastructure files.
Curtis et al. [20], Robillard [21], Mockus et al. [22] [23]
focus on how domain knowledge impacts the software quality.
It turns out that the more experienced and familiar in a domain,
the fewer bugs are introduced. This suggests that if IaC experts
change IaC files, they are less likely to introduce bugs than,
say, build developers. We study IaC ownership, yet do not
study bug reports to validate this link.
To summarize, our study is the first to analyze the coevolution of IaC with known file categories, as well as ownership of IaC file changes.
III.
A PPROACH
The process of our study is shown as a flow chart in
Figure 2.
A. Data Collection
OpenStack is an open source project launched jointly by
Rackspace Hosting and NASA in July 2010. It is in fact governed by a consortium of organizations who have developed
multiple interrelated components that together make up a cloud
computing software platform that offers “Infrastructure As A
Service (IaaS)”. Users can deploy their own operating system
or applications on OpenStack to virtualize resources like cloud
computing, storage and networking.
Given that testing and deploying a cloud computing platform like OpenStack requires continuous configuration and
deployment of virtual machines, OpenStack makes substantial
use of IaC, adopting both “Puppet” and “Chef” to automate
infrastructure management. Apart from its adoption of IaC,
OpenStack has many other characteristics that prompted us to
study it in our empirical study. In particular, it has 13 large
components (“modules”) spread across 382 projects with their
own git repositories, 20 million lines of codes, rapid release
cycle (cycle time of 6 months), and a wide variety of users
such as AT& T, Intel, SUSE, PayPal, and eBay.
B. Classifying Files into Five Categories
In order to study the co-evolution relationship between the
infrastructure and the other files, first we need to classify them
into different categories. We mainly identify “Infrastructure”,
“Build”, “Production (i.e., source code)” and “Test” files.
Other files, such as images, text, and data files, were categorized into the “Others” category and were not considered
in our study. Note that we classified any file that ever existed
in an OpenStack project across all git commits, amounting to
133,215 files in total.
In order to do the classification, we used a similar approach
as McIntosh et al. [4]. First, we wrote a script to identify files
with known naming patterns. For example, names containing
“test” or “unitest” should be test files, while the “Makefile”
or “Rakefile” names are build files, and the files with a programming language suffix such as “.py”, “.rb” (typically, but
not always) belong to the production files. The infrastructure
files written in Puppet have a suffix “.pp”. After classifying
those files that are easily identified, we manually classified the
remaining 25,000 unclassified files.
For this, we manually looked inside the files to check
for known constructs or syntax, and for naming conventions
specific to OpenStack. If the content was not related to any of
the four categories of interest, we classified it as “Other”. We
put the resulting file classification online 1 .
1 https://github.com/yujuanjiang/OpenStackClassificationList.
C. Splitting the OpenStack Projects in Two Groups
We collected all the revisions from the 382 git repositories
of the OpenStack ecosystem. After classification, we did a
statistical analysis and found 117 projects without infrastructure file, so we removed them from our data set, as we focus
on the analysis of IaC. Upon manual analysis of the projects
without infrastructure files, we found that they mostly do
not serve the main functionality of OpenStack (namely cloud
computing), but rather provide the supporting services like
reviewing management (e.g., “reviewday”), test drivers (e.g.,
“cloudroast” and “cookbook-openstack-integration-test”), plugins for build support (e.g, “zmq-event-publisher”), front-end
user interface generation (e.g., “bugdaystats” and “clif”), and
external libraries (e.g., “cl-openstack-client” for Lisp).
Of the projects containing infrastructure files, we found that
some of them have only few infrastructure files, while other
projects have many infrastructure files. The former repositories
are relatively small in terms of the number of files (with a
median value of 71.5 and mean of 174.4). In order to study
if the infrastructure system acts differently in these different
contexts, we split the remaining projects into two groups:
the “Multi” group with projects that contain more than one
infrastructure file and the “Single” group with projects that
contain only one infrastructure file. The Multi group contains
155 projects, whereas the Single group 110 projects. In our
study, we compare both groups to understand whether there is
any difference in maintenance effort between the two groups.
D. Association Rules
To analyze the coupling relationship in RQ1 and RQ2, we
use association rules. An association rule is a possible coupling
between two different phenomena. For example, supermarkets
found that diapers and beer are usually associated together,
because normally it is the father who comes to buy diapers
and along the way may buy some beer for himself.
To measure the importance of an association rule, a number
of important metrics can be calculated, such as “Support”
(Supp) and “Confidence” (Conf). The metric Support(X)
indicates the frequency of appearance of X, while the metric
Confidence(X=>Y) indicates how often a change of X will
happen together with a change of Y. For example, if there
are 20 commits in total for project P, and 10 of them are
changing infrastructure files, then Supp(Inf)=0.5 (10/20). If
among these 10 commits, 6 of them also change test files, then
Conf(Inf=>Build)=0.6 (6/10). Association rules can help us
understand the coupling relationship among different projects.
Note that we don’t mine for new association rules, but analyze
the strength of the six rules involving IaC files and the three
other file categories (IaC =>Build, IaC =>Production, IaC
=>Test and the three inverse rules).
Additionally, in the qualitative analysis of the change
coupling, we need to select the most tightly coupled commits
for manual analysis. Since Confidence is not a symmetrical
measure (Conf(X=>Y) is different from Conf(Y=>X)), it
yields two numbers for a particular pair of file categories,
which makes it hard to identify the projects with “most tightly
coupled” commits. For this reason, we adopt the metric “Lift”,
which measures the degree to which the coupling between two
file categories is different from the situation where they would
Commit co-change
Inf
Prod
Prod
Bld
Test
Bld
Test
Inf
Inf
Inf
Bld
Bld
Bld
Prod
Prod
Prod
Test
Test
Test
Other
Inf
Inf
Other
Other
Other
Inf
Inf
Inf
Test
Monthly change ratio
Inf
Inf
Statistical visualization
Average churn
Classifying Files !
into Five Categories
Splitting the OpenStack !
Projects in Two Groups
Preliminary Analysis
Production !
developer
Prod
Test
Data Collection
Ownership coupling
? ?
Bld
Build developer
Infrastructure !
developer
Tester
Case Study Results
Fig. 2: Flow chart of the whole approach.
be independent from each other. For each project, we computed
the Lift value, then for the 10 projects with the highest lift
value for a pair of file categories, we selected the top 10 most
tightly coupled commits. The formula for “Lift” related to the
Conf and Supp metrics is as follows:
T
P (A B)
Conf =
P (A)
\
Supp = P (A B)
T
P (A B)
Lif t =
P (A)P (B)
E. Card Sorting
For our qualitative analysis, we adopted “Card Sorting”
[24] [25], which is an approach that allows to systematically
derive structured information from qualitative data. It consists
of three steps: 1) First, we selected the 10 projects with the
highest lift value for a certain pair of file categories. Then, for
each such project, we wrote a script to retrieve all commits
changing files of both categories. 2) Then, we randomly sort
all selected commits for a project and pick 10 sample commits.
3) The first author then manually looked into the change
log message and code of each commit to understand why
this co-change happens. In particular, we were interested in
understanding the reason why changes of both categories were
necessary in the commit. If this is a new reason, we added it as
a new “card” in our “card list”. Otherwise, we just increased
the count of the existing card. After multiple iterations, we
obtained a list of reasons for co-change between two file
categories. Finally, we clustered cards that had related reasons
into one group, yielding seven groups.
“Card sorting” is an approach commonly used in empirical
software engineering when qualitative analysis and taxonomies
are needed. Bacchelli et al. [26] used this approach for
analyzing code review comments. Hemmati et al. [27] adopted
card sorting to analyze survey discussions [19].
F. Statistical tests and beanplot vsualization.
In our work, we mainly used the Kruskal-Wallis and MannWhitney tests to do the statistical tests, and used the beanplot
package in R as the visualization tool for our results.
The Kruskal-Wallis test [28] is a non-parametric method
that we use to test if there exists any difference between the
distribution of a metric across the four file categories. If the
null hypothesis (“there is no significant difference between the
mean of the four categories”) is rejected, at least one of the
categories has a different distribution of the metric under study.
To find out which of the metrics has a different distribution, we
then use Mann-Whitney tests as post-hoc test. We perform such
a test between each pair of file categories, using the Bonferroni
correction for the alpha value (which is 0.05 by default in all
our tests).
A Beanplot [29] is a visualization of a distribution based
on boxplots, but adding information about the density of each
value in the distribution. Hence, apart from seeing major
moments like median, minimum or maximum, one can also
see which values are the most frequent in the sample under
study. By plotting two or more beanplots next to each other,
one can easily see asymmetry in the distribution of values (see
Figure 5).
IV.
P RELIMINARY A NALYSIS
Before addressing the main research questions, we first
study the characteristics of IaC files themselves.
PQ1: How many infrastructure files does a project have?
Motivation: As infrastructure code is a relatively new
concept, not much is known about its characteristics. How
common are such files, and how large are they in comparison
to other known kinds of files?
Approach: First, we compute the number and percentage
of files in each file category for each project. Afterwards, we
computed the number of lines of each infrastructure file in
each project. Furthermore, we manually checked the Multi
projects to understand why they contain such a high proportion
of infrastructure files, for example whether they are projects
dedicated to IaC code. We also did Kruskal-Wallis and posthoc tests to check the significance of the results with as
null hypothesis “there is no significant difference among the
distributions of the proportion/the LOC of each file category”.
Results: Multi projects have a higher proportion of
infrastructure files than build files, with a median value
of 11.11% across projects. Figure 3 shows the boxplot of the
proportion of the four file categories relative to all files of a
project, while Table I shows the corresponding numbers. We
can see that in both groups, the trends are the same except for
infrastructure files. Unsurprisingly, the production files take
up the largest proportion of files (with a median of 34.62%
in group Multi and 47.80% in group Single). This makes
sense, because the source code files should be the fundamental
composition of projects. The test files take up the second
largest proportion (with a median value of 12.95% in group
Multi and 23.94% in group Single). By definition, for “Single”
projects, the infrastructure files take up the lowest proportion
(with a median of 3.85%), behind build files (with a median of
17.24%), while for Multi projects the order is swapped (with
a median of 11.11% for Infrastructure and 5.71% for Build
files). Indeed, Multi projects not only have more than one
infrastructure file, they tend to have a substantial proportion
Production
0.00
34.62
31.84
57.73
11.46
47.80
42.25
66.67
Test
2.21
12.95
18.04
29.91
12.71
23.94
24.26
35.21
1.0
0.8
Build
2.41
5.71
11.72
12.37
7.60
17.24
25.41
40.00
Build
Production
Test
0.2
0.4
0.6
0.8
1.0
(a) groupMulti
0.0
Although production and test files statistically significantly are larger, the size of infrastructure files is in the
same ballpark. Figure 4 shows for each file category the
boxplot across all projects of the median file size (in terms of
LOC). We can see that the sizes of infrastructure (median of
2,486 for group Multi and 1,398 for group Single), production
(median of 2,991 for group Multi and 2,215 for group Single)
and test files (with a median of 2,768 for group Multi and
1,626 for group Single) have the same order of magnitude.
The size of build files is the smallest (with a median of 54 for
group Multi and 52 for group Single).
↵
Infrastructure files take up a small portion of projects
with a median value of 11.11%, but their size is larger
than build files and in the same ballpark as code and
test files.
⌦
Infrastructure
Infrastructure
Build
Production
Test
(b) groupSingle
Fig. 3: Boxplot of median proportions of four file categories
for each project across all projects (excluding other files)
10000
The percentage of infrastructure files has a large variance for “Multi” projects. The median value is rather small
compared to the other three categories, but within four projects,
the percentage of infrastructure files can reach as high as
100%. Therefore, we ranked all the projects by the percentage
of infrastructure files (from high to low) and manually looked
into the top ones. We found that those projects clearly are
infrastructure-specific. 51 of these projects have names related
to the infrastructure system (28 of them named after Puppet, 23
after Chef). For example, the “openstack-chef-repo” repository
is an example project for deploying an OpenStack architecture
using Chef, and the “puppetlabs-openstack” project is used to
deploy the Puppet Labs Reference and Testing Deployment
Module for OpenStack, as described in the project profile on
GitHub [30] [31].
100
of such files. The differences in proportion between IaC files
and the three other categories all are statistically significant.
0.0
0.2
Group Single
Infrastructure
3.33
11.11
38.40
89.47
1.73
3.85
8.02
11.11
0.6
Group Multi
1st Qu.
Median
Mean
3rd Qu.
1st Qu.
Median
Mean
3rd Qu.
0.4
TABLE I: The proportion of the four file categories in each
project (%) in terms of the number of files.
Motivation: The results of PQ1 related to size and to
some degree proportion of files could indicate a large amount
of effort needed to develop and/or maintain the infrastructure
files, both in Single and Multi projects. To measure this effort,
this question focuses on the percentage of files in a category
that are being changed per month [4]. The more files are
touched, the more effort needed.
Approach: In order to see how often each file category
changes, we computed the number of changed files per month
of each project. To enable comparison across time, we normalize the number by dividing by the corresponding number of
files in a category during that month, yielding the proportion of
1
PQ2: How many infrastructure files change per month?
Infrastructure
Build
Production
Test
Fig. 4: Boxplot of the median size (in LOC) of the four
different file categories across all projects (group “Multi”).
changed files. For each project, we then calculate the average
proportion of changed files per month, and we study the
distribution of this average across all projects. Note that we
use average value in PQ2 and PQ3, whereas we use medians
in the rest of the paper, because “Single” projects only have
PQ3: How large are infrastructure system changes?
Motivation: Now that we know how many infrastructure
files change per month for all the projects, we want to know
how much each file changes as well. In addition to the number
of changed lines, the types of changes matter as well. For
example, two commits could both change one line of an
infrastructure file, but one of them could only change the
version number while the other one may change a macro
definition that could cause a chain reaction of changes to
other files. Hence, we also need to do qualitative analysis on
infrastructure files.
Infrastructure vs Build
Fig. 5: Distributions of average percentage of changed files per
project for the four file categories (group “Multi”).
one infrastructure file and hence a median value would not
make sense.
Furthermore, we again did a Kruskal-Wallis test and posthoc tests to examine the statistical significance of our results.
Results: The average proportion of infrastructure files
changed per month is comparable to that of source code,
and much higher than that of build and test files, with
a median value across projects of 0.28. Figure 5 shows
the distribution across all projects in group “Multi” of the
average proportion of changed files. Since the group “Single”
has the same trend, we omitted its figure. We can see that
the production files (with a median value of 0.28) change as
frequently as the infrastructure files (with a median value of
0.28). The test files change less frequently (with a median
value of 0.21) than infrastructure files but more frequently than
build files (with a median value of 0.18).
The percentage of changed files per month for infrastructure and production files are significantly higher than
for build and test files. A Kruskal-Wallis test on all file
categories yielded a p-value of less than 2.2e-16, hence at least
one of the file categories has a different distribution of monthly
change percentage at 0.05 significance level. We then did
Mann-Whitney post-hoc tests, which showed that, except for
infrastructure and production files (p-value of 0.112 >0.05),
the other file categories have a statistically significantly lower
change proportion (p-value <0.05). Since change of source
code is known to be an indicator of bug proneness [32] [33]
or risk [34], infrastructure code hence risks to have similar
issues.
↵
The distribution of the median proportion of monthly
change for infrastructure files is similar to production
files, with a median value of 0.28, being higher than
the build and test files.
⌦
Approach: Churn, i.e., the number of changed lines of
a commit is a universal indicator for the size of a change. In
the textual logs of a git commit, a changed line always begins
with a plus “+” or minus “-” sign. The lines with “+” are
the newly added lines, while the lines with “-” are deleted
lines from the code. In order to understand how much each
file category changes per month, we define monthly churn of
a project as the total number of changed lines (both added and
deleted lines) per month. However, when we first looked into
the monthly churn value, we found that there are many projects
not active all the time, i.e., in certain months, the churn value
is zero. Therefore, we just considered the “active period” for
each project, namely the period from the first non-zero churn
month until the last non-zero churn month.
To control for projects of different sizes, we also normalize
the monthly churn of each project by dividing by the number
of files of that project in each month. This yields the monthly
churn per file (MCF). We study the distribution of the average
value of churn and of the average value of MCF across all
projects.
Results: The churn of infrastructure files is comparable
to build files and significantly smaller than for production
and test files. Figure 6 shows the beanplot of the monthly
churn for both groups. We can see in group “Multi” that the
test files have the highest average churn value (with a median
value of 9), i.e., the test commits have the largest size, followed
by production files (with a median value of 8). Infrastructure
file changes (5.25) are larger than build file changes (4.25). In
group “Single”, the production files have the largest commits
(median of 10), followed by test files and infrastructure files
(both median of 8), and build files (median of 5). KruskalWallis and post-hoc tests show that the distribution of churn
of IaC files is significantly different from that of the other files
categories, except from build files in the Single group.
The infrastructure files have the highest MCF value,
with a median of 1.5 in group Multi and median of 5 in
group Single. Figure 7 is the beanplot of the MCF for the
two groups. We can see for both groups that the infrastructure
files have the highest MCF value (median 1.5 in group Multi
and median 5 in group Single), which means that the average
change to a single infrastructure file is larger than for the other
file categories. Hence, although the number of infrastructure
files is smaller than the number of production files, there is
proportionally more change being done to them.
The differences in average MCF between IaC files and the
three other categories all are statistically significant.
0.5
0.4
0.3
0.2
0.1
0.0
Infrastructure <=> Build Infrastructure <=> Production
Infrastructure vs Build
Production vs Test
Fig. 6: Beanplot of average monthly churn across all projects
for the four file categories (group “Multi”) (log scaled).
Infrastructure <=> Test
Fig. 8: Distribution of confidence values for the coupling
relations involving IaC files (Group Multi). The left side of
a beanplot for A<=>B represents the confidence values for
A =>B, while the right side of a beanplot corresponds to B
=>A.
to the infrastructure code. This introduces additional effort on
the people responsible for these changes. Kirbas et al. [35]
conducted an empirical study about the effect of evolutionary
coupling on software defects in a large financial legacy software system. They observed a positive correlation between
evolutionary coupling and defect measures in the software
evolution and maintenance phase. These results motivate us
to analyze the coupling of infrastructure code with source, test
and build code.
Infrastructure vs Build
Production vs Test
Fig. 7: Beanplot of average MCF across all projects for the
four file categories (group “Multi”) (log scaled).
⌥
⌃
The churn of infrastructure files is comparable to that
of build files, while the average churn per file of
infrastructure is the highest across all file categories.
V.
C ASE S TUDY R ESULTS
⌅
⇧
Now that we know that projects tend to have a higher
proportion of Infrastructure files than build files, infrastructure
files can be large, churn frequently and substantially, we turn
to the main research questions regarding the coupling relation
among commits and IaC ownership.
Approach: In order to identify the coupling relationship
between changes of different file categories, we analyze for
each pair <A, B>of file categories the percentage of commits
changing at least one file of category A that also changed at
least one file of category B. This percentage corresponds to
the confidence of the association rule A=>B. For example,
Conf(Infrastructure, Build) measures the percentage of commits changing infrastructure files that also change build files.
Afterwards, we performed chi-square statistical tests to test
whether the obtained confidence values are significant, or are
not higher than expected due to chance.
Finally, we also performed qualitative analysis of projects
with high coupling to understand the rationale for such coupling. We used “card sorting” (see Section III-E) for this
analysis. We sampled 100 commits across the top 10 projects
with the highest Lift metric (see Section III-D) to look into
why IaC changes were coupled so tightly with changes to other
file categories.
How tight is the coupling between infrastructure
code and other kinds of code?
Results: Infrastructure files change the least often in
both groups. Table II shows the distribution of the Support and
Confidence metrics across the projects in both groups while
Figure 8 visualizes the distribution of these metrics for the
group Multi. We do not show the beanplot of group Single,
since it follows the same trends.
Motivation: Based on the preliminary questions, we find
that infrastructure files are large and see a lot of churn, which
means that they might be bug prone. However, those results
considered the evolution of each type of file separately from
one another. As shown by McIntosh et al. [4], evolution of
for example code files might require changes to build files
to keep the project compilable. Similarly, one might expect
that, in order to keep a project deployable or executable,
changes to code or tests might require corresponding changes
With group Multi as example, we can see that in terms
of the Support metrics (i.e., the proportion of all commits
involving a particular file category), source code changes occur
the most frequently (with a median value of 0.3789), followed
by test files (median of 0.2348), then build files (median of
0.1276). The infrastructure files change the least often, which
suggests that the build and infrastructure files tend to be more
stable than the other file categories. We observed the same
behavior in group Single.
RQ1)
TABLE II: Median Support and confidence values for the
coupling relations involving IaC files. Valued larger than 0.1
are shown in bold.
Support
Conf
system
Infrastructure
Build
Production
Group Multi
0.0402
0.1276
0.3789
Group Single
0.0412
0.1324
0.3806
Test
0.2348
0.2344
Inf, Bld
0.0044
0.0044
Inf, Prod
Inf, Test
0.0336
0.0585
0.0335
0.0607
Inf =>Bld
0.0347
0.0343
Inf = >Prod
0.2637
0.2730
Inf =>Test
0.4583
0.4673
Bld =>Inf
0.1058
0.1140
Prod =>Inf
Test =>Inf
0.0885
0.2578
0.0911
0.2638
The commits changing infrastructure files also tend
to change production and test files. In group Multi,
Conf(Inf=>Prod) and Conf(Inf=>Test) have a high median
value of 0.2637 and 0.4583 respectively. This indicates that
most commits changing infrastructure files also change source
code and test files. Conf(Inf =>Bld) has the lowest median
value (0.0347), which indicates that commits changing infrastructure files don’t need to change build files too often. Similar
findings were made for group Single.
26% of test files require corresponding IaC changes in
both groups. In group Multi, the Conf(Test =>Inf) metric has
a higher value (median value of 0.2578) than Conf(Production
=>Inf) (median value of 0.0885) and Conf(Build =>Inf)
(median value of 0.1058). This means that one quarter of the
commits changing test files also needs to change infrastructure
files. Furthermore, infrastructure files also have a relatively
high coupling with build files, i.e., around 11% of commits
changing build files need to change infrastructure files as well.
The observations in group Single follow the same trend.
The observed high confidence values are statistically
significant in the majority of projects. Using a chi-square
test on the confidence values, we found that in group Multi,
among 155 projects, in 97 of them we observe a significant
coupling between infrastructure and test files, and in 90 of
them we observe a significant coupling between Infrastructure
and Production files. In contrast, in only 2 of them we
observe a significant coupling between Infrastructure and Build
files. This means that the latter co-change relation statistically
speaking is not unexpected, whereas the former ones are much
stronger than would be expected by chance. In group “Single”,
among 110 projects, we found 33 that had a significant
coupling between Infrastructure and Test files, and 35 of
them that had a significant coupling between Infrastructure
and production files, while there was no significant coupling
observed between Infrastructure and Build files. Although the
co-change relations with test and production files are less
strong than for the Multi group, they are still significant for
many projects.
The most common reasons for the coupling between
infrastructure and Build files are Refactoring and Update.
Table III contains the resulting seven clusters from our card
sort analysis. Those clusters group the different rationales
that we identified by manually analyzing 100 commits. The
table also contains for each cluster the percentage of the
100 commits that mapped to that cluster. Since each commit
mapped to one cluster, the proportions add up to 100%.
The coupling between IaC and build files only had the third
highest median Confidence. Coincidentally, the reasons for this
coupling turn out to be simple, with three of the seven reasons
absent. The most common reasons for this coupling include
refactoring and updating files of both file categories because
they share the same global parameters.
The most common reasons for the coupling between
Infrastructure and Production files are External dependencies and Initialization. The most common reason for this
coupling are changes in the IaC files to external dependencies
like Ruby packages that require corresponding changes to the
production files where these dependencies are used. Another
common reason is initialization. If the project initializes a
new instance of a client instance, it needs to initialize the
parameters in the infrastructure file and add new source code
for it.
The most common reasons for the coupling between
infrastructure and test files are “Integration” and “Update”. The coupling between infrastructure and test files has
the highest value, and the reasons are spread across all seven
reasons (similar to the coupling between Infrastructure and
Production). The most frequent reason is integrating new test
modules into a project and updating the configuration for the
testing process in the IaC files as well as in the test files.
✏
Infrastructure files are changed less than the other
file categories. The changes to Infrastructure files are
tightly coupled with the changes to Test and Production files. The most common reasons for the coupling
between Infrastructure and Test are “Integration” and
“Update”.
RQ2)
Who changes infrastructure code?
Motivation: Herzig et al. [36] studied the impact of test
ownership and team social structure on the testing effectiveness
and reliability and found that they had a strong correlation.
This means that in addition to the code-change relations of
RQ1, we also need to check the relationship between the
developers, i.e., the ownership among different file categories.
Even though test or code changes might require IaC changes, it
likely makes a difference whether a regular tester or developer
makes such a change compared to an IaC expert.
Approach: First, we need to identify the ownership for
each category. For this, we check the author of each commit.
If the commit changes an infrastructure file, then we identify
that commit’s author as infrastructure developer. An author can
have multiple identifications, e.g., one can be an infrastructure
file and production developer at the same time (even for the
same commit). We ignore those developers whose commits
only change the files of the “Other” category.
We then compute the RQ1 metrics, but this time for the
change ownership. Supp(Infrastructure) indicates the percent-
TABLE III: The reasons for high coupling and examples based on a sample of 300 (100*3) commits with confidence of 0.05.
Reason
Initialization
N/A
IaC & Build
0
External dependency
N/A
0
Importing new packages called in the
source code, and defining their globally
shared parameters.
33%
Re-formatting the text, or general
cleanup like typos, quotes in global variables.
Ensuring that a variable is changed consistently.
Removing old python schemas.
Environment management overhaul.
Changing coding standard and style.
8%
Separating a macro definition in an infrastructure file, then changing the data
schema in source files correspondingly.
Disabling a global functionality in infrastructure file.
Integrating global bug fixes, or a new
external module, such as JIRA.
10%
Switching the default test repository.
3%
Enabling a new test module or integrating new test cases
26%
Updating external library dependencies,
Changing global variables such as installation path.
Defining a new function in infrastructure
file, implemented in source code.
10%
Updating test configuration (e.g., changing default test repo location or default
parameter value that is initialized in
infrastructure files)
24%
Textual Edit
Renaming, such as changing the project
name from “Nailgun” to “FuelWeb”.
2%
Refactoring
Getting rid of a Ruby gems mirror.
Cleaning up the global variables such as
the location directory.
Removing code duplication.
N/A
45%
Adding RPM package specifications in
an infrastructure file for use in the packaging stage of the build files.
Fixing errors in installation of packages.
Ad-hoc change: changing Puppet
manifest path in infrastructure file and
build system bug fix in makefile.
Changing installation configuration,
such as installing from repos instead of
mirrors, which requires removing the
path and related parameters of the iso
CD image in the infrastructure file and
makefile.
9%
Organization of development structure
Integration of new module
Update
0
44%
IaC & Production
Initializing a new client instance needs
to state copyright in both files.
age of developers changing infrastructure files out of the total
number of developers. Supp(Infrastructure, Build) is the percentage of developers changing both infrastructure and build
files out of the total number of developers. Conf(Infrastructure,
Build) is the percentage of IaC developers that also change
build files out of the total number of developers changing at
least once at infrastructure file.
0.8
0.6
0.4
0.2
Conf
Infrastructure <=> Production
Infrastructure <=> Test
Fig. 9: Distribution of confidence values for the coupling
relations involving the owners of IaC files (Group Multi).
Result: Infrastructure developers have the lowest proportion among all developers while the production developers are the most common. Table IV and Figure 9 show
the measurements support and confidence metrics in terms of
change ownership for the two groups of projects. Similar to
7%
IaC & Test
Integrating a new test specification or
testing a bug fix in the infrastructure file.
Initializing the value of the parameters
of global methods in both the infrastructure and test file.
Enabling a new test guideline (i.e., how
tests should be performed) in new repositories (most frequent).
Adding a new function for testing external libraries or modules, then configuring the imported external libraries or
other modules deployed by infrastructure (e.g., access to GitHub interface).
Removing excessive dependencies.
Adding the license header for both file
categories.
Changing the value of shared method
parameters such as the private variables
of a test case.
Refactoring or cleaning up the test configurations in the infrastructure files.
Getting rid of a module everywhere.
TABLE IV: Median Support and confidence values for the
coupling relations involving IaC developers. Values larger than
0.5 are shown in bold.
Support
Infrastructure <=> Build
29%
system
Infrastructure
Group Multi
0.2744
Group Single
0.2733
Build
0.5392
0.5384
Production
0.7378
0.7390
Test
0.6978
0.6977
Inf, Bld
0.2094
0.3726
Inf, Prod
Inf, Test
0.4442
0.4859
0.4443
0.4825
Inf =>Bld
0.3732
0.3726
Inf = >Prod
0.8034
0.8021
Inf =>Test
0.8967
0.8962
Bld =>Inf
0.7625
0.7635
Prod =>Inf
Test =>Inf
0.5934
0.7064
0.5940
0.7156
RQ1, both groups have similar distribution trends, so we only
show the beanplots for the Multi group.
We can see that, as expected, the developers of production
code take up the highest proportion amongst all developers
(with a median value of 0.6978), followed by test developers
(median of 0.2744) and build developers (median of 0.5392).
18%
12%
3%
14%
3%
The infrastructure developers take up the lowest proportion
(median of 0.2744).
The high value of metrics Supp(Inf, Prod) and Supp(Inf,
Test) (with median values of 0.4442 and 0.4859 respectively)
indicate that almost half of all developers in their career have
had to change at least one Infrastructure and Production file,
or Infrastructure and Test file.
The majority of the infrastructure developers also
develop Production or Test files. The Conf(Inf =>Prod)
and Conf(Inf =>Test) both have a high value (with median
of 0.8034 and 0.8967 respectively). This shows that most
of the infrastructure developers are also production and test
developers. In contrast, the metric Supp(Inf =>Bld) has the
lowest value (median of 0.2094), which indicates that the
developers changing infrastructure and build files respectively
do not overlap substantially.
All kinds of developers change the IaC files. The
Conf(Bld =>Inf), Conf(Prod =>Inf) and Conf(Test =>Inf)
all have a very high value (median higher than 0.5). This
shows that most of the build, production and test developers
are infrastructure developers at the same time.
In particular, Conf(Inf =>Bld) has a lower value (median
of 0.3732) compared to Conf(Bld =>Inf) (median of 0.7625).
Build developers can be infrastructure developers, but the
majority of infrastructure developers hardly change the build
system, since so many other kinds of developers change the
IaC files.
There is significant coupling between the Infrastructure
and Test, and Infrastructure and Production ownership in
most of the projects. In group Multi, for 107 projects we see
that the coupling between Infrastructure and Test developers is
significant, in 76 projects the coupling between Infrastructure
and Production, and in 20 projects the coupling between Infrastructure and Build change ownership. In group “Single”, in
59 projects we see significant coupling between Infrastructure
and Test developers, in 41 projects between Infrastructure and
Production, and in 3 projects between Infrastructure and Build.
↵
The infrastructure developers take up the lowest proportion among all developers. Developers working on
infrastructure files are normal developers that also
work on production and test files.
⌦
VI.
T HREATS T O VALIDITY
Construct validity threats concern the relation between
theory and observation. First of all, we use the confidence
of association rules to measure how closely file categories and
owners co-change in our research questions, similar to earlier
work [4]. Furthermore, we use the monthly churn per file to
measure the frequency of change and the number of changed
lines of code to measure the amount of change. However, these
metrics might not 100% reflect the actual coupling relationship
and churn rate. Other metrics should be used to replicate our
study and compare findings.
Threats to internal validity concern alternative explanations
of our findings where noise could be introduced. During the
classification of different file categories, we adopted the semiautomatic approach of McIntosh et al. [4], consisting of a script
to separate certain file categories, then manually classifying
the remaining files. To mitigate bias, at first the first author of
this paper did this classification, followed by an independent
verification by the second author.
Threats to external validity concern the ability to generalize
our results. Since we have only studied one large ecosystem of
open source systems, it is difficult to generalize our findings
to other open and closed source projects. However, because
OpenStack consists of multiple projects, and also has adopted
the two most popular infrastructure tools Puppet and Chef, it is
a representative case study to analyze. Further studies should
consider other open and closed source systems.
VII.
C ONCLUSION
IaC (Infrastructure as Code) helps automate the process of
configuring the environment in which the software product will
be deployed. The basic idea is to treat the configuration files
as source code files in a dedicated programming language,
managed under version control. Ideally, this practice helps
simplify the configuration behavior, shorten the release cycle,
and reduce the possible inconsistencies introduced by manual
work, however the amount of maintenance required for this
new kind of source code file is unclear.
We empirically studied this maintenance in the context of
the OpenStack project, which is a large-scale open source
project providing a cloud platform. We studied 265 data
repositories and found that the proportion of infrastructure files
in each project varies from 3.85% to 11.11%, and their size
is larger than for build files and the same order of magnitude
of code and test files (median value of 2,486 in group “Multi”
and 1,398 for groups “Single”). Furthermore, 28% of the
infrastructure files are changed monthly, significantly more
than build and test files. The average size of changes to
infrastructure files is comparable to build files, with a median
value of 5.25 in group Multi and 8 in group Single (in terms
of LOC). In other words, although they are a relatively small
group of files, they are quite large and change relatively
frequently.
Furthermore, we found that the changes to infrastructure
files are tightly coupled to changes to the test files, especially
because of “Integration” of new test cases and “Update” of test
configuration in the infrastructure file. Finally, infrastructure
files are usually changed by regular developers instead of
infrastructure experts.
Taking all these findings together, we believe that IaC files
should be considered as source code files not just because
of the use of a programming language, but also because
their characteristics and maintenance needs show the same
symptoms as build and source code files. Hence, more work is
necessary to study bug-proneness of IaC files as well as help
reduce the maintenance effort.
Note that our findings do not diminish the value of IaC
files, since they provide an explicit specification of a software
system’s environment that can automatically and consistently
be deployed. Instead, we show that, due to their relation with
the actual source code, care is needed when maintaining IaC
files.
R EFERENCES
[1]
J. Humble and D. Farley, Continuous Delivery: Reliable Software
Releases Through Build, Test, and Deployment Automation, 1st ed.
Addison-Wesley Professional, 2010.
[2]
J. Turnbull and J. McCune, Pro Puppet, 1st ed. Paul Manning, 2011.
[3]
M. Taylor and S. Vargo, Learning Chef-A Guide To Configuration
Management And Automation, 1st ed., 2014.
[4]
S. McIntosh, B. Adams, T. H. Nguyen, Y. Kamei, and A. E. Hassan,
“An empirical study of build maintenance effort,” in Proceedings of the
33rd International Conference on Software Engineering, ser. ICSE ’11,
2011, pp. 141–150.
[19]
[20]
[21]
[22]
[5]
A. Hindle, M. W. Godfrey, and R. C. Holt, “Release pattern discovery:
A case study of database systems,” in 23rd IEEE International
Conference on Software Maintenance (ICSM 2007), October 25, 2007, Paris, France, 2007, pp. 285–294. [Online]. Available:
http://dx.doi.org/10.1109/ICSM.2007.4362641
[6]
Herzig, Kim and Nagappan, Nachiappan, “Empirically Detecting False
Test Alarms Using Association Rules,” in Companion Proceedings of
the 37th International Conference on Software Engineering, May 2015.
[24]
[7]
Z. Lubsen, A. Zaidman, and M. Pinzger, “Studying co-evolution of
production and test code using association rule mining,” in Proceedings
of the 6th Working Conference on Mining Software Repositories (MSR
2009), M. W. Godfrey and J. Whitehead, Eds. Washington, DC, USA:
IEEE Computer Society, 2009, pp. 151–154.
[25]
[8]
H. Gall, K. Hajek, and M. Jazayeri, “Detection of logical coupling
based on product release history,” in Proceedings of the International
Conference on Software Maintenance, ser. ICSM ’98. Washington,
DC, USA: IEEE Computer Society, 1998, pp. 190–.
[9]
B. Adams, K. De Schutter, H. Tromp, and W. De Meuter, “The evolution
of the linux build system,” Electronic Communications of the ECEASST,
vol. 8, February 2008.
[10]
S. Mcintosh, B. Adams, and A. E. Hassan, “The evolution of java build
systems,” Empirical Softw. Engg., vol. 17, no. 4-5, pp. 578–608, Aug.
2012.
[11]
M. Serrano Zanetti, “The co-evolution of socio-technical structures in
sustainable software development: Lessons from the open source software communities,” in Proceedings of the 34th International Conference
on Software Engineering, ser. ICSE ’12. Piscataway, NJ, USA: IEEE
Press, 2012, pp. 1587–1590.
[12]
F. Rahman and P. Devanbu, “Ownership, experience and defects: A finegrained study of authorship,” in Proceedings of the 33rd International
Conference on Software Engineering, ser. ICSE ’11. New York, NY,
USA: ACM, 2011, pp. 491–500.
[13]
E. J. Weyuker, T. J. Ostrand, and R. M. Bell, “Do too many cooks spoil
the broth? using the number of developers to enhance defect prediction
models,” Empirical Softw. Engg., vol. 13, no. 5, pp. 539–559, Oct. 2008.
[14]
A. Meneely and L. Williams, “Secure open source collaboration: An
empirical study of linus’ law,” in Proceedings of the 16th ACM
Conference on Computer and Communications Security, ser. CCS ’09.
New York, NY, USA: ACM, 2009, pp. 453–462. [Online]. Available:
http://doi.acm.org/10.1145/1653662.1653717
[15]
S. Karus and M. Dumas, “Code churn estimation using organisational
and code metrics: An experimental comparison,” Information &
Software Technology, vol. 54, no. 2, pp. 203–211, 2012. [Online].
Available: http://dx.doi.org/10.1016/j.infsof.2011.09.004
[16]
C. Bird and T. Zimmermann, “Assessing the value of branches with
what-if analysis,” in Proceedings of the 20th International Symposium
on Foundations of Software Engineering (FSE 2012). Association
for Computing Machinery, Inc., November 2012. [Online]. Available:
http://research.microsoft.com/apps/pubs/default.aspx?id=172572
[17]
N. Nagappan, B. Murphy, and V. Basili, “The influence of
organizational structure on software quality: An empirical case
study,” Microsoft Research, Tech. Rep. MSR-TR-2008-11, January
2008. [Online]. Available: http://research.microsoft.com/apps/pubs/
default.aspx?id=70535
[18]
N. Nagappan and T. Ball, “Use of relative code churn measures to
predict system defect density.” Association for Computing Machinery,
Inc., May 2005.
[23]
[26]
[27]
[28]
[29]
[30]
[31]
[32]
[33]
[34]
[35]
[36]
M. Shridhar, B. Adams, and F. Khomh, “A qualitative analysis of software build system changes and build ownership styles,” in Proceedings
of the 8th International Symposium on Empirical Software Engineering
and Measurement (ESEM), Torino, Italy, September 2014.
B. Curtis, H. Krasner, and N. Iscoe, “A field study of the
software design process for large systems,” Commun. ACM, vol. 31,
no. 11, pp. 1268–1287, Nov. 1988. [Online]. Available: http:
//doi.acm.org/10.1145/50087.50089
P. N. Robillard, “The role of knowledge in software development.”
Commun. ACM, vol. 42, no. 1, pp. 87–92, 1999. [Online]. Available:
http://dblp.uni-trier.de/db/journals/cacm/cacm42.html#Robillard99
A. Mockus and D. M. Weiss, “Predicting risk of software changes.”
Bell Labs Technical Journal, vol. 5, no. 2, pp. 169–180, 2000.
A. Mockus, “Organizational volatility and its effects on software
defects,” in Proceedings of the Eighteenth ACM SIGSOFT International
Symposium on Foundations of Software Engineering, ser. FSE ’10.
New York, NY, USA: ACM, 2010, pp. 117–126. [Online]. Available:
http://doi.acm.org/10.1145/1882291.1882311
M. B. Miles and A. M. Huberman, Qualitative data analysis : an expanded sourcebook, 2nd ed. Thousand Oaks, Calif. : Sage Publications,
1994, includes indexes.
L. Barker, “Android and the linux kernel community,” http://www.
steptwo.com.au/papers/kmc whatisinfoarch/, May 2005.
A. Bacchelli and C. Bird, “Expectations, outcomes, and challenges
of modern code review,” in Proceedings of the 2013 International
Conference on Software Engineering, ser. ICSE ’13. Piscataway, NJ,
USA: IEEE Press, 2013, pp. 712–721.
H. Hemmati, S. Nadi, O. Baysal, O. Kononenko, W. Wang,
R. Holmes, and M. W. Godfrey, “The msr cookbook: Mining a
decade of research,” in Proceedings of the 10th Working Conference
on Mining Software Repositories, ser. MSR ’13. Piscataway,
NJ, USA: IEEE Press, 2013, pp. 343–352. [Online]. Available:
http://dl.acm.org/citation.cfm?id=2487085.2487150
“Kruskal-wallis test,” http://www.r-tutor.com/elementary-statistics/
non-parametric-methods/kruskal-wallis-test.
P. Kampstra, “Beanplot: A boxplot alternative for visual comparison
of distributions,” Journal of Statistical Software, Code Snippets,
vol. 28, no. 1, pp. 1–9, October 2008. [Online]. Available:
http://www.jstatsoft.org/v28/c01
“puppetlabspuppetlabs-openstack,”
https://github.com/puppetlabs/
puppetlabs-openstack.
“stackforgeopenstack-chef-repo,”
https://github.com/stackforge/
openstack-chef-repo.
L. Aversano, L. Cerulo, and C. Del Grosso, “Learning from
bug-introducing changes to prevent fault prone code,” in Ninth
International Workshop on Principles of Software Evolution: In
Conjunction with the 6th ESEC/FSE Joint Meeting, ser. IWPSE ’07.
New York, NY, USA: ACM, 2007, pp. 19–26. [Online]. Available:
http://doi.acm.org/10.1145/1294948.1294954
S. Kim, T. Zimmermann, K. Pan, and E. J. W. Jr., “Automatic
identification of bug-introducing changes.” in ASE. IEEE Computer
Society, 2006, pp. 81–90. [Online]. Available: http://dblp.uni-trier.de/
db/conf/kbse/ase2006.html#KimZPW06
E. Shihab, B. Adams, A. E. Hassan, and Z. M. Jiang, “An industrial
study on the risk of software changes,” in Proceedings of the ACM
SIGSOFT 20th International Symposium on the Foundations of Software
Engineering (FSE), Research Triangle Park, NC, US, November 2012,
pp. 62:1–62:11.
S. Kirbas, A. Sen, B. Caglayan, A. Bener, and R. Mahmutogullari,
“The effect of evolutionary coupling on software defects: An
industrial case study on a legacy system,” in Proceedings of the
8th ACM/IEEE International Symposium on Empirical Software
Engineering and Measurement, ser. ESEM ’14.
New York,
NY, USA: ACM, 2014, pp. 6:1–6:7. [Online]. Available: http:
//doi.acm.org/10.1145/2652524.2652577
K. Herzig and N. Nagappan, “The impact of test ownership and team
structure on the reliability and effectiveness of quality test runs,”
in Proceedings of the 8th ACM/IEEE International Symposium on
Empirical Software Engineering and Measurement, ser. ESEM ’14.
New York, NY, USA: ACM, 2014, pp. 2:1–2:10.


© Copyright 2026