
report by the Perioperative Mortality Review Committee (POMRC)
Perioperative Mortality in New Zealand:
Fourth report of the Perioperative Mortality Review Committee
Report to the Health Quality & Safety Commission New Zealand
June 2015
POMRC. 2015. Perioperative Mortality in New Zealand: Fourth report of the Perioperative Mortality Review Committee.
Wellington: Health Quality & Safety Commission 2015.
Published in June 2015 by the Perioperative Mortality Review Committee, PO Box 25496, Wellington 6146, New Zealand
ISBN 978-0-478-38595-3 (Print)
ISBN 978-0-478-38596-0 (Online)
The document is available online on the Health Quality & Safety Commission’s website:
www.hqsc.govt.nz
Acknowledgements
The Perioperative Mortality Review Committee would like to acknowledge:
the ongoing commitment to families who have lost loved ones, to learn from their deaths and develop
and share solutions
the organisations and workplaces that have allowed involvement of committee members
the work of the staff within the Health Quality & Safety Commission, particularly Owen Ashwell
(lead coordinator), Shelley Hanifan (manager, mortality review), Clifton King (project manager),
Joanna Minster (contractor, senior policy advisor) and Dez McCormack (committees coordinator)
Dr Phil Hider and Magnus McGee at the University of Otago, Christchurch for their thorough
epidemiological advice and analysis
the Ministry of Health for providing the baseline data
the Ma-ori Caucus convened by the Health Quality & Safety Commission, for supporting the writing
of the chapter on Ma-ori perioperative mortality, and Joanna Minster for writing the chapter under
the guidance of the Perioperative Mortality Review Committee. Ma-ori Caucus members include:
Assoc. Prof Denise Wilson (Chair), Ngaroma Grant (Deputy Chair), Maria Baker, Dr Terryann Clark,
Dr Sue Crengle and Dr Jonathan Koea.
the professional organisations, practitioners, government advisors and representatives from DHBs
consulted with on the report recommendations, particularly Greg Brooks (President, New Zealand
Private Surgical Hospitals Association Inc), Rose Geden (Executive Director, New Zealand Private
Surgical Hospitals Association Inc), Richard Lander (Executive Director for Surgical Affairs, Royal
Australasian College of Surgeons), Dr Nigel Robertson (Chair, New Zealand Committee, Australian
& New Zealand College of Anaesthetists), Professor Russell L. Gruen (Monash University; Royal
Australasian College of Surgeons), Marilyn Head (Senior Policy Analyst, New Zealand Nurses
Organisation), Dr Michael Roberts (CMO, Northland DHB), Dr Richard Johnson (CMO, South
Canterbury DHB), Dr Nick Baker (CMO, Nelson Marlborough DHB), Dr Martin Thomas (CMO,
Lakes DHB), Dr Ros Iversen (CMO, Tairawhiti DHB), Dr Kenneth Clark (CMO, MidCentral DHB),
Dr Colin McArthur (Medical Advisor, Quality and Safety, Auckland DHB), Dr Margaret Wilsher
(CMO, Auckland DHB), Gary Lees (Director of Nursing and Midwifery, Lakes DHB), Sonia Gamblen
(Director of Nurses, Tairawhiti DHB), Michele Coghlan (Director of Nursing, MidCentral DHB),
Michele Halford (Nursing Director, Wairarapa DHB), Denise Kivell (Director of Nursing, Counties
Manukau), Gabrielle Nicholson and Catherine Proffitt (Perioperative Harm, Health Quality & Safety
Commission) and members of the Ma-ori Caucus.
PERIOPERATIVE MORTALITY REVIEW COMMITTEE: FOURTH REPORT
i
Perioperative Mortality Review Committee Members
Dr Leona Wilson (Chair)
Anaesthetist, Capital & Coast District Health Board; Clinical Head of Department of Anaesthesia,
Hutt Valley District Health Board
Dr Catherine (Cathy) Ferguson (Deputy-Chair)
Otolaryngologist, Capital & Coast District Health Board
Dr Philip (Phil) Hider
Clinical Epidemiologist, University of Otago, Christchurch
Associate Professor Jonathan Koea
Hepatobiliary and General Surgeon, Auckland District Health Board
Dr Digby Ngan Kee
Obstetrician & Gynaecologist, MidCentral District Health Board
Dr Michal Kluger
Anaesthesiologist and Pain Specialist, Waitemata District Health Board
Ms Rosaleen Robertson
Chief Clinical Safety and Quality Officer, Southern Cross Hospitals Limited
Mrs Teena Robinson
Nurse Practitioner, Adult Perioperative Care, Southern Cross QE Hospital
Dr Jean-Claude Theis
Orthopaedic Surgeon, Proffessor, University of Otago
Dr Anthony (Tony) Williams
Intensive Care Medicine Specialist, Counties Manukau Health
ii
Contents
Acknowledgementsi
Perioperative Mortality Review Committee Members
ii
Foreword1
Chair’s Introduction
2
Executive Summary
4
Perioperative Mortality 2008–2012
10
Mortality following Coronary Artery Bypass Graft (CABG)
11
Mortality following Percutaneous Transluminal Coronary Angioplasty (PTCA)
19
Mortality following Bariatric Surgery
25
Mortality in Admissions with an ASA Score of 4 or 5
27
Mortality Related to Severe Postoperative Sepsis
36
Ma-ori Perioperative Mortality
44
Perioperative Mortality for Previously Reported Clinical Areas
48
Mortality following Cholecystectomy
49
Mortality following General Anaesthesia
50
Mortality following Hip Arthroplasty
51
Mortality following Knee Arthroplasty
52
Mortality in Elective Admissions with an ASA Score of 1 or 2
53
Pulmonary Embolus-Associated and Attributed Mortality
54
Developing World Health Organization (WHO) Metrics in New Zealand
56
Appendices61
List of Abbreviations
72
References73
PERIOPERATIVE MORTALITY REVIEW COMMITTEE: FOURTH REPORT
iii
List of Tables
Table 1:
Cumulative Mortality (per 100,000), New Zealand 2005–2012
7
Table 2:
Mortality following CABG by Year, New Zealand 2008–2012
12
Table 3:
Mortality following CABG by Number of Initial Procedures, New Zealand 2008–2012
12
Table 4:
Mortality following CABG by Main Type of Initial Procedure, New Zealand 2008–2012
13
Table 5:
Main Underlying Cause of Death following CABG, New Zealand 2008–2012
13
Table 6:
Mortality following Acute Admission for CABG by Age, Gender, ASA Score, Ethnicity and NZDep Decile, New Zealand 2008–2012
17
Table 7:
Mortality following Elective/Waiting List Admission for CABG by Age, Gender,
ASA Score, Ethnicity and NZDep Decile, New Zealand 2008–2012
18
Table 8: Mortality following PTCA by Year, New Zealand 2008–2012
20
Table 9: Mortality following PTCA by Initial Procedure Types, New Zealand 2008–2012
20
Table 10: Main Underlying Cause of Death following PTCA, New Zealand 2008–2012
21
Table 11: Mortality following Acute Admission for PTCA by Age, Gender, ASA Score, Ethnicity and NZDep Decile, New Zealand 2008–2012
24
Table 12: Mortality following Bariatric Surgery by Main Type of Initial Procedure, New Zealand 2008–2012
26
Table 13: Thirty-Day Mortality following Admission with an ASA Score of 4 or 5 by Year, New Zealand 2008–2012
28
Table 14: Mortality following Admission with an ASA Score of 4 or 5 by Score, Procedure Number and Emergency Status, New Zealand 2008–2012
28
Table 15: Main Underlying Cause of Death following Admission with an ASA Score 4 or 5 by Admission Type, New Zealand 2008–2012
29
Table 16: Mortality following Acute Admission for ASA Score 4 or 5 by Age, Gender, ASA Score, Ethnicity and NZDep Decile, New Zealand 2008–2012
34
Table 17: Mortality following Elective/Waiting List Admission for ASA Score 4 or 5 by Age, Gender, ASA Score, Ethnicity and NZDep Decile, New Zealand 2008–2012
35
Table 18: Mortality Related to Severe Sepsis following One or More General/Neuraxial Anaesthestics by Year, New Zealand 2008–2012
37
Table 19: Mortality Related to Severe Sepsis following Hospital Admissions with One or More General/Neuraxial Anaesthetics by Admission Type and Main Underlying Cause
of Death, New Zealand 2008–2012
38
iv
Table 20: Mortality Related to Severe Sepsis Among Acute Admissions with One or More General/Neuraxial Anaesthetics by Age, Gender, Number of Anaesthetics, ASA Score, Ethnicity and NZDep Decile, New Zealand 2008–2012
42
Table 21: Mortality Related to Severe Sepsis Among Elective/Waiting List Admissions with
One or More General/Neuraxial Anaesthetics by Age, Gender, Number of Anaesthetics,
ASA Score, Ethnicity and NZDep Decile, New Zealand 2008–2012
43
Table 22: Mortality following Cholecystectomy by Year, New Zealand 2008–2012
49
Table 23: Same or Next Day Mortality following Hospital Admissions with One or More General Anaesthetics by Year, New Zealand 2008–2012
50
Table 24: Mortality following Hip Arthroplasty by Year, New Zealand 2008–2012
51
Table 25: Mortality following Knee Arthroplasty by Year, New Zealand 2008–2012
52
Table 26: Thirty-Day Mortality following Elective Admissions with a First ASA Score of 1 or 2 by Year, New Zealand 2008–2012
53
Table 27: Pulmonary Embolus-Associated Mortality by Year, New Zealand 2008–2012
55
Table 28: WHO’s Proposed Standardised Public Health Metrics for Surgical Care Analysed by the POMRC
57
Table 29: Inpatient Deaths for All Surgical Procedures, New Zealand 2008–2012
57
Table 30: The 10 Most Frequent Surgical Inpatient Procedures by ACHI Block and First Procedure, New Zealand 2008–2012
58
Table 31: The 10 Procedure Blocks Associated with the Most Deaths, New Zealand 2008–2012
59
Table 32: Thirty-Day Mortality Rates for New Zealand Resident Population 61
Table 33: Progress Summary of Third Report Recommendations
68
Table 34: Progress Summary of Second Report Recommendations
69
Table 35: Progress Summary of Inaugral Report Recommendations
70
Table 36: POMRC Progress 2010–2015
71
PERIOPERATIVE MORTALITY REVIEW COMMITTEE: FOURTH REPORT
v
List of Figures
Figure 1:
Mortality following Acute Admission for CABG by Days from Procedure, New Zealand 2008–2012
14
Figure 2: Mortality following Elective/Waiting List Admission for CABG by Days from Procedure, New Zealand 2008–2012
14
Figure 3: Mortality following CABG by Admission Type and Age, New Zealand 2008–2012
15
Figure 4: Mortality following CABG by Admission Type and ASA Score, New Zealand 2008–2012
16
Figure 5: Mortality following Acute Admission for PTCA by Days from Procedure, New Zealand 2008–2012
21
Figure 6: Mortality following PTCA by Admission Type and Age, New Zealand 2008–2012
22
Figure 7: Mortality following PTCA by Admission Type and ASA Score, New Zealand 2008–2012
23
Figure 8: Thirty-Day Mortality following Acute Admissions with an ASA Score of 4 or 5 by Day from Initial Procedure, New Zealand 2008–2012
30
Figure 9: Mortality following Elective/Waiting List Admissions with an ASA Score of 4 or 5 by Day from Initial Procedure, New Zealand 2008–2012
31
Figure 10: Mortality following Admission with ASA 4 or 5 by Admission Type and Age, New Zealand 2008–2012
32
Figure 11: Mortality following Admission with ASA 4 or 5 by ASA Score and Admission Type, New Zealand 2008–2012
33
Figure 12: Mortality Related to Severe Sepsis for Acute Admissions with One or More General/
Neuraxial Anaesthetics by Days from Anaesthetic Procedure, New Zealand 2008–2012
39
Figure 13: Mortality Related to Severe Sepsis for Elective/Waiting List Admissions with One
or More General/Neuraxial Anaesthetics by Days from Anaesthetic Procedure,
New Zealand 2008–2012
39
Figure 14: Mortality Related to Severe Sepsis following One or More General/Neuraxial Anaesthetics 40
by Age and Admission Type, New Zealand 2008–2012
Figure 15: Mortality Related to Severe Sepsis following One or More General/Neuraxial Anaesthetics by ASA Score and Admission Type, New Zealand 2008–2012
41
Figure 16: Hospital Admissions for CABG by Age, Admission Type and Ethnicity, New Zealand
2008–2012
vi
45
Foreword
As Chair of the Health Quality & Safety Commission, I am pleased
to welcome the fourth report from the Perioperative Mortality
Review Committee (the POMRC).
This report presents data on perioperative mortality in New Zealand for five new areas of clinical
importance analysed over the years 2008–2012: coronary artery bypass graft (CABG), percutaneous
transluminal coronary angioplasty (PTCA), bariatric surgery, admissions with an ASA score of 4 or 5 and
severe postoperative sepsis. As part of the POMRC’s approach to continuing long-term surveillance of
perioperative mortality, rates for the clinical areas included in previous reports are also presented for the
same time period.
The POMRC has continued its involvement with developing the World Health Organization (WHO) metrics
for use in New Zealand. Adopting this set of standardised metrics is central to the POMRC’s ability to make
international comparisons in access to surgery and surgical quality. This report presents the two previously
reported WHO metrics (same day surgical mortality and postoperative inpatient mortality) alongside two
more metrics reported for the 10 most frequent surgical procedures performed in New Zealand.
Internationally, the POMRC is working with the Lancet Commission on Global Surgery to refine the measurement
of perioperative mortality across countries with varied levels of economic development. The POMRC has also
made important contributions to developing methods for measuring the need for essential surgery in different
countries with varying hospital information systems and data on disease prevalence.
In New Zealand, the POMRC has continued to develop a system for reviewing local perioperative deaths within
health service providers and district health boards. The aim is to understand the nuanced factors that contribute
to these deaths and identify ways to improve the quality and safety of surgery and thereby save lives.
This report reflects the commitment of the POMRC to improved patient care through national and
international perioperative mortality measurement and surveillance. Dr Wilson and the many other
individuals who have worked on this report are to be congratulated.
Professor Alan Merry, ONZM
Chair, Health Quality & Safety Commission
PERIOPERATIVE MORTALITY REVIEW COMMITTEE: FOURTH REPORT
1
Chair’s Introduction
I am pleased to present the fourth report of the Perioperative
Mortality Review Committee (the POMRC).
The POMRC is a statutory committee that reviews and reports
on perioperative deaths with the aim of reducing these deaths
and supporting continuous quality improvement throughout the sector. The POMRC
achieves this by advising the Health Quality & Safety Commission on all
matters related to perioperative mortality and morbidity, and making sector-wide
recommendations to assist with improving the quality and safety of perioperative care.
This report presents the findings on the epidemiology of perioperative mortality for 2008–2012 in five new
clinically important areas:
1. Coronary artery bypass graft (CABG)
2. Percutaneous transluminal coronary angioplasty (PTCA)
3. Bariatric surgery
4. Admissions with an American Society of Anesthesiologists (ASA) score of 4 or 5
5. Severe postoperative sepsis.
CABG and PTCA were included among the five clinical areas because they were both frequent, and had
a significant number of deaths associated with them; bariatric surgery as this is occurring in increasing
numbers, both nationally and internationally; and ASA 4 and 5, and severe postoperative sepsis, because
these are patients who were thought to have an increased risk of perioperative death.
In addition to presenting perioperative mortality in these five clinical areas, this report extends analyses from
clinical areas included in previous reports to cover the time period for 2008–2012. Clinical areas included
in the extended analyses are cholecystectomy, general anaesthesia, hip and knee arthroplasty, mortality in
elective admissions for those classified as ASA 1 or 2 and pulmonary embolus-associated mortality. These
analyses are part of the POMRC’s approach to maintaining ongoing surveillance of perioperative mortality
in New Zealand.
Findings from the analysis on PTCA revealed the majority of patients receive this procedure through acute
hospital admissions. The POMRC suspects that data on many elective/waiting list admissions for PTCA,
entering through private hospitals, are not being routinely submitted to the National Minimum Dataset
(NMDS). The results from the sections on hip and knee joint replacements reveal some insight into the
percentage of private patients missing from the NMDS.
The POMRC is continuing its work on developing the World Health Organization (WHO) metrics for surgical
care in New Zealand. Standardised public health metrics from previous reports – day of surgery mortality
rate and inpatient mortality rate – are included in this report. Two additional metrics recommended for
countries with more advanced data capability have also been introduced in this report; these include:
•
number of surgical procedures performed in operating rooms for the 10 most frequent procedures in
the country
•
proportion of deaths after surgery by procedure for the 10 most frequent procedures in the country.
Future work will continue to explore and expand the use of WHO metrics as standardised indicators for
surgical care in New Zealand. Such work is part of the POMRC’s long-term approach for comparing
New Zealand data with other international jurisdictions.
2
The POMRC is also continuing its work on developing principles and examples of local multidisciplinary
review systems for collecting in-depth information to enhance our understanding of perioperative deaths.
Since the previous report, the POMRC has conducted a survey of the local perioperative review processes
currently used by district health boards (DHBs) and surgical service providers in New Zealand. From
these survey results, the POMRC chose three exemplars (Waikato DHB, Southern Cross Main Office and
Whanganui DHB) suitable for site visits to gather further details on their review processes. Based on site
visits, and acknowledging the variety of institutions involved in perioperative care, work has continued in
developing the principles for such systems and potential practical examples.
The 2015 workshop will focus on local perioperative mortality review, and be an opportunity to consult on
the progress achieved and future development. This will enable the POMRC to start looking at why patients
died, while continuing to monitor who died.
Dr Leona Wilson, ONZM
Chair, Perioperative Mortality Review Committee
PERIOPERATIVE MORTALITY REVIEW COMMITTEE: FOURTH REPORT
3
Executive Summary
The Perioperative Mortality Review Committee (the POMRC) is a statutory
committee that reviews and reports on perioperative deaths with a view to reducing
perioperative mortality and morbidity, and supporting continuous quality and safety
improvements in New Zealand.
The POMRC’s definition of perioperative deaths includes:
• deaths that occurred after an operative procedure, either within 30 days after the operative
procedure, or after 30 days of the procedure but before discharge from hospital to a home or
rehabilitation facility
• deaths that occurred while under the care of a surgeon in hospital even though an operation was
not undertaken.
For the purposes of the POMRC’s definition of perioperative deaths, an operative procedure refers to any
procedure requiring anaesthetic (local, regional or general) or sedation. This includes a broad range of
diagnostic and therapeutic procedures carried out in designated endoscopy or radiology rooms, such as
gastroscopies, colonoscopies, and cardiac or vascular angiographic procedures.
Perioperative mortality in New Zealand 2008–2012
The following section summarises the key findings from 2008–2012 for the five clinical areas analysed in
this report and for Ma-ori perioperative mortality. Further background data on hospital admissions for the
five clinical areas are available in the companion document Background Information for the Fourth Report
of the Perioperative Mortality Review Committee, which will be available on the Health Quality & Safety
Commission’s website by July 2015.
For these clinical areas the American Society of Anesthesiologists (ASA) Physical Status Classification System
score is a strong predictor of perioperative mortality – evident in both this report and previous reports from
the POMRC.
Higher perioperative mortality is associated with a number of risk factors, including:
• increasing age
• comorbidities and poorer overall health status (higher ASA score)
• emergency (not elective/waiting list) admissions into hospital.
Among the five new clinical areas reviewed for this report, the most frequently listed causes of death were
myocardial infarction, ischaemic heart disease and other cardiovascular causes, and neoplasms and
gastrointestinal causes. However, these were also likely the reasons for many of the procedures being
undertaken in the first instance.
In New Zealand during 2008–2012, the following key findings were observed for each new clinical area.
Coronary artery bypass graft (CABG)
• There were 134 deaths and cumulative mortality in the first 30 days following the procedure was
2.47% of admissions.
• Mortality was higher for acute admissions, older people, Ma-ori and those with a higher ASA score.
These differences were present after adjusting for clinical and demographic factors.
• Deaths most often occurred within three days of surgery.
4
Percutaneous transluminal coronary angioplasty (PTCA)
• There were 369 deaths and the 30-day cumulative mortality rate was 1.66% of admissions.
• Mortality was higher with acute admissions (2.28% of admissions) and when no stent was
undertaken (5.52% of admissions).
• Mortality increased with increasing age and ASA score, and was higher for Pacific peoples.
These differences were present after adjusting for clinical and demographic factors.
• Cumulative mortality among admissions with an ASA score of 5 was very high (62.5%).
Bariatric surgery
• Mortality following bariatric surgery was uncommon – 30-day cumulative mortality was 0.07%
of admissions.
• Deaths were due to gastrointestinal causes and injury.
•
Admission rates were higher for women, those aged 40–54 years and Ma-ori aged 45–54 years.
Mortality in admissions with an ASA score of 4 or 5
• There were 2099 deaths and cumulative mortality in the first 30 days following the procedure was
13.7% of admissions.
• Cumulative mortality for admissions with an ASA score of 5 was 51.95% of admissions and
mortality was highest among emergency admissions with multiple procedures and an ASA score
of 5 (58.62%).
• Deaths were most common one day after the anaesthetic procedure.
Severe postoperative sepsis
Among admissions with severe sepsis1 following general/neuraxial anaesthetic:
• There were 305 deaths and cumulative mortality was high – 21.69% of admissions.
• Most deaths (80%) occurred among acute admissions where cumulative mortality was 22.85%.
Ma-ori perioperative mortality
•Ma-ori mortality was 8.5% following acute CABG and 3.5% following CABG delivered through
elective/waiting list admissions. Mortality rates were significantly higher for Ma-ori compared to
Europeans after adjusting for sociodemographic and clinical variables.
• Mortality following cholecystectomy delivered through elective/waiting list admission routes was
significantly higher for Ma-ori (0.24%) compared to Europeans (0.14%) after adjusting for sociodemographic and clinical variables.
• Same or next day mortality following elective/waiting list admissions with a general anaesthetic was
significantly higher for Ma-ori compared to Europeans after adjusting for socio-demographic
and clinical variables.
• Across all other clinical areas included in this report, Ma-ori perioperative mortality rates were similar
to European rates. This is consistent with findings from previous POMRC reports.
1 Patients with a primary diagnosis of severe sepsis, those with cancer, immunocompromise or pregnancy-related admissions were excluded
from analyses.
PERIOPERATIVE MORTALITY REVIEW COMMITTEE: FOURTH REPORT
5
Perioperative mortality: clinical areas from previous reports
The following section summarises findings from 2008–2012 for the clinical areas that were included in
previous POMRC reports. Perioperative mortality rates from previous reports are summarised in Table 1.
It is important to note that changes in mortality over time should be interpreted with caution as a range of
factors related to coding and small variations in data sets across years (due to time lapses in receiving and
entering data) could influence apparent changes in rates. These factors also explain why some of the rates
presented in each report may appear to differ slightly from year to year.
Further data on mortality and hospital admissions for these clinical areas is available in the companion
document, which will be available on the Commission’s website by July 2015.
In New Zealand during 2008–2012, the following key findings were observed for each of the previously
reported clinical areas.
Cholecystectomy
• There were 113 deaths. The overall cumulative mortality was 0.37% of admissions.
• Mortality was higher when an open procedure was undertaken (4.23% of admissions) or when
a laparoscopic procedure was converted to an open procedure (1.09% of admissions).
• Cumulative mortality rates were higher among acute admissions (0.82% of admissions) than
elective/waiting list admissions (0.18% of admissions).
• Findings were generally consistent with the 2006–2010 and 2007–2011 previously reported
time periods.
General anaesthesia
• There were 1436 deaths (0.12% of admissions), most of which occurred among acute admissions
and at public hospitals.
• Mortality was between 0.11% and 0.13% of admissions each year.
• Mortality was higher among those admissions that were acute or emergency, those with more
than one anaesthetic and those with increasing age and ASA score regardless of other clinical
or demographic factors.
• These findings were consistent with those observed in 2007–2011.
Hip arthroplasty
• There were 645 deaths and five-year cumulative mortality was 1.58% of admissions.
• When clinical and demographic factors were considered, rates were significantly higher,
and associated with increasing age and poorer health (higher ASA score) among both elective/
waiting list and acute admissions.
• The most common cause of death was falls for acute admissions and cardiovascular causes
for elective/waiting list admissions.
• Findings were generally consistent with previous reports and data from 2005–2009.
Knee arthroplasty
• There were 46 deaths and the cumulative mortality rate was low (0.17% of admissions).
• Mortality rates increased with increasing age and ASA score, when clinical and demographic
factors were considered. Most of the mortality occurred following elective/waiting list procedures,
which comprised 98.5% of all knee arthroplasty admissions.
• Cardiovascular causes were the main cause of death.
• The findings are consistent with data from 2005–2009.
6
Mortality in elective/waiting list admissions with an ASA score of 1 or 2 and who received a
general anaesthetic or neuraxial block
• There were between 35 and 60 deaths per annum and the cumulative mortality rate was 0.05%.
• Malignant/Other neoplasms were the most frequently listed cause of death for those over 25 years
of age.
• Mortality was significantly higher for males, those over 25 years of age, those receiving two or
more anaesthetics during their admission, those given an ASA score of 3 or 4 for the last of their
subsequent anaesthetics, and those undergoing subsequent emergency procedures, when clinical
and demographics factors were considered.
• Cumulative mortality declined slightly from previous years (down from 0.07% during 2006–2010).
Pulmonary embolus-associated and attributed mortality
For pulmonary embolus-associated admissions:
• There were 307 deaths and the cumulative mortality was 0.024% of initial anaesthetics.
For pulmonary embolus-attributed admissions:
• There were 199 deaths and the overall cumulative mortality for the 30-day period was 0.016%
of initial anaesthetics.
In relation to both pulmonary embolus-associated mortality and attributed mortality:
• Malignant/Other neoplasms was the most frequently listed main underlying cause of death regardless
of the admission type.
• Mortality rose with age, was higher for acute admissions and was more common in those
admissions that had an ASA score of 4.
• In comparison with the 2007–2011 period, cumulative mortality rates were higher in 2008–2012
for both pulmonary embolus-associated and attributed admissions.
Table 1: Cumulative Mortality (per 100,000), New Zealand 2005–2012
TOPICS ANALYSED OVER TIME
2005–2009
2006–2010
2007–2011
2008–2012
Cumulative 30-Day Mortality Rate per 100,000
Cholecystectomy: Acute
1040.9 (1.04%)
975.0 (0.98%)
821.7 (0.82%)
164.6 (0.16%)
151.0 (0.15%)
181.8 (0.18%)
7268.6 (7.27%)
6608.9 (6.61%)
7098.0 (7.10%)
Hip Arthroplasty 45 Yrs +: Elective/Waiting List
235.3 (0.24%)
180.5 (0.18%)
171.0 (0.17%)
Knee Arthroplasty 45 Yrs +: Elective/Waiting List
206.9 (0.21%)
Cholecystectomy: Elective/Waiting List
Hip Arthroplasty 45 Yrs +: Acute
ASA 1 & 2, Elective/Waiting List (Low-Risk Anaesthetic)
Pulmonary Embolism (Cause of Death): Acute
Pulmonary Embolism (Cause of Death): Elective/Waiting List
142.8 (0.14%)
68.8 (0.07%)
62.9 (0.06%)
54.5 (0.05%)
54.5 (0.055%)
61.7 (0.062%)
67.5 (0.068%)
7.6 (0.008%)
8.7 (0.009%)
9.0 (0.009%)
Cumulative One-Day Mortality Rate per 100,000
General Anaesthetic
119.08 (0.12%)
125.47 (0.13%)
121.5 (0.12%)
PERIOPERATIVE MORTALITY REVIEW COMMITTEE: FOURTH REPORT
7
Data limitations
Data in this report was sourced from the National Minimum Dataset (NMDS) and the National Mortality
Collection (NMC). The NMDS and NMC data sets have limitations associated with coding accuracy and
data completeness. Both data sets are dependent on the quality of clinical records and classification systems.
Many privately funded surgical and procedural day-stay or outpatient hospitals, facilities and in-rooms do
not report any events to the NMDS. The Ministry of Health is unable to estimate the extent to which the
NMDS undercounts events from private surgical, procedural day-stay or outpatient hospital, and facility or
in-room hospitalisations. For this report the data presented is likely to undercount some private hospital
events, with the magnitude of this undercount being difficult to quantify. Findings from the sections on hip
and knee joint arthroplasty, being derived from the New Zealand Joint Registry, do not have the same
issues with underreporting of privately delivered procedures and, as such, they reveal some insight into
the percentage of private patients missing from the NMDS.
Small variation in the data sets across time can also result in slight variations in the mortality and hospitalisation
rates included in each annual report. This variation can be caused by lapses in the time it takes for the data from
each year to be entered into the NMDS and NMC databases, and also through changes in coding over the
years. Such variation limits the ability to compare findings between time periods of interest.
Additional information on data limitations is provided in Appendix 2 of this report.
Developing local systems for perioperative mortality review in New Zealand
The POMRC is continuing its work on developing local multidisciplinary perioperative review systems in
New Zealand. Since the previous report, the POMRC has conducted a survey of the local perioperative review
processes currently used by district health boards (DHBs) and surgical service providers in New Zealand.
From these survey results, the POMRC selected three exemplars, with relatively robust review systems already in
place, for site visits: Waikato DHB, Southern Cross Main Office and Whanganui DHB. The purpose of these site
visits was to gather further details on each organisation’s local review processes, policies and best practices.
As a result of these site visits the POMRC agreed to actively recommend that all providers have a designated
local mortality review group, and that attendance at dedicated mortality and morbidity meetings occur in
protected time. The organisations visited also identified the importance of having a means (eg, forums) to
share learnings from local reviews and enable dissemination of key best practice throughout the sector.
Further investigation into how larger hospitals carry out their local mortality reviews is currently under way.
Ultimately, local review systems will enhance the POMRC’s collection of in-depth information which will,
in turn, result in a deeper understanding of the complexities underlying perioperative mortality.
World Health Organization surgical care metrics: developing standardised measures of surgical
care in New Zealand
This report presented the two World Health Organization (WHO) public health metrics for surgical care
included in the POMRC’s previous reports (day of surgery mortality rate and inpatient mortality rate) for the
2008–2012 time period. Two different analytical methods were used to calculate the New Zealand metrics;
consistent with previous reports, general anaesthesia/neuraxial admissions were used for one method and
the second approach was based on surgical specialty admissions.
An additional two WHO metrics, recommended for countries with more advanced data capability, were
introduced for this report:
• number of surgical procedures performed in operating rooms for the 10 most frequent procedures in
the country
• proportion of deaths after surgery by procedure for the 10 most frequent procedures in the country.
8
Key findings included:
• The two different analytical methods yielded slightly varying day of surgery mortality rates
(0.07%, and 0.12%) and very similar perioperative (inpatient) mortality rates (0.37% and 0.36%
of admissions).
• The 10 most common procedures and 10 procedure blocks associated with the most deaths can
be used to guide selection of procedures for in-depth analysis.
• The 10 most common procedures are internally consistent, but there is considerable variation
within some of the 10 procedure blocks associated with the most deaths.
Future work will continue to explore and expand the use of WHO metrics as standardised indicators for
surgical care in New Zealand. This is part of the POMRC’s long-term approach for comparing New Zealand
data with other international jurisdictions. The POMRC will also continue working with other bodies (Lancet
Commission on Global Surgery, New Zealand Joint Registry) to better understand perioperative mortality
and provide information on the safety of surgery and anaesthesia in New Zealand.
Fourth report recommendations
The following recommendations have been developed by the POMRC and are informed by the data presented in
this report from the NMDS and NMC.
The POMRC recommends that:
1. Further work should be undertaken to reduce the risk of thromboembolic disease. Consideration
should be given to continuing prophylaxis after discharge from hospital including engaging patients
in the ways they can reduce their risk.
2. The POMRC continues to participate in the development and evaluation of WHO metrics for
monitoring and strengthening global surgery and anaesthesia.
3. All providers (public and private) should contribute data on health care to the NMDS.
4. The ASA status should be recorded for all patients for all procedures (including all procedures that do
not involve an anaesthetist).
5. Given the high mortality associated with severe postoperative sepsis, further investigation into
prophylaxis, early detection, diagnosis and management should be undertaken.
6. A targeted evaluation of the mortality rate of Ma-ori patients undergoing CABG should be undertaken.
7. Local multidisciplinary mortality review committees should be developed. Review should not be
limited to patients viewed as low risk, as investigation of higher risk patients (older, high ASA status,
acute) who died may help prevent future deaths by identifying common factors and determining
preventable strategies or more appropriate treatment pathways.
The Ma-ori Caucus recommends that:
1. Further research be undertaken to identify ways to improve Ma-ori access to cardiac treatments,
including screening, early detection and addressing barriers to service uptake.
PERIOPERATIVE MORTALITY REVIEW COMMITTEE: FOURTH REPORT
9
Perioperative Mortality 2008–2012
Since the Perioperative Mortality Review Committee’s (the POMRC’s) first report,
initiatives and programmes for improving surgical safety and reducing surgical mortality
have continued to expand internationally.
Many of the recent gains in patient safety have stemmed from initiatives that emphasise process
improvements, such as the use of the World Health Organization (WHO) surgical safety checklist (Avidan
and Kheterpal 2012). A number of international studies and reviews have demonstrated that surgical safety
checklist use is associated with reduced perioperative mortality, morbidity and length of in-hospital stays
(eg, de Vries et al 2010; Fudickar et al 2012; Haugen et al 2015; van Klei et al 2012).
Having standardised indicators is a crucial aspect of tracking population-level improvements in surgical
quality and safety. The perioperative mortality rate (POMR) is an internationally recognised indicator of
access to, and the safety of, surgery (Makasa 2012). The POMR is often defined as deaths following
anaesthesia within two time periods: day-of-surgery and before discharge from hospital or within 30 days of
surgery. Adjustments for socio-demographic and clinical risk factors allow for comparisons in POMRs across
jurisdictions (Watters et al 2014). A systematic review and meta-analysis of POMRs across developed and
developing countries provides evidence that perioperative mortality has declined over the past 50 years,
despite increasing pre-operative risk among patients (Bainbridge et al 2012).
The following chapters present the perioperative mortality findings for the five new clinical areas examined in
this report: coronary artery bypass grafts (CABG), percutaneous transluminal coronary angioplasty (PTCA),
bariatric surgery, American Society of Anesthesiologists (ASA) scores of 4 and 5, and severe postoperative
sepsis. Among these clinical areas, CABG and PTCA were both included because the procedures are used
relatively frequently and had a significant number of deaths associated with them. Bariatric surgery was
included due to its increasing frequency of use, both nationally and internationally. Severe postoperative
sepsis and ASA scores of 4 and 5 were both included as these patients are likely to have increased risk of
perioperative death.
In addition to these clinical areas, a summary of key findings for Ma-ori and a brief discussion are presented
for all clinical areas reviewed for this report. Where health systems are not addressing a population’s need
for both surgical access and safety, the POMRs will be higher and there will be fewer procedures per head
of population (Watters et al 2014). Thus, this chapter also presents relevant background information on
Ma-ori hospital admissions.
Further background information on hospital admissions for each clinical area is provided in the companion
document, which will be available on the Commission’s website by July 2015.
10
Mortality following Coronary Artery Bypass
Graft (CABG)
Information from the National Minimum Dataset (NMDS) and the National Mortality
Collection (NMC) were used to review mortality in the first 30 days following a CABG
or as an inpatient.
Key findings
In New Zealand during 2008–2012, following CABG:
• There were 134 deaths and cumulative mortality was 2.47% of admissions.
• The most common causes of death were myocardial infarction, ischaemic heart disease and other
cardiovascular causes.
• Deaths most often occurred within three days of surgery.
• Mortality was higher for acute admissions, older people, Ma-ori, and those with a higher ASA score,
when clinical and socio-demographic factors were accounted for.
• The mortality rate for acute admissions with an ASA score of 5 was very high (33.3%).
Data sources, methods and limitations
Details on the CABG data sources are presented in Appendix 2.
The NMDS and NMC data sets have limitations associated with coding accuracy and data completeness.
For example, some privately funded procedures undertaken at private hospitals are not recorded in the
NMDS. Both data sets are dependent on the quality of clinical records and classification systems.
Information on methods and interpretation notes are presented in Appendix 2.
Mortality following CABG
Mortality following CABG by year
In New Zealand during 2008–2012, there were between 21 and 29 deaths each year following CABG
and the proportion of deaths per 100 admissions varied between 1.86% and 2.75% (Table 2). Cumulative
mortality over the five-year period was 2.47% of admissions.
PERIOPERATIVE MORTALITY REVIEW COMMITTEE: FOURTH REPORT
11
Table 2: Mortality following CABG by Year, New Zealand 2008–2012
YEAR
Deaths
Mortality per 100
Admissions (%)
Admissions
2008
28
1,107
2.53
2009
29
1,075
2.70
2010
21
1,131
1.86
2011
28
1,017
2.75
28
1,106
2.53
134
5,436
2.47
2012
Total
Data source: NMC: Deaths occurring within 30 days of a CABG or as an inpatient as recorded in the NMDS. NMDS: Hospital admissions with a
CABG listed in any of the first 90 procedures.
Mortality following CABG by number of initial procedures
In New Zealand during 2008–2012, 134 deaths occurred within 30 days following CABG (Table 3) or
as an inpatient. Most deaths related to a single procedure; however, in 27% of admissions more than one
type of bypass procedure occurred on the same day. Cumulative mortality related to a single procedure
was 2.61% of admissions compared with 2.08% among those with more than one bypass procedure.
Overall cumulative mortality for all admissions during 2008–2012 was 2.47% of admissions.
Table 3: Mortality following CABG by Number of Initial Procedures, New Zealand 2008–2012
PROCEDURES
Deaths
Admissions
Annual Average
Deaths in
Category (%)
One Initial Procedure
104
3,991
20.8
77.6
Two Initial Procedures
25
1,160
5.0
18.7
5
285
1.0
3.7
134
5,436
26.8
100.0
Three or More
Total
Data source: NMC: Deaths occurring within 30 days of a CABG or as an inpatient, as recorded in the NMDS. NMDS: Hospital admissions with a
CABG listed in any of the first 90 procedures.
Mortality following CABG procedures by type of initial procedure
In New Zealand during 2008–2012, most deaths following CABG (62%) occurred following procedures
that involved grafting the left internal mammary artery (LIMA) (Table 4). Most CABG admissions (66%) used
the LIMA for the bypass procedure.
12
Table 4: Mortality following CABG by Main Type of Initial Procedure, New Zealand 2008–2012
PROCEDURES
Deaths
Admissions
Annual Average
Deaths in
Category (%)
Saphenous Vein Only
18
285
3.6
13.4
LIMA Only
83
3,597
16.6
61.9
RIMA Only
0
16
0.0
0.0
Radial Artery Only
1
34
0.2
0.7
One Other Only
Two Initial Procedures
Three or More
Total
2
59
0.4
1.5
25
1,160
5.0
18.7
5
285
1.0
3.7
134
5,436
26.8
100.0
Data source: NMC: Deaths occurring within 30 days of a CABG or as an inpatient, as recorded in the NMDS. NMDS: Hospital admissions with a
CABG listed in any of the first 90 procedures.
LIMA: left internal mammary artery.
RIMA: right internal mammary artery.
Mortality following CABG by cause of death
In New Zealand during 2008–2012, myocardial infarction was the most common single underlying cause of
death following CABG. Cardiovascular causes were the predominant underlying causes of death (Table 5).
Table 5: Main Underlying Cause of Death following CABG, New Zealand 2008–2012
MAIN UNDERLYING CAUSE OF DEATH FOLLOWING CABG
Annual
Average
Deaths
Deaths in
Category (%)
Myocardial Infarction
35
7.0
26.1
Other Cardiovascular Causes
27
5.4
20.1
Other Ischaemic Heart Disease
37
7.4
27.6
Non-Insulin Dependent Diabetes
3
0.6
2.2
Other
4
0.8
3.0
Not Stated
Total
28
5.6
20.9
134
26.8
100.0
Data source: NMC: Deaths occurring within 30 days of a CABG or as an inpatient, as recorded in the NMDS.
Mortality following CABG by day from procedure
Mortality following acute CABG during 2008–2012 was highest on the first day after surgery (Figure 1),
whilst for elective/waiting list admissions, the highest number of deaths occurred two days after surgery
(Figure 2). Cumulative 30-day mortality was higher for acute admissions (4.16% of admissions) than
elective/waiting list admissions (1.41% of admissions).
PERIOPERATIVE MORTALITY REVIEW COMMITTEE: FOURTH REPORT
13
Figure 1: Mortality following Acute Admission for CABG by Days from Procedure, New Zealand 2008–2012
Total Deaths
16
4500
14
4000
3500
Number of Deaths
12
3000
10
2500
8
2000
6
1500
4
1000
2
0
500
0
1
2
3
4
5
6
7
8
9 10 11 12 13 14 15 16 17 18 19 20 21 22 23 24 25 26 27 28 29 30
Cumulative Mortality per 100,000 Initial Procedures
Cumulative Mortality per 100,000 Initial Procedures
0
Days from Procedure (Acute Admissions)
Numerator: NMC: Deaths occurring within 30 days of an acute CABG, as recorded in the NMDS.
Denominator: NMDS: Acute hospital admissions with a CABG listed in any of the first 90 procedures.
Figure 2: Mortality following Elective/Waiting List Admission for CABG by Days from Procedure,
New Zealand 2008–2012
Total Deaths
Cumulative Mortality per 100,000 Initial Procedures
1600
9
1400
8
1200
Number of Deaths
7
1000
6
5
800
4
600
3
400
2
200
1
0
0
1
2
3
4
5
6
7
8
9 10 11 12 13 14 15 16 17 18 19 20 21 22 23 24 25 26 27 28 29 30
Days from Procedure (Elective/Waiting List Admissions)
Numerator: NMC: Deaths occurring within 30 days of a CABG, as recorded in the NMDS.
Denominator: NMDS: Elective/Waiting list hospital admissions with a CABG listed in any of the first 90 procedures.
14
0
Cumulative Mortality per 100,000 Initial Procedures
10
Mortality following CABG by age and admission type
In New Zealand from 2008 to 2012, mortality in adults following a CABG increased with age, reaching
the highest rates at 80–84 years for acute admissions and 85–89 years for elective/waiting list admissions.
The peak was slightly younger for semi-acute (arranged in public) admissions, at 75–79 years (Figure 3).
Acute admissions had a higher rate of mortality than elective/waiting list admissions in every age group
except 40–44-year-olds, although those numbers were small.
Figure 3: Mortality following CABG by Admission Type and Age, New Zealand 2008–2012
Acute
Arranged in Public
Elective/Waiting List
8,000
Mortality per 100,000 Admissions
7,000
6,000
5,000
4,000
3,000
2,000
1,000
90+
80–84
70–74
60–64
50–54
40–44
30–34
20–24
10–14
0–4
0
Age (Years)
Numerator: NMC: Deaths occurring within 30 days of a CABG or as an inpatient, as recorded in the NMDS.
Denominator: NMDS: Hospital admissions with a CABG listed in any of the first 90 procedures.
Mortality by ASA score
Mortality rates following CABG during 2008–2012 generally increased with increasing ASA score for all
admission types (Figure 4). Higher rates of mortality were observed for those admitted acutely in ASA score
categories 4 to 5. The mortality rate for acute admissions with an ASA score of 5 was notably high (33.3%).
PERIOPERATIVE MORTALITY REVIEW COMMITTEE: FOURTH REPORT
15
Figure 4: Mortality following CABG by Admission Type and ASA Score, New Zealand 2008–2012
Acute
Arranged in Public
Elective/Waiting List
35,000
Mortality per 100,000 Admissions
30,000
25,000
20,000
15,000
10,000
5,000
0
1
2
3
4
5
6
Unassigned
ASA Score
Numerator: NMC: Deaths occurring within 30 days of a CABG or as an inpatient, as recorded in the NMDS.
Denominator: NMDS Hospital admissions with a CABG listed in any of the first 90 procedures.
Mortality by socio-demographic factors and ASA score
Acute admissions
Mortality rates following acute admissions for CABG in New Zealand during 2008–2012 were significantly
higher for those groups aged over 64 years (compared to 45–64 years), females (vs males), Ma-ori
(vs European), and for those with a first ASA score of 4 or more (compared with an ASA score of 1, 2 or 3)
(Table 6). These differences were evident when the model was adjusted for other socio-demographic risk
factors (age, gender, ethnicity and New Zealand Deprivation Index (NZDep) decile) and ASA score.
Elective/Waiting list admissions
During 2008–2012, mortality following elective/waiting list admissions for CABG was significantly higher
for those groups aged 80 years and over (vs. 45–64 years), those with an ASA score of 4 or more (vs. ASA
score of 1, 2 or 3) and for those of Ma-ori ethnicity (vs. European) (Table 7). These results were evident when
other socio-demographic and clinical risk factors (age, gender, ethnicity, NZDep decile and ASA score)
were accounted for.
16
Table 6: Mortality following Acute Admission for CABG by Age, Gender, ASA Score,
Ethnicity and NZDep Decile, New Zealand 2008–2012
Number
Number of
VARIABLE CATEGORY
of
Admissions
Deaths
Age Group
ASA Score
Ethnicity
NZDep
Decile
95% CI
1
Multivariate
OR
95% CI
45–64 years
15
656
2,287
2.3
65–79 years
43
751
5,726
5.7
2.60* (1.46–4.87)
2.56* (1.40–4.92)
7
100
7,000
7.0
3.22* (1.20–7.84)
3.48* (1.24–9.01)
Male
40
1,188
3,367
3.4
Female
25
319
7,837
7.8
1,2,3
12
529
2,268
2.3
4,5,6
39
571
6,830
6.8
3.16* (1.69–6.36)
3.09* (1.63–6.29)
Not stated
14
407
3,440
3.4
1.53 (0.70–3.41)
1.47 (0.66–3.30)
European
80+ years
Gender
Mortality
Mortality
per
per 100 Univariate
100,000 Admissions
OR
Admissions
(%)
1
2.44* (1.44–4.06)
1
1
2.06* (1.20–3.48)
1
47
1,167
4,027
4.0
Ma-ori
9
106
8,491
8.5
2.21 (0.99–4.44)
2.73* (1.15–5.97)
Pacific
4
110
3,636
3.6
0.90 (0.27–2.26)
0.82 (0.24–2.21)
Asian/
MELAA/
Other
5
124
4,032
4.0
1.00 (0.34–2.34)
1.10 (0.37–2.65)
11
255
4,314
4.3
Decile 3–4
5
266
1,880
1.9
0.42 (0.13–1.19)
0.46 (0.14–1.29)
Decile 5–6
18
342
5,263
5.3
1.23 (0.58–2.74)
1.28 (0.59–2.89)
Decile 7–8
17
362
4,696
4.7
1.09 (0.51–2.44)
1.06 (0.48–2.42)
Decile 9–10
14
282
4,965
5.0
1.16 (0.52–2.66)
1.02 (0.43–2.45)
Decile 1–2
1
1
1
1
1
Data source: NMC: Deaths occurring within 30 days of a CABG or as an inpatient as recorded in the NMDS. NMDS: Acute hospital admissions
with a CABG listed in any of the first 90 procedures.
CI: Confidence interval, OR: Odds ratio, *: Significantly different from reference category, MELAA: Middle Eastern/Latin American/African.
PERIOPERATIVE MORTALITY REVIEW COMMITTEE: FOURTH REPORT
17
Table 7: Mortality following Elective/Waiting List Admission for CABG by Age, Gender, ASA Score,
Ethnicity and NZDep Decile, New Zealand 2008–2012
Number
Number of
VARIABLE CATEGORY
of
Admissions
Deaths
Age Group
12
1,033
1,162
1.2
20
1,514
1,321
1.3
1.14 (0.56–2.41)
1.41 (0.67–3.10)
6
201
2,985
3.0
2.62 (0.90–6.83)
3.12* (1.00–8.98)
30
2,236
1,342
1.3
Male
Ethnicity
NZDep
Decile
1
95% CI
65–79 years
Female
ASA Score
Multivariate
OR
95% CI
45–64 years
80+ years
Gender
Mortality
Mortality
per
per 100 Univariate
100,000 Admissions
OR
Admissions
(%)
1
1
1
8
512
1,563
1.6
1,2,3
10
1,257
796
0.8
1.17 (0.50–2.44)
4,5,6
18
628
2,866
2.9
3.68* (1.72–8.33)
2.98* (1.37–6.84)
Not stated
10
863
1,159
1.2
1.46 (0.60–3.58)
1.37 (0.56–3.36)
European
1
0.98 (0.41–2.07)
1
24
2,232
1,075
1.1
Ma-ori
1
1
8
227
3,524
3.5
Pacific
<3
120
833
0.8
Asian/
MELAA/
Other
5
169
2,959
3.0
Decile 1–2
4
442
905
0.9
Decile 3–4
4
492
813
0.8
0.90 (0.21–3.82)
0.83 (0.19–3.57)
Decile 5–6
12
588
2,041
2.0
2.28 (0.79–8.20)
1.93 (0.66–6.99)
Decile 7–8
10
646
1,548
1.5
1.72 (0.57–6.31)
1.42 (0.46–5.27)
Decile 9–10
8
580
1,379
1.4
1.53 (0.48–5.77)
1.10 (0.33–4.30)
3.36* (1.40–7.26)
s
s
2.80 (0.93–6.88)
1
3.74* (1.45–8.88)
s
2.96 (0.96–7.54)
1
Data source: NMC: Deaths occurring within 30 days of a CABG or as an inpatient as recorded in the NMDS. NMDS: Elective/Waiting list hospital
admissions with a CABG listed in any of the first 90 procedures.
CI: Confidence interval, OR: Odds ratio, *: Significantly different from reference category, s: Results suppressed due to small numbers,
MELAA: Middle Eastern/Latin American/African.
18
s
Mortality following Percutaneous Transluminal
Coronary Angioplasty (PTCA)
The following section uses information from the NMDS and the NMC to review
mortality either in the first 30 days following PTCA or as an inpatient.
Key findings
In New Zealand during 2008–2012 following PTCA:
• There were 369 deaths and the cumulative mortality rate was 1.66% of admissions.
• Most deaths were due to myocardial infarction.
• Mortality was higher with acute admissions (2.28% of admissions) and when no stent was
undertaken (5.52% of admissions).
• Mortality increased with increasing age and ASA score, and was higher for Pacific peoples,
when clinical and socio-demographic factors were accounted for.
• Mortality more than 20 days after a procedure was uncommon.
• Cumulative mortality among admissions with an ASA score of 5 was very high (62.5%).
Data sources, methods and limitations
Details on the PTCA data sources are presented in Appendix 2.
The NMDS and NMC data sets have limitations associated with coding accuracy and data completeness.
For example, some privately funded procedures undertaken at private hospitals are not recorded in the
NMDS. Both data sets are dependent on the quality of clinical records and classification systems.
An ASA score was not available for 86% of admissions. For analyses by admission type, semi-acute
(arranged in public) admissions are presented with elective/waiting list admissions as most deaths following
PTCA occurred during acute admissions.
Information on methods and interpretation notes are presented in Appendix 2.
Mortality following PTCA
Mortality following PTCA by year
In New Zealand during 2008–2012, there were between 58 and 86 deaths each year following
PTCA and the proportion of deaths per 100 admissions varied between 1.34% and 1.88% (Table 8).
Cumulative mortality over the five-year period was 1.66% of admissions.
PERIOPERATIVE MORTALITY REVIEW COMMITTEE: FOURTH REPORT
19
Table 8: Mortality following PTCA by Year, New Zealand 2008–2012
YEAR
Deaths
Mortality per 100
Admissions (%)
Admissions
2008
68
4,296
1.58
2009
58
4,331
1.34
2010
74
4,437
1.67
2011
83
4,405
1.88
2012
86
4,742
1.81
369
22,211
1.66
Total
Data source: NMC: Deaths occurring within 30 days of a PTCA or as an inpatient as recorded in the NMDS. NMDS: Hospital admissions with a
PTCA listed in any of the first 90 procedures.
Mortality following PTCA by initial procedure
In New Zealand during 2008–2012, 369 deaths occurred within 30 days following a PTCA (Table 9).
Overall cumulative mortality was 1.66% of admissions. Most deaths and most admissions related to a single
stent inserted into one artery.
Table 9: Mortality following PTCA by Initial Procedure Types, New Zealand 2008–2012
PROCEDURES
Deaths
PTCA 1 Stent into 1 Artery
Admissions
Cumulative
Mortality (%)
Deaths in
Category (%)
180
13,015
1.38
48.8
PTCA > 1 Stent into 1 Artery
76
3,929
1.93
20.6
PTCA > 1 Stent into > 1 Artery
60
4,121
1.46
16.3
PTCA No Stent
48
869
5.52
13.0
5
277
1.81
1.3
369
22,211
1.66
100.0
Multiple Procedures
Total
Data source: NMC: Deaths occurring within 30 days of a PTCA or as an inpatient as recorded in the NMDS. NMDS: Hospital admissions with a
PTCA listed in any of the first 90 procedures.
Mortality following PTCA by cause of death
In New Zealand during 2008–2012, myocardial infarction was the most common underlying cause of death
among admissions for PTCA. Cardiovascular causes were the predominant underlying cause of death (Table 10).
20
Table 10: Main Underlying Cause of Death following PTCA, New Zealand 2008–2012
Deaths
Other Causes
Annual Average
Deaths in Category (%)
16
3.2
4.3
206
41.2
55.8
9
1.8
2.4
Other Ischaemic Heart Disease
32
6.4
8.7
Non-Insulin Dependent Diabetes
11
2.2
3
Neoplasms
3
0.6
0.8
Respiratory
4
0.8
1.1
Not Stated
88
17.6
23.8
369
73.8
100
Myocardial Infarction
Other Cardiovascular Causes
Total
Data source: NMC: Deaths occurring within 30 days of a PTCA or as an inpatient, as recorded in the NMDS.
Mortality following PTCA by day from procedure
Mortality following PTCA for acute admissions in New Zealand during 2008–2012 was highest on the
same day as surgery and the following day (Figure 5). The number of deaths declined over the following
three weeks. Cumulative 30-day mortality for acute admissions was 2.28% of admissions. Deaths related to
arranged in public/elective/waiting list procedures were uncommon (Figure not shown) and mostly occurred
on the same day as the procedure.
Figure 5: Mortality following Acute Admission for PTCA by Days from Procedure, New Zealand 2008–2012
Total Deaths
Cumulative Mortality per 100,000 Initial Procedures
60
2,000
Number of Deaths
50
1,500
40
30
1,000
20
500
10
0
0
1
2
3
4
5
6
7
8
9 10 11 12 13 14 15 16 17 18 19 20 21 22 23 24 25 26 27 28 29 30
Cumulative Mortality per 100,000 Initial Procedures
2,500
70
0
Days from Procedure (Acute Admissions)
Numerator: NMC: Deaths occurring within 30 days of a PTCA, as recorded in the NMDS.
Denominator: NMDS: Acute hospital admissions with a PTCA listed in any of the first 90 procedures.
PERIOPERATIVE MORTALITY REVIEW COMMITTEE: FOURTH REPORT
21
Mortality following PTCA by age and admission type
In New Zealand from 2008 to 2012, mortality following a PTCA increased with age, reaching the
highest rates at 90+ years for acute and arranged in public/elective/waiting list admissions (Figure 6).
Acute admissions had a higher rate of mortality than arranged in public/elective/waiting list admissions
in every age group. Deaths before age 25, regardless of admission type, were rare.
Figure 6: Mortality following PTCA by Admission Type and Age, New Zealand 2008–2012
Acute
Arranged in Public/Elective/Waiting List
12,000
Mortality per 100,000 Admissions
10,000
8,000
6,000
4,000
2,000
90+
80–84
70–74
60–64
50–54
40–44
30–34
20–24
10–14
0–4
0
Age (Years)
Numerator: NMC: Deaths occurring within 30 days of a PTCA or as an inpatient, as recorded in the NMDS.
Denominator: NMDS: Hospital admissions with a PTCA listed in any of the first 90 procedures.
Mortality by ASA score
Mortality rates following PTCA during 2008–2012 in New Zealand increased with increasing ASA score for
acute admission types (Figure 7). Higher rates of mortality were observed for those admitted acutely in ASA
score 4 and 5 categories (62.5% for ASA 5).
22
Figure 7: Mortality following PTCA by Admission Type and ASA Score, New Zealand 2008–2012
Acute
Arranged in Public/Elective/Waiting List
70,000
Mortality per 100,000 Admissions
60,000
50,000
40,000
30,000
20,000
10,000
0
1
2
3
4
5
6
Not Stated
ASA Score
Numerator: NMC: Deaths occurring within 30 days of a PTCA or as an inpatient, as recorded in the NMDS.
Denominator: NMDS: Hospital admissions with a PTCA listed in any of the first 90 procedures.
Mortality by socio-demographic factors and ASA score
Acute admissions
Mortality rates following acute admissions for PTCA in New Zealand during 2008–2012 were significantly
higher for those groups aged over 64 years (compared to 45–64 years), ASA 4, 5 and 6 (compared with
ASA 1, 2 and 3) Pacific (vs European) and among those with NZDep deciles 7–10 (vs deciles 1–2) (Table
11). These differences were evident when the model was adjusted for other socio-demographic risk factors
(age, gender, ethnicity and NZDep decile) and ASA score. An ASA score was not available for 86% of
admissions.
PERIOPERATIVE MORTALITY REVIEW COMMITTEE: FOURTH REPORT
23
Table 11: Mortality following Acute Admission for PTCA by Age, Gender, ASA Score,
Ethnicity and NZDep Decile, New Zealand 2008–2012
Number
Number of
VARIABLE CATEGORY
of
Admissions
Deaths
Mortality
Mortality
per
per 100 Univariate
100,000 Admissions
OR
Admissions
(%)
95% CI
Multivariate
OR
95% CI
PTCA
Acute admissions
Age Group
0–44 years
12
791
1,517
1.50
0.93
45–64 years
102
6,247
1,633
1.60
1
65–79 years
120
5,018
2,391
2.40
1.48*
(1.13–1.93)
1.61*
(1.23–2.12)
64
1,293
4,950
4.90
3.14*
(2.27–4.30)
3.65*
(2.60–5.08)
209
9,754
2,143
2.10
1
89
3,595
2,476
2.50
1.16
(0.90–1.48)
0.96
1,2,3
4
16
25,000
25
1
4,5,6
38
76
50,000
50
3 (0.95–11.49)
Not stated
256
13,257
1,931
1.90
0.06*
European
224
10,660
2,101
2.10
1
Ma-ori
24
918
2,614
2.60
1.25
(0.80–1.88)
1.47
(0.92–2.25)
Pacific
22
613
3,589
3.60
1.73*
(1.08–2.65)
2.08*
(1.26–3.27)
Asian/
MELAA/
Other
28
1,158
2,418
2.40
1.15
(0.76–1.69)
1.34
(0.87–1.97)
Decile 1–2
41
2,471
1,659
1.70
1
Decile 3–4
53
2,415
2,195
2.20
1.33
(0.88–2.02)
1.33
(0.88–2.02)
Decile 5–6
58
2,829
2,050
2.10
1.24
(0.83–1.87)
1.21
(0.81–1.83)
Decile 7–8
74
3,029
2,443
2.40
1.48*
(1.02–2.20)
1.46*
(1.00–2.17)
Decile 9–10
72
2,605
2,764
2.80
1.68*
(1.15–2.50)
1.62*
(1.09–2.44)
80+ years
Gender
Male
Female
ASA Score
Ethnicity
NZDep
Decile
(0.48–1.63)
0.81
(0.42–1.43)
1
1
(0.74–1.24)
1
(0.02–0.21)
4.56*
(3.02–5.96)
1
1
1
Data source: NMC: Deaths occurring within 30 days of a PTCA or as an inpatient, as recorded in the NMDS. NMDS: Acute hospital admissions
with a PTCA listed in any of the first 90 procedures.
CI: Confidence interval, OR: Odds ratio, *: Significantly different from reference category, MELAA: Middle Eastern/Latin American/African.
24
Mortality following Bariatric Surgery
The following section uses information from the NMDS and the NMC to review
mortality either in the first 30 days following bariatric surgery or as an inpatient.
Key findings
In New Zealand during 2008–2012:
• Mortality following bariatric surgery was uncommon; cumulative mortality was 0.07% of admissions.
• Deaths were due to gastrointestinal causes and injury.
• Admission rates were higher for women, those aged 40–54 years and Ma-ori aged 45–54 years.
Data sources, methods and limitations
Details on the bariatric surgery data sources are presented in Appendix 2.
The NMDS and NMC data sets have limitations associated with coding accuracy and data completeness.
For example, some privately funded procedures undertaken at private hospitals are not recorded in the
NMDS. Both data sets are dependent on the quality of clinical records and classification systems.
Information on methods and interpretation notes are presented in Appendix 2.
Mortality following bariatric surgery
Mortality following bariatric surgery
In New Zealand during 2008–2012, there were three deaths within 30 days following 4067 bariatric
admissions. The overall cumulative mortality was 0.07% of admissions.
Mortality following bariatric surgery by type of initial procedure
In New Zealand during 2008–2012, two out of the three deaths following bariatric surgery occurred after
a gastric bypass procedure (Table 12). Gastric reduction was the most common procedure performed on
those admitted for bariatric surgery during 2008–2012. The proportion of admissions where more than
one procedure was undertaken during the operation was small (1%).
PERIOPERATIVE MORTALITY REVIEW COMMITTEE: FOURTH REPORT
25
Table 12: Mortality following Bariatric Surgery by Main Type of Initial Procedure, New Zealand 2008–2012
PROCEDURES
Deaths
Cumulative Mortality %
Admissions
Admissions
Gastric Reduction
(Sleeve Gastrectomy)
1
2,403
0.04
Gastric Bypass
2
1,373
0.15
Reversal of Procedure for Morbid
Obesity
0
89
0
Revision of Gastric Band
0
148
0
Two Initial Procedures
0
54
0
Total
3
4,067
0.07
Data source: NMC: Deaths occurring within 30 days of bariatric surgery or as an inpatient, as recorded in the NMDS. NMDS: Hospital admissions
with bariatric surgery listed in any of the first 90 procedures.
Mortality following bariatric surgery by admission type, cause of death, day from procedure and age
In New Zealand during 2008–2012, injury and gastrointestinal causes were the main underlying cause for
the three deaths related to bariatric surgery. Deaths occurred between 9 and 19 days following surgery and
admission ages were 40–49 years.
26
Mortality in Admissions with an ASA Score of 4 or 5
The following section uses information from the NMDS and the NMC to review
mortality in the first 30 days following any operative procedure that included a general
anaesthetic or neuraxial block on those admitted to hospital with an initial ASA score
of 4 or 5. General anaesthetics or neuraxial blocks for maternity procedures were not
included in the data set reviewed for this chapter.
Additional background information on ASA scores is provided in Appendix 2.
Key findings
In New Zealand during 2008–2012, for those admissions that were given an ASA score of 4 or 5 and who
received a general anaesthetic or neuraxial block during their admission:
• There were 2099 deaths and the cumulative mortality rate was 13.7% of admissions.
• The cumulative mortality for admissions with an ASA score of 5 was 51.95% of admissions, and
mortality was highest among emergency admissions with multiple procedures and an ASA score of 5
(58.62%).
• Cardiovascular diseases and neoplasms were the most common underlying cause of death.
• Mortality was higher among acute admissions, those older than 45 years, those with an ASA score
of 5, and emergency procedures.
• Deaths were most common one day after the anaesthetic procedure.
Data sources, methods and limitations
Appendix 2 describes the data sources for mortality in admissions with an ASA score of 4 or 5 that included
a general anaesthetic or neuraxial block.
It is important to note that, among the elective/waiting list admissions, some were admitted for procedures and
initially assigned an ASA score of 4, but then subsequently became unwell and required another procedure for
which they were assigned an ASA score of 5. Some of the elective/waiting list admissions may have had acute
deterioration after admission, but before their first procedure. Some may have been miscoded.
The NMDS and NMC data sets have limitations associated with coding accuracy and data completeness.
For example, some privately funded procedures undertaken at private hospitals are not recorded in the
NMDS. Both data sets are dependent on the quality of clinical records and classification systems.
Information on methods and interpretation notes are presented in Appendix 2.
Mortality in admissions with an ASA score of 4 or 5
Mortality by year
In New Zealand during 2008–2012, annual mortality was between 395 and 447 deaths and cumulative
mortality was between 12.75% and 14.86% for those admissions that were given an ASA score of 4 or 5,
and who received a general anaesthetic or neuraxial block during their admission (Table 13). The overall
five-year cumulative mortality for 2008–2012 was 13.7% of admissions.
PERIOPERATIVE MORTALITY REVIEW COMMITTEE: FOURTH REPORT
27
Table 13: Thirty-Day Mortality following Admission with an ASA Score of 4 or 5 by Year,
New Zealand 2008–2012
YEAR
Deaths
Cumulative Mortality
per 100 Admissions (%)
Admissions
2008
425
3,244
13.10
2009
404
3,002
13.46
2010
428
2,967
14.43
2011
447
3,008
14.86
395
3,098
12.75
2,099
15,319
13.70
2012
Total
Numerator: NMC: Deaths occurring within 30 days of a general anaesthetic or neuraxial block or as an inpatient in those admitted with an
ASA score of 4 or 5.
Denominator: NMDS: Admissions with an ASA score of 4 or 5 and either a general anaesthetic or a neuraxial block.
Mortality by ASA score, procedure number and emergency status
In New Zealand during 2008–2012, among people given an ASA score of 4 or 5 and who received a
general anaesthetic or neuraxial block during their admission, there was a total of 2099 deaths within
30 days (Table 14). Most deaths (88%) occurred after an emergency procedure. The overall cumulative
mortality for admissions with an ASA score of 4 or 5 was 13.7% of admissions. The cumulative mortality
for admissions with an ASA score of 5 was 51.95% of admissions and among them the rate was highest
for emergency admissions with multiple anaesthetic procedures (58.62%).
Table 14: Mortality following Admission with an ASA Score of 4 or 5 by Score, Procedure Number
and Emergency Status, New Zealand 2008–2012
PROCEDURES
Deaths
Single Emergency ASA 4
Cumulative Mortality
% Admissions
Admissions
1,056
5,533
Single ASA 4
598
Single Emergency ASA 5
233
Single ASA 5
Max ASA=4 in Multiple
Max ASA=5 in Multiple
Total
Deaths in Category
(%)
19.09
50.3
8,343
7.17
28.5
415
56.14
11.1
43
120
35.83
2.0
152
879
17.29
7.2
17
29
58.62
0.8
2,099
15,319
13.70
100.0
Numerator: NMC: Deaths occurring within 30 days of a general anaesthetic or neuraxial block or as an inpatient in those admitted with an ASA
score of 4 or 5.
Denominator: NMDS: Admissions with an ASA score of 4 or 5 and either a general anaesthetic or a neuraxial block.
Mortality by cause of death
In New Zealand during 2008–2012, cardiovascular diseases and neoplasms were the most frequently
“listed causes of death for all admission types who were given an ASA score of 4 or 5, and who received
a general anaesthetic or neuraxial block during their admission (Table 15).
28
Table 15: Main Underlying Cause of Death following Admission with an ASA Score 4 or 5
by Admission Type, New Zealand 2008–2012
MAIN UNDERLYING CAUSE OF DEATH BY ADMISSION TYPE
Acute
Other Causes
Cerebral Infarction
29.5
10.4
9
1.8
0.6
110
22
7.8
283
56.6
19.9
Other Ischaemic Heart Disease
99
19.8
7.0
Non-Insulin Dependent Diabetes
43
8.6
3.0
13
2.6
0.9
197
39.4
13.9
56
11.2
3.9
Other Respiratory Diseases
8
1.6
0.6
Pneumonia
5
1.0
0.4
Dementia/Alzheimer’s/CNS Degeneration
12
2.4
0.8
Diverticular Disease
23
4.6
1.6
121
24.2
8.5
44
8.8
3.1
Emphysema and COPD
Other Gastrointestinal Diseases
Paralytic Ileus/Intestinal Obstruction
Vascular Disorders Intestine
Fall
Other Injuries/External Causes
Cause Not Stated
Subtotal
Other Causes
Myocardial Infarction
Other Cardiovascular Causes
Other Ischaemic Heart Disease
Non-Insulin Dependent Diabetes
35
7.0
2.5
129
25.8
9.1
85
17.0
6.0
356
-
-
1775
355
100.0
16
2.6
18.1
5
1
6.6
19
3.8
25.0
7
1.4
9.7
3
0.6
3.9
18
3.6
23.6
Other Gastrointestinal Diseases
5
1.0
6.5
Other Injuries/External Causes
3
0.6
3.9
Cause Not Stated
17
-
-
Subtotal
93
18.6
100.0
Other Causes
19
3.8
10.1
Myocardial Infarction
12
2.4
6.2
Other Cardiovascular Causes
51
10.2
26.4
Other Ischaemic Heart Disease
24
4.8
12.4
Neoplasms
60
12.0
31.0
Respiratory
12
2.4
6.2
Gastrointestinal Diseases
15
3.0
7.8
Cause Not Stated
38
-
-
231
46.2
100.0
2,099
419.8
100.0
Neoplasms
Subtotal
Total
147
Other Cardiovascular Causes
Neoplasms
Elective/Waiting List
Deaths in
Category (%)
Myocardial Infarction
Chronic Renal Failure
Arranged in Public
Annual
Average
Deaths
Numerator: NMC: Deaths occurring within 30 days of a general anaesthetic or neuraxial block or as an inpatient in those admitted with an ASA score of 4 or 5.
Denominator: NMDS: Admissions with an ASA score of 4 or 5 and either a general anaesthetic or a neuraxial block.
CNS: central nervous system.
PERIOPERATIVE MORTALITY REVIEW COMMITTEE: FOURTH REPORT
COPD: chronic obstructive pulmonary disease.
29
Mortality by day from first anaesthetic
In New Zealand during 2008–2012, over the first 30 days following an initial general anaesthetic or neuraxial
block in those admitted acutely with an ASA score of 4 or 5, mortality was highest on the day after surgery,
although deaths occurred with varying numbers right up until day 30 following the initial anaesthetic (Figure 8).
Cumulative mortality at day 30 reached 18.79% of initial anaesthetics. Among those admitted electively or
from the waiting list, mortality was also highest on day one, although it stayed relatively high over the first
week (Figure 9). Cumulative mortality at day 30 reached 4.52% of initial anaesthetics.
Figure 8: Thirty-Day Mortality following Acute Admissions with an ASA Score of 4 or 5 by Day
from Initial Procedure, New Zealand 2008–2012
Total Deaths
Cumulative Mortality per 100,000 Initial Procedures
20,000
18,000
200
16,000
Number of Deaths
14,000
150
12,000
10,000
100
8,000
6,000
50
4,000
2,000
0
0
1
2
3
4
5
6
7
8
9 10 11 12 13 14 15 16 17 18 19 20 21 22 23 24 25 26 27 28 29 30
0
Days from Initial Procedure (Acute Admissions)
Numerator: NMC: Deaths occurring within 30 days of a general anaesthetic or neuraxial block in those admitted with an ASA score of 4 or 5.
Denominator: NMDS: Acute admissions with an ASA score of 4 or 5 and either a general anaesthetic or a neuraxial block.
30
Cumulative Mortality per 100,000 Initial Procedures
250
Figure 9: Mortality following Elective/Waiting List Admissions with an ASA Score of 4 or 5 by Day
from Initial Procedure, New Zealand 2008–2012
Total Deaths
Cumulative Mortality per 100,000 Initial Procedures
5,000
4,500
20
4,000
Number of Deaths
3,500
15
3,000
2,500
10
2,000
1,500
5
1,000
500
0
0
1
2
3
4
5
6
7
8
9 10 11 12 13 14 15 16 17 18 19 20 21 22 23 24 25 26 27 28 29 30
Cumulative Mortality per 100,000 Initial Procedures
25
0
Days from Initial Procedure (Elective/Waiting List Admissions)
Numerator: NMC: Deaths occurring within 30 days of a general anaesthetic or neuraxial block in those admitted with an ASA score of 4 or 5.
Denominator: NMDS: Elective/Waiting list admissions with an ASA score of 4 or 5 and either a general anaesthetic or a neuraxial block.
Mortality by age and admission type
In New Zealand during 2008–2012, mortality in the first 30 days following an initial general anaesthetic or
neuraxial block with an ASA score of 4 or 5 was relatively high for all acute admissions and the rate generally
increased with age before declining slightly after age 79 years (Figure 10). The mortality rate among those aged
75–79 years was 23.8%. Among elective/waiting list admissions, mortality rates also generally climbed with
age but remained lower in all age groups than acute admissions. Mortality rates were more variable among
publicly arranged (semi-acute) admissions, but they did increase overall, reaching their highest point among
those aged 90+ years.
PERIOPERATIVE MORTALITY REVIEW COMMITTEE: FOURTH REPORT
31
Figure 10: Mortality following Admission with ASA 4 or 5 by Admission Type and Age,
New Zealand 2008–2012
Acute
Arranged in Public
Elective/Waiting List
Mortality per 100,000 Admissions
25,000
20,000
15,000
10,000
5,000
Age (Years)
Numerator: NMC: Deaths occurring within 30 days of a general anaesthetic or neuraxial block or as an inpatient in those admitted with an
ASA score of 4 or 5.
Denominator: NMDS: Admissions with an ASA score of 4 or 5 and either a general anaesthetic or a neuraxial block.
Mortality by ASA score
In New Zealand during 2008–2012, mortality was highest among acute admissions with an ASA score
of 5 (52.8%) (Figure 11).
32
90+
80–84
70–74
60–64
50–54
40–44
30–34
20–24
10–14
0–4
0
Figure 11: Mortality following Admission with ASA 4 or 5 by ASA Score and Admission Type,
New Zealand 2008–2012
Acute
Arranged in Public
Elective/Waiting List
Mortality per 100,000 Admissions
60,000
50,000
40,000
30,000
20,000
10,000
0
1
2
3
4
5
6
ASA Score
Numerator: NMC: Deaths occurring within 30 days of a general anaesthetic or neuraxial block or as an inpatient in those admitted with
an ASA score of 4 or 5.
Denominator: NMDS: Admissions of those with an ASA score of 4 or 5 and either a general anaesthetic or a neuraxial block.
Mortality by socio-demographic and clinical factors
In New Zealand during 2008–2012, mortality in the first 30 days following a general anaesthetic or
neuraxial block in those with a first ASA score of 4 or 5 was significantly higher for both acute and elective/
waiting list admissions among those aged over 65 years (compared to 45–64 years) and those with an ASA
score of 5 (vs ASA 4) (Tables 16, 17). For acute admissions, being aged under 45 years (compared with
ages 45–65 years), female gender (compared with male) and Pacific ethnicity (compared with European)
were protective. These differences were evident when the risk was adjusted for other socio-demographic
factors and clinical factors.
PERIOPERATIVE MORTALITY REVIEW COMMITTEE: FOURTH REPORT
33
Table 16: Mortality following Acute Admission for ASA Score 4 or 5 by Age, Gender, ASA Score,
Ethnicity and NZDep Decile, New Zealand 2008–2012
Number
Number of
VARIABLE CATEGORY
of
Admissions
Deaths
Mortality
Mortality
per
per 100 Univariate
100,000 Admissions
OR
Admissions
(%)
Multivariate
OR
95% CI
95% CI
ASA 4 and 5
Acute Admissions
Age Group
Gender
ASA Score
0–44 years
151
1,158
13,040
13.04
45–64 years
276
1,899
14,534
14.53
65–79 years
545
2,645
20,605
20.60
1.53* (1.30–1.79)
1.52* (1.29–1.80)
80+ years
687
3,126
21,977
21.98
1.66* (1.42–1.93)
1.81* (1.53–2.14)
Male
913
4,699
19,430
19.43
Female
746
4,129
18,067
18.07
0.91 (0.82–1.02)
0.88* (0.79–0.98)
1,412
8,360
16,890
16.89
1
4
5
Ethnicity
NZDep
Decile
0.88 (0.71–1.09)
1
0.78* (0.62–0.97)
1
1
247
468
52,778
52.78
H*
1,287
6,622
19,435
19.44
1
Ma-ori
208
1,131
18,391
18.39
0.93 (0.79–1.10)
1.14 (0.94–1.36)
Pacific
81
640
12,656
12.66
0.60* (0.47–0.76)
0.75* (0.57–0.96)
Asian/
MELAA/
Other
83
435
19,080
19.08
0.98 (0.76–1.24)
1.17 (0.90–1.51)
Decile 1–2
194
1,053
18,424
18.42
Decile 3–4
181
1,094
16,545
16.54
0.88 (0.70–1.10)
0.88 (0.70–1.10)
Decile 5–6
325
1,621
20,049
20.05
1.11 (0.91–1.35)
1.13 (0.93–1.39)
Decile 7–8
389
1,935
20,103
20.10
1.11 (0.92–1.35)
1.12 (0.92–1.37)
Decile 9–10
384
2,003
19,171
19.17
1.05 (0.87–1.27)
1.14 (0.93–1.40)
European
H
1
H*
1
Numerator: NMC: Deaths occurring within 30 days of a general anaesthetic or neuraxial block or as an inpatient in those admitted with a first ASA
score of 4 or 5.
Denominator: NMDS: Acute admissions of those with an ASA score of 4 or 5 and either a general anaesthetic or a neuraxial block.
CI: Confidence interval, OR: Odds ratio with confidence interval,*: Significantly different from reference category, MELAA: Middle Eastern/Latin
American/African, H: Odds ratios suppressed due to high mortality rates.
Caution should be used in interpreting ORs where mortality exceeds 10% (see Appendix 2 for details).
34
H
1
Table 17: Mortality following Elective/Waiting List Admission for ASA Score 4 or 5 by Age, Gender,
ASA Score, Ethnicity and NZDep Decile, New Zealand 2008–2012
Number
Number of
VARIABLE CATEGORY
of
Admissions
Deaths
Mortality
Mortality
per
per 100 Univariate
100,000 Admissions
OR
Admissions
(%)
Multivariate
OR
95% CI
95% CI
ASA 4 and 5
Elective/Waiting List Admissions
Age Group
0–44 years
8
508
1,575
1.57
45–64 years
33
1,142
2,890
2.89
65–79 years
102
1,928
5,290
5.29
1.88* (1.27–2.84)
1.72* (1.14–2.64)
70
1,067
6,560
6.56
2.36* (1.56–3.64)
2.20* (1.42–3.49)
121
2,775
4,360
4.36
1.00
1.00
92
1,870
4,920
4.92
1.13 (0.86–1.50)
1.12 (0.84–1.49)
191
4,596
4,156
4.16
1
80+ years
Gender
Male
Female
ASA Score
4
5
Ethnicity
NZDep
Decile
0.54 (0.23–1.12)
1
0.49 (0.20–1.03)
1
1
22
49
44,898
44.90
H*
179
3,576
5,006
5.01
1
Ma-ori
21
628
3,344
3.34
0.66 (0.40–1.02)
0.9 (0.53–1.47)
Pacific
5
267
1,873
1.87
0.36* (0.13–0.80)
0.52 (0.18–1.21)
Asian/
MELAA/
Other
8
174
4,598
4.60
0.91 (0.41–1.77)
0.86 (0.36–1.77)
Decile 1–2
28
588
4,762
4.76
Decile 3–4
31
711
4,360
4.36
0.91 (0.54–1.55)
0.9 (0.52–1.54)
Decile 5–6
53
934
5,675
5.67
1.2 (0.76–1.95)
1.18 (0.73–1.93)
Decile 7–8
53
1,197
4,428
4.43
0.93 (0.58–1.50)
0.93 (0.58–1.53)
Decile 9–10
48
1,215
3,951
3.95
0.82 (0.51–1.34)
0.95 (0.58–1.58)
European
H
1
H*
H
1
1
Numerator: NMC: Deaths occurring within 30 days of a general anaesthetic or neuraxial block or as an inpatient in those admitted with an ASA
score of 4 or 5.
Denominator: NMDS: Elective/Waiting list admissions with an ASA score of 4 or 5 and either a general anaesthetic or a neuraxial block.
Elective ASA 5: Among the 49 admissions, it should be noted that 26 admissions were admitted electively, had a procedure and were assigned an
ASA score of 4, but then subsequently became unwell and required another procedure, for which they were given an ASA score of 5. Among the
other 23 elective admissions with a first ASA score of 5, some may have had acute deterioration after admission but before their first procedure.
Some may have been miscoded.
CI: Confidence interval, OR: Odds ratio with confidence interval,*: Significantly different from reference category, MELAA: Middle Eastern/Latin
American/African, H: Odds ratios suppressed due to high mortality rates.
PERIOPERATIVE MORTALITY REVIEW COMMITTEE: FOURTH REPORT
35
Mortality Related to Severe Postoperative Sepsis
The following section uses information from the NMDS and the NMC to review hospital
deaths related to severe sepsis within 30 days of one or more general or neuraxial
anaesthetics. Patients with a primary diagnosis of severe sepsis, those with cancer,
immunocompromise, or pregnancy-related admissions, were excluded from analyses.
Key findings
In New Zealand during 2008–2012, among admissions with severe sepsis following general/
neuraxial anaesthesia:
• There were 305 deaths and cumulative mortality was high – 21.69% of admissions.
• Most deaths (80%) occurred among acute admissions where cumulative mortality was 22.85%.
• Mortality increased with increasing age and ASA score.
• Cardiovascular and gastrointestinal causes were the most commonly listed underlying causes of death.
Data sources, methods and limitations
Severe postoperative sepsis admissions included any hospital event with at least one operation and any
secondary diagnosis for severe sepsis or severe infection (eg, septicaemia, infection with shock). The
following exclusions were applied: any admissions with a primary diagnosis of sepsis or infection, any
admission with cancer, those with immunocompromise and those related to pregnancy. Further details on
severe postoperative sepsis data sources are presented in Appendix 2.
The NMDS and NMC data sets have limitations associated with coding accuracy and data completeness.
For example, some privately funded procedures undertaken at private hospitals are not recorded in the
NMDS. Both data sets are dependent on the quality of clinical records and classification systems.
Information on methods and interpretation notes are presented in Appendix 2.
Mortality related to severe sepsis following one or more general/neuraxial anaesthetics
Mortality related to severe sepsis following one or more general/neuraxial anaesthetics by year
In New Zealand during 2008–2012, there were 305 deaths related to severe sepsis within 30 days after
a general or neuraxial anaesthetic (Table 18). The overall mortality rate for the five-year period was 21.69%
of admissions. The annual mortality rate varied between 17.76% and 26.09% of admissions. Exclusions
related to this measure, including the deletion of all cancer-related cases, suggest that both the number of
admissions and the number of deaths may be conservative estimates.
36
Table 18: Mortality Related to Severe Sepsis following One or More General/Neuraxial Anaesthestics
by Year, New Zealand 2008–2012
YEAR
Deaths
Mortality per 100
Admissions (%)
Admissions
2008
38
214
17.76
2009
66
253
26.09
2010
57
312
18.27
2011
78
315
24.76
2012
66
312
21.15
305
1,406
21.69
Total
Data source: NMC: Deaths related to severe sepsis following a general anaesthetic (as recorded in the NMDS).
Mortality related to severe sepsis following one or more general/neuraxial anaesthetics
and hospital type
In New Zealand during 2008–2012, most deaths related to severe sepsis within 30 days after a general
or neuraxial anaesthetic occurred during an acute admission (80%). Cumulative mortality among publicly
arranged (semi-acute) admissions was high at 61.70% of admissions. Cumulative mortality among acute
admissions was higher than that for elective/waiting list admissions – 22.85% compared with 11%.
Mortality related to severe sepsis following one or more general/neuraxial anaesthetics and
cause of death
In New Zealand during 2008–2012, across admission types, cardiovascular and gastrointestinal causes
were the most commonly listed underlying reason for mortality among admissions with severe sepsis
following a general or neuraxial anaesthetic (Table 19).
PERIOPERATIVE MORTALITY REVIEW COMMITTEE: FOURTH REPORT
37
Table 19: Mortality Related to Severe Sepsis following Hospital Admissions with One or More General/
Neuraxial Anaesthetics by Admission Type and Main Underlying Cause of Death, New Zealand 2008–2012
MAIN UNDERLYING CAUSE OF DEATH BY ADMISSION TYPE
Acute
Other Causes
5.6
13.7
8
1.6
3.9
Other Cardiovascular Causes
33
6.6
16.2
Other Ischaemic Heart Disease
14
2.8
6.9
Non-Insulin Dependent Diabetes
4
0.8
2.0
Neoplasms
10
2.0
5.0
Respiratory Diseases
10
2.0
4.9
4
0.8
2.0
Other Gastrointestinal Diseases
39
7.8
19.1
Paralytic Ileus/Intestinal Obstruction
16
3.2
7.8
Vascular Disorders Intestine
11
2.2
5.4
Fall
15
3.0
7.4
Other Injuries/External Causes
12
2.4
5.9
Diverticular Disease
Subtotal
Elective/Waiting List
Total
Deaths in
Category (%)
28
Myocardial Infarction
Arranged in Public
Annual
Average
Deaths
204
40.8
100.0
Other Causes
3
0.6
33.3
Cardiovascular Causes
6
1.2
66.6
Subtotal
9
1.8
100.0
10
2.0
45.3
Cardiovascular Causes
9
1.8
40.9
Gastrointestinal Diseases
3
0.6
13.6
Subtotal
22
4.4
100.0
Missing Cause of Death Information
70
61.0
100.0
Other Causes
305
Data source: NMC: Deaths related to severe sepsis following a general/neuraxial anaesthetic (as recorded in the NMDS).
Mortality related to severe sepsis following one or more general/neuraxial anaesthetics by day
from procedure
Mortality following an acute or elective/waiting list admission associated with severe sepsis after a general
or neuraxial anaesthetic during 2008–2012 was highest on the first day after surgery (Figures 12,13).
The number of deaths was more sporadic over the following three weeks for elective/waiting list admissions.
Cumulative 30-day mortality was higher for acute admissions (22.85% initial anaesthetics) than elective/
waiting list admissions (11% initial anaesthetics).
38
Figure 12: Mortality Related to Severe Sepsis for Acute Admissions with One or More
General/Neuraxial Anaesthetics by Days from Anaesthetic Procedure, New Zealand 2008–2012
Total Deaths
Cumulative Mortality per 100,000 Initial Procedures
25,000
30
20,000
Number of Deaths
25
15,000
20
15
10,000
10
5,000
5
0
0
1
2
3
4
5
6
7
8
9 10 11 12 13 14 15 16 17 18 19 20 21 22 23 24 25 26 27 28 29 30
Cumulative Mortality per 100,000 Initial Procedures
35
0
Days from Initial General Anaesthetic/Neuraxial Procedure (Acute Admissions)
Numerator: NMC: Deaths occurring within 30 days of an anaesthetic for acute admissions with severe sepsis, as recorded in the NMDS.
Denominator: NMDS: Acute hospital admissions with severe sepsis listed in any secondary diagnosis.
Figure 13: Mortality Related to Severe Sepsis for Elective/Waiting List Admissions with One or More
General/Neuraxial Anaesthetics by Days from Anaesthetic Procedure, New Zealand 2008–2012
Total Deaths
12
12,000
10
10,000
8
8,000
6
6,000
4
4,000
2
2,000
0
0
1
2
3
4
5
6
7
8
9 10 11 12 13 14 15 16 17 18 19 20 21 22 23 24 25 26 27 28 29 30
Cumulative Mortality per 100,000 Initial Procedures
Number of Deaths
Cumulative Mortality per 100,000 Initial Procedures
0
Days from Initial General Anaesthetic/Neuraxial Procedure (Elective/Waiting List Admissions)
Numerator: NMC: Deaths occurring within 30 days of an anaesthetic for elective/waiting list admissions with severe sepsis, as recorded
in the NMDS.
Denominator: NMDS: Elective/Waiting list hospital admissions with severe sepsis listed in any secondary diagnosis.
PERIOPERATIVE MORTALITY REVIEW COMMITTEE: FOURTH REPORT
39
Mortality related to severe sepsis following one or more general/neuraxial anaesthetics by age
In New Zealand during 2008–2012, mortality related to severe sepsis following general or neuraxial
anaesthesia increased with increasing age for acute and elective/waiting list admission types, after an initial
small peak for ages 10–14 years (Figure 14). Acute admissions had higher mortality rates among groups
aged 70 years and over compared with those admitted electively or from the waiting list. Mortality rates
among publicly arranged (semi-acute) admissions were variable across the age groups at least, in part,
due to small numbers.
Figure 14: Mortality Related to Severe Sepsis following One or More General/Neuraxial Anaesthetics
by Age and Admission Type, New Zealand 2008–2012
Acute
Arranged in Public
Elective/Waiting List
80,000
Mortality Per 100,000 Admissions
70,000
60,000
50,000
40,000
30,000
20,000
10,000
90+
80–84
70–74
60–64
50–54
40–44
30–34
20–24
10–14
0–4
0
Age (Years)
Numerator: NMC: Deaths related to severe sepsis following a general or neuraxial anaesthetic.
Denominator: NMDS: Hospital admissions with severe sepsis listed in any secondary diagnosis.
Mortality related to severe sepsis following one or more general/neuraxial anaesthetics by ASA
score and admission type
In New Zealand during 2008–2012, mortality related to severe sepsis following general or neuraxial
anaesthesia increased with increasing ASA score for acute and elective/waiting list admissions (Figure 15).
Among semi-acute admissions mortality was lower for ASA 5 compared with ASA 4. Within ASA categories
1–4, and most evident for those admissions with an ASA score of 3 or 4, there was a higher rate of
mortality for those admitted acutely than for those admitted electively or from the waiting list, or semi-acutely.
Among those patients admitted with an ASA score of 5 there were high mortality rates for acute and publicly
arranged (semi-acute) admissions.
40
Figure 15: Mortality Related to Severe Sepsis following One or More General/Neuraxial Anaesthetics
by ASA Score and Admission Type, New Zealand 2008–2012
Acute
Arranged in Public
Elective/Waiting List
80,000
Mortality per 100,000 Admissions
70,000
60,000
50,000
40,000
30,000
20,000
10,000
0
1
2
3
4
5
6
Not Assigned
ASA Score
Numerator: NMC: Deaths related to severe sepsis following a general or neuraxial anaesthetic.
Denominator: NMDS: Hospital admissions with severe sepsis listed in any secondary diagnosis.
Mortality related to elective/waiting list admissions with severe sepsis following one or more general
anaesthetics by socio-demographic factors, number of anaesthetics and ASA score
Acute admissions
During 2008–2012, mortality after an acute hospital admission associated with severe sepsis following one
or more general anaesthetics was significantly higher for those age groups over 65 years (vs. 45–64 years),
and those with a first ASA score of 3 or more (Table 20). The differences for each of these variables were
statistically significant after the other socio-demographic and clinical factors were included in the multivariate
model (age, gender, ethnicity, NZDep decile and ASA score).
Elective/Waiting list admissions
Mortality after an elective/waiting list hospital admission associated with severe sepsis following a general/
neuraxial anaesthetic during 2008–2012 was significantly higher for those groups aged over 80 years
(vs. 45–64 years), and those with a first ASA score of 4 or 5 (vs. ASA score 1 or 2) (Table 21). These differences
were evident when socio-demographic and clinical factors (age, gender, ethnicity, NZDep decile and ASA score)
were adjusted for in the multivariate model.
PERIOPERATIVE MORTALITY REVIEW COMMITTEE: FOURTH REPORT
41
Table 20: Mortality Related to Severe Sepsis Among Acute Admissions with One or More General/
Neuraxial Anaesthetics by Age, Gender, Number of Anaesthetics, ASA Score,
Ethnicity and NZDep Decile, New Zealand 2008–2012
Number
Number of
VARIABLE CATEGORY
of
Admissions
Deaths
Age Group
ASA Score
Gender
NZDep
Decile
Multivariate
OR
95% CI
(0.31–0.94)
0.71
95% CI
0–44 years
22
254
8,661
8.7
0.55*
45–64 years
40
271
14,760
15
1
65–79 years
78
292
26,712
27
H*
H
H*
H
80+ years
94
212
44,340
44
H*
H
H*
H
1,2
11
174
6,322
6.3
1
3
59
337
17,507
18
3.14*
(1.67–6.47)
2.21*
(1.14–4.65)
112
274
40,876
41
H*
H
H*
H
Not Stated
52
244
21,311
21
H
H
H
H
European
1
4, 5
Ethnicity
Mortality
Mortality
per
per 100 Univariate
100,000 Admissions
OR
Admissions
(%)
(0.40–1.26)
1
1
187
738
25,339
25
Ma-ori
1
29
156
18,590
19
0.67
(0.43–1.03)
1.04
(0.62–1.74)
Pacific
9
80
11,250
11
0.37*
(0.17–0.72)
0.73
(0.32–1.55)
Asian/
MELAA/
Other
9
55
16,364
16
0.58
(0.26–1.15)
0.84
(0.35–1.82)
Male
131
588
22,279
22
1
Female
1
103
441
23,356
23
1.06
Decile 1–2
32
135
23,704
24
1
(0.79–1.43)
1.02
(0.73–1.42)
Decile 3–4
32
169
18,935
19
0.75
(0.43–1.31)
0.79
(0.43–1.44)
Decile 5–6
55
199
27,638
28
1.23
(0.75–2.05)
1.28
(0.73–2.24)
Decile 7–8
52
233
22,318
22
0.92
(0.56–1.54)
0.96
(0.56–1.68)
Decile 9–10
63
293
21,502
22
0.88
(0.55–1.44)
1.29
(0.74–2.26)
1
Numerator: NMC: Deaths among acute admissions with severe sepsis following a general/neuraxial anaesthetic.
Denominator: NMDS: Acute hospital admissions with severe sepsis following one or more general anaesthetics listed in any of the first
90 procedures.
ASA score is first listed ASA score per admission.
CI: Confidence interval, *: Significantly different from reference category, MELAA: Middle Eastern/Latin American/African, OR: Odds ratio,
H: Odds ratios suppressed due to high mortality rates. Caution should be used in interpreting ORs where mortality exceeds 10% (see Appendix 2
for details).
42
Table 21: Mortality Related to Severe Sepsis Among Elective/Waiting List Admissions with One or More
General/Neuraxial Anaesthetics by Age, Gender, Number of Anaesthetics, ASA Score,
Ethnicity and NZDep Decile, New Zealand 2008–2012
Number
Number of
VARIABLE CATEGORY
of
Admissions
Deaths
Age Group
0–44 years
<3
58
3,448
3.4
s
45–64 years
6
96
6,250
6.3
1
65–79 years
14
98
14,286
14
9
33
27,273
27
H*
<3
74
1,351
1.4
1
80+ years
ASA Score
1,2
NZDep
Decile
s
s
95% CI
s
1
2.50 (0.96–7.33)
H
1.63 (0.54–5.35)
H*
H
1
8
109
7,339
7.3
5.78
15
57
26,316
26
H*
H
H*
H
Not Stated
7
45
15,556
16
13.45*
(2.28–
256.14)
12.72*
(2.03–
248.37)
European
27
217
12,442
12
1
Ma-ori
<3
35
2,857
2.9
s
s
s
s
Pacific
<3
20
10,000
10
s
s
s
s
Asian/
MELAA/
Other
<3
13
7,692
7.7
s
s
s
s
Male
18
174
10,345
10
1
Female
4,5
Gender
Multivariate
OR
95% CI
(1.03–
108.44)
3
Ethnicity
Mortality
Mortality
per
per 100 Univariate
100,000 Admissions
OR
Admissions
(%)
4.36
(0.74–
83.19)
1
1.15 (0.53–2.44)
1
13
111
11,712
12
Decile 1–2
4
32
12,500
13
Decile 3–4
4
46
8,696
8.7
0.67 (0.15–3.03)
0.77 (0.14–4.16)
Decile 5–6
7
62
11,290
11
0.89 (0.25–3.64)
1.06 (0.25–5.10)
Decile 7–8
9
63
14,286
14
1.17 (0.35–4.61)
1.81 (0.45–8.55)
Decile 9–10
7
82
8,537
8.5
0.65 (0.18–2.65)
0.84 (0.19–4.14)
1
1.18 (0.50–2.74)
1
Numerator: NMC: Deaths among elective/waiting list admissions with severe sepsis following a general/neuraxial anaesthetic.
Denominator: NMDS: Elective/Waiting list hospital admissions with one or more general anaesthetics listed in any of the first 90 procedures.
ASA score is first listed ASA score per admission.
CI: Confidence interval, *: Significantly different from reference category, MELAA: Middle Eastern/Latin American/African, OR: Odds ratio,
s: Suppressed due to small numbers. H: Odds ratios suppressed due to high mortality rates. Caution should be used in interpreting ORs where
mortality exceeds 10% (see Appendix 2 for details).
PERIOPERATIVE MORTALITY REVIEW COMMITTEE: FOURTH REPORT
43
Ma-ori Perioperative Mortality
The following section summarises and discusses key findings for Ma-ori perioperative
mortality revealed in analyses for this report, with a focus on the CABG results.
Mortality rates during 2008–2012 are presented alongside hospital admissions for
all clinical areas reviewed in this report where results were statistically significant for
Ma-ori. The findings for CABG procedures are discussed with reference to literature,
focusing on the implications for Ma-ori access to care.
Data sources and methods are described in the relevant report chapters on each clinical area and in Appendix
2. Further background data on hospital admissions for the clinical areas, including mortality data for previously
reported clinical areas, are available in the companion document, which will be available on the Health
Quality & Safety Commission’s website by July 2015.
Key findings
In New Zealand during 2008–2012, for individual operative procedures, the numbers of deaths among
Ma-ori were low; however, the following key findings were noted.
•Ma-ori perioperative mortality was 8491 per 100,000 (8.5%) following acute CABG and 3524 per
100,000 (3.5%) following CABG delivered through elective/waiting list admissions. These rates
were significantly higher for Ma-ori compared with Europeans after adjusting for socio-demographic
variables (age, gender and NZDep decile) and ASA score (Tables 6, 7).
• Compared with other ethnic groups, Ma-ori had fewer admissions for acute CABG (Figure 16).
•Ma-ori: European differences in perioperative mortality were not evident for PTCA (Table 11).
However, PTCA admission rates for Ma-ori adults aged 60–80 years peaked at a lower rate
compared with European and Asian/MELAA/Other adults of the same ages.1
• Mortality following cholecystectomy delivered through elective/waiting list admission routes was
significantly higher for Ma-ori (0.24%) compared with Europeans (0.14%) after adjusting for sociodemographic variables and ASA score. There was no significant difference in mortality for these
populations following acute cholecystectomy.2
• Acute admissions for cholecystectomy were higher for Ma-ori and Pacific peoples aged 10–54 years
than for those of European ethnicity between the same ages.3
• Same or next day mortality following elective/waiting list admissions with a general anaesthetic
was significantly higher for Ma-ori (0.03%) compared with Europeans (0.02%) after adjusting for
socio-demographic variables and ASA score.4
• Acute admission rates, where one or more general anaesthetics were administered, were higher
for Ma-ori and Pacific peoples than for Europeans up until 75 years of age. Elective/Waiting list
admission rates with general anaesthesia were higher for Europeans for every age group.5
• Across all other clinical areas included in this report, Ma-ori POMRs were similar to European rates.
This is consistent with findings from previous POMRC reports.
• Multivariate analyses show the influences of age, health status (ASA status) and admission status
(acute versus elective/waiting list) appear to have a greater effect on perioperative mortality
outcomes than Ma-ori ethnicity.
1
2
3
4
5
44
Refer to Figure 8 of the companion document.
Refer to Tables 11 and 12 in the companion document.
Refer to Figure 27 of the companion document.
Refer to Table 17 in the companion document.
Refer to Figure 32 of the companion document.
Recommendations to improve outcomes for Ma-ori:
1. The POMRC recommends that:
A targeted evaluation of the mortality rate of Ma-ori patients undergoing CABG should be undertaken.
2. The Ma-ori Caucus recommends that:
Further research be undertaken to identify ways to improve Ma-ori access to cardiac treatments, including
screening, early detection and addressing barriers to service uptake.
Ma-ori perioperative mortality following CABG
Hospital admissions and mortality following CABG
Figure 16 shows the hospital admissions for CABG by age, admission type and ethnicity in New Zealand
during 2008–2012. For Ma-ori, admission rates for CABG increased from ages 40–44 years and peaked
at ages 65–70 years. Acute admissions for Ma-ori were lower compared to Pacific peoples and Asian
populations and similar to European admission rates for younger age groups. Some of the lower Ma-ori
CABG admissions in older age groups will be due to the younger age structure of the Ma-ori population.
Figure 16: Hospital Admissions for CABG by Age, Admission Type and Ethnicity, New Zealand 2008–2012
Ma-ori
Pacific
Asian/MELAA/Other
European
120
Admissions per 100,000 Population
100
80
60
40
20
Acute
90+
80–84
70–74
60–64
50–54
40–44
30–34
20–24
10–14
0–4
90+
80–84
70–74
60–64
50–54
40–44
30–34
20–24
10–14
0–4
0
Elective/Waiting List
Age (Years)
Numerator: NMDS: Hospital admissions with one or more CABG listed in any of the first 90 procedures.
Denominator: Statistics New Zealand: Estimated Resident Population (projected from 2008) procedures.
MELAA: Middle Eastern/Latin American/African.
PERIOPERATIVE MORTALITY REVIEW COMMITTEE: FOURTH REPORT
45
Tables 6 and 7 show that, after adjusting for socio-demographic and clinical factors, Ma-ori mortality
following CABG procedures remains significantly higher than in Europeans. For Ma-ori, as for other ethnic
groups, mortality was higher following acute admissions for CABG procedures (8.5%). A higher adjusted
30-day mortality rate following CABG for Ma-ori compared with Europeans has also been observed in one
cohort study in Auckland City Hospital (Wang et al 2013).
There are multiple possible explanations that, together, may account for the higher POMRs observed for
Ma-ori following CABG. Firstly, Ma-ori tend to have a high prevalence of comorbidities, such as diabetes
and hypertension, and have increased exposure to risk behaviours, such as smoking – all of which increase
the risk of developing postoperative complications (Curtis et al 2007; Curtis et al 2010; White et al 2013).
It should be noted that the Ma-ori mortality disparity following CABG persists after controlling for some
comorbidities, suggesting there are additional factors explaining the higher post-CABG mortality rate among
Ma-ori (Wang et al 2013).
Secondly, and related to the high prevalence of cardiovascular risk factors, the type of vascular disease
among Ma-ori may differ from other ethnic groups. Cohort studies from New Zealand lend some support for
this, with Ma-ori CABG patients having a higher prevalence of diabetes (Kerr et al 2014; Wang et al 2013).
Coronary artery disease in diabetics is generally more diffuse and involves smaller vessels, rendering it more
difficult to treat with revascularisation procedures.6 Diffuse multi-vessel patterns of disease also require more
complex operations, as evidenced by longer surgical cross-clamp and bypass times in Ma-ori CABG patients
(see Wang et al 2013).
Thirdly, Ma-ori could be presenting for revascularisation at later stages of disease and, therefore, present with
more severe disease pathology that is not amenable to CABG intervention. This hypothesis is supported by
a recent retrospective cohort study of patients who underwent a CABG at Auckland City Hospital from July
2010 to June 2012. Results showed Ma-ori had a higher prevalence of many clinical indicators for severe
heart disease (eg, lower ejection fraction and higher rates of congestive heart failure) suggesting delayed
presentation for surgical treatment (Wang et al 2013; Wang et al 2014).
Recommendation:
For these reasons, the POMRC has recommended that targeted research evaluating the main underlying
causes of higher Ma-ori mortality following CABG should be undertaken.
Ma-ori access to health care for ischaemic heart disease
Given the higher prevalence and mortality from ischaemic heart disease among Ma-ori compared with nonMa-ori (Ministry of Health 2014; Ministry of Health 2010b), we would expect Ma-ori hospitalisation rates for
both CABG and PTCA procedures to be higher among Ma-ori compared with other ethnic groups. However,
the higher 30-day mortality rate following CABG observed in this report, together with the lower than
expected hospitalisations for CABG, suggest an unmet need for Ma-ori accessing CABG revascularisation
treatment in New Zealand. As noted by Curtis et al (2010), the inverse care law is evident in New Zealand,
whereby those who need services the most are the least likely to receive them.
Some of the lower than expected CABG hospitalisations could be due to Ma-ori having a pattern of vessel disease
that is not amenable to CABG intervention, or the presence of severe comorbidities that make them inoperable.
In a recent study, a cohort of patients presenting with ST elevation myocardial infarction (STEMI) who received
6
46
Coronary artery disease associated with diabetes is generally more amenable to percutaneous coronary intervention than bypass grafting.
This is consistent with the analyses from this report where acute PTCA admissions and perioperative mortality for Pacific peoples were high compared to other ethnic groups. The prevalence of diabetes in Pacific peoples is high compared to other population groups in New Zealand (Ministry of Health 2014).
an angiogram were analysed and actual referrals made for CABG and percutaneous coronary intervention
(PCI) were compared with blinded angiogram reviews of the same cohort (ie, cardiologists reassessed the
angiograms without knowing any patient details other than age and sex). Blinded assessments revealed that
Ma-ori STEMI patients were more likely to be undertreated for CABG compared with Europeans; however, review
of the undertreated patient’s clinical notes revealed the patients were not referred for CABG treatment due to the
presence of severe comorbidities (Sandiford et al, in press).
For Ma-ori, the findings of this report point to a multitude of factors which collectively influence their ability
to access care. In addition to access issues associated with lower socio-economic status, Ma-ori experience
a number of barriers to accessing health care in New Zealand. Some of these barriers are complex, with
roots in the history of colonisation, and the relationships between Ma-ori and others that were gradually
cultivated over successive generations. These include Ma-ori–non-Ma-ori patient–clinician trust issues, previous
experiences of racism and wider structural aspects of society that impact access equity for Ma-ori (EllisonLoschmann and Pearce 2006; Harris et al 2012; Reid and Robson 2007; Robson et al 2011).
Geographical barriers also affect the Ma-ori population as a larger proportion of Ma-ori live in isolated rural
locations (Ministry of Health 2012a). Living in rural communities can result in some delays accessing cardiac
angiography and invasive revascularisation procedures, particularly where patients are admitted to hospitals
without cardiac intervention facilities (Ellis et al 2004; Ellis et al 2010).
Another barrier to accessing care is poor ‘health literacy’. Health literacy is a broad term referring to
one’s ability to obtain and understand basic health information and services needed to make appropriate
health decisions. It is seen as an essential life skill that helps one navigate through health and health care
(Kickbusch et al 2005; Nutbeam 2000). On average, New Zealanders have poor health literacy; however,
for Ma-ori living in both urban and rural locations, health literacy scores are significantly lower than for nonMa-ori (Ministry of Health 2010a).
Those who are less health literate have less knowledge of their illness, treatment and medicines, and are
more likely to visit physicians in later stages of disease; more likely to use emergency and hospital services;
less likely to adhere to medication regimes; and less likely to use preventive screening services (Kickbusch
2008). To adequately address these issues, it is important that interventions aimed at improving health
literacy are developed in partnership with Ma-ori and their wha-nau, and that resources are produced in
accessible and culturally relevant and appropriate formats (Comrie et al 2010; Ministry of Health 2012b).
The CABG and PTCA analyses from this report, and also the higher rates of Ma-ori acute surgical admissions
where one or more general anaesthetics were administered, highlight the differential admission rates for
Ma-ori and non-Ma-ori. These findings point to wider issues than preventable mortality, but are nevertheless
significant. Further investigation is needed to identify the key barriers to accessing care where the most
significant gains can be achieved for Ma-ori. Such knowledge could be used to drive interventions and
assist with improving the timely access to surgical treatment for ischemic heart disease among Ma-ori.
Recommendation:
For these reasons, the Ma-ori Caucus has recommended that further research be undertaken to identify ways
to improve Ma-ori access to cardiac treatments, including screening, early detection and addressing barriers
to service uptake.
PERIOPERATIVE MORTALITY REVIEW COMMITTEE: FOURTH REPORT
47
Perioperative Mortality for Previously Reported
Clinical Areas
The following series of chapters present the key findings from clinical areas included
in previous POMRC reports, extending analyses for the 2008–2012 time period.
This is part of the POMRC’s approach to tracking perioperative mortality over time.
These clinical areas include:
1.Cholecystectomy
2. General anaesthesia
3. Hip arthroplasty
4. Knee arthroplasty
5. Mortality in elective admissions with an ASA score of 1 or 2
6. Pulmonary embolus-associated and attributed mortality.
Among these clinical areas, cholecystectomy is of continuing interest as it is a common procedure undertaken
at a wide range of hospitals and is associated with a relatively high number of deaths. Deaths occurring on
the same and following days of general anaesthesia are included as a general indicator of perioperative care
close to the time of anaesthesia and surgery. Both hip and knee arthroplasty, presented in the POMRC’s second
report, are included again as the use of these procedures is increasing with the ageing population. Mortality
in elective admissions with an ASA score of 1 or 2 continues to be of interest as these patients have a low risk
of death and postoperative complications. Analyses for pulmonary embolus-associated and attributed mortality
are re-visited, in keeping with the Health Quality & Safety Commission’s programme on reducing perioperative
harm and also the associated use of the WHO surgical safety checklist.
Further information on mortality for each clinical area, and background information on hospital admissions,
is available from the companion document which will be available on the Commission’s website by July 2015.
48
Mortality following Cholecystectomy
The following section uses information from the NMDS and the NMC to review
mortality in the first 30 days following cholecystectomy. Consistent with the 2014
report, those procedures in which a cholecystectomy was conducted as a minor
component of a more extensive operation have been removed from these analyses
(approximately 420 cases).
Key findings
In New Zealand from 2008–2012 following cholecystectomy:
• There were 113 deaths; the overall cumulative mortality was 0.37% of admissions.
• Mortality was higher when an open procedure was undertaken (4.23% of admissions) or when a
laparoscopic procedure was converted to an open procedure (1.09% of admissions).
• Cumulative mortality rates were higher among acute admissions (0.82% of admissions) than elective/
waiting list admissions (0.18% of admissions).
• Gastrointestinal diseases and malignant neoplasms were the main underlying causes of death.
• Mortality rates increased with increasing age and higher ASA scores.
• Findings were generally consistent with the 2006–2010 and 2007–2011 periods.
Mortality following cholecystectomy
Mortality following cholecystectomy per year
In New Zealand during 2008–2012, the annual number of deaths following a cholecystectomy procedure
varied between 14 and 28 deaths and annual mortality was 0.23%–0.44% of admissions (Table 22).
The cumulative mortality for any cholecystectomy procedure during 2008–2012 was 0.37% of admissions.
Table 22: Mortality following Cholecystectomy by Year, New Zealand 2008–2012
Deaths
Mortality per 100
Admissions (%)
Admissions
2008
24
5,778
0.42
2009
27
6,217
0.43
2010
14
6,074
0.23
2011
28
6,406
0.44
2012
20
6,426
0.31
113
30,901
0.37
Total
Numerator: NMC: Deaths occurring within 30 days of a cholecystectomy, as recorded in the NMDS.
Denominator: NMDS: Admissions with a cholecystectomy listed in any of the first 90 procedures.
PERIOPERATIVE MORTALITY REVIEW COMMITTEE: FOURTH REPORT
49
Mortality following General Anaesthesia
The following section uses information from the NMDS and the NMC to review hospital
admissions where one or more general anaesthetics were performed, as well as same
and next day mortality following a general anaesthetic.
Key findings
In New Zealand during 2008–2012, following general anaesthesia on the same or next day:
• There were 1436 deaths (0.12% of admissions); most of these deaths occurred among acute
admissions and at public hospitals.
• Mortality was between 0.11% and 0.13% of admissions each year.
• Cardiovascular causes were the most commonly listed underlying reason for mortality.
• Mortality was higher among those admissions that were acute or emergency, those with more
than one anaesthetic and those with increasing age and ASA score regardless of other clinical
or demographic factors. Mortality was lower among those admissions aged under 45 years.
• These findings were consistent with those observed in 2007–2011.
• An ASA score was included with 64.8% of admissions, compared with 63.4% in 2007–2011.
Same or next day mortality following one or more general anaesthetics
Mortality following one or more general anaesthetics and year
In New Zealand during 2008–2012, there were 1436 deaths on the same or next day. The overall mortality
rate for the five-year period was 0.12% of admissions. The annual rate varied between 0.11% and 0.13%
of admissions (Table 23).
Table 23: Same or Next Day Mortality following Hospital Admissions with One or More General Anaesthetics
by Year, New Zealand 2008–2012
YEAR
Deaths
Admissions
Mortality per 100
Admissions (%)
2008
290
228,550
0.13
2009
311
234,496
0.13
2010
261
235,519
0.11
2011
299
241,108
0.12
2012
275
241,997
0.11
1,436
1,181,670
0.12
Total
Data source: NMC: Same day (day 0) or next day (day 1) deaths following a general anaesthetic (as recorded in the NMDS).
50
Mortality following Hip Arthroplasty
Information from the NMDS and the NMC were used to review mortality in the first
30 days following a hip arthroplasty.
Key findings
In New Zealand during 2008–2012, following hip arthroplasty:
• There were 645 deaths and five-year cumulative mortality was 1.58% of admissions.
• Most deaths (568) occurred among acute admissions.
• When clinical and demographic factors were considered, rates were significantly higher among older
age groups and those with poorer health (higher ASA score) among both elective/waiting list and
acute admissions.
• Deaths occurred most frequently on the same day as an acute hip athroplasty and either two or six
days following an elective/waiting list operation.
• Cumulative 30-day mortality was higher for acute admissions (7.10% of initial procedures) than
elective/waiting list admissions (0.17% of initial procedures).
• The most common cause of death was falls for acute admissions and cardiovascular causes for
elective/waiting list admissions.
• Findings were generally consistent with a previous report and data from 2005–2009.
Mortality following hip arthroplasty
Mortality following hip arthroplasty by year
In New Zealand during 2008–2012, mortality rates following hip arthroplasty varied between 1.42%
and 1.73% of admissions (Table 24).
Table 24: Mortality following Hip Arthroplasty by Year, New Zealand 2008–2012
YEAR
Deaths
Mortality per 100
Admissions (%)
Admissions
2008
130
7,952
1.63
2009
123
8,093
1.52
2010
142
8,231
1.73
2011
131
8,120
1.61
2012
119
8,387
1.42
Total Acute
568
8,106
7.00
55
32,208
0.17
645
40,783
1.58
Total Elective/Waiting List
Total*
Numerator: NMC: Deaths occurring within 30 days of a hip arthroplasty, as recorded in the NMDS.
Denominator: NMDS: Hospital discharges with a hip arthroplasty listed in any of the first 90 procedures.
* Total Acute and Total Elective/Waiting List are not equal to the Total as a small number of arranged in public (semi-acute) cases also occurred.
PERIOPERATIVE MORTALITY REVIEW COMMITTEE: FOURTH REPORT
51
Mortality following Knee Arthroplasty
Information from the NMDS and the NMC were used to review mortality in the first
30 days following knee arthroplasty.
Key findings
In New Zealand during 2008–2012, following knee arthroplasty:
• Mortality was low; there were 46 deaths and the cumulative mortality rate was 0.17% of admissions.
• When clinical and socio-demographic factors were considered, mortality rates increased with
increasing age and ASA score. Most of the mortality observed represents elective/waiting list
procedures, which comprised 98.5% of all knee arthroplasty admissions.
• Cardiovascular causes were the main cause of death.
• The findings are consistent with a previous report and data from 2005–2009.
Mortality following knee arthroplasty
Mortality following knee arthroplasty by year
In New Zealand during 2008–2012, there was a small and variable number of deaths each year.
Annual mortality rates following knee arthroplasty varied between 0.07% and 0.22% of admissions
(Table 25). The overall cumulative mortality was 0.17% of admissions.
Table 25: Mortality following Knee Arthroplasty by Year, New Zealand 2008–2012
YEAR
Deaths
Mortality per 100
Admissions (%)
Admissions
2008
8
5,298
0.15
2009
10
5,474
0.18
2010
12
5,405
0.22
2011
12
5,617
0.21
4
5,920
0.07
46
27,714
0.17
2012
Total
Numerator: NMC: Deaths occurring within 30 days of a knee arthroplasty as recorded in the NMDS.
Denominator: NMDS: Hospital discharges with a knee arthroplasty listed in any of the first 90 procedures.
52
Mortality in Elective Admissions with an ASA Score
of 1 or 2
The following section uses information from the NMDS and the NMC to review
mortality in the first 30 days following a general anaesthetic or a neuraxial block in
those admitted electively or from the waiting list with a first ASA score of 1 or 2.
Key findings
In New Zealand during 2008–2012, for those admissions that were given an initial ASA score of 1 or 2,
were admitted electively or from the waiting list, and who received a general anaesthetic or neuraxial block
during their admission:
• There were between 35 and 60 deaths per annum and the cumulative mortality rate was 0.05%.
•
Mortality was highest on the second day after the initial general anaesthetic or neuraxial block, although
deaths occurred right up to the cut-off point for this analysis (day 30 after the initial anaesthetic).
• Malignant/other neoplasms were the most frequently listed cause of death for those over 25 years
of age.
• Mortality was significantly higher for males, those over 25 years of age, those receiving two or
more anaesthetics during their admission, those given an ASA score of 3 or 4 for the last of their
subsequent anaesthetics, and those undergoing subsequent emergency procedures, when clinical
and socio-demographic factors were considered.
• Cumulative mortality has slightly reduced from previous years (down from 0.07% during 2006–2010).
Mortality in elective admissions with an ASA score of 1 or 2
Mortality in elective admissions with an ASA score of 1 or 2 by year
In New Zealand during 2008–2012, annual mortality was between 35 and 60 deaths and between 0.04%
and 0.07% of admissions for those admissions that were given an initial ASA score of 1 or 2, were admitted
electively or from the waiting list, and who received a general anaesthetic or neuraxial block during their
admission (Table 26). Cumulative mortality over the five-year period was 0.05% of admissions.
Table 26: Thirty-Day Mortality following Elective Admissions with a First ASA Score of 1 or 2 by Year,
New Zealand 2008–2012
YEAR
Deaths
Mortality per 100
Admissions (%)
Admissions
2008
37
73,610
0.05
2009
60
80,977
0.07
2010
45
83,377
0.05
2011
48
86,519
0.06
2012
35
88,583
0.04
225
413,066
0.05
Total
Numerator: NMC: Deaths occurring within 30 days of a general anaesthetic or neuraxial block in those admitted electively or from the waiting list
with a first ASA score of 1 or 2.
Denominator: NMDS: Elective/Waiting list admissions of those with a first ASA score of 1 or 2 and either a general anaesthetic or a neuraxial block.
PERIOPERATIVE MORTALITY REVIEW COMMITTEE: FOURTH REPORT
53
Pulmonary Embolus-Associated and Attributed
Mortality
This chapter uses information from the NMDS and the NMC to review hospital
admissions in those receiving a general anaesthetic or neuraxial block that were
associated with a pulmonary embolus, as well as mortality in the first 30 days following
anaesthetic that was either associated with, or attributed to, a pulmonary embolus.
Key findings
In New Zealand during 2008–2012, in relation to hospital admissions in which death occurred within the
first 30 days following a general anaesthetic or neuraxial block, the following were key findings.
For pulmonary embolus-associated admissions:
• There were 307 deaths and the cumulative mortality was 0.024% of initial anaesthetics.
• Mortality for acute admissions was most common on the same or next day following anaesthesia and
remained increased over the entire 30-day period, while for elective/waiting list admissions it was
more common over the first week after the anaesthetic.
For pulmonary embolus-attributed admissions:
• There were 199 deaths and the overall cumulative mortality for the 30-day period was 0.016% of
initial anaesthetics.
In relation to both pulmonary embolus-associated mortality and attributed mortality:
• Malignant/other neoplasms was the most frequently listed main underlying cause of death regardless
of the admission type.
•
Mortality rose with age, was higher for acute admissions and was more common in those admissions
that had an ASA score of 4. In general, there was a stepwise increase in mortality with rising ASA score.
• In comparison with the 2007–2011 period, cumulative mortality rates were higher in the 2008–2012
period for both pulmonary embolus-associated and attributed admissions.
54
Pulmonary embolus-associated and attributed mortality
Pulmonary embolus-associated and attributed mortality by admission type and hospital type
In New Zealand during 2008–2012, there were 307 admissions with pulmonary embolus-associated
mortality. Most (68%) involved an acute hospital admission to a public hospital. Among the 76 deaths
related to an elective/waiting list admission, 12 involved an admission to a private hospital.
Pulmonary embolus-associated mortality by year
In New Zealand during 2008–2012, there were between 44 and 80 pulmonary embolus-associated deaths
per annum (Table 27). Annual cumulative mortality rates varied between 0.017% and 0.031% and the
overall cumulative mortality rate was 0.024% of admissions.
Table 27: Pulmonary Embolus-Associated Mortality by Year, New Zealand 2008–2012
YEAR
Deaths
Admissions
Mortality per 100
Admissions (%)
2008
50
247,991
0.02
2009
44
254,740
0.02
2010
73
256,277
0.03
2011
80
261,797
0.03
2012
60
263,281
0.02
307
1,284,086
0.02
Total
Numerator: NMC: Pulmonary embolus-associated deaths within 30 days of first anaesthetic of an acute index admission.
Denominator: NMDS: All acute admissions with a general anaesthetic or neuraxial block.
PERIOPERATIVE MORTALITY REVIEW COMMITTEE: FOURTH REPORT
55
Developing World Health Organization (WHO)
Metrics in New Zealand
In 2009, the World Health Organization (WHO) published the WHO Guidelines
for Safe Surgery 2009, in which they proposed a set of standardised public health
metrics for the routine surveillance of surgical care (WHO 2009). The WHO metrics
incorporate both systems-level and patient-level surveillance measures for assessing both
access to, and the quality of, surgical care (WHO 2009).
Reporting using the WHO metrics is increasingly being adopted by other countries throughout the world.
The following chapter describes the POMRC’s work to date in applying the WHO metrics for routine
surveillance of surgical safety in New Zealand. In the future, this will enable the POMRC to make
international comparisons in perioperative mortality.
Key findings
• The data presented reflects the difficulties in identifying ‘all procedures’; however, two different
methodologies have identified very similar POMRs (0.37% and 0.36% of admissions).
• The 10 most common procedures and 10 procedure blocks associated with the most deaths are
used to guide selection of procedures for in-depth analysis.
• The 10 most common procedures are internally consistent, but there is considerable variation within
some of the 10 procedure blocks associated with the most deaths.
• The POMRC is working with other bodies (Lancet Commission on Global Surgery, New Zealand
Joint Registry) to better understand perioperative mortality and provide information to the public
on the safety of surgery and anaesthesia in New Zealand.
New Zealand perioperative mortality and international comparisons
The POMRC continues to work with international colleagues to meet the challenges involved with
benchmarking or comparing New Zealand’s perioperative mortality data internationally.
There are few international reports that consider perioperative mortality across a whole health system,
especially relating to surgical procedures. Comparisons between countries, regions or hospitals require
adjustment for varying mortality risks that occur with different mixes of population demographics, illnesses
and other characteristics. Similarly, there are major differences in how hospitals and health care systems
are organised and how data is collected across these systems.
WHO metrics
In an effort to overcome these challenges there are increasing efforts to improve the standardisation of data
collection and reporting and, therefore, enable international comparisons with other jurisdictions. The WHO
(2009) has proposed some standardised public health surveillance metrics for surgical care (Table 28).
The POMRC has focused on two of these metrics: day of surgery and postoperative inpatient deaths.
56
Table 28: WHO’s Proposed Standardised Public Health Metrics for Surgical Care Analysed by the POMRC
(WHO 2009)
WHO METRIC
Definition
Rationale for use
Day of surgery death ratio
Number of deaths on the day of surgery, regardless of
cause divided by number of surgical procedures in a
given year or period, reported as a percentage.
This ratio allows health care systems
to assess performance and have a
snapshot of the health status of a
population.
Postoperative in-hospital death ratio
Number of deaths in hospital following surgery,
irrespective of cause and limited to 30 days, divided by
the number of surgical procedures done in a given year,
reported as a percentage.
Understanding this ratio provides an
understanding of the risks associated
with surgical interventions.
The day of surgery death ratio can be equated with the analysis of general anaesthesia deaths as presented
in the POMRC’s previous reports and also presented here with adjustment for same-day death among the
surgical specialty admissions (as surgical specialty admissions includes procedures performed without
general anaesthesia).
Table 29 presents draft results to describe the total number of inpatient surgical procedures provided in
New Zealand (2008–2012), the proportion of same-day fatalities and the proportion of inpatient deaths
related to the admissions.
Table 29: Inpatient Deaths for All Surgical Procedures, New Zealand 2008–2012
Deaths on
Same Day as
Operation
(Deaths within
one day
of general
anaesthetic)
Day of Surgery
Mortality Rate
per 100,000
Deaths as
Inpatient
Admissions
(% all
admissions)
(Deaths within
one day
of general
anaesthetic)
Inpatient
Mortality Rate
per 100,000
(% all
admissions)
All surgical specialty patients
1,554
7,693
2,078,430
74.77 (0.07%)
370.14 (0.37%)
Deaths related to patients
who undergo a general
anaesthetic
1,436
5,103
1,181,670
121.52 (0.12%)
359.9 (0.36%)
In addition, the WHO guidelines also recommend the following measures for countries with more advanced
data capability:
• number of surgical procedures performed in operating rooms for the 10 most frequent procedures in
the country
• proportion of deaths after surgery by procedure for the 10 most frequent procedures in the country.
Procedures in the NMDS are coded according to the Australian Classification of Health Interventions
(ACHI). The classification system includes over 5000 procedures organised into blocks. The most common
surgical procedure blocks associated with the first general or neuraxial anaesthetic among inpatients in
New Zealand 2008–2012 are reported in Table 30. Tonsillectomy and adenoidectomy procedures are
the most frequent with 38,494 procedures occurring during the first anaesthetic of the admission.
PERIOPERATIVE MORTALITY REVIEW COMMITTEE: FOURTH REPORT
57
Table 30: The 10 Most Frequent Surgical Inpatient Procedures by ACHI Block and First Procedure,
New Zealand 2008–2012
BLOCK
NUMBER
OF INDEX
PROCEDURES
2008–2012
412
38,494
Tonsillectomy with adenoidectomy, Adenoidectomy without tonsillectomy
1265
38,440
Dilation & curettage of uterus (D&C), Curettage of uterus without dilation
309
37,632
Myringotomy unilateral, Myringotomy bilateral, Myringotomy with insertion of unilateral or
bilateral tube
412
29,648
Cholecystectomy and laparoscopic cholecystectomy
990
28,874
Inguinal hernia repair unilateral or bilateral including laparoscopic repairs
926
27,626
Appendicectomy including laparoscopic
457
26,248
Tooth removal
1489
22,001
Hip arthroplasty
1606
21,411
Abscess, Haematoma skin lesion incision/removal
1554
20,553
Removal of metal
Description of Procedures in Block
The 10 blocks associated with the most deaths within 30 days following the occurrence of the procedure at
the first anaesthetic during the inpatient stay are presented in Table 31.
58
Table 31: The 10 Procedure Blocks Associated with the Most Deaths, New Zealand 2008–2012
BLOCK
NUMBER
OF DEATHS
2008–2012
WITHIN
30 DAYS
OF FIRST
PROCEDURE
1479
426
External fixation of fracture of pelvis, Internal fixation of fracture of acetabulum, Internal fixation
of disruption of sacro-iliac joint, Internal fixation of fracture of trochanteric or subcapital femur
913
380
Limited excision of large intestine with formation of stoma, Right hemicolectomy with formation of
stoma, Limited excision of large intestine with anastomosis, Right hemicolectomy with anastomosis,
Sub-total colectomy with formation of stoma, Extended right hemicolectomy with formation of
stoma, Subtotal colectomy with anastomosis, Extended right hemicolectomy with anastomosis,
Left hemicolectomy with anastomosis, Left hemicolectomy with formation of stoma, Total colectomy
with ileostomy, Total colectomy with ileorectal anastomosis
1489
368
Hemiarthroplasty of femur, Excision arthroplasty of hip, Partial arthroplasty of hip,
Total arthroplasty of hip, unilateral, Total arthroplasty of hip, bilateral
715
188
Replacement of popliteal aneurysm using vein, Replacement of popliteal aneurysm using
synthetic graft, Replacement of carotid artery aneurysm with graft, Replacement of thoracoaortic aneurysm with graft, Replacement of thoraco-abdominal aneurysm with graft,
Replacement of suprarenal abdominal aorta aneurysm with graft, Replacement of infrarenal
abdominal aortic aneurysm with tube graft, Replacement of infrarenal abdominal aortic
aneurysm with bifurcation graft to iliac arteries, Replacement of infrarenal abdominal aortic
aneurysm with bifurcation graft to femoral arteries, Replacement of iliac artery aneurysm with
graft, unilateral, Replacement of iliac artery aneurysm with graft, bilateral, Replacement of
visceral artery aneurysm with graft, Replacement of ruptured thoraco-aortic aneurysm with graft,
Replacement of ruptured thoraco-abdominal aneurysm with graft, Replacement of ruptured
suprarenal abdominal aortic aneurysm with graft, Replacement of ruptured infrarenal abdominal
aortic aneurysm with tube graft, Replacement of ruptured infrarenal aortic aneurysm with
bifurcation graft to iliac arteries, Replacement of ruptured infrarenal abdominal aortic aneurysm
with bifurcation graft to femoral arteries, Replacement of ruptured iliac artery aneurysm with
graft, Replacement of ruptured visceral artery aneurysm with graft, Replacement of other major
artery aneurysm with graft
985
184
Exploratory laparotomy, Staging laparotomy for lymphoma,
Postoperative reopening of laparotomy site, Staging laparotomy
895
179
Resection of small intestine with formation of stoma, Resection of small intestine with anastomosis
986
143
Division of abdominal adhesions, Laparoscopic division of abdominal adhesions
8
123
Drainage of intracranial haemorrhage, Drainage of intracranial tumour or cyst, Drainage of
intracranial infection
623
120
Replacement of aortic valve with mechanical prosthesis, Replacement of aortic valve with
bioprosthesis, Replacement of aortic valve with homograft, Replacement of aortic valve with
unstented heterograft
934
111
Coronary artery bypass, using 1 LIMA graft, Coronary artery bypass, using ≥ 2 LIMA grafts
Description of Procedures in Block
LIMA: left internal mammary artery.
PERIOPERATIVE MORTALITY REVIEW COMMITTEE: FOURTH REPORT
59
Lancet Commission on Global Surgery
The POMRC is also working to assist the Lancet Commission on Global Surgery (http://www.thelancet.com/
commissions/global-surgery) as it seeks to define solutions for the provision of quality surgical and anaesthesia
care for all. The POMRC has contributed to key methodological efforts to explore perioperative mortality
measurement across high, middle and low-income countries. This work has assessed the effect of using
admission episodes or procedures as the denominator, and the difference between in-hospital perioperative
mortality and 30-day mortality incorporating post-discharge deaths. The need for risk adjustment has also
been considered in relation to its effects on relative POMRs across the sites. Standardised approaches to
reporting and analysis will strengthen the validity of the POMR as the principal indicator of the safety of
surgery and anaesthesia care for national and international comparisons (Palmqvist et al 2015).
The POMRC has supported efforts to estimate the minimum need for surgical procedures worldwide based
on regional estimates of the prevalence of major diseases. As part of this work the POMRC has provided
an important contribution by developing a methodology for defining the role of surgical care within health
systems that is based on hospital service epidemiological information and disease prevalent data (Hider et
al 2015; Rose et al 2015). It is expected that this work will provide useful information for international and
national public health planning of surgical services.
Comparison of data included in the national database and clinical registry
The POMRC is working with the New Zealand Joint Registry to compare the occurrence of data about hip
and knee arthroplasty procedures in a national administrative database with those in a well-established
clinical registry. In previous reports the POMRC has identified that, although the NMDS is largely complete
for all publicly funded events, it does not include information about all privately funded hospital admissions.
This work aims to assess the nature and extent of what data may be missing from the NMDS and the
importance of these omissions for any estimates of perioperative mortality. By combining data from both the
NMDS and the New Zealand Joint Registry, the POMRC may obtain more in-depth information on all hip
and knee arthroplasty procedures in New Zealand, and may be able to fully describe all the patients who
undergo these treatments and their outcome.
60
Appendices
Appendix 1: Thirty-Day Mortality Rates in New Zealand
Resident Population
Table 32: Thirty-Day Mortality Rates for New Zealand Resident Population
Age Groups (Five-Year Blocks)*
Male
30-Day Mortality/100,000
Female
30-Day Mortality/100,000
0
44.88
36.00
1
2.38
1.89
5
0.58
0.66
10
1.40
1.15
15
6.25
2.71
20
7.40
3.04
25
6.00
3.53
30
8.14
4.27
35
9.53
5.92
40
13.81
9.29
45
19.48
13.97
50
29.75
21.04
55
46.60
30.16
60
70.60
49.07
65
117.29
81.12
70
191.34
129.04
75
332.14
215.10
80
581.51
415.73
85
1011.37
801.21
90
1841.84
1722.66
*The age interval relates to a five-year period except for age 0 (which relates to a one-year period), age 1 (which relates to a four-year period),
and age 90, which relates to remaining life span.
Based on Statistics New Zealand Life Tables 2009–11.
PERIOPERATIVE MORTALITY REVIEW COMMITTEE: FOURTH REPORT
61
Appendix 2: Methods
The data sources and methods employed in this report for chapters that have been published before are
consistent with those used for previous reports unless otherwise stated. Methods related to new chapters
are outlined below.
Data sources
Hospital admission data was obtained from the NMDS and compared with Estimated Resident Population
counts from Statistics New Zealand (projected from 2008). Mortality rates were sourced from NMC data
and compared to NMDS admissions counts.
In relation to specific chapters included in this report the following data was obtained:
•Cholecystectomy
62
All hospital admissions were included with a cholecystectomy listed in the first 90 procedure codes
(ICD-10-AM ACHI Procedure Codes, Version 3: 3044300, 3044500, 3044600, 3044800,
3044900, 3045401, 3045500). In a small proportion of cases (n=420), other more complex
procedures were undertaken at the same time as the cholecystectomy (eg, liver resections). In such
cases where a cholecystectomy was performed as part of a more complex procedure, the risk of
mortality is likely to have been significantly higher than if a cholecystectomy was either the main or
the only procedure undertaken at the time of the operation. These admissions were not included in
the analyses. Mortality rates of those who died following a cholecystectomy were sourced from NMC
data (with cases being selected from the cohort of those undergoing cholecystectomy, as identified
in the NMDS) and compared to NMDS admissions where a cholecystectomy was listed in any of the
first 90 procedure codes.
•
General anaesthesia
All hospital admissions were included with a general anaesthetic (ICD-10-AM ACHI Version 3:
92514XX) listed in the first 90 procedure codes were sourced from the NMDS. Mortality rates of
those who died (on the same day or the day following a general anaesthetic) are sourced from NMC
data and compared to NMDS admissions counts where a general anaesthetic was administered.
•
Hip arthroplasty
All hospital admissions were included with a hip arthroplasty listed in the first 90 procedure codes
(ICD-10-AM ACHI Procedure Codes, Version 3, Blocks: 1489 and 1492) as recorded in the NMDS.
Mortality information was sourced from the NMC and as recorded in the NMDS.
•
Knee arthroplasty
All hospital admissions were included with a knee arthroplasty listed in the first 90 procedure codes
(ICD-10-AM ACHI Procedure Codes, Version 3, Blocks: 1518, 1519, 1523 and 1524) as recorded
in the NMDS. Mortality information was sourced from the NMC and as recorded in the NMDS.
•
Mortality in elective admissions with an ASA score of 1 or 2
All elective or waiting list hospital admissions were included in those with a first ASA score of 1 or
2 that included a general anaesthetic (ICD-10-AM ACHI Procedure Code Version 3: 92514-XX) or
neuraxial block (ICD-10-AM ACHI Procedure Code Version 3: 92508-XX). Deaths related to elective/
waiting list admissions with an ASA score of 1 or 2 were included where mortality occurred within
30 days of the first general anaesthetic or neuraxial block. Elective/Waiting list admissions with a
first ASA score of 1 or 2 and a general anaesthetic or neuraxial block.
•
Bariatric surgery
Hospital admissions were initially reviewed if any bariatric procedure was listed in the first 90
procedure codes (ICD-10-AM ACHI Procedure Codes, Version 3, Blocks: 889, 875 and 1666) as
listed in the NMDS. Admissions for the chapter were included only if a bariatric procedure for morbid
obesity was listed in the first 90 procedure codes (ICD-10-AM ACHI Procedure Codes, Version 3,
Block: 889) as recorded in the NMDS. Mortality information was sourced from the NMC and as
recorded in the NMDS.
•
ASA 4 and 5
All hospital admissions were included in those with an ASA score of 4 or 5 that included a general
anaesthetic (ICD-10-AM ACHI Procedure Code Version 3: Block 1910, 92514-XX) or neuraxial
block (ICD-10-AM ACHI Procedure Code Version 3: Block 1909, 92508-XX). Deaths related to the
admissions with an ASA score of 4 or 5 were included where mortality occurred within 30 days of
the general anaesthetic or neuraxial block.
•PTCA
All hospital admissions were included with an angioplasty procedure listed in the first 90 procedure
codes (ICD-10-AM ACHI Procedure Codes, Version 3, 3530400, 3530500, 3531000, 3531001,
3531002) as recorded in the NMDS. Mortality information was sourced from the NMC and as
recorded in the NMDS.
•CABG
All hospital admissions were included with a CABG procedure listed in the first 90 procedure
codes (ICD-10-AM ACHI Procedure Codes, Version 3, 3849700, 3849710, 3849720, 3849730,
3849740, 3849750 3849760, 3849770, 3850000, 3850300, 3850001, 3850301, 3850002,
3850302, 3850003, 3850303, 3850004, 3850304, 9020100, 9020101, 9020102, 9020103,
3863700) as recorded in the NMDS. Mortality information was sourced from the NMC and as
recorded in the NMDS.
•Sepsis
•
All hospital admissions were included with any secondary diagnosis of sepsis. The ICD-10-AM
Edition 3 diagnosis codes used to define sepsis were A400, A401, A402, A403, A408, A409,
A410, A411, A412, A413, A414, A4150, A4151, A4152, A4158, A418, A419, R571, R578,
R579 and T811. An admission was included if any of these codes were identified in the 2nd to 90th
diagnostic fields. Mortality information was sourced from the NMC and as recorded in the NMDS.
Pulmonary embolus-associated and attributed mortality
— Pulmonary embolus admissions
All hospital admissions were included where a general anaesthetic (ICD-10-AM ACHI Procedure
Code 92514-XX) or neuraxial block (ICD-10-AM ACHI Procedure Code Version 3: 92508-XX)
was administered, and where 1) a pulmonary embolus (ICD-10-AM Version 3: 126.0, 126.8,
126.9) was identified in any of the diagnostic codes associated with the admission or 2) the
patient was readmitted within 30 days of the first anaesthetic date of the index admission with
a pulmonary embolus identified in any of the diagnostic codes or 3) where the patient died
within 30 days of the first anaesthetic date of the index admission and a pulmonary embolus
was identified as the main underlying cause of death or as a contributory cause in the NMC.
The denominator used the NMDS: All hospital admissions where the patient received a general
anaesthetic or neuraxial block. Note: In ICD-10-AM, pulmonary emboli associated with
pregnancy and childbirth are coded separately, and these obstetric-related pulmonary emboli
have been excluded from this analysis.
— Pulmonary embolus-associated mortality
Numerator: NMDS and NMC: All deaths occurring within 30 days of the first anaesthetic date
of the index admission where the hospital admission met the criteria for a pulmonary embolusassociated admission outlined above.
a) Denominator: NMDS: All hospital admissions where the patient received a general anaesthetic or neuraxial block.
b) Denominator: NMDS: All pulmonary embolus-associated hospital admissions in those receiving a general anaesthetic or neuraxial block.
PERIOPERATIVE MORTALITY REVIEW COMMITTEE: FOURTH REPORT
63
— Pulmonary embolus-attributed mortality
Numerator: NMDS and NMC: All deaths occurring within 30 days of the first anaesthetic date of
the index admission where a pulmonary embolus was listed as either the main underlying cause
of death or as a contributory cause of death in the NMC.
Denominator: NMDS: All hospital admissions where the patient received a general anaesthetic
or neuraxial block.
Notes on interpretation
The following notes describe the data definitions used for analyses included in this report.
1) Hospital admission types and hospital readmissions
The following occurrences, unless otherwise stated, have been dealt with in the same way as in previous reports.
Acute, arranged in public (semi-acute) and elective/waiting list admissions
The analyses included in this report used the hospital admissions typology specified in the NMDS Data
Dictionary (National Health Board 2014). An acute admission is defined as an unplanned admission
occurring on the day of presentation, while an arranged in public (semi-acute) admission is a non-acute
admission with an admission date less than seven days after the date the decision was made by the
specialist that the admission was necessary. Similarly, elective/waiting list admissions arise when the
planned admission date is seven or more days after the date the decision was made that admission
was necessary.
These definitions, however, are inconsistently used by private hospitals uploading their data to the NMDS,
with a significant proportion of private hospital admissions being coded as semi-acute when in reality
they meet the criteria for an elective/waiting list admission as outlined above. As a result, in the report all
semi-acute private hospital cases have been included in the elective/waiting list category, while semi-acute
admissions occurring in public hospitals have been included in the arranged in public (semi-acute) admission
category. Thus, unless otherwise specified, acute and elective/waiting list admissions include both public
and private cases, while semi-acute admissions are confined to public hospitals only.
Private and public hospital admissions
The NMDS contains near complete information on all publicly funded inpatient events occurring in public
hospitals. In contrast, private hospital events include a mix of publicly funded and privately funded cases.
DHB-funded events occurring in private hospitals are usually reported to the NMDS by the DHB contracting
the treatment, and thus are mostly complete in the data set. As NMDS reporting is not legally mandated for
New Zealand health care providers, however, many private surgical or procedural day-stay or outpatient
hospitals, facilities or in-rooms do not report any events to the NMDS.
The Ministry of Health is unable to provide any estimate of the extent to which the NMDS undercounts
private surgical or procedural day-stay or outpatient hospitals, facilities or in-room events, although it notes
that the data most likely to be missing is privately funded or Accident Compensation Corporation (ACC)
funded events, or publicly funded long-stay geriatric cases. Thus, in this report it must be remembered that
the data presented is likely to undercount some private hospital events, with the magnitude of this undercount
being difficult to quantify (although it is assumed to be significant).
Readmissions
Both first-time procedures and revisions of previous procedures were included in the analyses, with a small
number of individuals appearing more than once in the data. In such cases, if a second procedure occurred
within 30 days of the initial procedure, it was considered to be a revision, arising as a complication of
the first procedure, and, in such cases, the outcomes arising from the second procedure were attributed
to the first. These readmissions were not included in the denominator used to calculate mortality rates by
procedure. If a readmission occurred more than 30 days from the original procedure, however, this was
considered to be a new procedure in the calculation of mortality rates.
64
2) Chapter-specific notes
The following information relates to chapters on clinical areas that have not been presented in previous reports.
Mortality related to CABG, PTCA and bariatric surgery
Consistent with other reports, mortality is presented as deaths occurring within 30 days of any procedure
that meets the definition criteria for that chapter. In addition, for the new chapters presented in this report
for the first time (CABG, PTCA, sepsis, ASA 4 and 5, and bariatric surgery) deaths as inpatients are
also included where they have occurred after a relevant procedure but before discharge home or to a
rehabilitation facility. The inclusion of deaths prior to discharge is consistent with the POMRC’s terms of
reference A2 (Deaths occurring after an operative procedure after 30 days but before discharge from
hospital or to a rehabilitation facility).
Multiple anaesthetics and readmissions for ASA 4 and 5
Admissions were included if the ASA score of any anaesthetic (either a general anaesthetic or a neuraxial
block) during that admission was either 4 or 5. Most admissions (91.5%) included only one anaesthetic with
an ASA score of 4 or 5 as the first anaesthetic. In a number of admissions (1302) multiple anaesthetics were
administered and the ASA score for one of these later anaesthetic events was 4 or 5. The anaesthetic with
an ASA score of 4 or 5 was taken to be the index event for both the calculation of 30-day mortality and for
assigning the ASA score.
In this analysis, all admissions with any anaesthetic procedure with an ASA of 4 or 5 have been included
even if the ASA score of an earlier or later anaesthesia during that admission was not 4 or 5. Similarly only,
deaths within 30 days of the index anaesthetic have been included, even if earlier or later anaesthetics
occurred during the same admission (ie, 30-day mortality has been calculated with respect to the index
rather than the first or last anaesthetic within an admission). In a small number of cases, two admissions
occurred within 30 days of death. In such cases, the first elective/waiting list admission in the 30-day
period has been taken to be the index event.
Admissions and mortality related to sepsis
An admission was included if any of the listed codes for sepsis were identified in the 2nd to 90th diagnostic
fields. Admissions included any hospital event with a surgical diagnosis related group (DRG) that listed at
least one operating room procedure. The list of operating room procedures and all other clinical codes were
obtained by the Health Quality & Safety Commission and were based on the Victorian State Government
document: Patient Safety Indicators: Translated Technical Specifications (http://www.health.vic.gov.au/__
data/assets/pdf_file/0009/270855/Translated-Technical-Specifications.pdf). Operating room procedures
and diagnoses were translated into ICD–10-AM Edition 3 and DRG codes were translated into Edition 3
and Edition 6. As from 1 July 2011 NMDS data contains DRGs in ICD–10-AM Edition 6. The following
exclusions were applied to the admissions:
• any admissions with a primary diagnosis of sepsis
• those with a primary diagnosis of infection
• those with any code for an immunocompromised state
• those with any code for cancer
• those with a major diagnostic category 14 (pregnancy, childbirth and puerperium)
• those with a length of stay of less than 2 days.
The first operation date was used as the index date for mortality.
The following occurrences, unless otherwise stated, have been dealt with in the same way as in previous reports.
PERIOPERATIVE MORTALITY REVIEW COMMITTEE: FOURTH REPORT
65
Multiple anaesthetics and readmissions for the ‘Mortality following General Anaesthesia’ chapter
While in the majority of cases only one general anaesthetic was performed per hospital admission,
in 2.5% of admissions, two or more general anaesthetics were performed, with the maximum number of
general anaesthetics performed during any one admission being 75. Further, in a number of cases, two
or more anaesthetics were performed within a day of the death, resulting in both anaesthetic events being
eligible for inclusion in the numerator. Finally, in a number of cases, two separate hospital admission events
occurred within a day of each other, with both admission events including a general anaesthetic which
occurred within a day of the death. As a result of these complexities, mortality rates have been calculated
per 100,000 admission events where one or more anaesthetics were performed, rather than per 100,000
anaesthetics (ie, the denominator is the number of admission events rather than the number of anaesthetics).
Where two eligible admissions occurred within a day of the death, both admission events have been
counted in the denominator (number of hospital admissions) but the death has only been counted once,
in the most recent admission event prior to the death.
Multiple anaesthetics and readmissions for the ‘Mortality in Elective Admissions with an ASA Score
of 1 or 2’ chapter
Elective/waiting list admissions were included if the ASA score of the first anaesthetic (either a general
anaesthetic or a neuraxial block) during that admission was either 1 or 2. In a small number of admissions,
multiple anaesthetics were administered, and in some cases the ASA score for these later anaesthetic events
was 3 or more. Because the first anaesthetic was taken to be the index event for both the calculation of
30-day mortality and for assigning the ASA score, in this analysis all admissions have been included,
even if the ASA score of later anaesthesia was 3 or more. Similarly, only deaths within 30 days of the index
anaesthetic have been included, even if later anaesthesia occurred during the same admission (ie, 30-day
mortality has been calculated with respect to the first rather than the last anaesthetic within an admission).
In a small number of cases, two elective/waiting list admissions occurred within 30 days of death. In such
cases, the first elective/waiting list admission in the 30-day period has been taken to be the index event.
Multiple anaesthetics and readmissions for the ‘Pulmonary Embolus-Associated and Attributed
Mortality’ chapter
In a small number of cases, two or more hospital admissions occurred within 30 days of a pulmonary
embolus-associated or attributed death, and in such cases, the first admission was considered to be the
index admission, with the second admission being removed from both the numerator and denominator of the
mortality rate calculations (although both admissions were included in the calculation of pulmonary embolusassociated admission rates). Similarly, only deaths occurring within 30 days of the first anaesthetic date of
the index admission were included, even if later anaesthesia occurred during the same admission (ie, 30-day
mortality was calculated with respect to the first rather than the last anaesthetic for each index admission).
3) Socio-demographic and clinical covariates
The following occurrences, unless otherwise stated, have been dealt with in the same way as in previous reports.
NZDep decile
Analysis of NZDep information is not separately included in this report as only 2006 NZDep data could
be obtained. It is likely that the 2006 data would have limited relevance to the admissions and mortality
information from the later years analysed in this report. Thus, separate analyses of data were not presented
in relation to NZDep. However, this data was used in the logistic regression analyses in order to give some
indication of the effect of deprivation on the results.
ASA and emergency suffixes
All ICD–10-AM ACHI anaesthesia codes require a two-character extension, with the first digit indicating the
ASA’s Physical Status Classification and the second digit indicating whether the procedure was routine or
carried out as an emergency, as follows:
66
ASA SCORE
Description
1
A normal healthy patient
2
A patient with mild systemic disease
3
Patient with severe systemic disease that limits activity
4
Patient with severe systemic disease that is a constant threat to life
5
A moribund patient who is not expected to survive longer than 24 hours without surgical intervention
6
A declared brain-dead patient whose organs are being removed for donor purposes
9
No documented ASA score
EMERGENCY
Modifier Description
0
Procedure being performed as an emergency
9
Non-emergency or not known
Unless otherwise specified, the ASA status referred to throughout this report is the ASA status derived from
the first anaesthesia code for each admission event (with the order of procedure codes being determined
by the diagnosis sequence variable within the NMDS). In the case of multiple anaesthetics, it is likely that
this first ASA status reflects most closely the ASA status of the patient at the time of admission. However,
in Table 18 of the companion report (available on the Commission’s website by July 2015) the ASA status
and emergency status of the last listed anaesthesia code has been used, in order to better reflect the
factors associated with the last anaesthetic prior to death (with the order of procedure codes again being
determined by the diagnosis sequence in the NMDS).
4) Interpreting multivariate analyses: odds ratios and rate ratios
This report used logistic regression for multivariate analysis. A limitation of logistic regression is that the
results generated are expressed as odds ratios (the odds of an event occurring in an exposed group versus
the odds of it occurring in an unexposed group) as opposed to rate ratios such as relative risk (the risk of
an event occurring in an exposed group relative to the risk of it occurring in the unexposed group).
Odds ratios provide a close estimate of relative risk for rare outcomes. However, for non-rare outcomes, odds
ratios become biased away from the null, resulting in a tendency to over-estimate the magnitude of any effect.
In this report, consistent with previous reports, all odds ratios derived from figures where the mortality
rate exceeds 20% have been suppressed (as indicated by an H). Interpreting any odds ratios where the
associated mortality is in the 10–19% range should also be interpreted with caution because of the tendency
for odds ratios to slightly overestimate rate ratio (and the magnitude of effect).
PERIOPERATIVE MORTALITY REVIEW COMMITTEE: FOURTH REPORT
67
Appendix 3: Previous report recommendations – progress summary
The following tables present the Committee’s progress on recommendations made in the previous three reports.
Table 33: Progress Summary of Third Report Recommendations
68
RECOMMENDATIONS OF THIRD REPORT
(MARCH 2014)
PROGRESS TO DATE
(MARCH 2015)
Recommendations for improving perioperative care:
The ASA Physical Status Classification for each patient is collected
and communicated to all theatre staff. The POMRC considers this is
best done in the time-out part of the WHO Surgical Safety Checklist.
The Perioperative Harm Advisory Group has highlighted the
need for ASA recording, as part of the surgical safety checklist.
The proportion of ASA recording is improving but is far from
complete. This recommendation will be repeated.
A continuing focus on promotion of formal and timely assessment
of the risk of venous thromboembolism (VTE) is warranted,
including with acutely admitted patients, given the apparent minor
increase in pulmonary embolism mortality.
The Commission is partnering with the International Society on
Thrombosis and Haemostasis, highlighting a systematic approach
to assessment and prophylaxis of VTE. Help for introducing
hospital VTE prevention programmes was included in a 2012
Commission-sponsored project to establish a national policy
framework for VTE. As the most recent year reported on is 2012,
no effect would yet be seen.
Recommendations for system development:
The POMRC works with health care providers to develop
recommendations for standardised perioperative mortality
reporting and reviewing.
All DHB and private providers have been surveyed as to how they
undertake local perioperative mortality review. Areas that are
doing it well have been identified and the Lead Coordinator for
the POMRC has undertaken site visits collecting information as to
what best practice looks like. Recommendations will then be drawn
up as to how best to undertake a standardised local perioperative
mortality review.
Recommendations for further analysis:
The proposed WHO measures of surgical care are incorporated
into perioperative mortality analysis and reporting.
The 2015 report has focused on two of the WHO proposed
standardised public health surveillance metrics: day of surgery
and postoperative inpatient deaths.
A standard out-of-hospital death notification process be explored
as a mechanism to identify deaths that occurred within 30 days
of an operative procedure but after discharge.
This process is under development.
The Commission considers developing a resource on hospital
standardised mortality ratios.
Under investigation.
Table 34: Progress Summary of Second Report Recommendations
RECOMMENDATIONS OF SECOND REPORT
(MARCH 2013)
PROGRESS TO DATE
(MARCH 2015)
All patients should be formally assessed preoperatively for risk of
venous thromboembolism and appropriate thromboprophylaxis
implemented, taking into account the individual risk/benefit profile.
Raising the profile of venous thromboembolism risk is part of
the Health Quality & Safety Commission’s Open for better care
campaign and promoted by the Reducing Perioperative Harm
programme.
All health care professionals should participate actively in the
WHO Surgical Safety Checklist, including the question on
thromboprophylaxis.
The Perioperative Harm Advisory Group of the Commission is
actively promoting the use of the checklist to improve teamwork
and communication.
To assist informed consent, information should be available
for patients concerning the risk of dying within 30 days of any
procedure that has significant risk of mortality.
Reports of the POMRC (reporting mortality on a five-year rolling
basis starting from 2006) will shape the development of informed
consent resources for patients. This will be developed in conjunction
with the Consumer Engagement team of the Commission.
Data from the reports has been used in clinical teaching.
Non-operative care pathways should be developed and used
when surgical procedures are deemed inappropriate because
of excessive risk.
This has been raised with the Royal Australasian College of
Surgeons and the Australian and New Zealand College of
Anaesthetists and is supported.
Case studies are developed to highlight current good practice
or recommend practice change.
Case studies are used in the annual POMRC workshops.
Psychosocial issues contributing to mortality following procedures
require further investigation.
Close communications maintained with the Suicide Mortality
Review Committee.
Given the relative mortality of acute (1.0%) and elective
(0.16%) cholecystectomy, further research is conducted into
the management of acute cholecystitis.
Analysis included in the 2015 report.
Mortality following acute surgery for those aged over
80 years needs further assessment and discussion with health
care professionals so that optimal health care can be planned.
Analysis included in the 2015 report.
There is a continuing focus on ASA 1 and 2 elective surgery
mortality (as, for these patients, a positive outcome was anticipated).
Further analysis included in the 2015 report.
PERIOPERATIVE MORTALITY REVIEW COMMITTEE: FOURTH REPORT
69
Table 35: Progress Summary of Inaugral Report Recommendations
RECOMMENDATIONS OF INAUGURAL REPORT
(FEBRUARY 2012)
PROGRESS TO DATE
(MARCH 2015)
A whole-of-system perioperative mortality review process is
developed which builds on the NMDS and the NMC. This would
include the accurate and systematic recording of patient and
procedure details from all health care facilities and practitioners.
An integrated data entry process is being developed to collect
data across all health care facilities.
Key components
The enhancement and standardisation of existing data collections
and current mortality review processes to ensure a uniform,
efficient and meaningful national methodology.
An integrated data entry process is being developed to collect
data across all health care facilities.
Identification of ‘all perioperative processes’ in the NMDS
remains problematic and will be addressed by the data entry
process being developed.
Private hospital coverage is still incomplete, particularly private
day-stay providers.
A coding mechanism that recognises both procedures and deaths
within the remit of the POMRC. This will require investigation to
determine optimal methodology.
See above.
The development of a national standardised perioperative
mortality review form that will be common to all health care
facilities and practitioners. This form will enable and facilitate
additional data collection and peer review processes.
This will be an electronic data only process, which is under
development.
Secure national data storage hosted by, and under the
guardianship of, the Health Quality & Safety Commission.
Completed.
The ability to carry out whole-of-system and focused (sub-group)
analysis of both qualitative and quantitative data.
Under development.
The ability to report at a number of levels (national, regional,
within health care facility) and to a variety of audiences, including
consumers and the wider community.
Data entry processes are being developed to enable national,
regional and local reporting.
The ability to generate evidence-based, peer-reviewed
recommendations for reinforcing current ‘good practice’ or system
improvements leading to practice change.
In progress.
Formalised Memorandum of Understanding between the POMRC
and Coronial Services to enable enhanced and standardised data
access.
A change in Chief Coroner has slowed the process but progress
is being achieved. The Memorandum of Understanding is in
development and is expected to cover all the mortality review
committees.
Work with the National Health Board to ensure that the NMDS
and NMC collections are enhanced and standardised by:
The National Health Board and mortality review committees have
worked together to improve data capture.
• ensuring that the ASA score is recorded for all procedures
This remains an iterative process as data collection and reporting
systems are further developed.
• separately identifying existing conditions from those acquired
during that admission
Comments from previous reports remain.
• ensuring that the immediate cause of death can be identified
from the data collections.
Submission of data to the NMDS is mandatory for all health care
facilities.
Following sector consultation, this recommendation has been well
received by both the public and private sectors.
Despite this, there are some private facilities still not submitting
data to the NMDS.
70
Appendix 4: POMRC Progress 2010–2015
Table 36: POMRC Progress 2010–2015
ESTABLISHMENT PHASE
IMPLEMENTATION PHASE
Year 1
Year 2
Year 3
Year 4
Year 5
July 2010–June 2011 July 2011–June 2012 July 2012–June 2013 July 2013–June 2014 July 2014–June 2015
POMRC establishment
Inaugural report
published
(February 2012)
POMRC at full
membership
Publication of progress
report (March 2014)
Publication of progress
report (Jume 2015)
Sector engagement/
consultation
Sector engagement/
consultation
Sector engagement/
consultation
Publication of further
national perioperative
mortality data
(June 2014)
Publication of fourth
report (June 2015)
Data scoping
Developing data
analysis methodology
Publication of second
report
Second workshop
(June 2014)
Third workshop
(June 2015)
Determine reporting
focus
Reviewing additional
data modalities
Endoscopy Working
Group established
Endoscopy case review
Inaugural workshop
(June 2013)
Integrated review form
piloted internally and
externally
Development of
integrated perioperative
mortality review form
National perioperative
mortality data collection
infrastructure developed
Transition from Ministry
of Health to Health
Quality & Safety
Commission
Review of existing
local mortality review
processes
PERIOPERATIVE MORTALITY REVIEW COMMITTEE: FOURTH REPORT
71
List of Abbreviations
ACC Accident Compensation Corporation
ACHI Australian Classification of Health Interventions
ASA American Society of Anesthesiologists
CABG
Coronary artery bypass graft
CI Confidence interval
72
DHB
District health board
DRG
Diagnosis related group
LIMA
Left internal mammary artery
MELAA Middle Eastern/Latin American/African
NMC National Mortality Collection
NMDS National Minimum Dataset
NZDep New Zealand Deprivation Index
OR
Odds ratio
POMR
Perioperative mortality rate
POMRC Perioperative Mortality Review Committee
PTCA
Percutaneous transluminal coronary angioplasty
RIMA
Right internal mammary artery
VTE
Venous thromboembolism
WHO
World Health Organization
References
Avidan MS, Kheterpal S. 2012. Perioperative mortality in developed and developing countries.
Lancet 380: 1038–9.
Bainbridge D, Martin J, Arango M, et al. 2012. Perioperative and anaesthetic-related mortality in developed
and developing countries: a systematic review and meta-analysis. Lancet 380: 1075–81.
Comrie M, Murray N, Watson B, et al. 2010. Communicating infant immunisation information:
resource development and evaluation. School of Communication, Journalism and Marketing, Wellington:
Massey University.
URL: http://www.massey.ac.nz/massey/fms/Colleges/College%20of%20Business/Communication%20
and%20Journalism/Literacy/Final%20Report%20Communicating%20Immunisation%20Information_1.pdf?9
4F7934EDACEB09ADFF74DE9C13318D3
Curtis E, Harwood M, Riddell T. 2007. Cardiovascular disease. In Robson B, Harris R (eds.),
Hauora: Ma-ori Standards of Health IV: a study of the years 2000–2005 (pp. 141–58). Wellington:
Te Ropu Rangahau Hauora a Eru Pomare.
Curtis E, Harwood M, Riddell T, et al. 2010. Access and society as determinants of ischaemic heart disease
in indigenous populations. Heart, Lung and Circulation 19: 316–24.
de Vries EN, Prins HA, Crolla RM, et al 2010. Effect of a comprehensive surgical safety system on patient
outcomes. New England Journal of Medicine 363: 1928–37.
Ellis C, Devlin G, Elliott J, et al. 2010. ACS patients in New Zealand experience significant delays to
access cardiac investigations and revascularisation treatment especially when admitted to non-interventional
centres: results of the second comprehensive national audit of ACS patients. New Zealand Medical Journal
123(1319).
Ellis C, Devlin G, Matsis P, et al. 2004. Acute coronary syndrome patients receive less invasive management
when admitted to hospitals without invasive facilities. New Zealand Medical Journal 117(1197).
Ellison-Loschmann L, Pearce N. 2006. Improving access to health care among New Zealand’s Ma-ori
population. American Journal of Public Health 96(4): 612–7.
Fudickar A, Hörle K, Wiltfang J, et al. 2012. The effect of the WHO Surgical Safety Checklist on
complication rate and communication. Deutsches Arzteblatt International 109(42): 695–701.
Harris R, Cormack D, Tobias M, et al. 2012. Self-reported experience of racial discrimination and health
care use in New Zealand: results from the 2006/07 New Zealand Health Survey. American Journal of
Public Health 102(5): 1012–9.
Haugen AS, Søfteland E, Almeland SK, et al. 2015. Effect of the World Health Organization Checklist on
Patient Outcomes: a stepped wedge cluster randomized controlled trial. Annals of Surgery 261(5): 821–8.
Hider P, Wilson L, Rose J, et al. 2015. The role of facility-based surgical services in addressing the national
burden of disease in New Zealand: an index of surgical incidence based on country-specific disease
prevalence. Lancet 385(Suppl 2): S25.
Kerr AJ, Mustafa A, Lee M, et al. 2014. Ethnicity and revascularisation following acute coronary syndromes:
a 5-year cohort study (ANZACS-QI–3). New Zealand Medical Journal 127(1393).
Kickbusch I. 2008. Health literacy: an essential skill for the twenty-first century. Health Education
108(2): 101–4.
Kickbusch I, Wait S, Maag D. 2005. Navigating health: the role of health literacy.
URL: http://www.ilonakickbusch.com/kickbusch-wAssets/docs/NavigatingHealth.pdf
Makasa EM (on behalf of 100 listed signatories and supporting organisations). 2012. Letter to global health
agency leaders on the importance of surgical indicators. Lancet 384: 1748–9.
PERIOPERATIVE MORTALITY REVIEW COMMITTEE: FOURTH REPORT
73
Ministry of Health. 2010a. Ko-rero Ma-rama: Health Literacy and Ma-ori Results from the 2006 Adult Literacy
and Life Skills Survey. Wellington: Ministry of Health.
Ministry of Health. 2010b. Tatau Kahukura: Ma-ori Health Chart Book 2010, 2nd Edition. Wellington:
Ministry of Health.
Ministry of Health. 2012a. Ma-ta-tuhi Tuawhenua: Health of Rural Ma-ori 2012. Wellington: Ministry of Health
Ministry of Health. 2012b. Rauemi Atawhai: A guide to developing health education resources in New Zealand.
Wellington: Ministry of Health.
URL: http://www.health.govt.nz/publication/rauemi-atawhai-guide-developing-health-education-resources-newzealand (accessed May 2015).
Ministry of Health. 2014. Annual Update of Key Results 2013/14: New Zealand Health Survey. Wellington:
Ministry of Health.
National Health Board. 2014. National Minimum Dataset (Hospital Events) Data Dictionary. Wellington:
Ministry of Health.
URL: http://www.health.govt.nz/publication/national-minimum-dataset-hospital-events-data-dictionary
Nutbeam D. 2000. Health literacy as a public health goal: a challenge for contemporary health education
and communication strategies into the 21st century. Health Promotion International 15(3): 259–67.
Palmqvist CL, Ariyaratnam R, Watters DA, et al. 2015. Monitoring and evaluating surgical care: defining
perioperative mortality rate and standardising data collection. Lancet 385(Suppl 2): S27.
Reid P, Robson B. 2007. Understanding health inequities. In Robson B, Harris R (eds.), Hauora: Ma-ori
Standards of Health IV: a study of the years 2000–2005 (pp. 3–10). Wellington: Te Ropu Rangahau Hauora
a Eru Pomare.
Robson B, Purdie G, McLeod M, et al. 2011. Overcoming racism to improve cardiovascular health: tackling
inequalities in cardiac health care. Heart Lung and Circulation 20: S2.
Rose J, Weiser TG, Hider P, et al. 2015. Estimated need for surgery worldwide based on prevalence of
diseases: a modelling strategy for the WHO Global Health Estimate. Lancet Global Health 3(Suppl 2):
S13–20.
Sandiford P, El-Jack SS, Scott AG, et al. In press. Different needs or treated differently? Understanding ethnic
inequalities in coronary revascularisation rates. Heart, Lung and Circulation (2015).
URL: http://dx.doi.org/10.1016/j.hlc.2015.03.002 (accessed May 2015).
van Klei WA, Hoff RG, van Aarnhem EE, et al. 2012. Effects of the international introduction of the WHO
Surgical Safety Checklist on in-hospital mortality: a cohort study. Annals of Surgery 255: 44–9.
Wang TKM, Ramanathan T, Crengle S, et al. 2014. Comparing contemporary coronary artery bypass
grafting across six main ethnic groups of New Zealand: another example of inequalities in cardiovascular
disease. Global Heart 9(1), Suppl: e12.
Wang TKM, Ramanathan T, Stewart R, et al. 2013. Ma-ori have worse outcomes after coronary artery
bypass grafting than NZ Europeans in New Zealand. New Zealand Medical Journal 126(1379).
Watters DA, Hollands MJ, Gruen R, et al. 2014. Perioperative mortality rate (POMR): a global indicator
of access to safe surgery and anaesthesia. World Journal of Surgery 39: 856–64.
World Health Organization. 2009. WHO Guidelines for Safe Surgery, 2009: Safe surgery
saves lives. Geneva: World Health Organization.
URL: http://www.who.int/patientsafety/safesurgery/tools_resources/9789241598552/en/
74


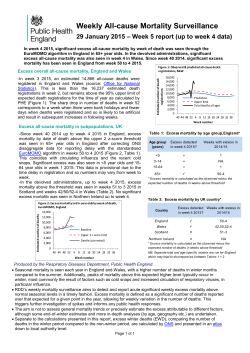


![National University Virtual High School [2014-2015]](http://cdn1.abcdocz.com/store/data/000348438_1-3a80ae3134ab49395c6a7578fe5bdf0b-250x500.png)

© Copyright 2026