
EIA Winter Fuels Review
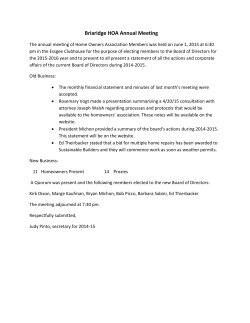
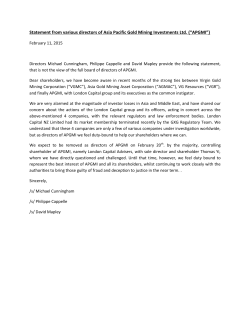
Winter Fuels Review 2014-15
For
National Energy Assistance Directors' Association
March 23, 2015 | Washington, D.C.
By
Tim Hess
U.S. Energy Information Administration
Independent Statistics & Analysis
www.eia.gov
After falling sharply in late-2014, oil prices rise from mid-2015
through mid-2016 in EIA’s forecast – however, the market-implied
confidence band is very wide
WTI price
dollars per barrel
150
125
100
75
50
Historical Spot Price
STEO Forecast
25
NYMEX Futures Price
Current 95% NYMEX futures price confidence interval
0
Jan Apr
Jul Oct Jan Apr Jul Oct Jan Apr Jul
2013
2014
2015
Oct Jan Apr
Jul
2016
Oct
Source: EIA, Short-Term Energy Outlook, March 2015
National Energy Assistance Directors' Association
March 23, 2015
2
February and November were much colder than average; however,
for the U.S. total HDD, a cold winter in the eastern part of the
country was offset by warmer than average temperatures in the West
U.S. winter heating degree days
population-weighted
1000
900
800
700
2012/13
2013/14
2014/15
2015/16
600
500
400
300
200
100
0
October
November
December
January
February
March
Note: EIA calculations based on National Oceanic and Atmospheric Administration (NOAA)
data. Horizontal lines indicate each month's prior 10-year average (Oct 2004 - Mar 2014).
Projections reflect NOAA's 14-16 month outlook.
Source: EIA, Short-Term Energy Outlook, March 2015
National Energy Assistance Directors' Association
March 23, 2015
3
East of the Rockies, this winter was colder than average, but it was
milder than last winter
Winter heating degree days
by region
7,000
2013/14
2014/15
10-year average
6,000
5,000
4,000
3,000
2,000
1,000
0
New
Middle
England Atlantic
East N. West N. South
Central Central Atlantic
East S.
Central
West S. Mountain Pacific
Central
Note: EIA calculations based on National Oceanic and Atmospheric Administration (NOAA)
data. Horizontal lines indicate each region's prior 10-year average (Oct 2004 - Mar 2014).
For winter 2014/15, data are actual through February, March is a projection.
Source: EIA, Short-Term Energy Outlook, March 2015
National Energy Assistance Directors' Association
March 23, 2015
4
Heating fuel market shares vary regionally
Share of homes by primary space heating fuel and Census Region
Midwest
West
Northeast
natural gas
electricity
heating oil and kerosene
propane
wood
other/no heating
South
United States
Source: EIA calculations based on the U.S. Census Bureau, 2013 American Community Survey.
5
Heating Oil
National Energy Assistance Directors' Association
March 23, 2015
6
Heating oil wholesale prices were high relative to crude oil prices
Monthly average NY Harbor heating oil crack spread (Brent)
dollars per gallon
0.70
0.60
0.50
0.40
0.30
2011
2012
0.20
2013
2014
0.10
2015
0.00
Jan
Feb
Mar
Apr
May
Jun
Jul
Aug
Sep
Oct
Nov
Dec
Source: EIA, Thomson Reuters, and CME Group
National Energy Assistance Directors' Association
March 23, 2015
7
However, because of lower crude oil prices, the absolute price of
heating oil is lower than in recent years
Monthly average heating oil and crude oil prices
dollars per gallon
dollars per barrel
4.50
189
4.00
168
forecast
3.50
147
3.00
126
2.50
105
2.00
84
Heating oil wholesale price
1.50
63
Heating oil average retail price
1.00
42
Brent crude oil
Nov-16
Sep-16
Jul-16
May-16
Mar-16
Jan-16
Nov-15
Sep-15
Jul-15
May-15
Mar-15
Jan-15
Nov-14
Sep-14
Jul-14
May-14
Mar-14
Jan-14
Nov-13
Sep-13
Jul-13
0
May-13
0.00
Mar-13
21
Jan-13
0.50
Source: EIA, Short-Term Energy Outlook, March 2015
National Energy Assistance Directors' Association
March 23, 2015
8
Average household heating expenditures for consumers heating
with oil fell significantly this winter
Average heating expenditures for household that heat primarily with oil
dollars
2,500
2,355
U.S. Average
2,113
1,966
2,000
1,790
1,784
1,757
1,530
1,522
2008-09
2009-10
1,500
1,000
500
0
2007-08
2010-11
2011-12
2012-13
2013-14
2014-15
Source: EIA, Short-Term Energy Outlook, March 2015
National Energy Assistance Directors' Association
March 23, 2015
9
There were no reported problems with the change in
heating oil sulfur specifications in five states last year
15 ppm
15 ppm
Note: Specifications change on July 1 of the years shown, with the exception of Maine's 15 ppm requirement,
which changes on January 1, 2018.
* Philadelphia, Pennsylvania changes from 2,000 ppm to 15 ppm on July 1, 2015.
Source: U.S. Energy Information Administration.
National Energy Assistance Directors' Association
March 23, 2015
10
Propane
National Energy Assistance Directors' Association
March 23, 2015
11
PADD 2 (Midwest) propane inventories remain above the 5-year
average
PADD 2 propane inventories, difference from 5-year average
million barrels
10
8
6
inventory level (difference from 5-year average)
4
2
above
5-year average
below
5-year average
0
-2
-4
-6
-8
-10
Feb-13
Apr-13
Jun-13
Aug-13
Oct-13
Dec-13
Feb-14
Apr-14
Jun-14
Aug-14
Oct-14
Dec-14
Feb-15
Source: EIA, Weekly Petroleum Status Report, data through March 13, 2015
*propane/propylene for fuel use only
National Energy Assistance Directors' Association
March 23, 2015
12
Selected state propane inventories
Source: EIA, Weekly Petroleum Status Report, data through March 13, 2015
*propane/propylene for fuel use only
National Energy Assistance Directors' Association
March 23, 2015
13
PADD 3 (Gulf Coast) propane inventories well above 5-year
average
PADD 3 propane* inventories, difference from 5-year average
million barrels
20
18
16
14
inventory level (difference from 5-year average)
12
10
8
6
4
above
5-year average
below
5-year average
2
0
-2
-4
-6
-8
-10
Feb-13 Apr-13
Jun-13
Aug-13
Oct-13
Dec-13
Feb-14 Apr-14
Jun-14
Aug-14
Oct-14
Dec-14
Feb-15
Source: EIA, Weekly Petroleum Status Report, data through March 13, 2015
*propane/propylene for fuel use only
National Energy Assistance Directors' Association
March 23, 2015
14
Propane spot prices are below last winter
Propane spot prices (Conway, KS and Mont Belvieu, TX)
dollars per gallon
5.00
4.50
4.00
Conway
(2013-14)
3.50
Last Winter
(2013-14)
3.00
2.50
2.00
Mont Belvieu
(2013-14)
1.50
1.00
Mont Belvieu
(2014-15)
This Winter
(2014-15)
0.50
Conway
(2014-15)
0.00
Sep
Oct
Nov
Dec
Jan
Feb
Mar
Source: EIA, Thomson Reuters, data through March 17, 2015
National Energy Assistance Directors' Association
March 23, 2015
15
Retail propane prices on the East Coast and in the Midwest have
been stable so far this heating season
dollars per gallon
5.00
4.00
3.00
PADD 1 propane
2.00
PADD 2 propane
1.00
0.00
Oct-12
winter 2014-15
winter 2013-14
winter 2012-13
Mar-13
Oct-13
Mar-14
Oct-14
Mar-15
Source: State Heating Oil and Propane Program, data through March 16, 2015
National Energy Assistance Directors' Association
March 23, 2015
16
Average household heating expenditures for consumers heating
with propane fell in both the Northeast and Midwest
Average heating expenditures for household that heat primarily with propane
dollars
3,000
Northeast
Midwest
2,500
2,000
1,500
1,000
500
0
2007-08
2008-09
2009-10
2010-11
2011-12
2012-13
2013-14
2014-15
Source: EIA, Short-Term Energy Outlook, March 2015
National Energy Assistance Directors' Association
March 23, 2015
17
Natural Gas
National Energy Assistance Directors' Association
March 23, 2015
18
Falling Henry Hub spot prices contributed to lower residential
natural gas prices this winter
WTI price
dollars per thousand cubic feet
Residential price
20
Henry Hub spot price
Forecast
18
16
14
12
10
8
6
4
2
0
Jan 2011
Jan 2012
Jan 2013
Jan 2014
Jan 2015
Jan 2016
Source: EIA, Short-Term Energy Outlook, March 2015
National Energy Assistance Directors' Association
March 23, 2015
19
Lower natural gas prices and slightly higher temperatures this year
contributed to a drop in average natural gas heating expenditures
Average heating expenditures for household that heat primarily with natural gas
dollars
900
800
795
826
U.S. Average
698
700
679
680
600
571
608
2011-12
2012-13
628
500
400
300
200
100
0
2007-08
2008-09
2009-10
2010-11
2013-14
2014-15
Source: EIA, Short-Term Energy Outlook, March 2015
National Energy Assistance Directors' Association
March 23, 2015
20
Electricity
National Energy Assistance Directors' Association
March 23, 2015
21
Electricity expenditures for heating were unchanged from last winter
as higher prices offset lower consumption
Average heating expenditures for household that heat primarily with electricity
dollars
1,200
U.S. Average
1,000
800
866
873
884
2008-09
2009-10
2010-11
955
956
2013-14
2014-15
895
843
789
600
400
200
0
2007-08
2011-12
2012-13
Source: EIA, Short-Term Energy Outlook, March 2015
National Energy Assistance Directors' Association
March 23, 2015
22
Summer 2015
National Energy Assistance Directors' Association
March 23, 2015
23
U.S. cooling degree days are projected close to average levels in
2015
U.S. summer cooling degree days
population-weighted
400
350
300
250
200
2013
2014
2015
2016
150
100
50
0
April
May
June
July
August
September
Note: EIA calculations based on National Oceanic and Atmospheric Administration (NOAA)
data. Horizontal lines indicate each month's prior 10-year average (Oct 2004 - Mar 2014).
Projections reflect NOAA's 14-16 month outlook.
Source: EIA, Short-Term Energy Outlook, March 2015
National Energy Assistance Directors' Association
March 23, 2015
24
Residential electricity prices are projected to rise modestly in
2015, averaging 12.6 cents/kWh for the year and 12.9 cents/kWh
during the summer months
U.S. residential electricity price
cents per kilowatthour
14
24%
20%
12
10
16%
Annual growth (right axis)
8
Residential electricity price
10.3%
12%
Price forecast
6
5.4%
4
2.6%
8%
5.7%
2.4%
2.2%
0.3%
1.6% 1.4% 2.1%
3.1%
1.0%
1.8%
4%
2
0%
0
-4%
2004 2005 2006 2007 2008 2009 2010 2011 2012 2013 2014 2015 2016
Source: EIA, Short-Term Energy Outlook, March 2015
American Farm Bureau Federation, Energy Advisory Committee,
February 23, 2015
25
Retail gasoline prices are projected to average $2.43/gal during
summer of 2015 and $2.73/gal in for full-year 2016
U.S. gasoline and Brent crude oil prices
dollars per gallon
5.00
4.50
4.00
Forecast
Price difference
Retail regular gasoline
Crude oil
3.50
3.00
2.50
2.00
1.50
1.00
0.50
0.00
Jan 2011
Jan 2012
Jan 2013
Jan 2014
Jan 2015
Jan 2016
Source: EIA, Short-Term Energy Outlook, March 2015
American Farm Bureau Federation, Energy Advisory Committee,
February 23, 2015
26
For more information
Subject matter experts for this presentation:
Tim Hess, Office of Integrated and International Energy Analysis
[email protected], 202-586-4212
27


© Copyright 2026