
Beyond Constant Comparison Qualitative Data Analysis: Using NVivo
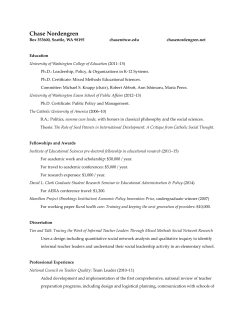
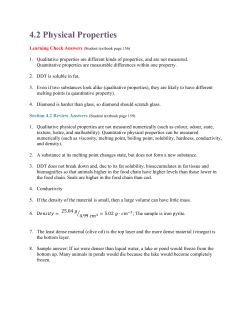
School Psychology Quarterly
2011, Vol. 26, No. 1, 70 – 84
© 2011 American Psychological Association
1045-3830/11/$12.00 DOI: 10.1037/a0022711
Beyond Constant Comparison Qualitative Data Analysis:
Using NVivo
Nancy L. Leech
Anthony J. Onwuegbuzie
University of Colorado Denver
Sam Houston State University
The purposes of this paper are to outline seven types of qualitative data analysis
techniques, to present step-by-step guidance for conducting these analyses via a
computer-assisted qualitative data analysis software program (i.e., NVivo9), and to
present screenshots of the data analysis process. Specifically, the following seven
analyses are presented: constant comparison analysis, classical content analysis, keyword-in-context, word count, domain analysis, taxonomic analysis, and componential
analysis. It is our hope that providing a clear step-by-step process for conducting these
analyses with NVivo9 will assist school psychology researchers in increasing the rigor
of their qualitative data analysis procedures.
Keywords: qualitative data analysis, NVivo, qualitative research, computer-assisted qualitative
data analysis software
School psychology researchers have many
available tools in order to complete successfully
their research. For example, it is commonly
known that school psychology researchers can
utilize published surveys, web-based data collection tools (e.g., Zoomerang), and quantitative
computer programs (e.g., SPSS) to assist with
their analyses. These tools are extremely beneficial for school psychology researchers because
they assist them with many of the steps required
in a quantitative research study. Unfortunately,
available tools for qualitative research studies
are less commonly known, which may contribute to there being relatively few purely qualitative studies published in the area of school
psychology (Powell, Mihalas, Onwuegbuzie,
Suldo, & Daley, 2008). Indeed, Powell et al.
(2008) documented that of the 438 empirical
articles published in the four leading school
psychology journals (i.e., School Psychology
Quarterly, School Psychology Review, Psychology in the Schools, Journal of School Psychol-
ogy) between 2001 and 2005, only 6 represented qualitative research articles. Yet, utilizing these tools, such as QDA Miner,
Ethnograph, and NVivo (QSR International Pty
Ltd, 2008), can increase the rigor of a qualitative study (Onwuegbuzie & Leech, 2007), especially those with large data sets.
For many school psychology researchers, the
most complicated step in the research process is
that of analysis (Gliner, Morgan, & Leech,
2009; Leech & Onwuegbuzie, 2007). Knowing
which analysis to use with different types of
research questions and various types of data can
be very confusing, especially for a novice researcher. This is even a more prominent issue
with qualitative data because many school psychology researchers have not had much training
in qualitative methods, and they are often not
knowledgeable about different qualitative data
analysis techniques (Leech & Goodwin, 2008).
Consistent with our assertion, Powell et al.
(2008) reported that of the 57 National Association of School Psychology-approved graduatelevel school psychology programs, only 1
(1.75%) appeared to require that students enroll
in one or more qualitative courses, and 11
(19.3%) appeared to offer one or more qualitative courses as an elective.
For school psychologists who conduct qualitative research, there is available guidance and
tools to assist in analysis. When looking for
Nancy L. Leech, School of Education and Human Development, University of Colorado Denver; Anthony J. Onwuegbuzie, Department of Educational Leadership and
Counseling, Sam Houston State University.
Correspondence concerning this article should be addressed to Nancy L. Leech, University of Colorado Denver,
School of Education and Human Development, Campus
Box 106, PO Box 173364, Denver, CO 80217. E-mail:
[email protected]
70
QUALITATIVE ANALYSIS COMPUTER TOOLS
guidance, there are numerous texts wherein the
authors discuss qualitative research in general
(e.g., Eisner, 1998; Glesne & Peshkin, 1992);
yet, many of these texts include only one chapter on data analysis (e.g., Berg, 2004; Bogdan &
Biklen, 2003; Creswell, 2007; Schram, 2003;
Shank, 2002). There are several textbooks that
focus solely on qualitative data analysis (Coffey
& Atkinson, 1996; Dey, 1993; Grbich, 2007;
Miles & Huberman, 2004; Phillips & Jorgensen, 2002; Silverman, 2001). Yet, all of
these texts, with a few exceptions (e.g., Grbich,
2007; Miles & Huberman, 1994) focus on a
singular analysis (e.g., discourse analysis; Phillips & Jorgensen, 2002). Therefore, these texts
do not present a comprehensive review of
multiple types of available qualitative data
analysis techniques, and none of these texts
present how to conduct these analyses using
computer software.
Leech and Onwuegbuzie (2007) go further
than do most authors of these textbooks by
describing seven types of analyses, namely,
constant comparison analysis, classical content
analysis, keyword-in-context, word count, domain analysis, taxonomic analysis, and componential analysis; and they outline how to conduct each manually. These authors have also
created a compendium of 18 qualitative analyses to assist the school psychology researcher in
choosing the appropriate analysis for their
works (Leech & Onwuegbuzie, 2008).
Fortunately, such guides (e.g., Leech & Onwuegbuzie, 2007, 2008) can assist the school
psychology researcher with conducting qualitative analyses manually. Yet, with large data
sets, conducting qualitative data analysis manually typically is not practical or desirable. Over
the past decade or so, the availability of computer software to conduct qualitative data analysis has increased (Ulin, Robinson, & Tolley,
2005). Today, there are programs such as QDA
Miner, Ethnograph, NVivo (QSR International
Pty Ltd, 2008), and Atlas/ti to assist researchers
with their analyses. These programs, in many
respects, are very similar to one another and
facilitate many of the same analyses to be conducted; yet, each tends to have its own unique
features (Fielding & Lee, 1998; Tesch, 1990;
Weitzman & Miles, 1995). Using a computerassisted qualitative data analysis software
(CAQDAS) program can take qualitative data
analysis much further than is possible compared
71
to conducting the analysis manually (Bazeley,
2006, 2007; Fielding & Lee, 1998; Kelle, 1996;
Tesch, 1990; Weitzman & Miles, 1995). For
example, these programs assist the researcher in
recording, storing, indexing, sorting, and coding
qualitative data (Morse & Richards, 2002). One
especially helpful feature of CAQDAS is their
ability efficiently to compare categories and
codes in a relatively short amount of time
(Bazeley, 2006).
Many researchers who use qualitative data
analyses software typically use the software to
conduct some form of constant comparison
analysis (Glaser & Strauss, 1967; Strauss &
Corbin, 1998). Doing so limits the researcher to
finding codes throughout the dataset; other
types of relationships in the data are not identified and might be overlooked. Computer software tools are capable of assisting the qualitative researcher with multiple types of analyses,
so that the underlying theories and relationships
in the data can emerge.
It is important to keep in mind that when
conducting qualitative research, the researcher
is the main tool for analysis (Denzin & Lincoln,
2005). Thus, CAQDAS programs, along with
all types of analysis software (e.g., SPSS, SAS),
do not analyze the data for the researcher.
Rather, the researcher utilizes the computer program to assist in the analysis.
Table 1
Types of Qualitative Research Designs
●
●
●
●
●
●
●
●
●
●
●
●
●
●
●
●
●
●
●
●
Ethnography
Auto-ethnography
Life history
Oral history
Ethnomethodology
Case study
Participant observation
Field research or field study
Naturalistic study
Phenomenological study
Ecological descriptive study
Descriptive study
Symbolic interactionist study
Microethnography
Interpretive research
Action research
Narrative research
Historiography
Literary criticism
Grounded theory
72
LEECH AND ONWUEGBUZIE
Table 2
Using NVivo To Conduct Constant Comparison Analysis
If a node exists that you would like to reuse:
Highlight selected text.
Right click to open a list of choices.
Select Code Selection.
Select At Existing Nodes. The Select Project Items window will appear.
Check the box next to the node you would like to reuse.
Click on OK. Your selected text is now coded.
If there is not an existing node to reuse:
Highlight selected text.
Right click to open a list of choices.
Select Code Selection.
Select At New Node. The New Node window will appear.
Type the name of the new node in the box next to Name. You can also include a description of the node under
Description.
Click on OK. Your selected text is now coded.
Once your text is coded, you can create Tree Nodes. These are groupings of your Free Nodes.
First, click on Nodes (located in the bottom left hand corner). Your Free Nodes will be displayed.
Look through your free nodes and identify nodes that are similar. If you are unsure, you can double click on the
node to bring up the data that have been coded with the node.
Highlight and drag your free nodes that are similar over to Tree Node (located in the upper left hand corner).
Once you have moved all the similar free nodes, click on Tree Nodes. The Tree Nodes will now be displayed.
Right click and select New Tree Node. Type in the name of your new Tree Node. Then, click on the nodes that are
included in this Tree Node and drag them into the new category.
Once your Tree Nodes are organized:
Each Tree Node can then be written as a theme (perform this step outside of the NVivo program).
To see the frequency of used codes in one source:
Click on View ⫽ Coding Stripes.
Select with type of strips you would like to view (None, Selected Items, Nodes Most Coding, Nodes Least Coding,
Nodes Recently Coding). The coding stripes will appear to the right of the data window.
Unfortunately, there is little guidance for
school psychology researchers connecting the
available types of analysis with CAQDAS programs. The excellent textbooks written by Bazeley and Richards (2000) and Bazeley (2007)
present information on how to use NVivo, but
do not discuss the multiple types of available
data analysis techniques and how to conduct
each type with CAQDAS programs. More recently, a few authors have examined the use of
qualitative data analysis software (Dennis &
Bower, 2008; Peters & Wester, 2006) in relation
to analysis, but none of them provide step-bystep guidance in conducting specific traditional
qualitative data analysis techniques. Indeed, to
date, no qualitative software provides explicit
guidelines as to how to conduct an array of
traditional qualitative data analyses. As such,
analysts have difficulty in tailoring their computer-assisted qualitative data analysis techniques to specific analyses of interest (e.g., constant comparison analysis) (cf. Onwuegbuzie,
Leech, et al., 2009). For example, an analysis of
manuals of leading qualitative software programs (e.g., NVivo, Atlas-ti) revealed no explicit information as to how to use the software
to facilitate a constant comparison analysis.
This is surprising, considering this analysis is
one of the most utilized analyses undertaken by
qualitative researchers (Leech, 2004) because
not only does this analytical technique allow
qualitative researchers to analyze the four major
sources of data in qualitative research—namely,
talk, observations, drawings/photographs/
videos, and documents (Leech & Onwuegbuzie,
2008)— but it also allows virtually any particular size or unit of text to be analyzed (e.g., one
paragraph, one transcript, one document, multiple documents).
With this in mind, the purpose of this paper is
to outline seven types of qualitative data analysis, specifically constant comparison analysis,
classical content analysis, keyword-in-context,
word count, domain analysis, taxonomic analysis, and componential analysis; to present stepby-step guidance for conducting these analyses
QUALITATIVE ANALYSIS COMPUTER TOOLS
Figure 1.
73
Constant comparison analysis: Coding stripes.
with a CAQDAS program; and to present
screenshots of the data analysis process. These
seven techniques for analysis were chosen
based on their being the earliest formalized
qualitative data analysis techniques (e.g., constant comparison analysis; Glaser & Strauss,
1967; domain analysis, taxonomic analysis,
componential analysis; Spradley, 1979; keyword-in-context; Luhn, 1960; classical content
analysis; Berelson, 1952) and also some of the
most commonly used analysis (e.g., constant
comparison analysis). In fact, of the 60 qualitative data analysis procedures identified by Onwuegbuzie, Leech, and Collins (2010), these
seven analytical techniques are among the oldest. The qualitative data analysis program
NVivo (QSR International Pty Ltd, 2008) was
chosen as the CAQDAS program because it is
commonly used by educational researchers; yet,
these analyses can be conducted with other
CAQDAS programs. It is our hope that providing a clear step-by-step process for conducting
these analyses with NVivo, along with real data
that have been analyzed, will assist school psychology researchers to increase the rigor of their
qualitative data analysis procedures.
Descriptions and Computer Guides of a
Variety of the Available Analysis Tools
To help the school psychology researcher in
undertaking analysis of large sets of qualitative
data, CAQDAS programs, such as NVivo, can
be utilized. Seven types of analysis will be
presented, namely, constant comparison analysis, keywords-in-context, word count, classical
content analysis, domain analysis, taxonomic
analysis, and componential analysis. For each
type of analysis, we will present a guide for
using NVivo software and figures of what will
be seen when using the computer program. It is
important to choose the analytical techniques,
considering which analysis will be helpful understanding the data at a deeper level. Regardless of the type of qualitative data (e.g., interview data, survey data, observational data,
personal journals, diaries, permanent records,
transcription of meetings) or the type of research design (see Table 1), NVivo can be used
to conduct the analysis.
Leech and Onwuegbuzie (2007) present a
framework for choosing among the seven analyses. Once an analysis has been chosen and it
74
LEECH AND ONWUEGBUZIE
Figure 2.
Constant comparison analysis: Tree nodes and associated free nodes.
has been determined that using qualitative data
analysis software would be helpful, the guidelines presented will assist the school psychology researcher in conducting the analysis. In
order to conduct these analyses using NVivo, it
would be best to have rudimentary knowledge
of the program. A few words that are unique to
NVivo, and which are helpful to understand,
include nodes, tree nodes, and free nodes.
Nodes are similar to codes in constant comparison analysis (described in detail below). Thus,
nodes are what a researcher uses to place meaning on different parts of the text. Tree nodes are
groupings of nodes. As more nodes are created,
the researcher can organize the nodes into tree
nodes. Finally, free nodes are nodes that have
Table 3
Using NVivo To Conduct Keyword-In-Context (File Under Queries)
● Click on the Queries tab on the left bottom of the screen. Or on the main menu, click on the Explore tab and then
select New Query.
● The working window (above the data window) will be blank if this is the first time you have run a query. If it is not
the first time, the past queries will be listed.
● Click on the Explore tab and then select Queries.
● Click on New Query. Select the type of Query you wish to run (Text Search, Coding, Compound, Word Frequency,
Matrix Coding, Coding Comparison, Group).
● To conduct a KWIC analysis, click on Text Search. The Text Search Query window will open.
● In the Search for box type in the word for which you wish to search.
● Click on Run. A new window will open with the results. A list of sources will be given that include the searched
word. You can click on the specific source to see where each word is (it will be highlighted in the text) and the
words that come before and after the keyword.
● If you wish to save your Query, click on Explore ⫽ Last Run Query.
● The Text Search Query Properties window will appear. Check the box next to Add To Project
● Type the name of the query in the box next to Name. You can include a description of the query in the box next to
Description.
● Click on OK. The new query will be listed in the Queries window.
QUALITATIVE ANALYSIS COMPUTER TOOLS
Figure 3.
75
Keyword-In-Context: Query searching for the keyword “school.”
not been added to a tree. In the following sections, the seven analysis techniques are presented, along with guidelines for utilizing
NVivo software for each type of analysis. Finally, real data from Hess, Molina, and
Kozleski (2006) have been analyzed and screenshots of what would appear with NVivo8 are
included.
Constant Comparison Analysis
One of the most commonly used qualitative
data analysis techniques is constant comparison
analysis developed by Glaser and Strauss
(1967). Table 2 presents guidelines for using
NVivo to conduct an analysis using constant
comparison.
Figure 1 shows one of the excerpts from the
data. In the right bottom pane, the codes can be
seen as stripes. These stripes correspond with
the text that has been coded. For this set of data,
there are eight codes. We have highlighted the
text “I am his advocate. I have to speak
up . . . say, okay, wait a minute, slow down,
what does that mean, what did you say?” that
was coded as “advocate.” The stripes help the
researcher to see what text has been coded with
the different codes. Figure 2 presents Tree
Nodes. This is a list of the codes after they
have been grouped together. For example, with
these data, one theme that could be found from
the codes under “IEP meeting” might be “IEP
meetings can be an emotional experience that is
difficult to understand with many different people involved.”
Keywords-in-Context
When a school psychology researcher is interested in how participants use language, keywords-in-context (KWIC; Fielding & Lee,
1998) is a data analysis method that can assist in
increasing their understanding. When the school
psychology researcher has data that include
short, one-phrase responses or when there are
specific words of interest that the researchers
would like to understand better how they are
utilized by participants, KWIC can be a beneficial analysis. It is important to utilize multiple
words around a keyword because using too few
76
LEECH AND ONWUEGBUZIE
Figure 4.
Keyword-In-Context: Seeing the context around each keyword.
words can create a loss of content around the
keyword.
Table 3 presents guidelines for using NVivo
to conduct an analysis using KWIC. Figure 3
presents the word count for the keyword
“school.” We identified three participants’ responses that included the keyword. Figure 4
shows the responses, which indicate the following phrases were used with the keyword
“school”—(a) “school really scares the heck out
of him,” (b) “he goes to a rough kind of school,”
and (c) “you know when you are in a school that
has a lot of special needs kids.”
Word Count
School psychology researchers who are interested in understanding differences among
participants may want to conduct a word
count. Instead of using terms in the final
report of a study such as many, most, or some,
qualitative school psychology researchers can
obtain the actual counts to report in addition
to—as opposed to instead of—the descrip-
tions of the phenomenon (Sandelowski,
2001). Although use of word count is not
always justified, as surmised by Miles and
Huberman (1994), there are at least three reasons for counting in qualitative data analysis:
(a) to identify patterns more easily, (b) to
verify a hypothesis, and (c) to maintain analytic integrity.
Table 4 presents guidelines for using NVivo
to conduct an analysis using word count. Figure
5 presents the results of a word count analysis.
We requested a count of all the words in the
data and we identified that the word “he” was
used the most (46 times/5.98% of the words)
and “different” was utilized seven times/0.91%
of the words.
Classical Content Analysis
Classical content analysis is similar to constant comparison analysis, except with classical content analysis themes or codes are
counted, whether they are created a priori or a
posteriori. With datasets that have codes
QUALITATIVE ANALYSIS COMPUTER TOOLS
77
Table 4
Using NVivo To Conduct Word Count
To locate specific words in the data:
Click on the Queries tab on the left bottom of the screen. Or on the main menu, click on the Explore tab and then
select New Query.
The working window (above the data window) will be blank if this is the first time you have run a query. If it is not
the first time, the past queries will be listed.
Right click or click on the Explore tab and select New Query.
Click the Text Search option. The Text Search Query dialog box will be displayed.
Under the Text Search Criteria tab, in the Search for box, type the words you wish to count.
If you want to save the query, click the Add to Project checkbox at the top of the dialog. Enter a name and
description in the General tab.
Click on Run.
To count the number of times a specific word is found in the data:
Click on the Queries tab on the left bottom of the screen. Or on the main menu, click on the Explore tab and then
select New Query.
The working window (above the data window) will be blank if this is the first time you have run a query. If it is not
the first time, the past queries will be listed.
Right click or click on the Explore tab and select New Query.
Click the Word Frequency option. The Word Frequency Query dialog box will be displayed.
You can select the text to search (all the data or a subset of the data).
If you want to save the query, click the Add to Project checkbox at the top of the dialog. Enter a name and
description in the General tab.
Click on Run. The number of times each word is found in the data will be displayed.
emerging multiple times, classical content
analysis can assist the school psychology researcher in understanding what concepts were
predominantly discussed. When conducting a
classical content analysis, codes can be identified either deductively, inductively, or
abductively.
Table 5 presents guidelines for using NVivo to
conduct classical content analysis. Figure 6 presents the tree nodes and free nodes associated with
each. It can be seen that the code “advocate” was
used a total of four times in two sources.
Domain Analysis
Domain analysis is based on the concept that
language incorporates symbols (Spradley, 1979).
A symbol is defined as “an act, sound, or object
having cultural significance and the capacity to
excite or objectify a response” (Merriam-Webster,
2009). Symbols include three basic elements: (a)
the symbol itself, which Spradley (1979) labeled
the cover term; (b) to what the symbol refers,
which Spradley (1979) named the included term;
and (c) the relationship between the symbol and
the referent, which Spradley (1979) gave the designation of the semantic relationship.
When conducting a domain analysis, a school
psychology researcher would search for cultural
knowledge through what Spradley (1979) calls
domains. These domains are extracted via identifying a set of cover terms, included terms, and the
semantic relationships. Spradley (1979) presented
nine semantic relationships. Through a six-step
process domains are identified and labeled.
Table 6 presents guidelines for using NVivo to
conduct a domain analysis. Figure 7 presents results of a domain analysis utilizing the domain
“IEP.” In conducting the domain analysis, the
researcher began by choosing a domain: in this
example, the domain is “IEP.” Next, the researcher searched the data using the semantic relationship of attributive which is described as “X
is defined with respect to one or more attributes of
Y” (Spradley, 1979, p. 110). Thus, the researcher
read through the data and found attributes of an
IEP, such as “different people” and “took years.”
Shown in the right hand box are the attributes
from the data that include this domain.
Taxonomic Analysis
After conducting a domain analysis, if a
school psychology researcher wants or needs
further analysis, a taxonomic analysis can be
conducted. Taxonomic analysis assists the researcher in understanding how specific words
have been utilized by the participants. This
78
LEECH AND ONWUEGBUZIE
Figure 5.
Word count analysis.
analysis is based on the concept that words can
have different meanings and distinct connotations for each person. Spradley (1979) defined a taxonomy as a classification system
that sorts the domains through a flowchart
that presents the relationships among the
terms in the domain.
Table 7 presents guidelines for using NVivo
to conduct a taxonomic analysis. Figure 8 presents the taxonomy for one participant’s response regarding the IEP meeting. To generate
Figure 8, the researcher first conducted a domain analysis to identify the domain “IEP meeting” and the terms that were in relationship to
the domain (i.e., difficult to sit, sat there crying,
etc.). Next, the researcher utilized NVivo to
draw the relationship via a flowchart. As shown
in the figure, the parent portrayed the following
concepts for the IEP meeting: (a) it was difficult
to sit, (b) emotional (i.e., crying), (c) feeling
alone, and (d) being rushed.
Componential Analysis
If a school psychology researcher is interested in understanding the relationship among
words used by a participant(s), and after a domain analysis has been completed, a componential analysis can be conducted. The advantage
to conducting a componential analysis is that
the results can assist the school psychology
researcher in finding and presenting the similarities and differences among participants’
understandings.
Table 8 presents guidelines for using
NVivo to conduct a componential analysis.
Table 5
Using NVivo To Conduct Classical Content Analysis
● Click on Nodes in the left hand bottom corner. Select either Free Nodes or Tree Nodes under Nodes. We selected
Tree Nodes because most of our codes were included here.
● In the working window the codes will appear, along with the number of times each was used.
QUALITATIVE ANALYSIS COMPUTER TOOLS
Figure 6.
79
Classical content analysis.
Figure 9 presents the componential analysis
where the researcher was interested in understanding how the different participants’ responses varied in their use of the following
five concepts: (a) attending classes without
support, (b) autism, (c) coping socially, (d)
being mainstreamed, and (e) parents’ use of
email. As seen in the analysis, autism was
found in four of the data sources, whereas
being mainstreamed and parents’ use of email
was extracted from one data source. The researcher may choose to go back to the participants to understand better these last two
concepts.
Where to Go From Here
School psychology researchers have many
tools available to assist them with their research, regardless of the type of research conducted (i.e., quantitative, qualitative, mixed). It
is unfortunate that more school psychology researchers do not publish qualitative studies—
and perhaps one reason for this is the difficulty
in analyzing large qualitative data sets. Thus,
the purpose of this paper was briefly (i.e., within
the space constraints of School Psychology
Quarterly) to outline seven types of qualitative
data analysis techniques, specifically constant
Table 6
Using NVivo To Conduct Domain Analysis
This analysis is conducted similarly to keywords-in-context.
● Find the keyword (domain) and then look for cover term, included term, and semantic relationship.
● Alternatively, once you have identified your cover terms, you can make each cover term a free node and then include
the cover terms as the text within the nodes and use the memo function to record the semantic relationship.
● Alternatively still, using Spradley’s (1979) nine semantic relationships (i.e., strict inclusion, spatial, cause-effect,
rationale, location for action, function, means-end, sequence, and attribution), you can set up a node for each type of
semantic relationship and then code accordingly.
80
LEECH AND ONWUEGBUZIE
Figure 7.
Domain analysis.
comparison analysis, classical content analysis,
keyword-in-context, word count, domain analysis, taxonomic analysis, and componential
analysis; and to present step-by-step guidance
and screenshots for conducting these analyses
using a CAQDAS program.
There are four important caveats that it
behooves us to mention at this point. First, we
Table 7
Using NVivo To Conduct Taxonomic Analysis (File Under Models)
● Click on the Models tab on the left bottom of the screen or select the Model tab at the top of the screen.
● The working window (above the data window) will be blank if this is the first time you have created a model. If it is
not the first time, the past models will be listed.
● Place the cursor in the Models pane and right click to open a list of choices.
● Select New Model. The New Model window will appear.
● Type in the name of the new model next to Name. You can include a description of the query in the box next to
Description.
● Click on OK. The Model window will appear in the bottom half of the screen. If you wish to have a bigger window
in which to work, you can click in the Model window then click on Window ⫽ Docked. This will create a new
separate window.
To create the model:
● Click in the working area to open the Model tab. Select Add Project Items . . .
● The Select Project Items window will open.
● From the left hand box, select the words Free Nodes or Tree Nodes, whichever you wish to add to the model. This
will change the choices in the right box.
● From the right hand box, add a check to the nodes you wish to use. If you have set up tree nodes, one tree node will
produce a taxonomy.
● Click on OK. The Add Associated Data window will open.
● Select Children. This will create a model with the Tree Node name as the top and the underlying codes as the
bottom.
QUALITATIVE ANALYSIS COMPUTER TOOLS
Figure 8.
81
Taxonomic analysis.
are not suggesting that all qualitative data
should be analyzed via some form of CAQDAS program. However, we do believe that,
especially for large qualitative datasets—
which typifies a significant proportion of
qualitative studies—CAQDAS programs provide a useful tool for recording, storing, indexing, and sorting qualitative data (Morse &
Table 8
Using NVivo To Conduct Componential Analysis
● Click on the Queries tab on the left bottom of the screen.
● The working window (above the data window) will be blank if this is the first time you have run a query. If it is not
the first time, the past queries will be listed.
● Right click to open a list of choices.
● Click on New Query. Select the Matrix Coding (alternately you can select Explore ⫽ New Query ⫽ Matrix Coding).
The Matrix Coding Query window will open.
● Under Define More Rows, you can select what you would like in your rows.
● Once you select the type of information, click on Select and you can choose the specific pieces you would like to
include.
● Click on Add to List.
● Click on the Columns tab.
● Under Define More Columns, you can select what you would like in your rows.
● Once you select the type of information, click on Select and you can choose the specific pieces you would like to
include.
● Click on Add to List.
● Click on Run. A new window will open with the results.
● If you wish to save your Query, click on Explore ⫽ Last Run Query.
● The Matrix Coding Query Properties window will appear. Check the box next to Add To Project
● Type the name of the query in the box next to Name. You can include a description of the query in the box next to
Description.
● Click on OK. The new query will be listed in the Queries window.
82
LEECH AND ONWUEGBUZIE
Figure 9.
Componential analysis.
Richards, 2002). Indeed, as noted by Bazeley
(2007).
The use of a computer is not intended to supplant
time-honored ways of learning from data, but to
increase the effectiveness and efficiency of such
learning. The computer’s capacity for recording,
sorting, matching, and linking can be harnessed by
the researcher to assist in answering their research
questions from the data, without losing access to the
source data or contexts from which the data have
come (p. 2)
Our second caveat is that we are not suggesting that all qualitative researchers who
decide to use CAQDAS programs should use
NVivo. In fact, we encourage school psychology researchers to explore other CAQDAS
programs, which include the following: ATLAS.ti 6 (http://www.atlasti.com/), HyperRESEARCH
2.8.3 (http://www.researchware.com/products/
hyperresearch.html), MAXQDA 2007 (http://
www.maxqda.com/), QDA Miner 3.2 (http://www
.provalisresearch.com/QDAMiner/QDAMiner
Desc.html), Qualrus (http://www.ideaworks.com/
qualrus/index.html?gclid ⫽ CLn83KzDtp0CFZJM5QodzReMiw), and Transana 2.30 (http://
www.transana.org/). However, we selected NVivo
because it is one of the most widely used CAQDAS
programs, with as many as 400,000 users in more
than 150 countries (QSR International Pty Ltd,
2009).
Third, the NVivo commands that we provide in the tables do not represent the only
way to conduct each of the selected seven
qualitative analysis programs. In fact, we encourage school psychology qualitative researchers not only to explore other ways to
use NVivo to conduct each of these analyses,
but also to document and share the results of
their explorations. Fourth, as declared by
Leech and Onwuegbuzie (2007), CAQDAS
programs can help researchers to analyze
their data, but they cannot analyze the data for
researchers. Further, in using CAQDAS programs, flexibility, creativity, insight, and intuition should never be replaced by a systematic and mechanical analysis of qualitative
data (Dey, 1993). The researcher is the main
tool for analysis, regardless of whether a
computer program is used to assist in the
analysis (Denzin & Lincoln, 2005).
Despite these caveats, we believe that providing a clear, step-by-step process for conducting qualitative data analyses with NVivo
hopefully will assist school psychology researchers in conducting rigorous studies that
can be published.
QUALITATIVE ANALYSIS COMPUTER TOOLS
References
Bazeley, P. (2006). The contribution of computer
software to integrating qualitative and quantitative
data and analyses. Research in the Schools, 13(1),
64 –74.
Bazeley, P. (2007). Qualitative data analysis with
NVivo qualitative project book. Thousand Oaks,
CA: Sage.
Bazeley, P., & Richards, L. (2000). The NVivo qualitative project book. Thousand Oaks, CA: Sage.
Berelson, B. (1952). Content analysis in communicative research. New York, NY: Free Press.
Berg, B. L. (2004). Qualitative research methods for
the social sciences (5th ed.). Boston, MA: Pearson.
Bogdan, R. C., & Biklen, S. K. (2003). Qualitative
research for education: An introduction to theories
and methods (4th ed.). Boston, MA: Pearson.
Coffey, A., & Atkinson, P. (1996). Making sense of
qualitative data: Complementary research strategies. Thousand Oaks, CA: Sage.
Creswell, J. W. (2007). Qualitative inquiry and research design: Choosing among the five traditions
(2nd ed.). Thousand Oaks, CA: Sage.
Dennis, B. W., & Bower, T. (2008). Using content
analysis software to analyze survey comments.
Libraries and the Academy, 8, 423– 437.
Denzin, N. K., & Lincoln, Y. S. (2005). Introduction:
The discipline and practice of qualitative research.
In N. K. Denzin & Y. S. Lincoln (Eds.), The Sage
handbook of qualitative research (3rd ed., pp.
1–32). Thousand Oaks, CA: Sage.
Dey, I. (1993). Qualitative data analysis: A userfriendly guide for social scientists. London, England: Routledge.
Eisner, E. W. (1998). The enlightened eye: Qualitative inquiry and the enhancement of educational
practice. Upper Saddle River, NJ: Merrill Prentice
Hall.
Fielding, N. G., & Lee, R. M. (1998). Computer
analysis and qualitative research. Thousand Oaks,
CA: Sage.
Glaser, B. G., & Strauss, A. L. (1967). The discovery
of grounded theory: Strategies for qualitative research. Chicago, IL: Aldine.
Glesne, C., & Peshkin, A. (1992). Becoming qualitative researchers: An introduction. White Plains,
NY: Longman.
Gliner, J. A., Morgan, G. A., & Leech, N. L. (2009).
Research methods in applied settings: An integrated approach to design and analysis (2nd ed.).
New York, NY: Taylor & Francis.
Grbich, C. (2007). Qualitative data analysis: An introduction. Thousand Oaks, CA: Sage.
Hess, R., Molina, A., & Kozleski, E. B. (2006). Until
somebody hears me: Parental voice and advocacy
in special education decision-making. British
83
Journal of Special Education, 33, 148 –157. doi:
10.1111/j. 1467– 8578.2006.00430.x
Kelle, U. (Ed.). (1996). Computer-aided qualitative
data analysis. Thousand Oaks, CA: Sage.
Leech, N. L. (2004). Types of qualitative and quantitative analyses used by faculty researchers. Unpublished manuscript, University of Colorado
Denver.
Leech, N. L., & Goodwin, L. D. (2008). Building a
methodological foundation: Doctoral- level methods courses in colleges of education. Research in
the Schools, 15(1), 1– 8.
Leech, N. L., & Onwuegbuzie, A. J. (2007). An array
of qualitative analysis tools: A call for data analysis triangulation. School Psychology Quarterly, 22, 557–584. doi:10.1037/1045–3830
.22.4.557.
Leech, N. L., & Onwuegbuzie, A. J. (2008). Qualitative data analysis: A compendium of techniques
for school psychology research and beyond.
School Psychology Quarterly, 23, 587– 604. doi:
10.1037/1045–3830.23.4.587
Luhn, H. P. (1960). Keyword-in-context index for
technical literature. American Documentation, 11,
288 –295.
Merriam-Webster. (2009). Merriam-Webster Online
Dictionary. Retrieved from http://www.merriamwebster.com/dictionary/symbol
Miles, M. B., & Huberman, A. M. (1994). Qualitative data analysis: An expanded sourcebook (2nd
ed.). Thousand Oaks, CA: Sage.
Morse, J. M., & Richards, L. (2002). Read me first for
a user’s guide to qualitative methods. Thousand
Oaks, CA: Sage.
Onwuegbuzie, A. J., & Leech, N. L. (2007). Validity
and qualitative research: An oxymoron? Quality &
Quantity: International Journal of Methodology, 41, 233–249. doi:10.1007/s11135-006 –
9000-3.
Onwuegbuzie, A. J., Leech, N. L., & Collins,
K. M. T. (2010). Toward a new era for conducting
mixed analyses: The role of quantitative dominant
and qualitative dominant crossover mixed analyses. In W. P. Vogt & M. Williams (Eds.), The
handbook of methodological innovation. Thousand
Oaks, CA: Sage. Manuscript submitted for
publication.
Onwuegbuzie, A. J., Leech, N. L., Slate, J. R., Stark,
M., Sharma, B., Frels, R., Harris, K., & Combs,
J. P. (2009, February). A model for teaching and
learning qualitative research. Paper presented at
the annual meeting of the Southwest Educational
Research Association, San Antonio, TX.
Peters, V., & Wester, F. (2006). How qualitative data
analysis software may support the qualitative analysis process. Quality & Quantity, 41, 635– 659.
doi:10.1007/s11135-006 –9016-8
84
LEECH AND ONWUEGBUZIE
Phillips, L. J., & Jorgensen, M. W. (2002): Discourse
analysis as theory and method. Thousand Oaks,
CA: Sage.
Powell, H., Mihalas, S., Onwuegbuzie, A. J., Suldo,
S., & Daley, C. E. (2008). Mixed methods research
in school psychology: A mixed methods investigation of trends in the literature. Psychology in the
Schools, 45, 291–309. doi:10.1002/pits. 20296
QSR International Pty Ltd. (2008). NVIVO: Version 8. Reference guide. Doncaster Victoria, Australia: Author.
QSR International Pty Ltd. (2009). Our history. Retrieved from http://www.qsrinternational.com/
about-qsr_history.aspx
Sandelowski, M. (2001). Real qualitative researchers
don’t count: The use of numbers in qualitative
research. Research in Nursing & Health, 24, 230 –
240.
Schram, T. H. (2003). Conceptualizing qualitative inquiry: Mindwork for fieldwork in education and the
social sciences. Upper Saddle River, NJ: Pearson.
Shank, G. D. (2002). Qualitative research: A personal skills approach. Upper Saddle River, NJ:
Merrill Prentice Hall.
Silverman, D. (2001). Interpreting qualitative data.
London, England: Sage.
Spradley, J. P. (1979). The ethnographic interview.
Fort Worth, TX: Holt, Rinehart & Winston.
Strauss, A., & Corbin, J. (1998). Basics of qualitative research: Techniques and procedures for
developing grounded theory. Thousand Oaks,
CA: Sage.
Tesch, R. (1990). Qualitative research: Analysis
types and software tools. London, England:
Falmer.
Ulin, P. R., Robinson, E. T., & Tolley, E. E. (2005).
Qualitative methods in public health: A field guide
for applied research. San Francisco, CA: JosseyBass.
Weitzman, E., & Miles, M. B. (1995). Computer
programs for qualitative data analysis. Thousand
Oaks, CA: Sage.
Online First Publication
APA-published journal articles are now available Online First in the PsycARTICLES
database. Electronic versions of journal articles will be accessible prior to the print
publication, expediting access to the latest peer-reviewed research.
All PsycARTICLES institutional customers, individual APA PsycNET威 database package subscribers, and individual journal subscribers may now search these records as an
added benefit. Online First Publication (OFP) records can be released within as little as 30
days of acceptance and transfer into production, and are marked to indicate the posting
status, allowing researchers to quickly and easily discover the latest literature. OFP
articles will be the version of record; the articles have gone through the full production
cycle except for assignment to an issue and pagination. After a journal issue’s print
publication, OFP records will be replaced with the final published article to reflect the
final status and bibliographic information.


© Copyright 2026