
Graham, Yvette, Nitika Mathur and Timothy Baldwin (to appear
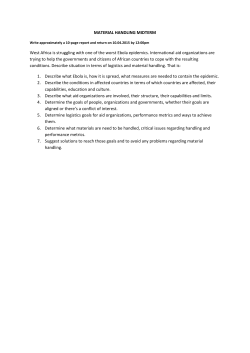
Accurate Evaluation of Segment-level Machine Translation Metrics
†
Yvette Graham†‡
Nitika Mathur†
Timothy Baldwin†
Department of Computing and Information Systems, The University of Melbourne
‡
ADAPT Research Centre, Trinity College Dublin
[email protected], [email protected], [email protected]
Abstract
Evaluation of segment-level machine translation metrics is currently hampered by: (1) low
inter-annotator agreement levels in human assessments; (2) lack of an effective mechanism
for evaluation of translations of equal quality;
and (3) lack of methods of significance testing
improvements over a baseline. In this paper,
we provide solutions to each of these challenges and outline a new human evaluation
methodology aimed specifically at assessment
of segment-level metrics. We replicate the human evaluation component of W MT-13 and
reveal that the current state-of-the-art performance of segment-level metrics is better than
previously believed. Three segment-level metrics — METEOR , NLEPOR and SENT BLEUMOSES — are found to correlate with human
assessment at a level not significantly outperformed by any other metric in both the individual language pair assessment for Spanish-toEnglish and the aggregated set of 9 language
pairs.
1 Introduction
Automatic segment-level machine translation (MT)
metrics have the potential to greatly advance MT by
providing more fine-grained error analysis, increasing efficiency of system tuning methods and leveraging techniques for system hybridization. However, a
major obstacle currently hindering the development
of segment-level metrics is their evaluation. Human
assessment is the gold standard against which metrics must be evaluated, but when it comes to the task
of evaluating translation quality, human annotators
are notoriously inconsistent. For example, the main
venue for evaluation of metrics, the annual Workshop on Statistical Machine Translation (WMT),
reports disturbingly low inter-annotator agreement
levels and highlights the need for better human
assessment of MT. W MT-13, for example, report
Kappa coefficients ranging from 0.075 to 0.324 for
assessors from crowd-sourcing services, only increasing to between 0.315 and 0.457 for MT researchers (Bojar et al., 2013a). For evaluation of
metrics that operate at the system or document-level
such as BLEU , inconsistency in individual human
judgments can, to some degree, be overcome by aggregation of individual human assessments over the
segments within a document. However, for evaluation of segment-level metrics, there is no escaping
the need to boost the consistency of human annotation of individual segments.
This motivates our analysis of current methods of
human evaluation of segment-level metrics, and proposal of an alternative annotation mechanism. We
examine the accuracy of segment scores collected
with our proposed method by replicating components of the W MT-13 human evaluation (Bojar et
al., 2013b), with the sole aim of optimizing agreement in segment scores to provide an effective gold
standard for evaluating segment-level metrics. Our
method also supports the use of significance testing of segment-level metrics, and tests applied to
the W MT-13 metrics over nine language pairs reveal for the first time which segment-level metrics
outperform others. We have made available code for
acquiring accurate segment-level MT human evaluations from the crowd, in addition to significance
Graham, Yvette, Nitika Mathur and Timothy Baldwin (to appear) Accurate Evaluation of Segment-level Machine Translation
Metrics, In Proceedings of the 2015 Conference of the North American Chapter of the Association for Computational
Linguistics - Human Language Technologies (NAACL HLT 2015), Denver, USA.
testing competing segment-level metrics, at:
https://github.com/ygraham/
segment-mteval
2
WMT-style Evaluation of Segment-level
MT Metrics
Since 2008, the WMT workshop series has included
a shared task for automatic metrics, and as with the
translation shared task, human evaluation remains
the official gold standard for evaluation. In order
to minimize the amount of annotation work and enforce consistency between the primary shared tasks
in WMT, the same evaluations are used to evaluate MT systems in the shared translation task, as
well as MT evaluation metrics in the document-level
metrics and segment-level metrics tasks. Although
WMT have trialled several methods of human evaluation over the years, the prevailing method takes
the form of ranking a set of five competing translations for a single source language (SL) input segment from best to worst. A total of ten pairwise human relative preference judgments can be extracted
from each set of five translations. Performance of
a segment-level metric is assessed by the degree to
which it corresponds with human judgment, measured by the number of metric scores for pairs of
translations that are either concordant (Con) or discordant (Dis) with those of a human assessor, which
the organizers describe as “Kendall’s τ ”:
τ
=
|Con| − |Dis|
|Con| + |Dis|
Pairs of translations deemed equally good by a
human assessor are omitted from evaluation of
segment-level metrics (Bojar et al., 2014).
There is a mismatch between the human judgments data used to evaluate segment-level metrics
and the standard conditions under which Kendall’s
τ is applied, however: Kendall’s τ is used to measure the association between a set of observations of
a single pair of joint random variables, X (e.g. the
human rank of a translation) and Y (e.g. the metric score for the same translation). A conventional
application of Kendall’s τ would be comparison of
all pairs of values within X with each corresponding pair within Y . Since the human assessment data
is, however, a large number of separately ranked sets
of five competing translations and not a single ranking of all translations, it is not possible to compute a
single Kendall’s τ correlation.1 The formula used
to assess the performance of a metric in the task,
therefore, is not what is ordinarily understood to be
a Kendall’s τ coefficient, but, in fact, equivalent to a
weighted average of all Kendall’s τ for each humanranked set of five translations.
A more significant problem, however, lies in the
inconsistency of human relative preference judgments within data sets. Since overall scores for metrics are described as correlations, possible values
achievable by any metric could be expected to lie
in the range [−1, 1] (or “±1”). This is not the case,
and achievements of metrics are obscured by contradictory human judgments. Before any metric has
provided scores for segments, for example, the maximum and minimum correlation achievable by a participating metric can be computed as, in the case of
W MT-13:
• Russian-to-English: ±0.92
• Spanish-to-English: ±0.90
• French-to-English: ±0.90
• German-to-English: ±0.92
• Czech-to-English: ±0.89
• English-to-Russian: ±0.90
• English-to-Spanish: ±0.90
• English-to-French: ±0.91
• English-to-German: ±0.90
• English-to-Czech: ±0.87
If we are interested in the relative performance of
metrics and take a closer look at the formula used
to contribute a score to metrics, we can effectively
ignore the denominator (|Con| + |Dis|), as it is constant for all metrics. The numerator (|Con| − |Dis|)
is what determines our evaluation of the relative performance of metrics, and although the formula appears to be a straightforward subtraction of counts
of concordant and discordant pairs, due to the large
numbers of contradictory human relative preference
judgments in data sets, what this number actually
represents is not immediately obvious. If, for example, translations A and B were scored by a metric
such that metric score(A) > metric score(B), one
1
This would in fact require all (|MT systems| × |distinct
segments|) translations included in the evaluation to be placed
in a single rank order.
might expect an addition or subtraction of 1 depending on whether or not the metric’s scores agreed with
those of a human. Instead, however, the following is
added:
(max(|A > B|, |A < B|)
− min(|A > B|, |A < B|)) × d
where:
|A > B| = # human judgments where A was
preferred over B
|A < B| = # human judgments where B was
preferred over A
1 if |A < B| > |A > B|
d =
−1 if |A < B| < |A > B|
For example, translations of segment 971 for Czechto-English systems uedin-heafield and uedin-wmt13
were compared by human assessors a total of 12
times: the first system was judged to be best 4 times,
the second system was judged to be best 2 times, and
the two systems were judged to be equal 6 times.
This results in a score of 4−2 for a system-level metric that scores the uedin-heafield translation higher
than uedin-wmt13 (tied judgments are omitted), or
score of 2 − 4 in the converse case.
Another challenge is how to deal with relative
preference judgments where two translations are
deemed equal quality (as opposed to strictly better or
worse). In the current setup, tied translation pairs are
excluded from the data, meaning that the ability for
evaluation metrics to evaluate similar translations is
not directly evaluated, and a metric that manages to
score two equal quality translations closer, does not
receive credit. A segment-level metric that can accurately predict not just disparities between translations but also similarities is likely to have high utility for MT system optimization, and is possibly the
strongest motivation for developing segment-level
metrics in the first place. In W MT-13, however, 24%
of all relative preference judgments were omitted on
the basis of ties, broken down as follows:
• Spanish-to-English: 28%
• French-to-English: 26%
• German-to-English: 27%
• Czech-to-English: 25%
• Russian-to-English: 24%
•
•
•
•
•
English-to-Spanish: 23%
English-to-French: 23%
English-to-German: 20%
English-to-Czech: 16%
English-to-Russian: 27%
Although significance tests for evaluation of MT
systems and document-level metrics have been identified (Koehn, 2004; Graham and Baldwin, 2014;
Graham et al., 2014b), no such test has been proposed for segment-level metrics, and it is unfortunately common to conclude success without taking
into account the fact that an increase in correlation
can occur simply by chance. In the rare cases where
significance tests have been applied, tests or confidence intervals for individual correlations form the
basis for drawing conclusions (Aziz et al., 2012;
Machacek and Bojar, 2014). However, such tests do
not provide insight into whether or not a metric outperforms another, as all that’s required for rejection
of the null hypothesis with such a test is a likelihood
that an individual metric’s correlation with human
judgment is not equal to zero. In addition, data sets
for evaluation in both document and segment-level
metrics are not independent and the correlation that
exists between pairs of metrics should also be taken
into account by significance tests.
3
Segment-Level Human Evaluation
Many human evaluation methodologies attempt to
elicit precisely the same quality judgment for individual translations from all assessors, and inevitably
produce large numbers of conflicting assessments in
the process, including from the same individual human judge (Callison-Burch et al., 2007; CallisonBurch et al., 2008; Callison-Burch et al., 2009). An
alternative approach is to take into account the fact
that different judges may genuinely disagree, and
allow assessments provided by individuals to each
contribute to an overall estimate of the quality of a
given translation.
In an ideal world in which we had access to assessments provided by the entire population of qualified human assessors, for example, the mean of
those assessments would provide a statistic that,
in theory at least, would provide a meaningful
segment-level human score for translations. If it
were possible to collect assessments from the entire
280
140
140
140
# assessments
per translation
40
19
15
14
0.8
1.0
Table 1: Datasets used to assess translation assessment
sample size
0.6
What the law of large numbers does not tell us,
however, is, for our particular case of translation
quality assessment, precisely how large the sample
of assessments needs to be, so that the mean of
scores provides a close enough estimate to the true
mean score for any translation. For a sample mean
for which the variance is known, the required sample size can be computed for a specified standard error. However, due to the large number of distinct
translations we deal with, the variance in sample
score distributions may change considerably from
one translation to the next. In addition, the choice
as to what exactly is an acceptable standard error in
sample means would be somewhat arbitrary. On the
one hand, if we specify a standard error that’s lower
than is required, and subsequently collect more repeat assessments than is needed, we would be wasting resources that could, for example, be targeted at
the annotation of additional translation segments.
Our solution is to empirically investigate the impact on sample size of repeat assessments on the
mean score for a given segment, and base our determination of sample size on the findings. Since
we later motivate the use of Pearson’s correlation to
measure the linear association between human and
metric scores (see Section 4), we base our investigation on Pearson’s correlation.
We collect multiple assessments per segment to
create score distributions for segments for a fixed set
per language pair. This is repeated twice over the
same set of segments to generate two distinct sets
of annotations: one set is used to estimate the true
mean score, and the second set is randomly downsampled to simulate a set of assessments of fixed
sample size. We measure the Pearson correlation between the true mean score and different numbers of
# translations
raw
es−en
en−es
en−ru
en−de
0.4
Given a sufficiently large assessment sample for a given translation, the mean of assessments will provide a very good estimate of the true mean score of the translation sourced from the entire assessor population.
Language
pair
es-en
en-es
en-ru
en-de
z−score
es−en
en−es
en−ru
en−de
0.2
population we could directly compute the true mean
score for a translation segment. This is of course not
possible, but thanks to the law of large numbers we
can make the following assumption:
0
10
20
30
40
N
Figure 1: Correlation (r) of translation quality estimates
between the initial and repeat experiment runs for each of
the four language pairs from W MT-13, for sample size N
and based on raw and standardized (z) scores.
assessments for a given assessment, to ask the question: how many assessments must be collected for
a given segment to obtain mean segment scores that
truly reflects translation quality? Scores are sampled
according to annotation time to simulate a realistic
setting.
3.1
Translation Assessment Sample Size
MTurk was used to collect large numbers of translation assessments, in sets of 100 translations per assessment task (or “HIT” in MTurk parlance). The
HITS were structured to include degraded translations and repeat translations, and rated on a continuous Likert scale with a single translation assessment displayed to the assessor at one time (Graham
et al., 2014a; Graham et al., 2013). This supports
accurate quality-control as well as normalisation of
translation scores for each assessor. The assessment
3
3
−3
−2
−1
0
1
2
3
1
0
−1
−2
−3
−2
−1
0
1
2
3
0
N = 10
−1
1
2
3
0
1
2
3
1
2
3
3
3
−1
0
1
2
r = 0.97
−3
−2
−1
0
1
2
r = 0.91
−2
−1
−2
N=5
−3
−3
−2
−1
0
1
2
r = 0.86
−2
−3
N=2
3
N=1
−3
r = 0.76
−3
−3
−2
−1
0
1
2
r = 0.6
2
3
−3
−2
−1
0
1
2
r = 0.41
−3
−2
−1
0
1
N = 15
2
3
−3
−2
−1
0
N = 40
Figure 2: Plots and correlation (r) of translation quality assessments in the initial (x-axis) and replicate experiments (yaxis) for Spanish-to-English over W MT-13, where each point represents a standardized segment-level score computed
as the mean of the N individual assessments for that plot.
task was posed as a monolingual task, where assessors were asked to rate the degree to which the MT
system output adequately expressed the meaning of
the corresponding reference translation. Translations were sampled at random from the W MT-13
data sets for the four language pairs, as detailed in
Table 1. Due to low-quality assessors on MTurk
and the need for assessments solely for quality assurance purposes, the exercise required a substantial
number of individual assessments. For Spanish-toEnglish, for example, a total of (280 translations +
120 translations for quality-control purposes) × 40
assessments per translation × 2 separate data collections × ∼2 to allow for filtering of low-quality
assessors = ∼64k assessments were collected; after
quality control filtering and removing the qualitycontrol translations, around 22k assessments were
used for the actual experiment.
Figure 1 shows the Pearson correlation between
mean segment-level scores calculated for varying
numbers of assessments (N ), and the full set of assessments for the second set of assessments. For
each language pair, we calculate the correlation first
over the raw segment scores and second over standardized scores, based on the method of Graham et
al. (2014a).2 For all language pairs, although the
correlation is relatively low for single assessments,
as the sample size increases, it increases, and by
approximately N = 15 assessments, for all four
language pairs, the correlation reaches r = 0.9.
For Spanish-to-English, for which most assessments
were collected, when we increase the number of assessments to N = 40 per translation, the correlation reaches r = 0.97. Figure 2 is a set of scatter
plots for mean segment-level scores for Spanish-toEnglish rising, for varying sample sizes N .
As expected, the larger the sample size of assessments, the greater the agreement with the true mean
score, but what is more surprising is that with as few
as 15 assessments, the scores collected in the two
separate experiments correlate extremely well, and
provide what we believe to be a sufficient stability
to evaluate segment-level metrics.
2
Standardized segment scores are computed by standardizing individual raw scores according to the mean and standard
deviation of individual assessors, and then combined into mean
segment scores.
4
Segment-level Metric Evaluation
Since the scores generated by our method are continuous and segment-level metrics are also required to
output continuous-valued scores, we can now compare the scores directly using Pearson’s correlation.
Pearson’s correlation has three main advantages for
this purpose. Firstly, the measure is unit-free, so
metrics do not have to produce scores on the same
scale as the human assessments. Secondly, scores
are absolute as opposed to relative and therefore
more intuitive and ultimately more powerful; for example, we are able to evaluate metrics over the 20%
of translations of highest or lowest quality in the test
set. Finally, the use of Pearson’s correlation facilitates the measurement of statistical significance in
correlation differences.
It is important to point out, however, that moving from Kendall’s τ over relative preference judgments to Pearson’s r over absolute scores does, in
fact, change the task required of metrics in one respect: previously, there was no direct evaluation of
the scores generated by a metric, nor indeed did the
evaluation ever directly compare translations for different source language inputs (as relative preference
judgments were always relative to other translations
for the same input). Pearson’s correlation, on the
other hand, compares scores across the entire test
set.
4.1 Significance Testing of Segment-level
Metrics
With the move to Pearson’s correlation, we can
also test statistical significance in differences between metrics, based on the Williams test (Williams,
1959),3 which evaluates significance in a difference
in dependent correlations (Steiger, 1980). As suggested by Graham and Baldwin (2014), the test is
appropriate for evaluation of document-level MT
metrics since the data is not independent, and for
similar reasons, the test can also be used for evaluation of segment-level metrics.
4.2 Spanish-to-English Segment-level Metrics
We first carry out tests for Spanish-to-English
segment-level metrics from W MT-13. In our experiments in Section 3.1, we used only a sub-sample
3
Also sometimes referred to as the Hotelling–Williams test.
Metric
METEOR
NLEPOR
SENT BLEU- MOSES
DEP - REF - EX
DEP - REF - A
SIMP BLEU P
SIMP BLEU R
LEPOR
UMEANT
MEANT
TERRORCAT
r
τ
0.484
0.483
0.465
0.453
0.453
0.450
0.444
0.408
0.353
0.342
0.313
0.324
0.281
0.266
0.307
0.312
0.287
0.388
0.236
0.202
0.202
0.313
Table 2: Pearson’s correlation and Kendall’s τ between
W MT-13 segment-level metrics and human assessment
for Spanish-to-English (ES - EN ). Note that Kendall’s τ
is based on the WMT-13 formulation, and the preference
judgments from WMT-13.
of segments, so the first thing is to collect assessments for the remaining Spanish-to-English translation segments using MTurk, based on a sample of
at least 15 assessments. A total of 24 HITs of 100
translations each were posted on MTurk; after removal of low quality workers (∼50%) and quality
control items (a further 30%), this resulted in 840
translation segments with 15 or more assessments
each. The scores were standardized and combined
into mean segment scores.
Table 2 shows the Pearson’s correlation for each
metric that participated in the W MT-13 Spanish-toEnglish evaluation task, along with the Kendall’s
τ based on the original W MT-13 methodology and
relative preference assessments. Overall, when
we compare correlations using the new evaluation
methodology to those from the original evaluation,
even though we have raised the bar by assessing
the raw numeric outputs rather than translating them
into preference judgments relative to other translations for the same SL input, all metrics achieve
higher correlation with human judgment than reported in the original evaluation. This indicates that
the new evaluation setup is by no means unrealistically difficult, and that even though it was not
required of the metrics in the original task setup,
the metrics are doing a relatively good job of absolute scoring of translation adequacy. In addition,
r
0
0.2
0.4
p-value
0.6
0.8
0
1
Figure 3: Pearson’s correlation between every pair of
segment-level metric competing in the W MT-13 Spanishto-English task.
0.1
Figure 5: Evaluation of significance of increase in
correlation with human judgment between every pair
of segment-level metrics competing in the Spanish-toEnglish W MT-13 metrics task. A colored cell (i,j) indicates that system named in row i significantly outperforms system named in column j at p < 0.1, and green
cells at p < 0.05.
the new assessment reflects how well metrics score
translations of very close or equal quality, and, as
described in Section 2, ameliorates the issue of low
inter-annotator agreement as well as resolving the
original mismatch between discrete human relative
preference judgments and continuous metric scores.
Figure 3 is a heat map of the Pearson’s correlation between each pair of segment-level metrics for Spanish-to-English from W MT-13, and Figure 4 shows correspondence between scores of three
segment-level metrics with our human evaluation
data. Figure 5 displays the outcome of the Williams
significance test as applied to each pairing of competing metrics. Since the power of Williams test increases with the strength of correlation between a
pair of metrics, it is important not to conclude the
best system by the number of other metrics it outperforms. Instead, the best choice of metric for that language pair is any metric that is not signicifantly outperformed by any other metric. Three metrics prove
not to be significantly outperformed by any other
metric for Spanish-to-English, and tie for best performance: METEOR (Denkowski and Lavie, 2011),
NLEPOR (Han et al., 2013) and SENT BLEU- MOSES
(sBLEU-moses).
0.05
Metric
METEOR
NLEPOR
SENT BLEU- MOSES
SIMP BLEU P
SIMP BLEU R
LEPOR
r
0.441
0.416
0.422
0.418
0.404
0.326
Table 3: Pearson’s correlation between each W MT-13
segment-level metric and human assessment for the combined set of nine language pairs.
4.3
9 Language Pairs
Since human assessments are now absolute, scores
effectively have the same meaning across language
pairs, facilitating the combination of data across
multiple language pairs. Since many approaches
to MT are language-pair independent, the ability to
know what segment-level metric works best across
all language pairs is useful for choosing an appropriate default metric or simply avoiding having to
swap and change metrics across different language
−2
−1
0
1
2
4
2
0
TerrorCat
−4
−4
−3
r= 0.313
−2
0
LEPOR_v3.1
2
4
r= 0.408
−2
0
−4
−2
Meteor
2
4
r= 0.484
−3
−2
Human
−1
0
1
2
−3
−2
Human
−1
0
1
2
Human
Figure 4: Standardized segment-level scores for human vs. metric over the W MT-13 Spanish-to-English segment-level
metric task, for a metric achieving highest, mid-range and lowest Pearson’s correlation with human judgment.
p-value
pairs.
0
0.05
0.1
Assessments of translations were crowd-sourced
for nine language pairs used in the W MT-13 shared
metrics task:
Russian-to-English, Spanish-toEnglish, French-to-English, German-to-English,
Czech-to-English, English-to-Russian, Englishto-Spanish, English-to-French and English-toGerman.4 Again, we obtain a minimum of 15
assessments per translation, and collect scores for
100 translations per language pair. After removal
of quality control items, this leaves 70 distinct
translations per language pair, combined into a
cross-lingual test set of 630 distinct translations
spanning nine language pairs.
Table 3 shows Pearson’s correlation with human
assessment for the six segment-level metrics that
competed across all language pairs in W MT-13, and
Figure 6 shows the outcomes of Williams test for
statistical significance between different pairings of
metrics. Results reveal that the same three metrics
as before (METEOR , SENT BLEU- MOSES and NLE POR ), in addition to SIMP BLEU P and SIMP BLEU R
are not significantly outperformed by any other metric at p<0.05. However, since the latter two were
shown to be outperformed for Spanish-to-English,
all else being equal, METEOR , SENT BLEU- MOSES
and NLEPOR are still a superior choice of default
metric.
4
We were regrettably unable to include English-to-Czech,
due to a lack of Czech-speaking MTurk workers.
Figure 6: Evaluation of significance of increase in correlation with human judgment between every pair of
segment-level metrics competing in all nine in W MT-13
metrics task. A colored cell (i,j) indicates that system
named in row i significantly outperforms system named
in column j at p < 0.1 and green cells specifically
p < 0.05.
5
Conclusion
We presented a new evaluation methodology for
segment-level metrics that overcomes the issue of
low inter-annotator agreement levels in human assessments, includes evaluation of very close and
equal quality translations, and provides a significance test that supports system comparison with
confidence. Our large-scale human evaluation reveals three metrics to not be significantly outperformed by any other metric in both Spanish-to-
English and a combined evaluation across nine
language pairs, namely: METEOR , NLEPOR and
SENT BLEU- MOSES .
Acknowledgements
We wish to thank the anonymous reviewers for their valuable comments. This research was supported by funding
from the Australian Research Council and Science Foundation Ireland (Grant 12/CE/12267).
References
W. Aziz, S. Castilho, and L. Specia. 2012. PET: a tool
for post-editing and assessing machine translation. In
Proc. of the 8th International Conference on Language
Resources and Evaluation (LREC 2012), pages 3982–
3987, Istanbul, Turkey.
O. Bojar, C. Buck, C. Callison-Burch, C. Federmann,
B. Haddow, P. Koehn, C. Monz, M. Post, R. Soricut,
and L. Specia. 2013a. Findings of the 2013 Workshop
on Statistical Machine Translation. In Proceedings of
the Eighth Workshop on Statistical Machine Translation, pages 1–44, Sofia, Bulgaria.
O. Bojar, C. Buck, C. Callison-Burch, C. Federmann,
B. Haddow, P. Koehn, C. Monz, M. Post, R. Soricut,
and L. Specia. 2013b. Findings of the 2013 Workshop on Statistical Machine Translation. In Proc. 8th
Wkshp. Statistical Machine Translation, pages 1–44,
Sofia, Bulgaria.
O. Bojar, C. Buck, C. Federmann, B. Haddow, P. Koehn,
J. Leveling, C. Monz, P. Pecina, M. Post, H. SaintAmand, R. Soricut, L. Specia, and A. Tamchyna.
2014. Findings of the 2014 Workshop on Statistical
Machine Translation. In Proc. 9th Wkshp. Statistical
Machine Translation, pages 12–58, Baltimore, USA.
C. Callison-Burch, C. Fordyce, P. Koehn, C. Monz, and
J. Schroeder. 2007. (Meta-) evaluation of machine
translation. In Proc. 2nd Wkshp. Statistical Machine
Translation, pages 136–158, Prague, Czech Republic.
C. Callison-Burch, C. Fordyce, P. Koehn, C. Monz, and
J. Schroeder. 2008. Further meta-evaluation of machine translation. In Proc. 3rd Wkshp. Statistical Machine Translation, pages 70–106, Columbus, USA.
C. Callison-Burch, P. Koehn, C. Monz, and J. Schroeder.
2009. Findings of the 2009 Workshop on Statistical
Machine Translation. In Proc. 4th Wkshp. Statistical
Machine Translation, pages 1–28, Athens, Greece.
M. Denkowski and A. Lavie. 2011. Meteor 1.3: Automatic metric for reliable optimization and evaluation
of machine translation systems. In Proc. 6th Wkshp.
Statistical Machine Translation, pages 85–91, Edinburgh, Scotland.
Y. Graham and T. Baldwin. 2014. Testing for significance of increased correlation with human judgment.
In Proceedings of the Conference on Empirical Methods in Natural Language Processing, pages 172–176,
Doha, Qatar.
Y. Graham, T. Baldwin, A. Moffat, and J. Zobel. 2013.
Continuous measurement scales in human evaluation
of machine translation. In Proc. 7th Linguistic Annotation Wkshp. & Interoperability with Discourse,
pages 33–41, Sofia, Bulgaria.
Y. Graham, T. Baldwin, A. Moffat, and J. Zobel. 2014a.
Is machine translation getting better over time? In
Proceedings of the European Chapter of the Association of Computational Linguistics, pages 443–451,
Gothenburg, Sweden.
Y. Graham, N. Mathur, and T. Baldwin. 2014b. Randomized significance tests in machine translation. In
Proc. Ninth ACL Wkshp. Statistical Machine Translation, pages 266–74, Baltimore, USA.
A.L. Han, D.F. Wong, L.S. Chao, Y. Lu, L. He, Y. Wang,
and J. Zhou. 2013. A description of tunable machine translation evaluation systems in WMT13 metrics task. In Proceedings of the Eight Workshop on
Statistical Machine Translation, pages 414–421, Sofia,
Bulgaria.
P. Koehn. 2004. Statistical significance tests for machine
translation evaluation. In Proc. of Empirical Methods in Natural Language Processing, pages 388–395,
Barcelona, Spain.
M. Machacek and O. Bojar. 2014. Results of the wmt14
metrics shared task. In Proceedings of the Ninth Workshop on Statistical Machine Translation, pages 293–
301, Baltimore, USA.
J.H. Steiger. 1980. Tests for comparing elements of a
correlation matrix. Psychological Bulletin, 87(2):245.
E.J. Williams. 1959. Regression analysis, volume 14.
Wiley, New York, USA.


© Copyright 2026