
semi-Markov model for the price dynamics in the limit order markets
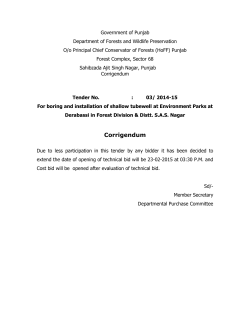
Semi-Markov Model for the Price Dynamics
in Limit Order Markets
Anatoliy Swishchuk and Nelson Vadori
Department of Mathematics and Statistics, University of Calgary, 2500 University Drive NW, Calgary, Alberta, Canada
IPAM FMWS1, UCLA, March 23-27, 2015
[email protected], [email protected]
Estimated transition probabilities of the Markov Chains Vkb, Vka. June 21st 2012.
Abstract
We introduce a semi-Markov model for the price dynamics in the limit order markets. This
model is based on Markov renewal process. Our results generalize the previous results in
the literature for the price dynamics in a Markovian limit order markets, and our assumptions
are much milder than in the existing literature. Also, the numerical results show justification
for using semi-Markov model, and for considering more general model than exponential (as
in most existing literature) for the order arrival times, such as Weibull or Gamma. Our data
is based on five stocks Amazon, Apple, Google, Intel and Microsoft on 21st 2012and was
taken from the website: https://lobster.wiwi.hu-berlin.de/info/DataSamples.php.
7. Numerical Results: Findings and Justification I
We notice that the probabilities P (−1, 1), P (1, 1) can be significantly different from each other
- and similarly for the probabilities P (−1, −1), P (1, −1) - which justifies the use of a Markov
Chain structure for the random variables {Vkb}, {Vka}. This phenomenon is particularly visible
for example on Microsoft (Bid+Ask), Intel (Bid+Ask), Apple (Bid+Ask) or Amazon Ask. Further, regarding the comparison of P (1, 1) and P (−1, −1), it turns out that they are often very
smilar, except in the cases Amazon Bid, Apple Bid, Google Bid.
1. Introduction: Quick Recap of the Model Presented in [1]
Let qta and qtb the respective sizes of the ask and bid queues at time t (these are integer
valued). Market buy (resp., sell) orders arrive at independent, exponential times with rate
µ; limit buy (resp., sell) orders arrive at independent, exponential rate λ; cancellations occur
at independent, exponential times with rate θ; these events are mutually independent and
orders are equal in size (in fact 1). Values Tka (resp., Tkb), the durations between two consecutive queue changes at the ask (resp. the bid), and Vka (resp., Vkb), the size of the associated
change in queue size, satisfy the following conditions: Tka are independent, exponentially
distributed with intensity λ + µ + θ; Tkb are independent, exponentially distributed with intenµ+θ
µ+θ
λ
λ
a
b
b
a
sity λ + µ + θ; P [Vk = 1] = λ+µ+θ , P [Vk = −1] = λ+µ+θ ; P [Vk = 1] = λ+µ+θ , P [Vk = −1] = λ+µ+θ ;
all the latter sequences are independent from each other. The bid and ask queues are
assumed to be independent. Only the current bid and ask queues are modeled.
2. The Semi-Markov Model of Limit Order Book Dynamics I: Tka, Tkb, Vka, Vkb
We generalize the latter assumptions on Tka, Tkb, Vka, Vkb: we will assume that between two
price changes: (Vka, Tka) and (Vkb, Tkb) are two independent Markov renewal processes of respective kernels Qa, Qb (see below) The state space of the embedded Markov chains {Vka},
{Vkb} is {−1, 1}. V0a, V0b are independent random variables with distributions v0a, v0b (on the
space {−1, 1}). The Markov renewal processes driving distinct intervals between prices
changes are independent. In particular, the latter assumptions imply that between two given
a
price changes: Vk+1
can depend on the previous queue change Vka: {Vka} is a Markov chain
with arbitrary transition probability matrix (the same observation goes for Vkb). {Tka} can have
arbitrary distributions. Further, they are not strictly independent anymore but they are independent conditionally on the Markov chain {Vka} (the same observation goes for Tkb). The
bid and ask queues are still assumed to be independent.
8. Numerical Results: Findings and Justification II
The second assumption of [1] that we would like to challenge is the assumed exponential
distribution of the order arrival times Tka, Tkb. To this end, on the same data set as used
to estimate the transition probabilities P a(i, j), P b(i, j), we calibrate the empirical c.d.f.’s
H a(i, j, dt), H b(i, j, dt) to the Gamma and Weibull distributions (which are generalizations
of the exponential distribution). We recall that the p.d.f.’s of these distributions are given by:
x k
x
k−1
−
x
1
k
e ( θ ) 1 . Here, k > 0 and θ > 0 represent
f
(x) =
xk−1e− θ 1 ,f
(x) =
Gamma
Γ(k)θk
x>0
W eibull
θ
x>0
θ
respectively the shape and the scale parameter. The variable k is dimensionless, whereas θ
will be expressed in ms−1. We perform a maximum likelihood estimation of the Weibull and
Gamma parameters for each one of the empirical distributions H a(i, j, ·), H b(i, j, ·) (together
with a 95% confidence interval for the parameters). As we can see on the tables below, the
shape parameter k is always significantly different than 1 (∼ 0.1 to 0.3), which indicates that
the exponential distribution is not rich enough to fit our observations. To illustrate this, we
present below the empirical c.d.f. of H(1, −1) in the case of Google Bid, and we see that
Gamma and Weibull allow to fit the empirical c.d.f. in a much better way than Exponential.
9. Numerical Example: Figure (H(1, −1)-Google Bid-June21st 2012)
3. The Semi-Markov Model of Limit Order Book Dynamics II
Let st be the price process, Xn : −sTn − sTn− be the price
increments,
τ
:=
T
−
T
,
n
n
n−1
PNt
then (Xn, τn) is a Markov renewal process, and st =
k=1 Xk , Nt := sup{n : Tn ≤ t}.
a
a
= j, Tk+1
≤ t|Vka] = Qa(Vka, j, t), j ∈ {−1, 1}
P [Vk+1
b
b
≤ t|Vkb] = Qb(Vkb, j, t), j ∈ {−1, 1}
= j, Tk+1
P [Vk+1
We use the following notations for the ask (for the bid, they are defined similarly): P a(i, j) :=
a
= j|Vka = i], i, j ∈ {−1, 1}
P [Vk+1
a
F a(i, t) := P [Tk+1
≤ t|Vka = i], i ∈ {−1, 1}
a
a
= j], i, j ∈ {−1, 1}
H a(i, j, t) := P [Tk+1
≤ t|Vka = i, Vk+1
Figure 1: H(1, −1)-Google Bid-June21st 2012
10. Numerical Results: Calibration (Google Bid and Ask, June 21st 2012)
4. Main Probabilistic Results
Distribution of Duration Until Next Price Move; Probability of Price Increase; Characterization of Markov Renewal Process (Xn, τn); Diffusion Limit of the Semi-Markov Price Process
(based on [2]).
Google Bid H(1, 1)
Weibull θ
113.9
H(1, −1) H(−1, −1) H(−1, 1)
158.5
(102.8-126.2) (143.4-175.3)
Weibull k
0.276
67.9
56.8
(60.6-76.0)
(50.5-63.8)
0.261
0.246
0.284
(0.270-0.282) (0.278-0.290) (0.255-0.266) (0.241-0.251)
5. Numerical Results: Real Data and Motivation
Gamma θ
In [1], it is assumed that the queue changes Vkb, Vka do not depend on their previous vala
b
, Vk−1
. We challenge this assumption by estimating and comparing the probabilities
ues Vk−1
P (−1, 1) Vs. P (1, 1) on the one side and P (−1, −1) Vs. P (1, −1) on the other side to check
whether or not they are approximately equal to each other, for both the ask and the bid. We
also give - for both the bid and ask - the estimated probabilities P [Vk = 1], P [Vk = −1] that
we call respectively P (1), P (−1), to check whether or not they are approximately equal to
1/2 as in [1]. The results below correspond to the 5 stocks Amazon, Apple, Google, Intel,
Microsoft on June 21st 2012 (The data was taken from the webpage: https://lobster.wiwi.huberlin.de/info/DataSamples.php). The probabilities are estimated using the strong law of
large numbers.
6. Numerical Results: Tables
Gamma k
6720
6647
6381
7025
(6263-7210)
(6204-7122)
(5913-6886)
(6517-7571)
0.174
0.185
0.160
0.151
(0.169-0.179) (0.180-0.191) (0.155-0.165) (0.147-0.156)
Google Bid: Fitted Weibull and Gamma parameters. 95 % confidence intervals in brackets. June 21st 2012.
Google Ask H(1, 1)
Weibull θ
196.7
H(1, −1) H(−1, −1) H(−1, 1)
271.6
(180.6-214.2) (248.5-296.8)
Weibull k
0.290
38.1
57.0
(33.8-43.0)
(51.3-63.3)
0.258
0.263
0.310
(0.285-0.295) (0.303-0.316) (0.253-0.264) (0.258-0.268)
Gamma θ
Gamma k
6081
6571
4304
4698
(5734-6450)
(6165-7003)
(3971-4664)
(4380-5040)
0.195
0.209
0.156
0.164
(0.190-0.200) (0.203-0.215) (0.151-0.161) (0.159-0.168)
Amazon
Bid Ask
Avg time btw. orders (ms) 910 873
Avg nb. of stocks per order 100 82
Apple
Google
Intel
Bid Ask Bid Ask Bid Ask
464 425 1123 1126 116 133
90 82 84
71 502 463
Microsoft
Bid Ask
130 113
587 565
Google Ask: Fitted Weibull and Gamma parameters. 95 % confidence intervals in brackets. June 21st 2012.
11. References
Average time between orders (ms) & Average number of stocks per order. June 21st 2012.
Amazon
Bid Ask
P (1, 1) 0.48 0.57
P (−1, 1) 0.46 0.42
P (−1, −1) 0.54 0.58
P (1, −1) 0.52 0.43
P (1)
0.47 0.497
P (−1) 0.53 0.503
Apple
Bid Ask
0.50 0.55
0.40 0.42
0.60 0.58
0.50 0.45
0.44 0.48
0.56 0.52
Google
Bid Ask
0.48 0.53
0.46 0.49
0.54 0.51
0.52 0.47
0.47 0.51
0.53 0.49
Intel
Bid Ask
0.55 0.61
0.44 0.40
0.56 0.60
0.45 0.39
0.495 0.505
0.505 0.495
Microsoft
Bid Ask
0.63 0.60
0.36 0.41
0.64 0.59
0.37 0.40
0.49 0.508
0.51 0.492
1. Cont, R. and de Larrard, A. Price dynamics in a Markovian limit order book market, SIAM
Journal for Financial Mathematics, 4 (2013), No 1, pp. 1-25.
2. Vadori, N. and Swishchuk, A. Strong Law of Large Numbers and Central Limit Theorems
for Functionals of Inhomogeneous Semi-Markov Processes, Stochastic Analysis and Applications, 33:2 (2015), pp. 213-243.
3. Swishchuk A. and Vadori, N. Semi-Markov Model for the Price Dynamics in Limit Order
Markets. Working paper, March 20, 2015


© Copyright 2026