
Open Report - RAHMA Islamic Relief
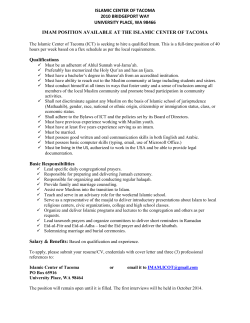
Tharparkar Situation Assessment February 2015 The study conducted to assess the situation of the most affected areas by the drought like situation during last three years in District Tharparkar, Sindh - Pakistan. It focuses to reveal the Socio-economic conditions and the situation of Food & Nutrition, Health, Water & Sanitation and Livelihood. SITUATION ASSESSMENT THARPARKAR RAHMA Islamic Relief List of Acronyms BHU Basic Health Unit DHQ District Headquarter FGDs Focus Group Discussions KG Kilogram KM Kilometer LHV Lady Health Visitor NIC National Identity Card RHC Rural Health Clinic RO Reverse Osmosis TBAs Traditional Bith Attendant THQ Tehsil Headquarter UC Union Council USD United State Dollar (Currency) WASH Water and Sanitation and Hygiene ii SITUATION ASSESSMENT THARPARKAR RAHMA Islamic Relief Contents THARPARKAR CLIMATE CULTURE RESOURCES 1 ERROR! BOOKMARK NOT DEFINED. ERROR! BOOKMARK NOT DEFINED. 2 OVERVIEW OF REPORT 2 SCOPE OF THE STUDY LOCATION POPULATION 3 3 4 METHODOLOGY 4 QUESTIONNAIRE FOCUS GROUP DISCUSSIONS 4 5 FINDINGS 7 FOOD AND NUTRITION HEALTH SOCIO ECONOMIC 7 10 14 WATER AND SANITATION 23 i SITUATION ASSESSMENT THARPARKAR RAHMA Islamic Relief RELIEF 27 CONCLUSION 29 RECOMMENDATIONS 30 SHORT TERM INTERVENTIONS MEDIUM TERM INTERVENTIONS 30 30 ii SITUATION ASSESSMENT THARPARKAR RAHMA Islamic Relief Tharparkar The district derives its name from Thar and Parkar. The name Thar is from Thul, the general term for the region sand ridges and Parkar literary means “to cross over”. It was earlier known as Thar and Parkar district, but later became one word Tharparkar. The district bounded on the north by Mirpurkhas and Umerkot districts, on the east by Barmer and Jaisselmir districts of India, on west by district Badin and on the south by Rann of Kutch. The total area of the district is 19,638 kilometers. Population Number of Taluka/Tehsil Number of Union Councils Number of Villages Number of Health Facilities DHQ THQ RHC BHUs 1,251,455 04 44 2,188 37 01 03 02 31 The district has a tropical desert climate. In summer, when it is too hot during day time, the nights are remarkably cooler. April, May and June are the hottest months during the day. December, January and February are the coldest months. The mean/average maximum and minimum temperature during this period are 28°C and 9°C respectively. There are wide fluctuations in the amount of rain fall from year to year and the yearly average for Chapter: Tharparkar The district is mostly deserted and consists of barren tracts of sand dunes covered with thorny bushes. The ridges are irregular and roughly parallel, that they often enclosed sheltered valleys, above which they rise to a height of some 46 meters. These valleys are moist enough to admit cultivation and when not cultivated, they yield luxuriant crops of rank grass. But the extraordinary salinity of the subsoil and consequent shortage of potable water renders many tracts quite uninhabitable. In many of the valleys the subsoil water collects and forms large and picturesque salt lakes, which rarely dry up. 1 SITUATION ASSESSMENT THARPARKAR RAHMA Islamic Relief some areas is as low as 100 mm. Most of the rain falls between July and September, during the south -west monsoon, and is often concentrated in a period of two to three days. Culture Tharparkar is a heterogeneous society in term of religion and culture. The area is a symbol of religious harmony as both Hindu and Muslim population living as one community. The tribes and castes in Tharparkar adopt kaleidoscopic settlement pattern rather than territorial segregation. Successive waves of invasion have therefore created a mosaic of cultures and ethnic groups in Thar. But all have, in time, bowed to similar means of production and to a common material culture. The thaires are honest, hard-working people and are very generous in hospitality. The gatherings between castes are largely restricted to men. The locale for such interactions being the “autak”, each hamlet will have at least one “autak” situated a discrete distance beyond the thorn hedge of the family quarters. Failing an “autak” the nearest shady tree is designated for meetings with outsiders. Women largely communicate within their own caste, within which they marry exclusively. Opportunities for meeting women of other castes become more restricted with higher status. Rajput women observe strict purdah (Seclusion) while poorer Bajeer, Bheel, Menghwar and Kohli are freer to undertake their field tasks. Tharparkar is rich in minerals, the coal deposits of the district is one of the largest coal deposits of the world spread over 9000 square kms. Other major mineral include granite, china clay and salt. Presently there is no industry in the whole district although it has large potential with reference to its geographical position and natural resources. The area is poor in agriculture as it completely depends on rain water. Overview of Report Over the last three years, Tharparkar is facing drought like situation. The Pakistan Meteorological office stated the reason of calamity is low rainfall during monsoons in last three years. This resulted in local crop failure, deaths of livestock. The death of large number of small livestock is associated with serious lack and deficiency of food for the animals. The food insecurity has affected mainly the women and children. Malnutrition is largely prevailed Chapter: Overview of Report Potential in Resources 2 SITUATION ASSESSMENT THARPARKAR RAHMA Islamic Relief among women and children. Recently the Provincial Disaster Management Authority reports that 259,947 families are affected. Most of the population of Tharparkar has minimal access to social services including improved water sources, food secure and healthcare. The death toll hit 650 at close of 20141. The ongoing drought like situation is depriving the food and nutrition situation for rural communities. Several factors have contributed to increasing food insecurity, including significant losses of livelihoods, consistent outflow cattle and reduced cereal stocks across the region. The high food prices make basic food items inaccessible to drought-affected households. Insufficient access to food, acute lack of access to safe and drinkable water storages, lack of adequate hygiene practices, and low access to health services worsen already high malnutrition rates, and increase the risk of more deaths of the vulnerable children and women. In the context of high risks to the humanity, RAHMA Islamic Relief conducted a situation assessment. The study may not work as highly scientific source of information but this report is providing an analytical overview based not merely on qualitative but also quantitative data regarding the situation. It was initially planned as a rapid need assessment but in the context of the broader and deeper dynamics of the problem – drought like situation for last three years, we tried to grasp maximum information in a document that help in devising humanitarian response activities after understanding the problem. It might also help to plan further studies on this area. Scope of the study Location Following are eight Union Councils of Taluqa Mithi and Chachro selected, which are most affected areas as per available secondary data. Taluqa Chachro: Arnero Lakha, Bajeer, Chachro, Mithro Charan and Wawdi Dora. Taluqa Mithi: Barach, Lonihar, Dairh Sar, Malanhore Veena and Mithi. 1 Inter Press Service Report Jan 2015 Chapter: Overview of Report To determine the vulnerability of drought affected communities in Taluqa Mithi and Chachro in district Tharparkar. 3 SITUATION ASSESSMENT THARPARKAR RAHMA Islamic Relief Population The overall population of the district is 1254000. The study focused two taluqa Mithi and Chahro. The population of Taluka Mithi is 330,000 and Chachro 488,000. Cluster sampling strategy was adopted. The assessment team managed to access 8 union councils of the both taluqas and incorporated the views of 294 individuals through questionnaires and FGDs. Methodology Following tools were adopted to collect relevant information from the local population: Questionnaire Chapter: Methodology An Interview questionnaire has been formulated and the copies have been disseminated among the people of different villages and town areas. All the interviews were semi-structured, based questionnaire prepared having both close and open ended questions. Overall, it comprised of 32 questions exclusive of the demographic information about the interviewee and his/her village. First four questions are related to the affects of the ongoing drought like situation. The Questions#5 to 8 were incorporated to explore the socio-economic conditions. Questions# 9 to 16 elaborate health situation and the facilities available for the population especially the women and children. The questions #17 to 22 are relevant to the WASH situation. Question #23 to 25 are specifically depicting the available opportunities for the youth. Questions #26 to 30 are illustrating the Food Security situation and the last 2 questions are reflecting the already existing relief and support mechanism. 4 SITUATION ASSESSMENT THARPARKAR RAHMA Islamic Relief Outcomes: received filled questionnaires from 112 individuals including 30 women No. of Respondents w.r.o Locations College Mithi Malanhore Veena Lonihar Barach Wawdi Dora Dairh Sar Mithi Focus Group Discussions FGDs were conducted through consultations with community representative to have an in-depth view about the ongoing situation and the reflections of the actual life of an individual suffering from the drought like situation. Chapter: Methodology Chachro Mithrio Charan Chachro Bajeer Arnero Lakha 16 14 12 10 8 6 4 2 0 5 SITUATION ASSESSMENT THARPARKAR RAHMA Islamic Relief The participants of the FGDs were selected on the basis of following attributes: - The participant is a local inhabitant He/she is a representative/notable Having substantial information about the target village/UC The forum represents both genders The group is balance in term of representation of tribes and religions The participants belongs to different professions including farmers, cattle growers, teachers, business, labours etc Outcomes: Total number of participants in all FGDs was remained 182 individuals. The area wise detail is given in the following graph. 40 35 30 25 20 15 10 5 0 Arnero Lakha Chachro Mithrio Charan Chachro Wawdi Dora Barach Lonihar Dairh Sar Malanhore Veena Mithi Chapter: Methodology No. of Participants FGDs' Participents w.r.o locations 6 SITUATION ASSESSMENT THARPARKAR RAHMA Islamic Relief Findings Food and Nutrition Figure 1: Major Crops of the Area 50% Axis Title 40% 30% 20% 10% 0% Wheat Rice Bajra Gawar Mong Number of Respondents During the FGDs, it was discussed that the farmers could not cultivate their crops for last 3 years due to insufficient and untimely rain. The farmers responded on the question that agriculture in Tharparkar is completely depending on the rain and there is no other source of water like rivers and water channels. The aforementioned crops can be cultivated if their land receive rain water before 15 August and there is no agricultural use of the rain after mid of August. During the visit to the area, the assessment team visited twelve villages but it has observed a little agriculture field only in one village, which received rain few months back. All other villages were completely barren land or having some bushes like ugg, which is not eatable for the animals. Chapter: Findings The above graph shows the Major Crops of the area. On the basis of information collected from the respondents, most cultivated crop is Bajra, whereas the second largest crop is Gawar and the other crops cultivated at small scales included Rice, Mong and wheat. 7 SITUATION ASSESSMENT THARPARKAR RAHMA Islamic Relief Figure 2: Daily Food Items Taken Ghee Milk Dall Vegetable Bajra Rice Wheat 0% 5% 10% 15% 20% 25% 30% 35% 40% 45% Number of Respondents The above graph shows the daily food items commonly consumed. It is estimated that 39% people use wheat in daily food, 13% take rice, 4% use Bajra, 26% use vegetable in daily meal, 8% use dall, 8% use Milk and only 2 % use ghee. Chapter: Findings It reflects that iron and protein rich foods like meat and milk is almost missing from the routine food, which is a major cause of the weak health especially among the women and children. During the FGDs the cattle growers illustrated the situation in a different way. They consider that although the population is generally poor and hard to afford the cost of dairy products, however it is also due to lack of the animals. The animals have been shifted to other areas of Sindh due to unavailability of locally grown fodder and the bushes. The farmers cannot purchase the high cost fodder, which is hardly available in a limited quantity from the local market. In the result, they prefer to relocate to other areas although they realize that they have to face financial and social constraints in relating their animals. 8 SITUATION ASSESSMENT THARPARKAR RAHMA Islamic Relief Figure 3: Breast Feeding Practice Number of Respondents 60% 50% 40% 30% 20% 10% 0% One Month Six Months 1 Year 2 Years Chapter: Findings The above graph shows the breast feeding practice. It is estimated that 44% women feed their child for six months, 48% women feed their child for a year and only 5% women feed their child for 2 years. 9 SITUATION ASSESSMENT THARPARKAR RAHMA Islamic Relief Health Figure 4: Child Birth Treatment Method Adopted Not Answered Traditional Birth Attendent Healt Visitors Lady Doctor 0% 10% 20% 30% 40% 50% 60% 70% 80% Number of Respondents The above graph shows the preferred service for a Child Birth. It is estimated that 73% people prefer to avail the service of a traditional birth attendant (Daai), who is experienced in conducting deliveries at home but not trained from any medical institute as well as not aware about the hygienic and safe delivery methods, 14% prefer Lady Doctor at a hospital, 5% prefer health visitors and 8% didn't answered the question. Chapter: Findings The table reflects that the recent news about shocking number of the mortalities of the babies/children less than 1 year is only those which delivered or treated in a hospital. Considering the trend of deliveries by TBAs, it is assumed that the actual number of such mortality is much higher what is being reported through the media as it gets such data from the hospitals only. The assessment data reveals that actual number of mortality is at least 5 times higher than the reported data. 10 SITUATION ASSESSMENT THARPARKAR RAHMA Islamic Relief Figure 5: Distance from Nearest Medical Facility 45 KM 21 to 30 KM 16 to 20 KM 1 to 10 KM 0% 10% 20% 30% 40% 50% 60% Number of Respondent private clinic. Mithi and the nearest health have to travel Chapter: Findings The above table shows the distance from nearest health facility most likely a dispenser, LHV or a The assessment team found only two proper hospitals during the assessment, first the DHQ Hospital second one at Chachro. It is estimated that 53% of the respondents need to travel 1 to 10 KM for facility, 16% have to travel 16 to 20 KM, 12 % have to travel distance of 21 to 30 KM whereas 19% a long distance of 45 KM. 11 SITUATION ASSESSMENT THARPARKAR RAHMA Islamic Relief Figure 6: Vaccination against Five Diseases No 36% Yes 64% Chapter: Findings The above chart shows that how many of the children are given with the vaccination against five diseases. It is estimated that 36% do not give vaccination to the children and 64% children are given the vaccines. 12 SITUATION ASSESSMENT THARPARKAR RAHMA Islamic Relief Figure 7: Under Five Child Checkup 21% 18% To Child Specialist To a Doctor To Dispenser 61% Chapter: Findings The above chart shows that where the child under five is taken for the checkup. It is estimated that 61% goes to doctor, 21 percent visit dispenser and 18% visit child specialist for checkup. It is concluded that people prefer doctor. Reason is probably unavailability of the child specialists in a nearest location. 13 SITUATION ASSESSMENT THARPARKAR RAHMA Islamic Relief Socio Economic Figure 8: Profession of the Respondent Un-Paid Work 21% Farmer 8% Govt. Servant 23% Business 6% Prvt. Job 12% Labor 30% Chapter: Findings The above chart shows the profession of the respondents. It is estimated that 21% of the respondents are doing un-paid work, 8% are farmer, 23% are doing government jobs, 30% are doing labor work, 12% are doing private job, 6% are doing their own small scale business. It is concluded that majority of the population is doing low waged labor work. 14 SITUATION ASSESSMENT THARPARKAR RAHMA Islamic Relief Figure 9: Education of the Respondent 12th Continue Primary High School Matric Inter Bachelor Masters Illiterate 9% 1%5% 3% 8% 30% 28% 16% Chapter: Findings The above chart shows the education of the respondent. It is estimated that 8% of the respondent's education is Master level, 28% respondent's education is Bachelor level, 16% respondent's education is Inter level, 3% respondent's education is High School level, 5% respondent's education is primary level, 1% respondent's education is 12th and 9% respondents are illiterate. 15 SITUATION ASSESSMENT THARPARKAR RAHMA Islamic Relief Figure 10: Year of Last Rain 70% 60% 50% 40% 30% 20% 10% 0% 2012 2013 2014 The respondents asked that when did the last rain they have seen. The 60% respondents answered that last rain was received in 2011, 12% respondents answered 2012, 7% respondents answered 2013 and 21% answered 2014. However, during FGDs the participants shared that proper rain is not received for last three years. However, untimely rain received in recent years was little in quantity. As mentioned earlier, the income of the majority of people depend on agriculture especially on animal growing are suffering from extreme poverty. The growers are having no income and now running their lives through obtaining loans. Some young people are going to other cities and trying to search job of unskilled labour. Chapter: Findings 2011 16 SITUATION ASSESSMENT THARPARKAR RAHMA Islamic Relief Figure 11: Number of People Migrated 80% 70% 60% 50% 40% 30% 20% 10% 0% 0 to 500 501 to 1000 1001 to 1500 1501 to 2000 2001 to 5000 20000 No one It is concluded that numbers majority of the people prefer to stay in their areas although they face constraints due to lack of rains. During FGDs, the participants clarified their opinion about less number of internal displacements. The respondents said, population is extremely poor and unable to even afford the cost of relocation of their families. A participant says that “he require at least Rs. 35000 for the traveling and living cost of his family for only one month, then he might be able to get some odd job but again his income will be insufficient to survive in a Chapter: Findings The above graph shows that how many people migrated due to lack of rains. It is estimated that 67% answered 0 to 500, 2% answered 501 to 1000, 3% answered 1001 to 1500, 2% answered 1501 to 2000, 12% answered 2001 to 5000, 1% answered 2000 and 13% stated that no one migrated. 17 SITUATION ASSESSMENT THARPARKAR RAHMA Islamic Relief town or a city”. Instead of migrating along with family, the people prefer to send one or two men from each family for income generation to the cities like Badin, Hyder Abad and Karachi. Moreover, some of the farmers informed the assessment team that it is hard to find a suitable alternate place for their cattle. They have to walk hundreds of miles and spend several weeks to reach another place whereas several animals die during such traveling due to their poor health, lack of water and fodder, and hectic journeys. Furthermore, due to climate change, people on such far flung areas are also suffering from lack of water and fodder; therefore they mostly do not accept their cattle rather they use to purchase their animals in low prices. Figure 12: Monthly Income 60% 50% 40% 30% 20% 10% 0% 5001 to 10000 10001 to 15000 15001 to 20000 20001 to 25000 30000/Month The above graph shows the monthly income of the respondents having any type of income direct or indirect. It is estimated that the income of 53% respondents is 2000 to 5000, income of 17% respondents is 5001 to 10000, income of 7% respondents is 10001 to 15000, income of 7% respondents is 15001 to 20000, income of 14% respondents is 20001 to 25000 and 2% respondent's monthly income is 3000. Chapter: Findings 2000 to 5000/Month 18 SITUATION ASSESSMENT THARPARKAR RAHMA Islamic Relief It is concluded that majority of the respondents (53%) have extremely low income less than Rs. 5000 per month, which is equal to 1.6 USD per day per household whereas the widely considered “poverty line” is 2 USD per day per adult. Generally in Pakistan, only one person earns bread and butter for his/her family. So, If we divide the household income 1.6 USD on 3 (assuming each household comprised of 3 adults), per adult income appeared as 0.53 USD per day. Hence, the Poverty in Tharparkar is at least 4 times more severe than the international standard of “Poverty”. Figure 123: Impact on Income 80% 70% 60% 50% 40% 30% 20% 10% 0% Increased Decreased No Change How the droughts like situation in last 3 years affect income of the respondents? 70% respondents faced negative impact on their income, whereas 9% respondents could manage improvement and the 21% respondents see no change in their income. Chapter: Findings It is concluded that income of the majority of respondents decreased, which coupled the adverse affects along with consistent price hike of daily consumption items. 19 SITUATION ASSESSMENT THARPARKAR RAHMA Islamic Relief Figure 134: Income w.r to Needs 90% 80% 70% 60% 50% 40% 30% 20% 10% 0% More Less No Change 84% of the respondents consider that their income is insufficient to address their basic needs; only 5% respondents are earning more than their needs whereas 11% respondents are fully spending what they earn. Figure 145: Major Spending Livelihood Debt 19% Health Education 28% 33% Chapter: Findings 20% 20 SITUATION ASSESSMENT THARPARKAR RAHMA Islamic Relief The above chart shows the proportion of spending in major areas. It is estimated that 28% spend their income on livelihood, the income of 33% respondent is consumed in debt returning/giving, 20% spend their income on health and 19% spend their income on education. It reflects that the income of most respondents is consumed in debt servicing, which is followed by livelihood. Nearly equal numbers of respondents spend their income on education and health. Figure 156: Recreational Sources 70% 60% 50% 40% 30% 20% 10% 0% Arts and Handicraft Use of Drugs None The graph shows the recreation sources available to the youth of the area. It is estimated that 63% respondent spent their extra time in play grounds in playing different sports, however, here it should be noted that proper play grounds are not available in Tharparkar. However, since the area is a dessert, there is no restriction to play cricket, football and other games at any place. 10% respondent spend their time in arts and handicraft activities, 24% respondents uses drugs as a recreational or entertaining activity and 3% perform nothing in their free time. Chapter: Findings Sports 21 SITUATION ASSESSMENT THARPARKAR RAHMA Islamic Relief Figure 17: Vocational Centers Yes No 9% 91% During the assessment it was observed that trainings of vocational and income generation skills are not available on local level except a technical college in Mithi. It is estimated that 9% respondent answered yes that such training are available whereas a large majority 91% respondent answered as No. Hence, the majority of youth are either jobless or work as unskilled labour on low daily wages. Figure 168: Places for Job Hunting Karachi Haiderabad No where 9% 58% Chapter: Findings 33% 22 SITUATION ASSESSMENT THARPARKAR RAHMA Islamic Relief The above chart shows that which the most suitable place for the job-hunting is. It is estimated that 58% of the respondents go to Karachi for job-hunting, 33% go to Haiderabad and 9 go no-where. Water and Sanitation Figure 19: % Existence of Home Toilets 0% 25% 50% 6% 100% Not Answered 6% 34% 21% 33% Chapter: Findings The above chart shows the existence of toilets at homes. It observed that 34% respondent answered 0% (means no home toilet at all), 33% respondent answered 25%, 21% answered 50%, 6% answered 100% and 6% didn't answered the question. It is concluded the ratio of home toilets is very low. Only 6% homes are such who have home toilets. It is showing a very poor WASH condition in the area. During FGDs. the situation was further elaborated that the toilets are partially available in Mithi and Chachro town but completely missing and not existing at all in villages. The participants of the FGDs had a view that water is not available for drinking so how they can use it for toilet purpose. Moreover, cost of toilet is not affordable for the common households. 23 SITUATION ASSESSMENT THARPARKAR RAHMA Islamic Relief Figure 170: Type of Water Facility Number of Respondents 100% 80% 60% 40% 20% 0% Water Supply Handpump Well Chapter: Findings The above graph shows the source of water available to the people. 8% have facility of water supply for the people living in Mithi, however the water is brackish. 1% get water from hand pumps and 91% get it through the wells available in the surrounding of their villages. It concluded that the well is the most reliable and desirable source of water. 24 SITUATION ASSESSMENT THARPARKAR RAHMA Islamic Relief Figure 18: Quantity of Water required for daily use Number of Respondents 60% 50% 40% 30% 20% 10% 0% 50 Lt 30 Lt 10 Lt Chapter: Findings The above graph shows that how much quantity of water bringing by the people on daily basis. It is estimated that 36% respondent bring 50 Lt of water daily, 48% respondent bring 30 Lt of water daily and 16% respondents bring 10 Lt water daily. It is concluded that mostly people bring 30 Lt water daily for a household. In Mithi and Chachro, people are purchasing water, where the RO plants are available. However, people complaint in the FGDs that they are allowed to take 2 gallons of water, which they consider insufficient for a normal size family. 25 SITUATION ASSESSMENT THARPARKAR RAHMA Islamic Relief Figure 19: Who is responsible to bring? Number of Respondents 70% 60% 50% 40% 30% 20% 10% 0% The above graph shows that 65% respondents believe that the woman of water on daily basis and 35% consider that men bring or purchase the villages and observed that women are everywhere walking while carrying who is bringing water. However, few men are transporting water through was their income source. Men a household is responsible to bring the water. The assessment team visited 12 pots with them whereas no man found donkey carts to sale it to other and it Chapter: Findings Women 26 SITUATION ASSESSMENT THARPARKAR RAHMA Islamic Relief Relief Figure 20: Government Aid Yes No 39% 61% Chapter: Findings The above chart shows that either government is assisting the people or not with reference to drought like situation. It is concluded that 61% people answered no, and 39% answered yes. The people who answered yes explained during FGDs that Govt. is providing free wheat floor in quantity of 50 KG to every NIC holder on quarterly basis. 27 SITUATION ASSESSMENT THARPARKAR RAHMA Islamic Relief Figure 21: Non-Governmental Aid Yes No 20% 80% Chapter: Findings The respondents were also asked that whether they receive assistance from any non-governmental organization or not. 80% people replied that they have not received such aid, whereas only 20% people said that they received non-governmental aid. 28 SITUATION ASSESSMENT THARPARKAR RAHMA Islamic Relief Conclusion The study revealed some shocking facts about the impacts of drought like situation for last three years. The economic status of the respondents reflects the income of the majority is far less than the income fall under “poverty line”. People especially the farmers having no choice except taking loans for survival and spending a handsome portion around 33% of the income on debt servicing. Majority especially the women and children are severely malnourished due to consistent drought like situation and inability to cope the price hike of the basic consumable food items. Health situation is also extremely poor. The actual death toll of the newly born babies and the infants is at least 5 times higher than the reported data by the national media. The reason is non-existence of the data about the deaths happened at homes. The study revealed 73% people prefer the delivery at home by a TBA. During the FGDs, it was noticed that the drought is not only a factor of the high mortalities of children, other factors like believe system is also responsible for such casualties. A LHV revealed that mostly rural women think that they can avoid a very costly c-section procedure by bearing a weak baby, thus some of them intentionally take less food to make sure normal delivery. The district is famous in producing valuable handicrafts but no vocational skills center found during the visits of 8 UCs. It has only one technical college at Mithi, which is insufficient to produce skilled individuals. Though the district is already poor in agriculture but in the context of consistent drought like situation in past 3 years, it is now more important to enable the youth to become useful and supportive arms for their households. During the FGDs, the team noticed that majority youth is either completely jobless or earning meager income through unskilled labour in different cities. Chapter: Conclusion The population even at the district headquarter can hardly access to the drinkable water, which is being provided through RO plants. The vast majority population living in far flung villages has no access to such RO plants and they have no other option except drinking or using brackish water available in a very limited quantity. However, during the visit, the assessment team observed a positive trend that some water wells were recently constructed with support of philanthropists and NGOs but such wells will be hardly in hundreds while the need is in thousands in the context of scattered large population. These water wells work to some extend but lifting water from 250 to 350 feet depth is itself a costly and hectic job. 29 SITUATION ASSESSMENT THARPARKAR RAHMA Islamic Relief Overall, the area is going through an alarming situation. The women, children and the youth are the most vulnerable segments of the society. However, integrated and well coordinated humanitarian efforts can reduce such vulnerabilities. It is the right time to convert the threats in to opportunities because the whole Pakistani nation is sensitized and willing to support the humanitarian response. Recommendations The recommendations include both short term and medium term interventions because it is not a quick disaster that can be settled down with quick responses only. Furthermore, these recommendations are based on the need identified and prioritized during the FGDs. Short term interventions Consistent Nutritious Support for the pregnant and lactating women: it may help to reduce mortality rate of the newly born and under 1 year babies. Obviously, a healthy woman can bear a healthy child. Such intervention should not be limited to distribution of FIs but an awareness campaign may also be incorporated to such interventions. Cash/Food for Work Projects to enhance income. Livestock improvement projects should be devised as the animals are weak due to lack of natural fodder in form of bushes Installation of summer pumps on existing water wells and hand pumps will ease the access to water and lift the extra physical exertion from shoulders of the women. Medium & longer term interventions Digging of new wells and rehabilitation of old wells. Water is the top priority of the community as well. Income generation skills through Vocational and Technical Trainings. Training centers should be established at least at Taluqa level. Innovative low cost latrines may be designed and promoted as per local needs and situation. Development of model villages, where basic facilities like water, latrine, health awareness, food security and education is available. Chapter: Recommendations 30 SITUATION ASSESSMENT THARPARKAR RAHMA Islamic Relief Promotion of local tradition to attract tourism industry and to create market for the local handicrafts and products like ceramics, wool, honey etc Chapter: Recommendations 31


© Copyright 2026