
influence of worklife balance policies on
INFLUENCE OF WORKLIFE BALANCE POLICIES ON EMPLOYEE JOB SATISFACTION
AMONG GOVERNMENT OF MAKUENI COUNTY HEADQUARTERS EMPLOYEES
KISILU ELIZABETH KATHIKE
This Research Project Report is submitted to the Department of Business and Entrepreneurship
Studies in the School of Business and Economics in Partial Fulfillment of the Requirements for
the Award of Master of Business Administration Degree of South Eastern Kenya University.
MARCH, 2015
DECLARATION
Student Declaration
This research project report is my original work and has not been presented for an award in any other
university or institution of learning.
_____________________________
Elizabeth Kisilu
D61/WTE/20153/2012
_____________________________
Date
Declaration
This research project report has been submitted with our approval as the university supervisors.
_____________________________
Dr. Joash Migosi
Lecturer
University of Nairobi.
_____________________________
Date
_____________________________
Ms. Christine Kabui
Lecturer
South Eastern Kenya University.
_____________________________
Date
ii
DEDICATION
To my cherished daughter, Mwende, who fought for my time during this study.
iii
TABLE OF CONTENTS
DECLARATION .............................................................................................................................. ii
DEDICATION ................................................................................................................................. iii
ACKNOWLEDGEMENT ............................................................................................................... ix
ABSTRACT ................................................................................................................................... xiii
CHAPTER ONE: INTRODUCTION ............................................................................................... 1
1.1 Background ................................................................................................................................. 1
1.2 Statement of the problem ............................................................................................................ 4
1.3 Objectives ................................................................................................................................... 6
1.3.1 Specific objectives ................................................................................................................... 6
1.4 Research hypotheses ................................................................................................................... 6
1.5 Justification of the study ............................................................................................................. 7
1.6 Scope of the study ....................................................................................................................... 8
1.7 Limitations of the study .............................................................................................................. 8
1.8 Delimitation of the study ............................................................................................................ 8
1.9 Assumptions of the study ............................................................................................................ 9
1.10 Definition of terms .................................................................................................................... 9
CHAPTER TWO: LITERATURE REVIEW ............................................................................ 11
2.1 Introduction ............................................................................................................................... 11
2.1.1 The concept of work-life balance .......................................................................................... 12
2.1.2 The concept of job satisfaction .............................................................................................. 13
2.2 Theoretical review .................................................................................................................... 14
2.2.1 Two -factor theory of job satisfaction. ................................................................................... 15
2.2.2 The dispositional model of job satisfaction ........................................................................... 16
2.2.3 Value theory of job satisfaction ............................................................................................. 16
2.2.4 Social information processing model..................................................................................... 16
2.2.5 Boarder Theory ...................................................................................................................... 17
2.3 Empirical literature ................................................................................................................... 17
2.3.1 Provision for leave policy and job satisfaction ...................................................................... 19
2.3.1.1 Annual leave ....................................................................................................................... 19
iv
2.3.1.2 Maternity/Paternity leave .................................................................................................... 20
2.3.1.3 Sick leave ............................................................................................................................ 20
2.3.2 Personal and professional development policies and job satisfaction ................................... 21
2.3.2.1 Study leave policy ............................................................................................................... 21
2.3.2.2 Employee training and development policy ....................................................................... 22
2.3.2.3 Relocation assistance policy ............................................................................................... 22
2.3.3 Provision of labor policies and job satisfaction ..................................................................... 23
2.3.3.1 Occupational health and safety ........................................................................................... 23
2.3.3.2 Anti-harassment policy ....................................................................................................... 24
2.3.3.3 Work-place violence policy ................................................................................................ 25
2.3.4 Employee welfare policy/schemes and job satisfaction......................................................... 25
2.3.4.1 Team building, retreats and family days ............................................................................. 26
2.3.4.2 Healthcare and recreational facilities .................................................................................. 27
2.3.4.3 Bereavement/compassionate leave ..................................................................................... 27
2.4 Literature overview and research gaps ..................................................................................... 28
2.5 Conceptual framework .............................................................................................................. 29
CHAPTER THREE: RESEARCH METHODOLOGY ............................................................ 31
3.1 Introduction ............................................................................................................................... 31
3.2 Research design ........................................................................................................................ 31
3.3 Target Population ...................................................................................................................... 32
3.4 Sampling frame ......................................................................................................................... 32
3.5 Sample size and sampling technique. ....................................................................................... 33
3.5.1 Sample size ............................................................................................................................ 33
3.5.2 Sampling technique ................................................................................................................ 34
3.6 Research instruments ................................................................................................................ 35
3.6.1 Validity of the instruments..................................................................................................... 36
3.6.2 Reliability of the instruments ................................................................................................. 36
3.7 Data collection procedure/techniques ....................................................................................... 37
3.8 Pilot test .................................................................................................................................... 37
3.9 Data processing and analysis .................................................................................................... 38
v
3.10 Ethical considerations ............................................................................................................. 39
CHAPTER FOUR: DATA ANALYSIS, PRESENTATION AND INTERPRETATION ...... 40
4.1 Introduction ............................................................................................................................... 40
4.2 Questionnaire Return Rate ........................................................................................................ 40
4.2.1 Reliability analysis ................................................................................................................. 40
4.3 Demographic Information ......................................................................................................... 41
4.3.1 Respondents‟ Age .................................................................................................................. 41
4.3.2 Respondents‟ Gender ............................................................................................................. 42
4.3.3 Respondents‟ Department ...................................................................................................... 43
4.3.4 Respondents‟ Marital Status .................................................................................................. 44
4.3.5 Respondents‟ Management Level .......................................................................................... 45
4.4 Provision for leave and job satisfaction .................................................................................... 45
4.4.1 Provision for annual leave ..................................................................................................... 46
4.4.2 Compensation not to take leave ............................................................................................. 46
4.4.3 Maternity/Paternity leave ....................................................................................................... 47
4.4.4 Carrying forward leave days .................................................................................................. 48
4.4.5 Sick leave ............................................................................................................................... 49
4.4.6 Getting time off duty .............................................................................................................. 49
4.4.7 Preferred schedule .................................................................................................................. 50
4.4.8 Main leave factor that influences job satisfaction.................................................................. 51
4.5 Personal development policies and job satisfaction.................................................................. 53
4.5.1 Employee training .................................................................................................................. 53
4.5.2 Study leave ............................................................................................................................. 54
4.5.3 Relocation assistance policy .................................................................................................. 54
4.5.4 School fees paid by an employer ........................................................................................... 55
4.5.5 Access to full scholarship ...................................................................................................... 56
4.5.6 Access to short courses .......................................................................................................... 57
4.5.7 Main personal development factor that influences job satisfaction ....................................... 58
4.6 Provision for labor policies and job satisfaction ....................................................................... 59
4.6.1 Existence of labor policies ..................................................................................................... 59
vi
4.6.2 Time to time review ............................................................................................................... 60
4.6.3 Due process in disciplinary matters ....................................................................................... 60
4.6.4 Labor union membership ....................................................................................................... 61
4.6.5 Workplace health and safety .................................................................................................. 62
4.6.6 Anti-harassment policy .......................................................................................................... 63
4.6.7 Anti-gender based violence.................................................................................................... 63
4.6.8 Main labor factor that influences job satisfaction .................................................................. 65
4.7 Employee welfare policies and job satisfaction ........................................................................ 66
4.7.1 Team building and retreats..................................................................................................... 66
4.7.2 Availability of healthcare facilities ........................................................................................ 67
4.7.3 Compassionate leave .............................................................................................................. 68
4.7.4 Recreational facilities............................................................................................................. 68
4.7.5 Attending to personal issues .................................................................................................. 69
4.7.6 Medical cover......................................................................................................................... 70
4.7.7 Overtime compensation ......................................................................................................... 71
4.7.8 Commuter and house allowance ............................................................................................ 71
4.7.9 Main employee welfare factor that influences job satisfaction ............................................. 73
4.8 Measurement of dependent variable ......................................................................................... 74
4.8.1 Provision for leave ................................................................................................................. 74
4.8.2 Provision for personal development ...................................................................................... 75
4.8.3 Provision for labor policies .................................................................................................... 76
4.8.4 Provision for employee welfare policies................................................................................ 78
4.8.5 Main work life balance factor that has influenced job satisfaction ....................................... 80
4.9 Statement concerning job satisfaction ...................................................................................... 81
4.10 Hypothesis testing ................................................................................................................... 82
CHAPTER 5: SUMMARY, CONCLUSIONS AND RECOMMENDATIONS ...................... 89
5.1 Introduction ............................................................................................................................... 89
5.2 Summary ................................................................................................................................... 89
5.3 Conclusions ............................................................................................................................... 92
5.4 Recommendations. .................................................................................................................... 93
vii
5.4.1 Contribution to existing body of knowledge ......................................................................... 94
5.4.2 Suggestions for further research ............................................................................................ 94
References ....................................................................................................................................... 95
APPENDIX 1: QUESTIONNAIRE FOR EMPLOYEES .............................................................. 99
APPENDIX II: INTERVIEW GUIDE FOR DEPARTMENTAL HEADS ................................. 106
APPENDIX III: AUTHORIZATION LETTER ................................................................... ……107
APPENDIX IV: INTRODUCTION LETTER FROM SEKU...................................................... 108
APPENDIX V: APPROVAL FROM GOVERNMENT OF MAKUENI COUNTY ................... 109
APPENDIX VI: THE X2 (CHI-SQUARE) DISTRIBUTION CHART ....................................... 110
viii
List of tables
Table 3. 1 Target Population ......................................................................................................... 33
Table 3. 2 Sample Size.................................................................................................................. 34
Table 4. 1: Reliability Coefficients .............................................................................................. 41
Table 4. 2: Age Bracket of Respondents ..................................................................................... 42
Table 4. 3: Gender........................................................................................................................ 42
Table 4. 4: Respondents Department ........................................................................................... 43
Table 4. 5 : Respondents‟ Marital Status ..................................................................................... 44
Table 4. 6: Respondents‟ Management Level.............................................................................. 45
Table 4. 7: Provision for annual leave ......................................................................................... 46
Table 4. 8: Compensation not to take leave ................................................................................. 47
Table 4. 9: Maternity/Paternity leave........................................................................................... 47
Table 4. 10: Carrying forward leave days .................................................................................... 48
Table 4. 11: Sick leave ................................................................................................................. 49
Table 4. 12: Getting time off duty ............................................................................................... 50
Table 4. 13: Preferred schedule ................................................................................................... 50
Table 4. 14: Main leave factor that has influenced job satisfaction………….…………………..63
Table 4. 15: Employee training………………………………………………………………….53
Table 4. 16: Study leave............................................................................................................... 54
Table 4. 17: Relocation assistance policy .................................................................................... 55
Table 4. 18: School fees paid by an employer ............................................................................. 56
Table 4. 19: Access to full scholarship ........................................................................................ 56
Table 4. 20: Access to short courses ............................................................................................ 57
Table 4. 21: Main personal development factor that has influenced job satisfaction……..…….56
Table 4. 22: Existence of labor policies ....................................................................................... 59
Table 4. 23: Time to time review ................................................................................................. 60
Table 4. 24 : Due process in disciplinary matters ........................................................................ 61
Table 4. 25: Labor union membership ......................................................................................... 61
Table 4. 26: Workplace health and safety.................................................................................... 62
Table 4. 27: Anti-harassment policy ............................................................................................ 63
Table 4. 28: Anti-gender based violence ..................................................................................... 64
Table 4. 29: Main labor factor that influences job satisfaction………..………………..……….61
Table 4. 30: Team building and retreats ...................................................................................... 66
Table 4. 31: Availability of healthcare facilities .......................................................................... 67
Table 4. 32: Compassionate leave ............................................................................................... 68
Table 4. 33: Recreational facilities .............................................................................................. 69
Table 4. 34: Attending to personal issues .................................................................................... 69
Table 4. 35: Medical cover .......................................................................................................... 70
Table 4. 36: Overtime compensation ........................................................................................... 71
ix
Table 4. 37: Commuter and house allowance .......................................................................... .. 72
Table 4. 38: Main employee welfare factor that influences job satisfaction………………..….67
Table 4. 39: Provision for leave ................................................................................................... 75
Table 4. 40: Provision for personal development ........................................................................ 76
Table 4. 41: Provision for labor policies ...................................................................................... 77
Table 4. 42 : Provision for employee welfare policies ................................................................ 78
Table 4. 43 : Main work-life balance policy that has influenced job satisfaction………………71
Table 4. 44: Statement concerning job satisfaction ..................................................................... 81
Table 4. 45: Expected frequency and computed chi-square (X2 ) of provision for leave and job
satisfaction. ................................................................................................................................... 83
Table 4. 46: Expected frequencies and computed chi-square (X2 ) of provision for personal
development and job satisfaction. ............................................................................................... ..84
Table 4. 47: Expected frequency and computed chi-square (X2 ) of provision for labor policy and job
satisfaction. ................................................................................................................................... 86
Table 4. 48: Expected frequencies and computed chi-square (X2) of provision for employee welfare
policy and job satisfaction…………………………………………………….…………….……87
x
List of figures
Figure 2.1: Conceptual framework (Source: Researcher)............................................................. 30
xi
ACKNOWLEDGEMENT
I acknowledge the encouragement, commitment and guidance of my supervisors Dr. Joash Migosi and
Christine Kabui of the South Eastern Kenya University who ensured that this research was written
according to the university‟s requirements and completed in due time. My sincere thanks also extend
to all the lecturers who taught the units in Master of Business Administration for their efficiency. I am
also indebted to the respondents from the Government of Makueni County Headquarters, they availed
their time and provided the required data that made this study a success. I acknowledge support from
the County Administration, especially the County Secretary for creating an enabling environment for
me to carry out this research. To my relatives and friends who stood by my side both morally and
financially even when I was not available due to my tight study schedule, I say thank you and God
bless you.
xii
ABSTRACT
The purpose of this research was to present the findings of a study that sought to gain information on
staff experience of work-life balance policies and practices and how they influence job satisfaction
among headquarters employees of Government of Makueni County. The research also aimed to
contribute to the body of existing literature on work-life balance. The study adopted a descriptive
survey design. The study focused on employees, as they are key stakeholders within organizations,
with particular interest and influence in the success of work-life balance strategies. The target
population was 240 employees found at the Government of Makueni County Headquarters. A sample
size of 72 respondents was arrived at using stratified random sampling. Data collection instruments
used in this study are questionnaires and interview guides. Policies and factors relating to work-life
balance were investigated as well as their impact on job satisfaction among headquarters employees of
Government of Makueni County. Data was analyzed using Statistical Package for Social Sciences. The
findings were presented and analyzed on the basis of the research-specific objectives and hypotheses.
Tables and figures were used to present quantitative data where appropriate. The study found out that
there was a significant relationship between variables under study as none of the null hypotheses was
accepted. The study concluded that there was a significant relationship between work-life balance and
provision for leave, provision for personal development, provision for labor policies and provision for
employee welfare policies among Government of Makueni County headquarters employees. The study
recommends that the Government of Makueni County to adopt provisions for leave, labor policies,
personal development policies and employee welfare policies as these were found to influence job
satisfaction among government of Makueni county headquarters employees.
xiii
CHAPTER ONE
INTRODUCTION
1.1 Background
The study sought to investigate the influence of work-life balance policies on employee job
satisfaction among Government of Makueni County Headquarters employees. Even though the
global economy has undergone a major financial and economic crisis, work-life balance remains
a central issue for employed parents and employers alike (Wharton and Blair-Loy, 2006).
Pressures from an increasingly competitive work environment are leading to conflicting
priorities for employers and employees creating considerable stresses for employees trying to
cope with work and family responsibilities
There is increasing awareness of the benefits of providing more flexible human resource
strategies (Grover and Crooker, 1995), reflecting increasing recognition of the fact that work and
other life commitments cannot easily be separated. The importance of work-life balance has
increased as a corollary of increasing workforce diversity. An organization‟s need to attract and
retain valued employees in a highly competitive labor market is a strong motivating factor for
organizational awareness and action with regard to human resource policies and practices that
address work life balance. Work-life balance is an important area of strategic human resource
management that is receiving increasing attention from the government, researchers,
management and employee representatives and the popular media.
Work-life balance from an employee perspective is the maintenance of a balance between
responsibilities at work and at home. Work-life balance strategies in an organizational setting
include policies covering flexible work arrangements, child and dependent care, and family and
1
parental leave (Bardoel et al; 1998; Kramer, 1997). In contrast, work-life conflict is defined as a
form of inner role conflict in which the role pressures from the work and other life domains, such
as family are mutually incompatible in some respect, whereby participation in one role is made
more difficult by the virtue of participation in the other (Greenhaus & Bentell, 1985). The
concept of work-life balance extents to the impact work has on individual stress, relationships
and family wellbeing, and their life responsibilities and the goals of the organization (Becker &
Huselid, 1998; Erwin & Iverson 1994; Lewis & Cooper, 1995). Work-life conflict may include
issues such as difficulties faced related to child rearing, other kinship responsibilities or stressful
life events (Hobson, Delunas & Kesic, 2001).
Work-life balance has been widely discussed by various scholars in the world. According to a
major Canadian Study conducted by Lewis & Cooper (1995) 1 in 4 employees experience high
levels of conflict between work and family, based on work-to-family interference and caregiver
strain. If role overload is included, then employees are likely to experience work-family conflict.
Today‟s workers have many competing responsibilities such as work, children, housework,
volunteering, spouse and elderly parent care. This places stress on individuals, families and the
communities in which they reside. Thus, it can be asserted that work- life conflict is a serious
problem that impacts workers, their employers and communities. Work-life balance has emerged
as a strategic issue for human resource management and a key element of an organization‟s
employee retention strategies (Lewis & Cooper, 1995).
It has been argued that organizations need to be aware of the changing needs of employees and
provide flexible work life balance strategies in order to retain their employees (Capelli, 2000).
Way (2000) notes that, whether the introduction of work life balance strategies is effective in
2
reducing work/family conflict is uncertain; it may simply improve employee attitudes towards
the organizations (Lambert, 2000). In the context of a „war‟ for skilled talent (Way, 2000), such
outcomes may be significant. There is a strong business case in support of work-life balance.
Evidence from independent research as well as from employers own assessments of flexible
working practices shows that helping staff to strike a balance between paid work and personal
life can lead to improved recruitment and retention, reduction of absenteeism, and an improved
staff commitment and productivity.
The various roles we occupy as parents, partners and employees or employers bring with them
different obligations which need to be reconciled. Balancing work, family and lifestyle
commitments is often difficult and sometimes the different demands can be overwhelming and
incompatible. Helping individuals and families achieve a balance between their work, family and
lifestyle commitments by introducing work-life balance polices (policies that help people meet
the need of their work-life and personal life) can provide benefit for both employees and
employers. Here it is important to note that the benefits of work-life policies are not restricted to
the employees using the policies, but also the employer providing them. Work-life balance has
always been a concern for those interested in the quality of working life and its relation to
broader quality of life. Work-life balance has come to the fore in contemporary debates largely
because in affluent societies, the excessive demands of work are perceived to present a
distinctive issue that need to be addressed. The pressures of work, for those in work, have been
intensifying in recent decades.
Factors such as the advances in information technology and information load, the need for speed
of response, the importance attached to quality of customer service and its implications for
3
constant availability and the pace of change with its resultant upheavals and adjustments all
demand time and can be a source of pressure. The issue of work-life balance has been stimulated
by writers advocating the arrival of Generation X (Tulgan, 1996), a cohort of workers who give
greater priority to seeking a balance between work and the rest of life. More generally, there is a
view, widely promoted by some management writers but not strongly supported by sound
empirical evidence that workers are less willing to display unlimited commitment to the
organization.
Turbulence in organizations has made it less feasible to offer secure progressive careers and
therefore to justify why workers should be committed. The conflict between the demands of
work and the decline of work as a central life interest results in an imbalance between work and
the rest of life. The main purpose of this research was to present the findings of a study that was
carried out to gain information on staff experience of work-life balance policies and practices at
the County Government of Makueni Headquarters. The research also aimed at contributing to the
body of existing literature on work-life balance. The study focused on employees, as they are key
stakeholders within organizations, with particular interest and influence in the success of worklife balance strategies.
1.2 Statement of the problem
The study sought to investigate the influence of work-life balance policies on employee job
satisfaction among Government of Makueni County Headquarters employees. Work-life balance
is an important area of human resource that is receiving increasing attention from the
government, researchers, management and employee representatives and the popular media. It
has emerged as a strategic issue for Human Resource Management and a key element of
organizations‟ employee retention strategies (Lewis & Cooper, 1995). The radical changes in the
4
world of business, like factors such as globalization, information technology, world business
competitiveness and scarcity of natural resources have changed employees‟ outlook of how a
good employer is defined.
The County Secretary on 7th August, 2014 wrote a memo addressing the issue of official working
hours, dress code, and official languages. This is owing to the rate at which absenteeism and
reporting late to work was increasing. This could be resulting from spill-over of pressures from
home which begin to affect work. From the researcher‟s observation, most of headquarter
employees of the Government of Makueni County do not have work-life balance. This is evident
if we are to go by the rate of absenteeism from work, some employees working till late hours,
burnouts and other related pressures. Houston (2003) found that employees were experiencing
anxiety, workload and loss of control, pressure, long hours and insufficient personal time. Such
experiences are likely to encourage a reassessment of values in workers.
In addition, Ratzon (2011) found out that younger people entering the labor market are much less
willing to sacrifice their personal lives for total commitment to work values and expectations
appear to be changing. Mukururi and Ngari (2014) carried out a study on „Influence of Work-life
balance policies on Employee Job Satisfaction in Kenya‟s Banking Sector: A Case of
Commercial Banks in Nairobi Central Business District‟ and concluded that there was a positive
relationship between the two variables. Australian study (Clark, 2004) which involved surveys of
1500 employees at three periods (1997, 1998, and 2000) found that uptake of work-life balance
initiatives varied from 20% to 80% of employees in an organization. The Australian research
identified two key factors as barriers to work-life implementation and success: organizational
inaction and organizational values. This study sought to contribute to existing body of
5
knowledge by investigating the influence of work-life balance policies among headquarters
employees of Government of Makueni County Headquarters.
1.3 Objectives
The general objective of this study was to determine why work-life balance has become a major
issue, and determine the influence of work-life balance policies on employee job satisfaction
among Government of Makueni County Headquarters employees.
1.3.1 Specific objectives
The study was guided by the following research objectives:
i.
To determine the influence of leave provisions on job satisfaction among Government of
Makueni County Headquarters Employees.
ii.
To determine the influence of personal development policy on job satisfaction among
Government of Makueni County Headquarters Employees.
iii.
To determine the influence of labor policy on job satisfaction among Government of
Makueni County Headquarters Employees.
iv.
To determine the influence of welfare policy on job satisfaction among Government of
Makueni County Headquarters Employees.
1.4 Research hypotheses
The study sought to test the following hypotheses:
Ho1: There is no significant relationship between leave provision and job satisfaction among
Government of Makueni County Headquarters Employees.
Ho2: There is no significant relationship between provision for personal development and job
satisfaction among Government of Makueni County Headquarters Employees.
6
Ho3: There is no significant relationship between labor policies implementation and job
satisfaction among Government of Makueni County Headquarters Employees.
Ho4: There is no significant relationship between provision of employee welfare policy and job
satisfaction among Government of Makueni County Headquarters Employees.
1.5 Justification of the study
Work-life balance has come to the fore in contemporary debates largely because in affluent
societies the excessive demands of work are perceived to present distinctive issue that needs to
be addressed. The pressures of work, for those in work, have been intensifying in recent decades.
Factors such as the advances in information technology and information load, the need for speed
of response, the importance attached to quality of customer service and its implications for
constant availability and the pace of change with its resultant upheavals and adjustments all
demand our time and can be a source of pressure. This study would be important to the
Government of Makueni County Public Service as it would inform the formulation of nonexistent work-life balance policies and enriching of existing ones so that they are employeefriendly. It was also hoped that the recommendations made would go a long way towards the
improvement of work-life balance policies. The research findings and recommendations would
be an asset to the County Public Service Board and the human resource department as it will
inform the formulation of need- based policies in the area of work-life balance. These will be
integral to the creation of flexible workplaces conducive to the attraction, motivation and
retention of highly valued employees. Such strategies will enable employers and employees to
meet the emerging challenges related to the need for balance between work and life. Finally, this
study would be of value to researchers and scholars as it forms a basis for further research. It
7
may also be a source of reference material for researchers conducting research in other related
topics.
1.6 Scope of the study
The study focused on employees as they are the key stakeholders within organizations, with
particular interest in the success of work-life balance strategies. Specifically, the study focused
on headquarters employees Government of Makueni County. 240 employees are found in the
County Headquarters (about 1 ½ km from Wote town). The researcher got representation from
all ten county departments which are based in the headquarters.
1.7 Limitations of the study
The major limitation was that of sensitivity involved in job satisfaction. There was great
suspicion among the respondents on the intention of the study. To counter this limitation, a
research permit was produced and the intention of the study clearly explained. There was also the
limitation of dependability of the data given that the questionnaires were dropped and picked
later. It was not easy to tell whether or not the target respondents were the ones who offered the
information. To be able to deal with this problem, all questionnaires were cross checked to
ensure that questions were answered appropriately.
1.8 Delimitation of the study
In achieving the study‟s objectives, the study was limited by willingness of respondents to give
relevant information. To ensure cooperation of respondents, the researcher obtained an
introduction letter from the university and county administration explaining that the study would
be for research purposes only. Further, the researcher assured respondents that their responses
would be treated with anonymity and confidentiality. Data collection and analysis were further
8
allocated adequate time and finally, two research assistants were recruited to assist in the
dropping and picking of questionnaires.
1.9 Assumptions of the study
The study assumed that employees have at one point in their work-life perceived work to be
satisfying; they are in a position to tell what might have contributed to the satisfaction. Likewise,
it was assumed that respondents would be cooperative and willing to share information honestly,
and that they would have basic knowledge of work-life balance as it relates to job satisfaction.
1.10 Definition of terms
A number of key words and terms were used in this study. They were defined in this study as:
Work-life balance
Work-life balance is about how we combine work with other areas of our life, such as children,
care for the elderly and friends. Poor work-life balance can lead to poor work performance,
which further leads to a lack of fulfillment in the job.
Work-life balance policies
Work-life balance policies are programmes established by an employer that offer employees
options to address work and personal responsibilities. It entails attaining equilibrium between
professional work and other activities so that it reduces friction between official and domestic
life. For purposes of this study, work-life balance policies means the set of regulations and
procedures articulated specifically for a given organization, which if implemented, result to a
situation of harmony between work responsibilities versus life responsibilities of an employee
9
Job satisfaction
This is the positive emotional reactions and attitudes an individual has towards his/her job and
the organization they work for. It describes a positive feeling about a job, resulting from an
evaluation of its characteristics.
Job description
This is a functional description of the contents and contexts of a job. Job description narrates the
various features and contents of a job. It is a listing of the job tasks, duties and responsibilities
which depicts a brief summary of the job in terms of nature and types.
County Governance
This refers to the system of governance brought forward by the 2010 Constitution of Kenya. It
was actualized after the 4th March, 2010 elections, bringing a close to the earlier system of
governance which had only one house at the national level.
Government of Makueni County
This refers to one of the 47 county governments established following the March 4 th, 2013
general elections as part of the implementation of devolution. The Government of Makueni
County in its own right is an employer to more than 1,000 employees.
Government of Makueni County Headquarters employees
Those employees whose pay-point data shows that they are working in the Government of
Makueni County Headquarters.
10
CHAPTER TWO
LITERATURE REVIEW
2.1 Introduction
This chapter reviewed how literature is relevant to the current study with a focus on influence of
work-life balance policies on employee job satisfaction among employees of Government of
Makueni County headquarters employees. Review included other scholars‟ work both at
international and local arena. By pointing out the weaknesses and gaps of previous researches, it
would help support the current study with a view of suggesting viable measures or ways of
filling them. The literature review on work life balance has been framed up in view of its gained
popularity with the major aim to have prosperity of society and the realization of fulfilling lives
for its employees by supporting their growth and the further development of the organizations
they work for. The literature review identifies its effect on various quality life conditions in
context with work life balance.
The earliest view of the relationship between work and home was that they are segmented and
independent and do not affect each other. However this view of segmentation was challenged by
researchers who demonstrated that work and family are closely related domains of human life. In
this research project report, an endeavor was made to provide an overview of various aspects of
work life balance through the review of existing literature. The sources referred include various
journals, books, doctoral thesis, working papers, reports, magazines, internets sites, newspapers
and so on. These were reflected as references at the end.
11
The literature review aimed to review and critique published literature, both in Kenya and
internationally, which express the issues of work- life balance and job satisfaction, to summarize
and synthesize the range of recommendations (for action and/or policy change) that are made in
research reports, and to relate these to the evidence behind them. It also highlights the main
issues addressed in international literature in relation to this topic and to place this data within a
Kenyan context for comparative purposes.
Furthermore, the Government of Makueni County will be presented with an analysis of current
research gaps, with respect to both quantitative and qualitative research findings. This will
involve a comparison of Kenyan data and research approaches with international literature. From
the analysis of the research gaps, to outline and provide a thorough rationale for a series of
research questions that need to be addressed in a Kenyan context, and propose a methodology
that is best placed to resolve these questions. Last but not least, the literature review fully
addresses methodological issues arising from the literature review, including limitations with
respect to the reliability, validity and generalization of research findings and recommendations
for how research findings can be further tested, supported and validated.
2.1.1 The concept of work-life balance
In the recent years there has been an increased interest in work-family interface in the human
resource management literature especially regarding the sources and outcome of conflict
between these two spheres. A number of studies have addressed this issue from different
perspectives. Goodstein (1994) presented an institutional perspective on organizations responses
to work-family issues. In addition, Campbell et al (1994) have studied the effects of family
responsibilities on the work commitment and job performance of women.
12
The work-family issue is even further expanded to address the relationship of business-marriage
partners (Foley and Powell, 1997). Researcher Vloeberghs (2002) revealed that there is a need
for a practical instrument to measure the present situation of work-life balance. However as
revealed by researchers Eikhof et al (2007), the current work-life balance policies are narrowminded in terms of addressing the needs and aspirations of employees but there is need for its
realization as reflected in Emerald Article, Human Resource Management International Digest,
Vol.12 Iss:7 (2004) which emphasized that the employers are realizing for its responsiveness and
take inventive in trying to meet employee expectations to flexible benefits that help with their
work life balance. Miller (1978) emphasized that earlier, work life used to begin at age 16 and
end at age 70 and now begins at 20 and ends at 62 for most of working personals. Higgins and
Duxbury (1992) expressed that work conflict is a greater source of work-family conflict whereas
personal or family lives interference with work are associated for fewer hours.
2.1.2 The concept of job satisfaction
Employee job satisfaction is pleasure that an employee derives from his/her job (Reynolds,
2005). Job satisfaction is simply how people feel about their jobs and different aspects of their
jobs. It is the extent to which people like (satisfaction) or dislike (dissatisfaction) their jobs
(Spector, 1997). It is an attitudinal variable that describes how people feel about their job.
According to Mullins (2010), the level of job satisfaction is affected by a range of variables
relating to individual, social, cultural, organizational and environmental factors. These different
factors all affect the job satisfaction of certain individuals in a given set of circumstances but not
necessarily in others. Broader approaches to job satisfaction aim to give the person improved
empowerment and job enrichment through greater autonomy and authority over the planning,
execution and control of their work. It focuses on intrinsic satisfaction (Mullins, 2010).
13
Factors associated with high job satisfaction include variety of meaningful tasks, unobtrusive
supervision, greater responsibility, self-pacing, chances of self-development and feedback on
performance. On the other hand, job satisfaction can be increased by careful selection, setting
appropriate objectives, planning the development of employees, keeping employees informed
and recognizing achievements (Specter, 1997). When people are dissatisfied with their jobs they
tend to withdraw. That is, they are frequently absent and are likely to quit their jobs (Greenberg
& Baron, 2008).
2.2 Theoretical review
Work-life balance has been recognized at theoretical and organizational level as being important
in organizational performance, productivity and increases job satisfaction, (Mullins, 2010). This
section presents relevant theories that this study will be based on. The study is built upon certain
theories that have much links with job satisfaction in organizations. There are various theories
given for job satisfaction by various experts from time to time. The affect theory is the earliest
theory on job satisfaction. Its main premise is that satisfaction is determined by a discrepancy
between what one wants in a job and what one has in a job.
According to Robbins (2011), although there are many different approaches to understanding job
satisfaction four particular ones stand out as providing insight into this very important attitudethe two-factor theory of job satisfaction, the dispositional model, value theory and social
information processing model. The academic body of knowledge regarding work-life balance
relies on a variety of theories (Morris and Madsen, 2007).
14
2.2.1 Two -factor theory of job satisfaction.
This is a theory of job satisfaction suggesting that satisfaction and dissatisfaction stem from
different groups of variables (motivators and hygiene factors, respectively). Job satisfaction and
job descriptions are not opposite ends of the same continuum, but two separate dimensions. In
general, people are satisfied with aspects of their jobs that have to do with the work itself or
outcomes directly resulting from it (Greenberg & Baron, 2008). By contrast, dissatisfaction is
associated with conditions surrounding the job such as working conditions, pay, security,
relations with others and so on, rather than the work itself.
Because these variables prevent dissatisfaction when present, they are known as hygiene factors
(or maintenance factors). Rather than conceiving of job satisfaction as falling along a single
continuum anchored at one end by satisfaction and dissatisfaction as separate variables.
Motivators, when present at high levels, contribute to job satisfaction, but when absent, do not
lead to job dissatisfaction-just less satisfaction. Likewise, hygiene factors only contribute to
dissatisfaction when absent, but not to satisfaction when present (Greenberg & Baron, 2008).
Two-factor theory has important implications for managing organizations. Specifically,
managers would be well advised to focus their attention on factors known to promote job
satisfaction, such as opportunities for personal growth (Mullins, 2010). Two factor theories also
imply that steps should be taken to create conditions that help avoid dissatisfaction. Hygiene
factors include quality of supervision, pay, company policies, physical working conditions,
relation with others and job security while motivators include promotion opportunities,
opportunities for personal growth, recognition, responsibility and achievement (Robbins, 2011).
15
2.2.2 The dispositional model of job satisfaction
According to this approach, job satisfaction is a relatively stable characteristic that stays with
people over various situations (Greenberg & Baron, 2008). According to this conceptualization,
people who like the job they are doing at one time also tend to like the jobs they may beespecially for the facets of the job that are highly valued. Thus, value theory focuses on
discrepancies between what people have and what they want: the greater those discrepancies are,
the more dissatisfied they will be. This approach to job satisfaction implies that an effective way
to satisfy workers is to find out what they want and to the extent possible, give it to them.
2.2.3 Value theory of job satisfaction
This theory argues that almost any factor can be a source of job satisfaction so long as it is
something that people value (Greenberg & Baron, 2008). The less people have of some aspect of
the job (e.g. pay, learning opportunities) relative to the amount they desire, the more dissatisfied
they will be-especially for those facets of the job that are highly valued. Thus, value theory
focuses on discrepancies between what people have and what they want: the greater those
discrepancies, the more dissatisfied they will be. This approach to job satisfaction implies that an
effective way to satisfy workers is to find out what they want and to the extent possible, give it to
them (Robbins, 2011).
2.2.4 Social information processing model
This approach specifies that people adopt attitudes and behaviors in keeping with the cues
provided by others whom they came into contact. The model is important in so far as it suggests
that job satisfaction can be affected by such subtle things as the offhand comments others make.
Thus it makes sense for managers to pay careful attention to what others are thinking and feeling
about their jobs can „poison‟ the job satisfaction of others.
16
Fredrick Hertzberg theory suggests that people show their dissatisfaction with salary, job
security or organization policy. However, improvement regarding these dissatisfying factors does
not necessarily mean to have satisfied employees. He identifies hygiene factors like recognition,
achievement and growth. According to him, these might be helpful to raise job satisfaction level
(Mullins, 2010).
2.2.5 Boarder Theory
Border theory considers the degree to which individuals are seen as integral members of their
workplace communities as a critical indicator of the options and support they are likely to have
in their efforts to maintain balance between the work and non-work spheres. In border theory,
work and home represent two distinct spheres. Clark (2004) likened them to two countries, each
with its own culture. She emphasized borders or lines of demarcation between domains, the point
at which domain-relevant behavior begins or ends and included several kinds of borders,
addressing a gap observed in earlier theories. Physical borders such as the walls of one‟s
workplace, temporal borders such as one‟s work schedule, and the psychological borders that
dictate when one‟s thoughts, behaviors and emotions are suitable in one domain and the other,
are all taken into account in border theory.
2.3 Empirical literature
Hackman and Oldham theory of job characteristics was first introduced in 1975. The concept of
this theory revolves around five core work and three psychological dimensions. Skill variety,
task identity, task significance, autonomy and task feedback are the work attributes that result in
three psychological states namely meaningfulness of work, responsibility for work outcome and
knowledge for work activities. Konrad and Mangel (2000) emphasized that job satisfaction can
be increased by implementing work life balance policies by reducing conflict between work and
17
family. In other terms, satisfaction creates confidence, loyalty and ultimately improves the
quality output from the employees. There is a need to have work environment in such a way that
employees can reach their full potential and enjoy their job satisfaction.
More recently, the interest has shifted towards identifying factors that influence or predict job
satisfaction. Personal and work-related characteristics can influence job satisfaction. Workplace
flexibility helps to improve overall employee flexibility and empowerment to have work-life
balance which reduces turn-over ( Emerald Article, Human Resource Management International
digest, Vol.16 Iss : 6, 2008). According to the researcher, companies which have work-life
balance policies in place and implement them appropriately are likely to have satisfied
employees. Some work life balance policies are tailored for specific organizations as they may
be formulated to meet the needs of that particular organization. These organization-specific
policies, if implemented, give an organization a competitive edge over others who do not have
such policies in place.
Robbins (2011) found that employees were experiencing anxiety, workload and loss of control,
pressure, long hours and insufficient personal time. Such experiences are likely to encourage a
reassessment of values in workers. In addition, Ratzon (2011) found out that younger people
entering the labor market are much less willing to sacrifice their personal lives for total
commitment to work values and expectations appear to be changing. Mukururi & Ngari (2014)
carried out a study on „Influence of Work-life balance policies on Employee Job Satisfaction in
Kenya‟s Banking Sector: A Case of Commercial Banks in Nairobi Central Business District‟ and
concluded that there was a positive relationship between the two variables. An Australian study
(De Cieri et al. 2002) which involved surveys of 1500 employees at three periods (1997, 1998,
18
and 2000) found that uptake of work-life balance initiatives varied from 20% to 80% of
employees in an organization. The Australian research identified two key factors as barriers to
work-life implementation and success: organizational inaction and organizational values.
There are government policies on different organizational issues, and these are adhered to by all
employers despite the nature of organization they may be. In the context of this research, these
were termed as moderating variables. Since there is a legal framework for implementing the
moderating variables, these were used to check for deficits and excesses of organizational worklife balances of employees. There are employers who go an extra mile and offer their employees
friendlier policies in addition to the government policies. For example the Government of
Makueni County has every employee under a medical cover. This research conceptualized that
employees who are offered work-life balance policies tailored for an organization‟s need have a
high level of job satisfaction. Further, these work-life balance policies are moderated by
government policies.
2.3.1 Provision for leave policy and job satisfaction
Leave refers to any time that an employee spends away from work, most times on voluntary
basis. Ideally, provision for leave should be governed by a policy as conceptualized in this study.
However, this is not always the case. This study brought forward various types of policies falling
under leave policy and these are discussed in subsequent sub-topics.
2.3.1.1 Annual leave
Annual leave is covered under Rights and Duties in employment of part V of the Employment
Act No.11 of 2007. Annual leave is a period of time off work that an employee is entitled to after
every 12 consecutive months of service with the employer and is exclusive of public holidays.
19
On average, Kenyan employees enjoy annual leave of 30 days. In general, temporary and fixed
term workers enjoy all the rights of an employee working on permanent terms, except those that
are excluded explicitly (such as entitlement to pensions). Annual leave provides employees an
opportunity to relax for an extended period and to return to the job with renewed interest and
vitality. When an employee transfers to another department, leave balances also transfer.
Supervisors should work with employees to develop and coordinate annual leave plans so that
accruals remain at manageable level and so that maximum limits are not exceeded (Waweru,
1984).
2.3.1.2 Maternity/Paternity leave
According to the Employment Act (2007), a female employee is entitled to three months
maternity leave in addition to any period of annual leave she is entitled to, and sick leave if she
happens to fall sick during the time of confinement and with consent of the employer. The law
does not set a limit on maternity leave. Maternity leave cannot be extended in terms of extending
the three months maternity leave. But an extension may be granted, with the consent of the
employer, by taking sick leave or annual leave, compassionate leave or other leave entitlements.
Male employees are entitled to 14 days annual leave in the event that their recognized wives give
birth. The provisions on paternity leave under the employment act allow an eligible employee to
take fully paid paternity leave.
2.3.1.3 Sick leave
Under the employment act, section 30, an employee is entitled to paid sick leave after a period of
two consecutive months of service. The minimum period of entitlement is seven days with full
pay and seven days with half pay for every 12 months, subject to production of a certificate of
incapacity to work duly signed by a qualified medical practitioner. Sickness absence is a
20
considerable economic and social problem. Sickness absence is known to be associated with
behavioral attitudes. The correlation between sickness absence and job satisfaction has been
studied infrequently and with contradictory results (Waweru, 1984). In the Government of
Makueni County, employees are granted sick leave in the event that they fall ill. However, the
study seeks to establish if there is any legal framework or policy that governs this provision.
2.3.2 Personal and professional development policies and job satisfaction
Personal and professional development is defined as those processes through which the
organization and individuals engage in an ongoing learning to meet and address challenges and
opportunities within agreed and identifiable boundaries that respect and balance the needs of the
department (Miller, 1978). It is associated with the developmental needs of the individual, of
groups of staff and the realization of an organizations strategic aims and vision. Such
development is deemed to have a wide and flexible interpretation including not only internal
workshop activities but also opportunities for being seconded, attendance at external
development events, study for further and higher qualification, coaching, and group
development. It is not dependent on grade or job function.
2.3.2.1 Study leave policy
Study leave is paid leave granted to employees for part-time studies in approved courses. It is
equally accessible to all eligible employees and is used to promote a highly trained and skilled
workforce responsive to the requirements of the employer. The researcher endorses the principle
that staff should be encouraged, and where possible, assisted to undertake study in courses which
develop their professional and work skills. Staff also need to keep up to date with new
developments/trends in a rapidly changing work environment, and may regularly need to “reskill” themselves by undertaking courses (Spector, 1997).
21
Study leave is subject to the relevance of the course and departmental convenience. In any
organization there should be policy guidelines for staff in relation to the granting of study time
leave. In resonation with this policy, the Government of Makueni County continues to send staff
to appropriate short courses and provide in-house training to ensure that staff develop and
enhance the skills and key competencies necessary to both the current and future needs of the
Government. Under the Civil Service Code of Regulations public employees are entitled to study
leave. Neither the Employment Act nor the Regulations of Wages and Conditions of
Employment Act provide for an equivalent (Waweru, 1984). But in practice, many companies
and employers grant employees time off to go for courses, or to prepare for examinations.
2.3.2.2 Employee training and development policy
The challenges associated with the changing nature of work and the workplace environment is as
real for the Government of Makueni County as elsewhere. Rapid change requires a skilled,
knowledgeable workforce with employees who are adaptive, flexible and focused on the future.
Today organizations aspire to be learning organizations so as not to fall behind. An organization
learns as its people learn hence continual learning is critical for continued success of any given
organization Way, (2000). To create a learning culture, the corporate level should begin by
clearly communicating their expectation that employees should take the steps necessary to hone
their skills to stay on top of their professions or fields of work.
2.3.2.3 Relocation assistance policy
The purpose of this policy is to outline the relocation assistance that is available to new public
service employees. It ensures that relocation assistance, when offered, is reasonable and
equitable. Relocation assistance is granted to new employees/appointees only when it is required
to meet the recruitment needs of the hiring organization. It is the responsibility of the hiring
22
organization to offer employee/appointee relocation assistance. The determination as to level and
extent of the relocation assistance will include consideration of budgetary constraints,
operational needs of the organization, the need to attract competent staff and reasonable and
legitimate relocation costs incurred (Miller, 1978). In determining the amount of assistance
offered, factors considered should include recruitment priority and the personal situation of the
individual (for example number of dependents and actual real estate/moving costs).
2.3.3 Provision of labor policies and job satisfaction
The labor laws of Kenya of 2007 improved the environment for employers, employees and trade
unions. Parliament enacted five labor laws whose aim was to repeal and replace six core labor
laws and bring them into conformity with the current challenges and demands of national
development and international labor standards. The nature of industrial relations existing in any
society is dependent upon the specific circumstances that the society finds itself in. In Kenya, the
introduction of capitalism in an environment where virtual bondage in the nature of British
colonialism existed meant that the free development of a healthy climate of employer- employee
relations was conclusively forestalled. However, where free verbal expression of feelings is
suppressed, an explosive situation over time develops (Waweru, 1984). In the Government of
Makueni County, employees are members of Kenya County Government Workers union. This is
the union which represents the voice of the employee to ensure that labor injustices are not
performed.
2.3.3.1 Occupational health and safety
This is an area concerned with the safety, health and welfare of people engaged in work or
employment. The goals of occupational health and safety and health programmes include
23
fostering a safe and healthy work environment. Occupational health and safety may also protect
co-workers, family members, employers, customers and many others who might be affected by
the workplace environment. As defined by the World Health Organization, occupational health
deals with all aspects of health and safety in the workplace and has a strong focus on primary
prevention of hazards. It is concerned with enabling an individual to undertake their occupation,
in a way that causes least harm to their health.
Although work provides economic and other benefits, a wide array of workplace hazards also
present risks to the health and safety of people at work, (Miller, 1978). High performance work
systems can increase performance and job satisfaction and offer the added benefit of reducing
accidents (Greenberg and Baron, 2008). This last effect appears to stem from enhanced job
satisfaction among employees. Apparently, positive attitudes towards their work make
employees more careful and thus help them avoid accidents. In the Government of Makueni
County, some jobs entail working with machines which sometimes may be hazardous. For
example, drivers and tipper operators are more exposed to risk/accidents than an administrator
who is in the office. Hence, there should be a relevant policy that assures employees against
various types of work-related accidents/risks. This would enhance employee job satisfaction.
2.3.3.2 Anti-harassment policy
This policy addresses discrimination, harassment, sexual harassment, retaliation and so on. It
outlines an organization‟s objective in maintaining the policy and describes prohibited conduct in
detail. The policy includes examples of conduct that would be considered in violation of the
policy and its consequences. Employees in an organization should be treated with dignity,
decency and respect. The environment of the organization should be characterized by mutual
trust and absence of intimidation, oppression and exploitation (Furnham, 1994). Through
24
enforcement of this policy, an organization will seek to prevent, correct and discipline behavior
that violates this policy. All employees, regardless of their positions are covered by and are
expected to comply with this policy and to take appropriate measures to ensure that prohibited
conduct does not occur. It is not certain if there is an anti- harassment policy in the Government
of Makueni County hence the quest for this study.
2.3.3.3 Work-place violence policy
This refers to violence, usually in the form of physical abuse or threat that creates a risk to the
health and safety of an employee. One of the major components of an effective workplace
violence programme is its strategy regarding prevention. The best prevention strategy is to
maintain an environment which minimizes negative feelings, such as isolation, resentment and
hostility among employees (Joplin & Daus, 1997). Although no workplace can be perceived as
perfect by every employee, employers should try as much as possible to create a professional,
healthy and caring work environment. Maintaining a secure and physically safe workplace is part
of any good strategy for preventing workplace violence (Kossek, 1994). The measures employed
will depend on the resources available to the organization. The study seeks to establish if there is
a workplace violence policy in the Government of Makueni County and if it is known to the
employees.
2.3.4 Employee welfare policy/schemes and job satisfaction.
Organizations provide welfare facilities to their employees to keep their motivation levels high.
These can be classified into statutory welfare and non-statutory welfare schemes. The statutory
schemes are those that are compulsory to provide by an organization as compliance to the laws
governing employee health and safety. Non-statutory schemes differ from organization to
organization and from industry to industry. According to Robbins (2011), statutory welfare
25
schemes include provision for drinking water, facility for sitting, first aid appliances, latrines and
urinals, lighting and so on. Non-statutory welfare schemes may include personal health care
(regular medical check-up), flexi-time (flexible work schedules), employee assistance
programmes (e.g. counseling services), harassment policy, and medi-claim insurance scheme and
so on.
2.3.4.1 Team building, retreats and family days
Current business trends of globalization, accelerated growth, and reengineering are requiring
more cross-functional collaboration and integrated strategies across organizations, Dunne (2007).
Dunne contents that a new team paradigm is rising where management teams at all levels are
being asked to work together with more interdependence, with shared accountabilities outside
their typical function, and with higher levels of trust and participation. It is in this environment
that the necessity for team building interventions becomes apparent.
Team building is an effort in which a team studies its own processes of working together and
acts to create a climate that encourages and values contributions of team members. According to
Ratzon (2011), there are many examples of team building interventions. These can be
categorized along a sliding scale between two extremes, “fun” or development. At the “fun” end,
there are icebreakers, retreats and camping trips that are generally used to bond together new
teams or rejuvenate an already established team. At the development end are the workshops and
intensive team-building exercises that have very specific goals and are typically suited to a group
of professionals already focused on addressing certain issues.
The shift from working alone to working in teams requires employees to cooperate with others,
share information, confront differences and sublimate personal interests (Robbins, 2012).
26
Effective teams have common characteristics. They have adequate resources, effective
leadership, a climate of trust and a performance evaluation and reward system that reflect team
contributions. Because individualistic organizations and societies attract and reward individual
accomplishment, it can be difficult to create team players in these environments. To make the
conversion, management should try to select individuals who have the interpersonal skills to be
effective team players, provide training to develop teamwork skills and reward individuals for
cooperative efforts. There is no doubt that team building is very important in organizations
(Greenberg & Baron, 2008).
2.3.4.2 Healthcare and recreational facilities
Some organizations, including government bodies, provide healthcare facilities for their staffs.
The researcher opines that employees who are exposed to healthcare services/facilities provided
by their employer are likely to be more satisfied than ones who are not provided with such
facilities/services. In terms of recreational facilities, some employers provide their employees
with recreational facilities such as gym, sports field and equipment and so on. Such employees
are more likely to be satisfied since they recognize the fact that their employer is not only
concerned with their job, but also their social wellbeing. In the Government of Makueni County
employees have been provided with a medical cover, which also covers the spouse and three
minors where applicable. However, it is not certain if there is a policy framework which governs
this and hence the need to carry out this study.
2.3.4.3 Bereavement/compassionate leave
This is leave granted to employees when a member of their immediate family or household dies
or suffers a life-threatening illness or injury. The amount of compassionate leave (in terms of
days) varies from organization to organization. An employee does not accumulate compassionate
27
leave (Levine, 1995). It can be taken any time an employee needs it. In the Government of
Makueni County, an employee who loses a first relative is entitled to three days bereavement
leave. If they are members of the staff welfare association, they are also awarded Kshs.20, 000 as
a way to console them. It is however not clear if this is guided by a policy framework or not and
hence the need to carry out this study to find out the case and advise accordingly.
2.4 Literature overview and research gaps
Employees, as important organizational stakeholders, expect their employers to be responsive to
their need to balance work and life commitments (Kossek, 1994). Changes in current managerial
attitudes to work-life balance strategies are requisite for innovative and inclusive behaviours and
organizational cultures to be developed, to address the changing needs of the workforce and the
pressures from multiple stakeholders which influence human resource managers (Kossek, 1994).
Several writers have argued that effective management of diverse human resources will provide
a key differentiator for successful organizations (Joplin & Daus, 1997).
There have been varied views and researches done in the area of work-life balance policies and
its influence on employee job satisfaction. The focus has been mainly on the statutory policies
while the target has been mainly the private sector. Oloitiptip and Gachunga (2013) established
that work-life balance had an influence on organizational performance at Kenya Power. The data
analysis technique used had been multiple regressions. Similarly, Mukururi and Ngari (2014)
studied the influence of work-life balance policies on job satisfaction in Kenya‟s banking sector.
Using multiple regression, they were indeed able to establish that there was a relationship
between the variables under study in the banking sector.
28
The researcher aimed at replicating this study in the Government of Makueni County
Headquarters by studying the influence of work-life balance policies on employee job
satisfaction. This would contribute to the body of knowledge in the area of work-life balance as
it relates to job satisfaction. Study findings and recommendations would inform the formation of
appropriate work-life balance and human resource strategies. These would be integral to the
creation of flexible workplaces conducive to the attraction, motivation and retention of highly
valued employees. Such strategies would enable employers and employees to meet the emerging
challenges related to the need for balance between work and life.
2.5 Conceptual framework
The conceptual framework was formulated to guide the process of this research. It has three
variables namely the independent variables, dependent variable and the moderating variables.
Arrow indicators were used to show how variables relate with one another. This conceptual
framework hypothesized that there is a relationship between work-life balance and employee job
satisfaction. According to Kothari, (2008) the independent variable is typically the variable being
manipulated or being changed and the dependent variable is the observed result of the
independent variable being manipulated. Thus there is interaction between the independent
variables and dependent variables that ensures the process of job satisfaction is complete and
successful.
29
INDEPENDENT VARIABLES
Provision
for
leave
(Annual
leave
,maternity / paternity leave, sick-off)
Personal Development (Study leaves,
school
fees,
employee
training
and
development, relocation assistance policy)
DEPENDENT VARIABLE
Labor policies (occupational health and
safety,
harassment
policy,
JOB SATISFACTION
workplace
violence)
Employee welfare policy (healthcare and
recreational facilities, bereavement leave,
teambuilding, retreats and family days)
MODERATING VARIABLE
Government policy provision for leave,
personal development, labor policies,
employee welfare
Figure 2.1: Conceptual framework (Source: Researcher)
30
CHAPTER THREE
RESEARCH METHODOLOGY
3.1 Introduction
This chapter discusses various stages that were followed in completing the study. It provides a
general framework for the procedures and techniques used in data collection and analysis under
the following sub-headings: the research design, target population, sampling size and sampling
procedures, data collection instruments, data collection procedures, data analysis techniques and
ethical considerations.
3.2 Research Design
The research was carried out among Government of Makueni County headquarters employees.
The population of interest was 240 employees, who are the direct beneficiaries of the work- life
balance practices put in place by the Government of Makueni County. Orodho (2003) defines
research design as the scheme outline or plan that is used to generate answers to research
problems. This study adopted a descriptive research design. A descriptive study is one which
information is collected without changing the environment.
It is also conducted to demonstrate relationships between variables and may involve interactions
with people or surveys. Cooper and Schindler (2006) further explain that a descriptive research
design is one of the best since it is accurate and current facts are exhibited through data
collection in human contexts. Gray (2004) argues that descriptive design portrays an accurate
profile of persons, events or situations by describing existing conditions and attitudes through
interpretation. Cooper and Schindler (2006) further explain that a descriptive design is one of the
best since it is accurate and current facts are exhibited through data collection in human contexts.
The study therefore considered descriptive research design to be the most appropriate in
31
establishing the influence of work-life balance policies on employee job satisfaction in the study
area.
3.3 Target Population
Target population is the specific population about which information is desired. Mugenda and
Mugenda (2003) define a population as a complete set of individuals, cases or objects with some
common observable characteristics. Welman and Mitchelle (2005) further define target
population as full set of cases from which a sample is taken. Gray (2004) argues that the target
population should have some observable characteristics to which the researcher intends to
generalize the results of the study. The study targeted employees working in the Government of
Makueni County Headquarters. The population of interest was 240 employees, who are the direct
beneficiaries of the work- life balance practices put in place by the Government of Makueni
County.
3.4 Sampling frame
The sampling frame describes the list of all population units from which the sample will be
selected (Cooper and Schindler, 2006). These included employees from the ten Government of
Makueni County departments under study. Representation from the ten categories was sought to
enable generalization.
32
Table 3. 1: Target Population
Variable
Total Number
Percentage
Health
27
12%
Water, Irrigation and Environment
22
9%
Trade, industrialization and Tourism
20
8%
Finance and Socio-economic Planning
25
11%
Education
20
8%
I.C.T and Special Programmes
22
9%
Lands
26
11%
Youth, Gender and Social Services
22
9%
Transport and Infrastructure
27
12%
Agriculture, Livestock and food security`
28
12%
Total
240
100%
3.5 Sample size and sampling technique.
3.5.1 Sample size
Sampling is the procedure of selecting elements from a given population that specifies the type
of sample to be used. From the population frame, the required number of respondents was
selected in order to make a sample. According to Cooper and Schindler (2006), a sample of at
least 30 elements (respondents) must exist for generalization purposes. Other research scholars
argue that sample size selection to a great extent is judgmentally decided. The study thus applied
stratified random sampling and purposive sampling. The total number of respondents was 72 as
30% of the target population. According to Mugenda and Mugenda (2003), a sample size of 1030% of the total population is adequate for a study in descriptive research.
33
Table 3. 2: Sample Size
Variable
Health
Total Number
27
Sample size
8
Water, Irrigation and Environment
22
7
Trade, industrialization and Tourism
20
6
Finance and Socio-economic Planning
25
8
Education
20
6
I.C.T and Special Programmes
22
6
Lands
26
8
Youth, Gender and Social Services
23
7
Transport and Infrastructure
26
8
Agriculture, Livestock and food security`
28
8
Total
240
72
3.5.2 Sampling technique
In order to select samples from the population, the study used stratified random sampling
technique. The purpose of this was to ensure that a proportionate number of respondents were
selected from the target population. The study divided the population into 10 strata which
constituted population from the 10 Government of Makueni County Departments under study.
Stratified random sampling was then used to select the respondents from the ten categories.
Stratified random sampling technique produces estimates of overall population parameters with
greater precision and ensures a more representative sample is derived, (Gray 2004).
34
3.6 Research instruments
The main tools of data collection were questionnaires which were self-administered to selected
employees. The researcher designed a questionnaire to gather extensive data and incorporated a
five point Likert rating scale. This enabled the researcher to assess employees‟ attitudes towards
work-life balance policies and job satisfaction by asking the respondents how strongly they
agreed or disagreed with series of statements / factors. The questionnaires had both open and
closed ended questions.
Questionnaire was used because of its convenience in facilitating quick and easy derivation of
information (Oso and Onen, 2009). The sample size of 72 respondents is also quite large and
given time constraints, questionnaire was the ideal tool for collecting data. Moreover, the target
population was considered literate. This minimized the process of interpreting questions for their
understanding to capture reliable information. Questionnaires were also useful since they
establish the number of people who hold certain beliefs and hence possible to gauge public
opinion on an issue (Flick, 2002). Using questionnaires in the research enabled direct response
and feedback from the respondents that could be collected within a short period of time and in an
easier manner.
Interview guides were also utilized where applicable, that is at the top management level.
Interview schedule was used on three department heads due to their characteristic that they can
be used to capture information that would otherwise not be captured using questionnaires. It was
necessary to interview the three heads of department because they were deemed to have
information that the other employees did not have. The researcher made preliminary
35
arrangements prior to the interview. This guarded against any weaknesses associated with this
method.
3.6.1 Validity of the instruments
Validity refers to the appropriateness of an instrument. It is the degree to which results obtained
from the analysis of data actually represent the phenomena under study. Orodho (2003) says that
a valid instrument should accurately measure what it is supposed to measure. Kothari (2008)
says that validity of the instrument refers to the degree to which the instrument measures or
describes what is supposed to measure or describe. Content related validity was used to ascertain
the validity of the questionnaire. It was also established through consulting an expert in the field
of research, who is the assigned project supervisor from the university. The reason for
conducting a validity test was to determine the suitability, clarity and relevance of the
instruments. Ambiguous and inadequate items were revised in order to elicit the required
information and improve the quality of the instruments.
3.6.2 Reliability of the instruments
Reliability is a measure to which a research instrument yields consistent results or data after
repeated trials (Mugenda and Mugenda 2003). It can also refer to the consistency that an
instrument demonstrates when applied repeatedly under the same conditions. It was done to
establish the consistency with which questions would generate responses. The reliability of the
questionnaire was evaluated through Cronbach‟s Alpha which measures the internal consistency.
The Alpha measures internal consistency by establishing if certain item measures the same
construct. Cronbach‟s Alpha was established for every objective in order to determine if each
scale would produce consistent results should the research be done later on. Scales will be
36
termed to be consistent if their reliability values exceed the prescribed threshold of 0.7 (Mugenda
and Mugenda, 2003). According to Gray (2004), a correlation coefficient of about 0.8 is high
enough to judge the instruments as reliable for the study. Based on the assertion of these two
scholars, the study considered a correlation coefficient of between 0.7 and 0.8 to be reliable.
3.7 Data collection procedure/techniques
Data collection started with the researcher obtaining a letter of authorization to collect data and a
letter of introduction from South Eastern Kenya University before embarking to the field. The
researcher then sought consent from the Government of Makueni County Secretary, being the
head of County Public Service. Appointments with departmental heads were sought in order to
get permission to carry out the study at the departmental level. After permission had been
granted, administration of the questionnaires began and it took two weeks duration to complete
the exercise. This was made possible through the help of 2 research assistants who were carefully
selected on the basis of their ability to interact well with the respondents and their ability to
understand issues. They were then taken through each question in the questionnaire for the
purpose of clarification on the issues that they did not understand. There were prior booking of
appointments before conducting interviews.
3.8 Pilot test
Mugenda and Mugenda (2003) argue that piloting refers to pre-testing of a research instrument
by administering it to a selected sample which is similar to the actual sample which the
researcher plans to utilize in the study. Piloting was done in order to assess the clarity of items,
validity and reliability of the instruments. One of the departments was chosen as the target
population for the pilot study. This is the County Public Service which carries out administrative
duties and would not fall under the ten departments to be studied.
37
3.9 Data processing and analysis
Data analysis is the process of systematically searching and arranging field notes, data and other
materials obtained from the field with the aim of increasing one‟s own understanding and to
enable one to present them to others (Orodho, 2003). Kothari (2003) points out that the purpose
of analysis is to generate meaning from the raw data collected. Analysis of data would be
important in explaining the findings of the study. Five point Likert scale was used to gauge
respondents‟ attitudes towards various work-life balance policies put in place by the Government
of Makueni County, and which are associated with job satisfaction.
Data was first coded to translate responses into specific categories and reduce data into
manageable summaries by use of frequencies and percentages. Tabulation was then done
followed by analysis using descriptive statistics. Oloitiptip and Gachunga (2013) established that
work-life balance had an influence on organizational performance at Kenya Power. The data
analysis technique used had been multiple regression. Similarly, Mukururi and Ngari (2014)
studied the influence of work-life balance policies on job satisfaction were indeed able to
establish that there was a relationship between the variables under study. In the current study, the
computer program SPSS (Statistical Package for Social Sciences) was used to analyze
quantitative data. SPSS (Statistical Package for Social Sciences) is comprehensive and offers
extensive data handling capacity and a host of statistical analyses to analyze both small and large
data statistics, Kothari (2003). Inferential statistics of correlation analysis was used to test the
relationship between the variables. To test the hypotheses of the study, chi-square test was
conducted with a significance test at 5% level. Chi-square is a statistical test commonly used to
compare observed data. The chi-square (I) test is used to determine whether there is a significant
38
difference between the expected frequencies and the observed frequencies in one or more
categories.
Qualitative data arising from the interview schedule and open-ended questions in the
questionnaire was analyzed using thematic content analysis. Smith (1975) suggests that some
blend of both quantitative and qualitative analysis should be used “because qualitative analysis
deals with the forms and antecedent-consequent patterns of form, while quantitative analysis
deals with duration and frequency of form”. Abrahamson (1983) suggests that content analysis
can be fruitfully employed to examine virtually any type of communication. Findings were
presented using tables followed by a discussion. Extraneous influences that would threaten the
findings of the study include increase in number of headquarters staff and exit of some who
might be part of the sample. To control this, the study was done within the shortest time possible
and time lines were defined in the letters of authorization/consent from relevant offices. The
researcher also identified existent government human resource policies and termed them as
moderating variables.
3.10 Ethical considerations
According to Mugenda and Mugenda (2003), ethical considerations are important for any
research. Ethical research practices were observed throughout the study. First, consent to carry
out the research was sought from the County Secretary who is the Head of Government of
Makueni County Public Service. Further, informed consent was sought from the specific
respondents as the researcher struck rapport. This would help in eliminating any kind of conflict
or negative reactance to research that would arise from the respondents. The researcher ensured
anonymity and confidentiality of the information shared by the respondents.
39
CHAPTER FOUR
DATA ANALYSIS, PRESENTATION AND INTERPRETATION
4.1 Introduction
The focus of this chapter is to discuss the analysis and interpretation of the findings in line with
the objectives of the study. The data that was obtained is presented in tabular form using
percentages and frequencies. The chapter is further sub-divided into sections that are pertinent to
the subjects under study. Descriptive and inferential statistics have been used to discuss the
findings of the study.
4.2 Questionnaire Return Rate
The study targeted a sample of 72 employees of the Government of Makueni County
Headquarters. It was important to establish the return rate so as to know the exact number of
questionnaires that were valid for analysis. Out of the 72 questionnaires that were issued, 64
were returned. This represented 89% response rate. According to Mugenda and Mugenda (2003),
a response rate of 50% is adequate for analysis and reporting; a rate of 60% is good and a
response rate of 70% and over is excellent. Based on the assertion, the 89% response rate was
considered to be excellent.
4.2.1 Reliability analysis
A pilot study was carried out to determine reliability of the questionnaire. The pilot study
involved respondents from the County Secretary‟s office. Reliability analysis was subsequently
done using Cronbach‟s Alpha which measures the internal consistency by establishing if certain
items within a scale measure the same construct. Cronbach‟s Alpha was calculated by
application of SPSS (Statistical Package for Social Sciences) for reliability analysis. The value of
40
the alpha coefficient ranges from 0-1 and may be used to describe the reliability of factors
extracted from dichotomous and or multi-point formatted questionnaires or scales.
A higher value shows a more reliable generated scale. Cooper and Schindler (2008) has
indicated 0.7 to be an acceptable reliability coefficient. Table 4.1 shows that provision for leave
had the highest reliability (α = 0.772) followed by provision for labor polices (α= 0.760)
followed by employee welfare policies (α=0.736) and finally personal development policies
(α=0.729). This illustrates that all the four scales were reliable as their reliability values exceeded
the prescribed threshold of 0.7.
Table 4. 1: Reliability Coefficients
Variable
Cronbach’s Alpha
Number of items
Provision for leave
0.772
7
Personal development policies
0.729
7
Employee welfare policies
0.736 `
7
Labor policies
0.760
8
4.3 Demographic Information
As part of the general information, the respondents were requested to indicate their gender, age,
marital status, level of education and their level of management in the organization. This was
necessary in shedding light on the characteristics of the respondents.
4.3.1 Respondents’ Age
Determining the respondents‟ age was important as it revealed their level of experience in
dealing with the challenges of work-life balance. Table 4.2 shows the age distribution of the
respondents.
41
Table 4. 2: Age Bracket of Respondents
Variable
Frequency
Percentage
Below 20 years
4
6%
21-40 years
18
28%
41-60 years
27
42%
Above 60 years
15
24%
TOTAL
64
100%
The results indicate that 6% of the respondents were below 20 years while 28% of the
respondents were between the ages of 21-40 years. 42% were in the age bracket of 41-60 years
whereas 24% of the respondents were above 60 years. Based on the findings, the respondents
who were between the ages of 41-60 years were the majority. This therefore would suggest that
they were able to appreciate and understand work-life balance as it relates to job satisfaction.
4.3.2 Respondents’ Gender
Inquiring about gender was necessary in determining whether there was gender balance in the
Government of Makueni County Headquarters. The findings are contained in Table 4.3.
Table 4. 3: Gender
Variable
Frequency
Percentage
Male
35
55%
Female
29
45%
TOTAL
64
100%
According to the findings, 55% of the respondents were male while 45% of the respondents were
female. This was an indication that there was gender disparity since the number of males
exceeded that of females by far. However, the disparity is termed by this study to be fair since
42
the representation for each category surpasses the 30% threshold stipulated by the Constitution
of Kenya (2010).
4.3.3 Respondents’ Department
The study sought to find out the departments from where respondents came from. The findings
are as shown in table 4.4.
Table 4. 4: Respondents Department
Variable
Health
Frequency
5
Percentage
7%
Water, Irrigation and Environment
7
12 %
Trade, industrialization and Tourism
6
9%
Finance and Socio-economic Planning
9
14%
Education
6
9%
I.C.T and Special Programmes
6
9%
Lands
5
7%
Youth, Gender and Social Services
7
12%
Transport and Infrastructure
6
9%
Agriculture, Livestock and food security
7
12%
Total
64
100%
The findings indicate that 7% are from department of Health, 12% are from department of
Water, Irrigation and Environment while 9% are from the department of Trade, Industrialization
and Tourism. 14% are from Finance and Socio-economic planning making the largest population
while 9% are from Education. 9% are from I.C.T and Special Programmes, 7% from Lands and
12% from Youth, Gender and Social Services. 9 % of the respondents were from Transport and
Infrastructure. 12% came from Agriculture, Livestock and Food Security. The representation
43
from each of the ten county departments under study enabled representativeness of the sample
and hence generalization would be enabled.
4.3.4 Respondents’ Marital Status
The purpose of inquiring about the marital status of the respondents was to establish whether it
had a positive or negative influence on their perception towards work-life balance. The findings
are shown in Table 4.5.
Table 4. 5 : Respondents’ Marital Status
Variable
Frequency
Percentage
Single
11
17%
Married
25
39%
Divorced
6
9%
Widowed
12
19%
Separated
10
16%
TOTAL
64
100%
The findings indicate that 17% of the respondents were single, 39% of the respondents were
married and 16% of the respondents were separated while 9% of the respondents were divorced.
19% of the respondents were widowed. This implies that the married respondents were the
majority and were therefore likely to understand work-life balance issues. It was presumed that
they would be having information on the subject under study.
44
4.3.5 Respondents’ Management Level
Respondents were asked to indicate their management level. The purpose of this was to gauge
the different cadres represented in the sample as it was deemed that work-life balance is a crosscutting issue as it relates with job satisfaction. The findings are as shown in table 4.6.
Table 4. 6: Respondents’ Management Level
Scale
Frequency
Percentage
Top level
13
20%
Middle level
24
38%
Low level
17
26%
Don‟t know
10
16%
TOTAL
64
100%
The findings indicate that 38% of the respondents are in middle level management, 26% are in
low level management while 20% are in top level management. Only 16% do not know their
cadres. The implication of this distribution is that all cadres were well represented and hence
generalization of research findings would be possible.
4.4 Provision for leave and job satisfaction
This section sought to establish respondents‟ awareness of how leave provision relates with job
satisfaction. First, respondents were required to respond with an either yes or no answer on
whether job satisfaction is influenced by leave provisions. 86% affirmed this while 14%
declined. Further, respondents were asked to indicate the extent to which they agreed to listed
factors‟ influence on job satisfaction.
45
4.4.1 Provision for annual leave
Respondents were required to respond on a likert rating scale whether provision for leave
influences job satisfaction. The findings are shown in table 4.7.
Table 4. 7: Provision for annual leave
Scale
Frequency
Percentage
Strongly disagree
1
2%
Disagree
11
17%
Agree
20
31%
Strongly agree
32
50%
TOTAL
64
100%
The findings of the study show that 50% of the respondents strongly agreed that provision for
leave influences job satisfaction. 31% agreed that provision for annual leave influences job
satisfaction while 17% disagreed that provision for annual leave influences job satisfaction. Only
2% strongly disagreed that provision for leave influences job satisfaction. None of the
respondents were indifferent.
4.4.2 Compensation not to take leave
Respondents were required to respond on a likert rating scale whether compensation not to take
leave influences job satisfaction. The findings are as shown in table 4.8.
46
Table 4. 8: Compensation not to take leave
Scale
Frequency
Percentage
Strongly disagree
6
10%
Disagree
4
6%
Neutral
2
3%
Agree
32
50%
Strongly agree
20
31%
TOTAL
64
100%
Findings indicated that 50% of the respondents agreed that compensation not to take leave
influences job satisfaction followed by 31% who strongly agreed to this. 10% strongly disagreed
to this while 6% disagreed that compensation not to take leave influences job satisfaction. Only
3% were indifferent on this.
4.4.3 Maternity/Paternity leave
Respondents were required to respond on a likert rating scale whether provision for
maternity/paternity leave influences job satisfaction. The findings are as shown in table 4.9.
Table 4. 9: Maternity/Paternity leave
Scale
Frequency
Percentage
Strongly disagree
8
13%
Disagree
4
6%
Neutral
2
3%
Agree
28
44%
Strongly agree
22
34%
TOTAL
64
100%
47
The study found out that 44% of the respondents agreed that job satisfaction is influenced by
maternity leave followed by 34% who strongly agreed to this. 13% strongly disagreed that
maternity leave/paternity leave influences job satisfaction and 6% disagreed with this. Only 3%
were indifferent in this issue.
4.4.4 Carrying forward leave days
Respondents were required to respond on a likert rating scale whether carrying forward leave
days influences job satisfaction. The findings are as tabulated shown in table 4.10.
Table 4. 10: Carrying forward leave days
Scale
Frequency
Percentage
Strongly disagree
5
8%
Disagree
3
5%
Neutral
6
9%
Agree
24
38%
Strongly agree
26
40%
TOTAL
64
100%
Study findings show that 40% of the respondents strongly agreed that carrying forward leave
days influences job satisfaction while 38% agreed to this. 9% were indifferent while 8% of the
respondents strongly disagreed that carrying forward leave days influences job satisfaction. 5%
of the respondents disagreed that job satisfaction is influenced by provision to carry forward
leave days.
48
4.4.5 Sick leave
Respondents were required to respond on a likert rating scale whether provision for sick leave
influences job satisfaction. The findings are as shown in table 4.11.
Table 4. 11: Sick leave
Scale
Frequency
Percentage
Strongly disagree
6
9%
Disagree
8
13%
Neutral
1
1%
Agree
25
39%
Strongly agree
24
38%
TOTAL
64
100%
The study established that 39% of the respondents agreed that provision for sick leave influences
job satisfaction followed closely by 38% of respondents who strongly agreed to this. 13%
disagreed with this factor‟s influence on job satisfaction followed by 9% of respondents who
strongly disagreed with this. Only 1% of the respondents were indifferent on whether job
satisfaction is influenced by provision for sick leave.
4.4.6 Getting time off duty
Respondents were required to respond on a 5 point likert rating scale whether getting time off
duty influences job satisfaction. The findings are as shown in table 4.12.
49
Table 4. 12: Getting time off duty
Scale
Frequency
Percentage
Strongly disagree
3
5%
Disagree
12
19%
Neutral
4
6%
Agree
15
23%
Strongly agree
30
47%
TOTAL
64
100%
Study findings indicate that 47% of the respondents strongly agreed that getting time off duty
influences job satisfaction while 23% were in agreement with this. 19% disagreed that getting
time off duty influences job satisfaction while 6% were indifferent in this matter. Only 5%
strongly disagreed that getting time off duty influences job satisfaction.
4.4.7 Preferred schedule
Respondents were required to respond on a 5 point likert rating scale whether scheduling their
preferred leave days off influences job satisfaction. The findings are as shown in table 4.13.
Table 4. 13: Preferred schedule
Scale
Frequency
Percentage
Strongly disagree
6
9%
Disagree
17
27%
Neutral
2
3%
Agree
19
30%
Strongly agree
20
31%
TOTAL
64
100%
50
According to the findings of the study, 31% of the respondents strongly agreed that ability to
schedule one‟s preferred days offs influences job satisfaction. 30% agreed that ability to schedule
one‟s preferred days offs influences job satisfaction while 3% were indifferent. 27% disagreed
with this while only 9% strongly agreed that ability to schedule one‟s preferred days offs
influences job satisfaction.
4.4.8 Main leave factor that influences job satisfaction
Mean and standard deviation of leave factors that influence job satisfaction was calculated. The
findings are shown in table 4.14.
51
Table 4.14 Main leave factor that influences job satisfaction
FACTORS
SCALES
SD
Annual leave
Leave compensation
Maternity/paternity leave
Carrying forward leave days
Sick leave
Time off duty
Preferred leave schedule
D
N
A
SA
%
1
18
0
50
31
F
1
11
0
32
20
%
10
6
3
50
31
F
6
4
2
32
20
%
13
6
3
44
34
F
8
4
2
28
22
%
8
5
9
38
40
F
5
3
6
24
26
%
9
13
1
39
38
F
6
8
1
25
24
%
5
19
6
23
47
F
3
12
4
15
30
%
9
27
3
30
31
F
6
17
2
19
20
M
SDv
4.11
1.16
3.91
1.21
3.80
1.34
3.98
1.19
4.09
1.04
3.94
1.27
3.47
1.41
Where SD- Strongly disagree, D-disagree, N-neutral, A- Agree, SA-strongly agree, M-mean,
SDv- standard deviation.
52
According to findings of the study, ability to schedule one‟s preferred days off was established to
be the main factor under provisions for leave that influences job satisfaction with a mean of 3.47.
This is in agreement with what one top official says “…for the employee, ability to plan their
leave days in advance amounts to provision for leave.” Provision for annual leave was the factor
that influences job satisfaction least under this category with a mean of 4.11.
4.5 Personal development policies and job satisfaction
This section sought to establish respondents‟ awareness of how provision for personal
development relates with job satisfaction. First, respondents were required to respond with an
either yes or no answer on whether job satisfaction is influenced by provision for personal
development policies. 80% affirmed this while 20% declined. Further, respondents were asked to
indicate the extent to which they agreed to listed factors‟ influence on job satisfaction.
4.5.1 Employee training
Respondents were required to respond on a 5 point likert rating scale whether employee training
in government institutions influences job satisfaction. The findings are as shown in table 4.15.
Table 4. 14: Employee training
Scale
Frequency
Percentage
Strongly disagree
3
5%
Disagree
9
14%
Neutral
1
1%
Agree
17
27%
Strongly agree
34
53%
TOTAL
64
100%
53
According to the research findings, 53% of the respondents strongly agreed that employee
training influenced job satisfaction and 27% were in agreement with this. 14% disagreed that
employee training in a government institution influences job satisfaction while 5% strongly
agreed with this. Only 1% of the respondents were indifferent in this.
4.5.2 Study leave
Respondents were required to respond on a 5 point likert rating scale whether provision for study
leave influences job satisfaction. The findings are as shown in table 4.16.
Table 4. 15: Study leave
Scale
Frequency
Percentage
Strongly disagree
2
3%
Disagree
7
11%
Agree
31
48%
Strongly agree
24
38%
TOTAL
64
100%
Findings of the study showed that 48% agreed that provision for study leave had an influence on
job satisfaction against 38% who strongly agreed with this. 11% disagreed that provision for
study leave influences job satisfaction while 3% strongly disagreed with this. None of the
respondents were indifferent.
4.5.3 Relocation assistance policy
Respondents were required to respond on a 5 point likert rating scale whether provision for
relocation assistance policy influences job satisfaction. The findings are as shown in table 4.17.
54
Table 4. 16: Relocation assistance policy
Scale
Frequency
Percentage
Strongly disagree
5
8%
Disagree
7
11%
Neutral
1
1%
Agree
30
47%
Strongly agree
21
TOTAL
64
33%
100%
According to finding of the study, relocation assistance policy influences job satisfaction as
evidenced by 47% of the respondents who agreed with this followed by 33% who strongly
agreed with this. 11% disagreed that relocation assistance policy influences job satisfaction
followed by 8% who strongly disagreed with this. Only 1% was indifferent whether provision for
relocation assistance policy influences job satisfaction.
4.5.4 School fees paid by an employer
Respondents were required to respond on a 5 point likert rating scale whether payment of school
fees by an employer influences job satisfaction. The findings are as shown in table 4.18.
55
Table 4. 17: School fees paid by an employer
Scale
Frequency
Percentage
Strongly disagree
5
8%
Disagree
6
9%
Neutral
1
1%
Agree
24
39%
Strongly agree
28
43%
TOTAL
64
100%
School fees paid by an employer had an influence on job satisfaction as indicated by 43% of the
respondents who strongly agreed to this factor. 39% agreed to this while 9% disagreed followed
by 8% who strongly disagreed with this. Only 1% was indifferent on this.
4.5.5 Access to full scholarship
Respondents were required to respond on a 5 point likert rating scale whether access to full
scholarship influences job satisfaction. The findings are as shown in table 4.19.
Table 4. 18: Access to full scholarship
Scale
Frequency
Percentage
Strongly disagree
2
3%
Disagree
12
19%
Neutral
3
5%
Agree
27
42%
Strongly agree
20
31%
TOTAL
64
100%
56
According to the findings of the research, 42% of the respondents agreed that full sponsorships
for long courses had an influence on job satisfaction while 31% strongly agreed with this. 19%
of the respondents disagreed that access to full scholarships influences job satisfaction and 5%
were indifferent on this. Only 3% strongly disagreed that access to full scholarships influences
job satisfaction.
4.5.6 Access to short courses
Respondents were required to respond on a 5 point likert rating scale whether access to short
courses influences job satisfaction. The findings are as shown in table 4.20.
Table 4. 19: Access to short courses
Scale
Frequency
Percentage
Strongly disagree
8
13%
Disagree
13
20%
Neutral
1
1%
Agree
19
30%
Strongly agree
23
36%
TOTAL
64
100%
Study findings indicate that 36% of the respondents strongly agreed that access to short courses
influenced job satisfaction while 30% agreed with this. 20% disagreed that access to short
courses influences job satisfaction against 13% who strongly disagreed with this. Only 1% was
indifferent in this.
57
4.5.7 Main personal development factor that influences job satisfaction
Mean and standard deviation of personal development factors that influence job satisfaction was
calculated. The findings are shown in table 4.21.
Table 4.21 Main personal development factor that influences job satisfaction
FACTORS
SCALES
SD
Employee training
Study leave
Relocation assistance
School fees
Employee assistance
Full sponsorship
Short courses
D
N
A
SA
%
5
14
1
27
53
F
3
9
1
17
34
%
3
11
0
48
38
F
2
7
0
31
21
%
8
11
1
47
33
F
5
7
1
30
21
%
8
9
1
39
43
F
5
6
1
24
28
%
3
19
5
42
31
F
2
12
3
27
20
%
13
20
1
30
36
F
8
13
1
19
23
%
13
1
3
36
F
8
1
19
23
20
13
M
SDv
4.09 1.24
4.06 1.05
3.86 1.22
4.08 1.20
4.00 1.25
3.80 1.17
3.56 1.47
Where SD- Strongly disagree, D-disagree, N-neutral, A- Agree, SA-strongly agree, M-mean,
SDv- standard deviation.
58
Study findings showed that access to short courses and in-house training was the main factor that
influences job satisfaction under provision for personal development with a mean of 3.56.
Employee training in a government institution was the least factor under this objective with a
mean of 4.09. This is in agreement with what one of the interviewed top officials said, that
“personal development of employees focuses on those little things offered by an employer to
enhance the employees’ capacity and skills…availability of short courses is the best example.”
4.6 Provision for labor policies and job satisfaction
This section sought to establish respondents‟ awareness of how provision for labor policies
relates with job satisfaction. First, respondents were required to respond with an either yes or no
answer on whether job satisfaction is influenced by provision for labor policies. 81% affirmed
this while 19% declined. Further, respondents were asked to indicate the extent to which they
agreed to listed factors‟ influence on job satisfaction.
4.6.1 Existence of labor policies
Respondents were required to respond on a 5 point likert rating scale whether existence of labor
polices influences job satisfaction. The findings are as shown in table 4.22.
Table 4. 22: Existence of labor policies
Scale
Frequency
Percentage
Strongly disagree
3
5%
Disagree
8
13%
Neutral
1
1%
Agree
12
18%
Strongly agree
40
63%
TOTAL
64
59
100%
The study found that existence of labor policies had an influence on job satisfaction as indicated
by 63% who strongly agreed to this. 18% agreed with this while 13% disagreed that existence of
labor policies influences job satisfaction followed by 5% who strongly disagreed with this. Only
1% of the respondents were indifferent in this.
4.6.2 Time to time review
Respondents were required to respond on a 5 point likert rating scale whether time to time
review of one‟s job influences job satisfaction. The findings are shown in table 4.23.
Table 4. 20: Time to time review
Scale
Frequency
Percentage
Strongly disagree
5
8%
Disagree
6
9%
Neutral
1
1%
Agree
33
52%
Strongly agree
19
30%
TOTAL
64
100%
According to findings of the study, review of employment terms from time to time had an
influence on job satisfaction as indicated by 52% who agreed to this and 30% who strongly
agreed with this. 9% disagreed that review of employment terms from time to time influences job
satisfaction against 8% who strongly disagreed with this. Only 1% was indifferent in this.
4.6.3 Due process in disciplinary matters
Respondents were required to respond on a 5 point likert rating scale whether due process in
disciplinary matters influences job satisfaction. The findings are as shown in table 4.24.
60
Table 4. 21 : Due process in disciplinary matters
Scale
Frequency
Percentage
Strongly disagree
5
8%
Disagree
8
13%
Neutral
1
1%
Agree
17
27%
Strongly agree
33
52%
TOTAL
64
100%
From the findings of the study, 52% of the respondents strongly agreed that due process in
disciplinary matters influences job satisfaction. 27% agreed that due process in disciplinary
matters influences job satisfaction followed by 13% who disagreed with this. 8% strongly
disagreed that due process in disciplinary influences job satisfaction and 1% were indifferent in
this.
4.6.4 Labor union membership
Respondents were required to respond on a 5 point likert rating scale whether membership to
labor union influences job satisfaction. The findings are shown in table 4.25.
Table 4. 22: Labor union membership
Scale
Frequency
Percentage
Strongly disagree
5
8%
Disagree
5
8%
Neutral
4
6%
Agree
35
55%
Strongly agree
15
23%
TOTAL
64
100%
61
Study findings show that membership to labor unions influences job satisfaction as indicated by
55% who were in agreement with this followed by 23% who strongly agreed with this. 8%
strongly disagreed that membership to labor unions influences job satisfaction. Similarly 8%
disagreed that membership to labor unions influences job satisfaction while 6% were indifferent
in this.
4.6.5 Workplace health and safety
Respondents were required to respond on a 5 point likert rating scale whether workplace health
and safety influences job satisfaction. The findings are shown in table 4.26.
Table 4. 26: Workplace health and safety
Scale
Frequency
Percentage
Strongly disagree
5
8%
Disagree
11
17%
Neutral
8
13%
Agree
18
28%
Strongly agree
22
34%
TOTAL
64
100%
According to findings of the study, 34% of the respondents strongly agreed that workplace health
and safety had an influence on employee job satisfaction. 28% agreed that workplace health and
safety influences job satisfaction followed by 17% who disagreed with this. 13% were indifferent
in this while only 8% strongly disagreed that workplace health and safety influences job
satisfaction.
62
4.6.6 Anti-harassment policy
Respondents were required to respond on a 5 point likert rating scale whether anti-harassment
policy influences job satisfaction. The findings are as shown in table 4.27.
Table 4. 27: Anti-harassment policy
Scale
Frequency
Percentage
Strongly disagree
5
8%
Disagree
12
19%
Neutral
4
6%
Agree
24
37%
Strongly agree
19
30%
TOTAL
64
100%
Study findings show that anti- harassment policy has an influence on job satisfaction as shown
by 37% of the respondents who agreed to this and 30% who strongly disagreed with this. 19%
disagreed that anti- harassment policy has an influence on job satisfaction followed by 8% who
strongly disagreed with this. 6% were indifferent that anti-harassment policy influences job
satisfaction.
4.6.7 Anti-gender based violence
Respondents were required to respond on a 5 point likert rating scale whether anti-gender based
violence policy influences job satisfaction. The findings are as shown in table 4.28.
63
Table 4. 23: Anti-gender based violence
Scale
Frequency
Percentage
Strongly disagree
7
11%
Disagree
14
22%
Neutral
4
6%
Agree
12
19%
Strongly agree
27
42%
TOTAL
64
100%
64
Anti-gender based violence policy influences job satisfaction as shown by 42% of respondents
who strongly agreed to this while 19% disagreed with this. 22% disagreed that anti- gender based
violence policy influences job satisfaction followed by 11% who strongly disagreed with this.
6% of the respondents were indifferent.
4.6.8 Main labor factor that influences job satisfaction
Mean and standard deviation of labor factors that influence job satisfaction was calculated. The
findings are shown in table 4.29.
Table 4.29: Main labor factor that influences job satisfaction
FACTORS
Labor policies
Review of terms
Labor union membership
Due process
Workplace health and safety
Anti harassment
Anti-gender based violence
SCALES
SD
D
N
A
%
5
13
1
18
63
F
3
8
1
12
40
%
8
1
52
30
F
5
6
1
33
19
%
8
8
6
55
23
F
5
5
4
35
15
%
8
13
1
27
52
F
5
8
1
33
19
%
8
17
13
28
34
F
5
11
8
18
22
%
8
19
6
37
30
F
5
12
4
24
19
%
11
22
6
19
42
F
7
14
4
12
27
9
SA
M
SDv
4.22
1.24
3.86
1.18
3.78
1.13
4.09
1.22
3.70
1.29
3.62 1.30
3.59 1.49
Where SD- Strongly disagree, D-disagree, N-neutral, A- Agree, SA-strongly agree, M-mean,
SDv- standard deviation.
65
Study findings that the main labor factor that influences job satisfaction is provision for antigender based violence which had a mean of 3.59, while the least is existence of labor policies
with a mean of 4.22. This supports what one of the top management officials said during
interview session“…..you can most definitely not separate gender issues from labor issues.
These two go hand in hand.”
4.7 Employee welfare policies and job satisfaction
This section sought to establish respondents‟ awareness of how employee welfare policies relates
with job satisfaction. First, respondents were required to respond with an either yes or no answer
on whether job satisfaction is influenced by provision for employee welfare policies. 81%
affirmed this while 19% declined. Further, respondents were asked to indicate the extent to
which they agreed to listed factors‟ influence on job satisfaction.
4.7.1 Team building and retreats
Respondents were required to respond on a 5 point likert rating scale whether team building,
retreats and family days influences job satisfaction. The findings are as shown in table 4.30.
Table 4. 30: Team building and retreats
Scale
Frequency
Percentage
Strongly disagree
2
3%
Disagree
9
14%
Neutral
1
1%
Agree
19
30%
Strongly agree
33
52%
TOTAL
64
100%
66
Study findings indicated that team building, retreats and family days had an influence on job
satisfaction as indicated by 52% of respondents who strongly agreed to this and 30% who agreed
with this. 14% disagreed that team building, retreats and family days had an influence on job
satisfaction while 3% strongly disagreed with this. Only 1% was indifferent in this.
4.7.2 Availability of healthcare facilities
Respondents were required to respond on a 5 point likert rating scale whether availability of
healthcare facilities and family days influences job satisfaction. The findings are shown in table
4.31.
Table 4. 31: Availability of healthcare facilities
Scale
Frequency
Percentage
Strongly disagree
5
8%
Disagree
6
9%
Neutral
3
5%
Agree
38
59%
Strongly agree
12
19%
TOTAL
64
100%
According to findings of the study, 59% agreed that availability of healthcare facilities
influenced job satisfaction followed by 19% who strongly agreed to this. 9% disagreed that
availability of healthcare facilities affects job satisfaction followed by 8% who strongly
disagreed with this. 5% were indifferent on whether job satisfaction is influenced by availability
of healthcare facilities.
67
4.7.3 Compassionate leave
Respondents were required to respond on a 5 point likert rating scale whether provision for
compassionate leave influences job satisfaction. The findings are as shown in table 4.32.
Table 4. 32: Compassionate leave
Scale
Frequency
Percentage
Strongly disagree
8
13%
Disagree
3
5%
Neutral
4
6%
Agree
26
41%
Strongly agree
23
36%
TOTAL
64
100%
Study findings show that 41% agreed that provision for bereavement/compassionate leave
influences job satisfaction among Government of Makueni County headquarters employees
followed by 36% who strongly agreed to this. 13% strongly disagreed that bereavement leave
policy affects job satisfaction while 6% were indifferent on this. 5% disagreed that provision for
bereavement/compassionate leave influences job satisfaction among Government of Makueni
County headquarters employees.
4.7.4 Recreational facilities
Respondents were required to respond on a 5 point likert rating scale whether provision for
recreational facilities influences job satisfaction. The findings are shown in table 4.33.
68
Table 4. 33: Recreational facilities
Scale
Frequency
Percentage
Strongly disagree
3
5%
Disagree
8
13%
Neutral
9
14%
Agree
23
36%
Strongly agree
21
33%
TOTAL
64
100%
According to the study findings 36% agreed that availability of recreational facilities had an
influence on job satisfaction followed by 33% who strongly agreed with this. 14% were
indifferent on whether recreational facilities influences job satisfaction followed by 13% who
disagreed with this. 5% strongly agreed that availability of recreational facilities influences job
satisfaction.
4.7.5 Attending to personal issues
Respondents were required to respond on a 5 point likert rating scale whether ability to attend to
personal issues influences job satisfaction. The findings are shown in table 4.34.
Table 4. 34: Attending to personal issues
Scale
Frequency
Percentage
Strongly disagree
6
9%
Disagree
10
16%
Neutral
9
14%
Agree
18
28%
Strongly agree
21
33%
TOTAL
64
100%
69
According to the study findings 33% of the respondents strongly agreed that attending to
personal/family issues influence job satisfaction among Government of Makueni County
headquarters employees followed by 28% who agreed to this. 16% disagreed that attending to
personal/family issues influences job satisfaction followed by 9% who disagreed with this. 14%
were indifferent in this.
4.7.6 Medical cover
Respondents were required to respond on a 5 point likert rating scale whether provision for
medical cover influences job satisfaction. The findings are shown in table 4.35.
Table 4. 35: Medical cover
Scale
Frequency
Percentage
Strongly disagree
6
9%
Disagree
14
22%
Neutral
6
9%
Agree
21
33%
Strongly agree
17
27%
TOTAL
64
100%
According to the study findings medical cover for employees and dependents influences job
satisfaction as indicated by 33% of respondents who agreed to this and 27% who strongly
disagreed with this. 22% disagreed that provision for medical cover influences job satisfaction
among headquarters employees of Government of Makueni County as well as 9% who strongly
disagreed with this. 9% were indifferent on this.
70
4.7.7 Overtime compensation
Respondents were required to respond on a 5 point likert rating scale whether compensation for
overtime influences job satisfaction. The findings are as shown in table 4.36.
Table 4. 36: Overtime compensation
Scale
Frequency
Percentage
Strongly disagree
6
9%
Disagree
14
22%
Neutral
1
1%
Agree
21
33%
Strongly agree
22
34%
TOTAL
64
100%
According to the findings of the study, 34% of the respondents strongly agreed that
compensation for overtime influences job satisfaction followed by 33% who disagreed with this.
22% disagreed that compensation for overtime influences job satisfaction while 9% strongly
disagreed with this. 1% of the respondents were indifferent in this.
4.7.8 Commuter and house allowance
Respondents were required to respond on a 5 point likert rating scale whether provision for
commuter and house allowance influences job satisfaction. The findings are as shown in table
4.37.
71
Table 4. 37: Commuter and house allowance
Scale
Frequency
Strongly disagree
8
13%
Disagree
17
27%
Neutral
2
3%
Agree
17
27%
Strongly agree
20
31%
TOTAL
64
Percentage
100%
According to the study findings, 31% of the respondents strongly agreed that commuter and
house allowance influence job satisfaction among Government of Makueni County headquarters
employees followed by 27% who agreed with this. Similarly 27% disagreed that commuter and
house allowance influence job satisfaction among Government of Makueni County headquarters
employees while 13% strongly disagreed with this. 3% were indifferent in this.
72
4.7.9 Main employee welfare factor that influences job satisfaction
Mean and standard deviation of labor factors that influence job satisfaction was calculated. The
findings are shown in table 4.38.
Table 4.38: Main employee welfare factor that influences job satisfaction
FACTORS
SCALES
SD
Team building and retreats
D
N
A
SA
M
%
3
14
1
30
52
F
2
9
1
19
33
%
8
9
5
59
19
F
5
6
3
38
12
%
13
5
6
41
36
F
8
3
4
26
23
%
5
13
14
36
33
F
3
8
9
23
21
%
9
16
14
28
33
F
6
10
9
18
21
%
9
22
9
33
27
F
6
14
6
21
17
%
9
22
1
33
34
F
6
14
6
21
17
Commuter &house allowance %
13
27
3
27
31
F
8
17
2
17
20
Healthcare facilities
Compassionate leave
Recreational facilities
Personal issues
Medical cover
Overtime compensation
73
SDv
4.17
1.11
3.72
1.12
3.88
1.27
3.84
1.17
3.69 1.26
3.52 1.32
3.66 1.36
3.37 1.48
Where SD- Strongly disagree, D-disagree, N-neutral, A- Agree, SA-strongly agree, M-mean,
SDv- standard deviation.
Study findings show that provision for house and commuter allowance was the main factor that
influences job satisfaction under employee welfare with a mean of 3.37. This is in agreement
with what one of the interviewed top officials said “…in addressing employee welfare issues the
focus has switched mainly to mobility issues and housing for the staff.” Team building, retreats
and family days was the least factor that influences job satisfaction the least with a mean of 4.17.
4.8 Measurement of dependent variable
This section sought to establish the extent to which work-life balance policies influences job
satisfaction. First, respondents were required to respond with an either yes or no answer on
whether job satisfaction has been influenced by work-life balance policies among Government of
Makueni County Headquarters employees. 65% affirmed this while 35% declined. Further,
respondents were asked to indicate the extent to which they agreed to listed factors‟ that are
related to work-life balance influence on job satisfaction.
4.8.1 Provision for leave
Respondents were asked to rate on a five point likert scale whether provision for leave has
influenced job satisfaction among headquarters employees of Government of Makueni County
and the findings are shown in table 4.39.
74
Table 4. 24: Provision for leave
___________________________________________________________________________
Scale
Frequency
Percentage
Strongly disagree
15
23%
Disagree
8
13%
Neutral
1
1%
Agree
30
47%
Strongly agree
10
16%
TOTAL
64
100%
From the study findings, provision for leave has influenced job satisfaction among headquarters
employees of Government of Makueni County, as indicated by 47% of respondents who agreed
to this statement and 16% who strongly agreed with this. 23% strongly disagreed that provision
for leave has influenced job satisfaction among headquarters employees of Government of
Makueni County and 13% who disagreed with this while 1% were indifferent. Three out of the
interviewed top management officials were in agreement that provision for leave has influenced
job satisfaction among Government of Makueni County headquarters employees. One of them is
quoted thus “It is no doubt that job satisfaction of employees is dependent on provision for leave,
among other things.”
4.8.2 Provision for personal development
Respondents were asked to rate on a five point likert scale whether provision for personal
development has influenced job satisfaction among headquarters employees of Government of
Makueni County and the findings are as shown in table 4.40.
75
Table 4. 25: Provision for personal development
______________________________________________________________________________
Scale
Frequency
Percentage
Strongly disagree
2
3%
Disagree
14
22%
Neutral
1
1%
Agree
20
31%
Strongly agree
27
42%
TOTAL
64
100%
Study findings showed that 42% of the respondents strongly agreed that provision for personal
development has influenced job satisfaction among headquarters employees of Government of
Makueni County and 31% of respondents who agreed with this. 22% of the respondents
disagreed that provision for personal development has influenced job satisfaction among
headquarters employees of Government of Makueni County followed by 3% who strongly
disagreed with this and 1% were indifferent in this. “…If it were not for the programmes that
these employees are provide for to develop themselves, turn over would be so high, we would be
losing our employees to other organizations..”, said one of the top management officials.
4.8.3 Provision for labor policies
Respondents were asked to rate on a five point likert scale whether provision for labor policy has
influenced job satisfaction among headquarters employees of Government of Makueni County
and the findings are shown in table 4.41.
76
Table 4. 41: Provision for labor policies
______________________________________________________________________________
Scale
Frequency
Percentage
Strongly disagree
9
14%
Disagree
2
3%
Neutral
4
6%
Agree
25
39%
Strongly agree
24
38%
TOTAL
64
100%
According to the study findings 39% of the respondents agreed that provision for labor policy
has influenced job satisfaction among headquarters employees of Government of Makueni
County followed by 38% of respondents who strongly agreed to this. 14% of the respondents
strongly disagreed that provision for labor policy has influenced job satisfaction among
headquarters employees of Government of Makueni County followed by 6% of respondents who
were indifferent in this. Only 3% of the respondents disagreed that provision for labor policy has
influenced job satisfaction among headquarters employees of Government of Makueni County.
From the interview sessions, all of the interviewed four officials agreed that provision for labor
policies has influenced job satisfaction among headquarters employees of Government of
Makueni County. One of the respondents asserted “You can most definitely never separate labor
policies from job satisfaction, the two are related.”
77
4.8.4 Provision for employee welfare policies
Respondents were asked to rate on a five point likert scale whether provision for employee
welfare policies has influenced job satisfaction among headquarters employees of Government
of Makueni County and the findings are shown in table 4.42.
Table 4. 42: Provision for employee welfare policies
______________________________________________________________________________
Scale
Frequency
Percentage
Strongly disagree
3
5%
Disagree
21
33%
Neutral
5
8%
Agree
22
34%
Strongly agree
13
20%
TOTAL
64
100%
The study found out that provision for employee welfare policies has influenced job satisfaction
among headquarters employees of Government of Makueni County as indicated by 34% of
respondents who agreed to this statement and 20% who strongly agreed to this. 33% of
respondents disagreed that provision for employee welfare policies has influenced job
satisfaction among headquarters employees of Government of Makueni County while 8% of the
respondents were indifferent on this. Only 5% of the respondents strongly disagreed that
provision for employee welfare policies has influenced job satisfaction among headquarters
employees of Government of Makueni County. The study findings show that provision for
employee welfare policies influences job satisfaction among Government of Makueni County
Headquarters employees. This is as evidenced by one of the interview respondents who says
“…at the point where provision of employee welfare programmes ends, that is where job
78
satisfaction of employees ends, and headquarters employees of Government of Makueni County
are by no means different.” This gives more weight to the quantitative findings of the study.
79
4.8.5 Main work life balance factor that has influenced job satisfaction
Respondents were asked to indicate the extent to which they agreed to listed factors‟ that are
related to work-life balance influence on job satisfaction. Mean and standard deviation of the
responses to factors that influence job satisfaction was calculated. The findings are shown in
table 4.43.
Table 4.43: Main work life balance factor that has influenced job satisfaction
FACTORS
SCALES
SD
Leave provision
Personal development
Labor policies
Employee welfare
D
N
A
SA
%
23
13
1
47
16
F
15
8
1
30
10
%
3
22
1
31
42
F
2
14
1
20
27
%
14
3
6
39
38
F
9
2
4
25
24
%
5
33
8
34
20
F
3
21
5
22
13
M
SDv
2.84
1.46
2.08
1.21
2.14
1.36
2.69
1.25
Where SD- Strongly disagree, D-disagree, N-neutral, A- Agree, SA-strongly agree, M-mean,
SDv- standard deviation.
80
The study found out that provision for personal development policy, with a mean of 2.08 was the
main factor that had influenced job satisfaction among Government of Makueni County
Headquarters employees. This was followed by provision for labor policy which had a mean of
2.14 and then by provision for employee welfare policy which had a mean of 2.69. Provision for
leave, with a mean of 2.84, was the work-life balance factor that had influenced job satisfaction
among Government of Makueni County Headquarters employees the least. This is in line with an
assertion by one of the interviewed top officials who said, “Ultimately, when you develop an
employee, the skill or knowledge imparted remains with him/her. This then brings us to the
conclusion that personal development of employees lies at the center of work-life balance.”
4.9 Statement concerning job satisfaction
This section sought to gauge employees‟ job satisfaction with regard to work-life balance
policies and practices in the Government of Makueni County Headquarters. The findings are as
shown in table 4.44.
Table 4. 44: Statement concerning job satisfaction
Generally, would you say you are satisfied with your job with regard to work-life balance
policies and practices? Kindly indicate on a scale of 1-5 where: Strongly Agree = 5 Agree= 4
Neutral = Disagree = 2 strongly disagree = 1
Scale
Frequency
Strongly Agree
13
20%
Agree
9
14%
Neutral
1
2%
Disagree
19
30%
Strongly disagree
22
34%
TOTAL
64
100%
81
Percentage
From the study findings, 34% of the employees strongly disagreed that they were satisfied with
their jobs with regard to work-life balance policies and practices, 30% disagreed that they were
satisfied with their jobs with regard to work-life balance policies and practices. 2% of the
respondents were indifferent while 14% agreed that they were satisfied with their jobs. 20%
strongly agreed that they were satisfied with their jobs with regard to work-life balance policies
and practices put in place by the Government of Makueni County.
4.10 Hypothesis testing
Hypothesis was framed and was tested using Chi- square test. To test the hypotheses of the
study, chi-square test was conducted with a significance test at .05% level. The formula used for
calculating chi- square value is as follows:
X²=Σ (O-E) ²
_____
E
Where, E- Expected frequency
O- Observed frequency
The use of the chi-square (X2) was to test the hypotheses (H1 - H4) by determining the strength
of the relationship between the variables with a .05% significant level, meaning that there is only
a 5 percent chance that the statistical significance, if any, resulted from random chance. The
premise for the validity and consistency of the analysis is the calculation of the P-value. The pvalue is the probability that a sample drawn from a population is tested given that the
assumptions proposed by the study are true.
82
Table 4. 26: Expected frequency and computed chi-square (X2 ) of provision for leave and
job satisfaction.
Observed frequency (O) Expected frequency (E)
O-E
(O-E)2
(O-E)2
______
E
Strongly agree
9
12.8
-3.8
14.44
1.13
Agree
31
12.8
18.2
331.24
25.87
Neutral
0
12.8
-12.8
163.84
12.8
Disagree
9
12.8
-3.8
14.44
1.13
Strongly disagree
15
12.8
2.2
4.84
0.38
∑ X2 = 41.31
Table 4.45 above presents the observed and expected frequencies with the computed chi-square
statistics for the measures of the organization under study (Government of Makueni County). To
test the first hypothesis, the chi-square statistic was calculated using the model:
X²=Σ (O-E) ²
_____
E
∑ = Summation
O= Observed frequency, i.e. from table 4.39 above
E = Expected frequency, i.e. (Row total x column total)
_____________________
Grand total
83
H1: There is no significant relationship between provision for leave and job satisfaction among
headquarters employees of Government of Makueni County. Chi-square was used as a test
statistic at significance level of .05% (i.e. α = 0.5), and the degree of freedom (df=4), computed
chi-square (X2 ) = 41.31 and chi-square critical = 9.49. Thus the hypothesis (H1) at 5% level of
significance was nullified since chi-square (X2) computed 41.31was more than chi-square
critical. Therefore the hypothesis of the study which indicates that there is no significant
relationship between provision for leave and job satisfaction of employees at Government of
Makueni County headquarters was rejected and the alternative hypothesis accepted.
Table 4. 46: Expected frequencies and computed chi-square (X2 ) of provision for personal
development and job satisfaction.
Observed frequency (O) Expected frequency (E)
O-E
(O-E)2
(O-E)2
______
E
Strongly Agree
27
12.8
14.2
201.64
15.75
Agree
21
12.8
8.2
67.24
5.25
Neutral
1
12.8
-11.8
139.24
10.88
Disagree
14
12.8
1.2
1.44
0.1125
1
12.8
-11.8
139.24
10.88
Strongly disagree
∑ X2 = 42.87
84
Table 4.46 above presents the observed and expected frequencies with the computed chi-square
statistics for the measures of the organization under study (Government of Makueni County). To
test the second hypothesis, the chi-square statistic was calculated using the model:
X²=Σ (O-E) ²
_____
E
∑ = Summation
O= Observed frequency, i.e. from table 4.40 above
E = Expected frequency, i.e. (Row total x column total)
_____________________
Grand total
H2: There is no significant relationship between provision for personal development and job
satisfaction among headquarters employees of Government of Makueni County. Chi-square was
used as a test statistic at significance level of .05% (i.e. α = 0.5), and the degree of freedom
(df=4), computed chi-square (X2 ) = 42.87 and chi-square critical = 9.49
Thus the hypothesis (H2) at 5% level of significance was nullified since chi-square (X2)
computed (42.87) was more than chi-square critical 9.49. Therefore the hypothesis of the study
which indicates that there is no significant relationship between provision for personal
development and job satisfaction of employees of Government of Makueni County was rejected
and the alternative hypothesis accepted.
85
Table 4. 27: Expected frequency and computed chi-square (X2 ) of provision for labor
policy and job satisfaction.
Observed frequency (O) Expected frequency (E)
O-E
(O-E)2
(O-E)2
______
E
Strongly Agree
25
12.8
12.2
148.84
11.63
Agree
25
12.8
12.2
148.84
11.63
Neutral
3
12.8
-9.8
96.04
7.05
Disagree
2
12.8
-10.8
116.64
9.11
Strongly disagree 9
12.8
-3.8
14.44
1.13
∑ X2 = 40.55
Table 4.47 above presents the observed and expected frequencies with the computed chi-square
statistics for the measures of the organization under study (Government of Makueni County). To
test the third hypothesis, the chi-square statistic was calculated using the model:
X²=Σ (O-E) ²
_____
E
∑ = Summation
O= Observed frequency, i.e. from table 4.41 above
E = Expected frequency, i.e. (Row total x column total)
_____________________
Grand total
86
H3: There is no significant relationship between provision for labor policy and job satisfaction
among headquarters employees of Government of Makueni County. Chi-square was used as a
test statistic at significance level of .05% (i.e. α = 0.5), and the degree of freedom (df=4),
computed chi-square (X2) = 40.55 and chi-square critical = 9.49. Thus the hypothesis (H3) at 5%
level of significance was nullified since chi-square (X2) computed 40.55 was more than chisquare critical. Therefore the hypothesis of the study which indicates that there is no significant
relationship between provision for labor policy and job satisfaction among employees of
Government of Makueni County headquarters was rejected and the alternative hypothesis
accepted.
Table 4. 48: Expected frequencies and computed chi-square (X2) of provision for employee
welfare policy and job satisfaction.
Observed frequency (O) Expected frequency (E)
O-E
(O-E)2
(O-E)2
______
E
Strongly agree
12
12.8
-8
64
5
Agree
23
12.8
10.2
104.04
8.13
Neutral
5
12.8
-7.8
60.84
4.75
Disagree
21
12.8
8.2
67.24
5.25
Strongly disagree
3
12.8
-9.8
96.04
7.50
∑ X2 = 25.69
87
Table 4.48 above presents the observed and expected frequencies with the computed chi-square
statistics for the measures of the organization under study (Government of Makueni County). To
test the last hypothesis, the chi-square statistic was calculated using the model:
X²=Σ (O-E) ²
________
E
∑ = Summation
O= Observed frequency, i.e. from table 4.42 above
E = Expected frequency, i.e. (Row total x column total)
_____________________
Grand total
H4: There is no significant relationship between provision for welfare policy and job satisfaction
among headquarters employees of Government of Makueni County. Chi-square was used as a
test statistic at significance level of .05% (i.e. α = 0.5), and the degree of freedom (df=4),
computed chi-square (X2) = 25.69 and chi-square critical 9.49. Thus the hypothesis (H4) at 5%
level of significance was nullified since chi-square (X2) computed 25.69 was more than chisquare critical. Therefore the hypothesis of the study which indicates that there is no significant
relationship between provision for welfare policy and job satisfaction of employees at
Government of Makueni County headquarters was rejected and the alternative hypothesis
accepted.
88
CHAPTER 5
SUMMARY, CONCLUSIONS AND RECOMMENDATIONS
5.1 Introduction
This chapter summarizes the findings, discussions, conclusions and recommendations based on
the analysis in chapter four. It also outlines the contribution to the body of knowledge and
suggestions for further research.
5.2 Summary
This section provides a summary of the findings as presented in chapter four of the study. The
aim of this research was to analyze the influence of work-life balance policies on employee job
satisfaction among Government of Makueni County Headquarters employees. The study used
descriptive and inferential statistics, and analyzed data using statistical package for social
scientists. Qualitative data arising from interview guide and open ended questions in
questionnaires was analyzed using content analysis. Major findings of the research were
generated and presented in chapter four of the research project report.
In response to demographic characteristics, the study findings indicated that there were more
male employees than female employees working at the Government of Makueni County
Headquarters. This is evidenced by 55% of male respondents against 45% of female respondents.
Majority of the respondents (42%) were between the ages 41-50 years. On marital status, it was
established that 39% of the respondents were married, making up the majority. 38% of the
informants were in middle level management.
89
Based on objective one which sought to assess if provision for leave was related to job
satisfaction, 86% of the respondents were on the affirmative. This was backed up by50% of the
respondents who strongly agreed that provision for leave influences job satisfaction.
Compensation not to take leave influences job satisfaction as indicated by 50% of respondents
who agreed with this. 43% strongly agreed that provision for maternity/ paternal leave had an
influence on job satisfaction. 41% strongly agreed that carrying forward leave days had an
influence on job satisfaction while 39% strongly agreed that provision for sick leave had an
influence on job satisfaction. 41% strongly agreed that getting time off to care for family
emergencies had an influence on job satisfaction. Lastly, 30% of the respondents agreed that
being able to schedule their preferred day-offs had an influence on job satisfaction among
headquarters employees of Government of Makueni County.
Regarding objective two which sought to establish the influence of personal development
policies on job satisfaction, the findings revealed that there was a significant relationship
between personal development policies and job satisfaction among Government of Makueni
County Headquarters employees as reported by 80% of the respondents who agreed with this.
This statement was supported by 53% of the respondents who strongly agreed that employee
training influenced job satisfaction while 48% agreed that provision for study leave had an
influence on job satisfaction. School fees paid by an employer had an influence on job
satisfaction as indicated by 42% of the respondents who strongly agreed to this factor.
Relocation assistance policy influences job satisfaction as evidenced by 47% of the respondents
who agree with this. 36% strongly agreed that access to short courses influenced job satisfaction
while 42% agreed that full sponsorships for long courses had an influence on job satisfaction.
90
In reference to objective three which sought to determine if provision for labor policy was
related to job satisfaction among Government of Makueni County headquarters staffs, 81% were
to the affirmative while 19% declined. This was backed up by 63% who strongly agreed to this.
Review of employment terms from time to time had an influence on job satisfaction as indicated
by 52% who agreed to this. 51% of the respondents strongly agreed that due process in
disciplinary matters influenced job satisfaction; while 34% strongly agreed that workplace health
and safety had an influence on employee job satisfaction. Anti- harassment policy has an
influence on job satisfaction as shown by 38% of the respondents who agreed to this. Antigender based violence policy influences job satisfaction as shown by 42% of respondents who
strongly agreed to this. Membership to labor unions influences job satisfaction as indicated by
55% who were in agreement with this.
Regarding objective four which sought to establish if employee welfare policies had any
significant relationship with job satisfaction, 81% of the respondents strongly agreed with this
statement. Team building, retreats and family days had an influence on job satisfaction as
indicated by 51% of respondents who strongly agreed to this. 59% agreed that availability of
healthcare facilities influenced job satisfaction while 40% agreed that provision for
bereavement/compassionate leave influences job satisfaction among Government of Makueni
County headquarters employees. 35% agreed that availability of recreational facilities had an
influence on job satisfaction while 32% strongly agreed that personal/family issues influence job
satisfaction among Government of Makueni County headquarters employees. Medical cover for
employees and dependents influences job satisfaction as indicated by 32% of respondents who
agreed to this. 34% strongly agreed that compensation for overtime influences job satisfaction
91
while 31% strongly agreed that commuter and house allowance influence job satisfaction among
Government of Makueni County headquarters employees.
5.3 Conclusions
The work-life balance problem calls for a serious concern especially in newly formed county
governments, the more reason why this study turned a beam light on the subject matter. From the
findings of the study, it was revealed that work-life balance policies influence job satisfaction
among Government of Makueni County Headquarters employees. Thus the study concludes that
work-life balance policies influence employee job satisfaction at the Government of Makueni
County Headquarters. Regarding demographic characteristics of the respondents, the study
concluded that work-life balance is an issue that is crosscutting regardless of gender, marital
status, age, and so on. This is because at least all of the demographic categories represented in
the questionnaire had a positive response.
Based on objective one, the study found out that there was a significant relationship between
provisions for leave and job satisfaction among headquarter employees of Government of
Makueni County. Thus the study concludes that provision for leave influences job satisfaction
among Government of Makueni County Headquarters employees. Regarding objective two, the
study found out that there is a significant relationship between personal development policy and
job satisfaction among headquarter employees of Government of Makueni County. Thus the
study concludes that provision for personal development policy influences job satisfaction
among Government of Makueni County Headquarters employees.
92
In reference to objective three, the study found out that there is a significant relationship between
provision of labor policies and job satisfaction among headquarters employees of Government of
Makueni County. Thus the study concludes that provision of labor policies influences job
satisfaction among Government of Makueni County headquarters employees.
On objective four, it was found out that employee welfare policies have a significant relationship
with job satisfaction among headquarters employees of Government of Makueni County. Thus
the study concludes that employee welfare policies influence job satisfaction among
headquarters employees of Government of Makueni County.
5.4 Recommendations.
From the findings and conclusions, the study recommends that there is need for organizations to
enhance their work-life balance policies as it was found out that work-life balance policies
enhance job satisfaction at the Government of Makueni County headquarters. The study
recommends the formulation and implementation of work-life balance policies which should be
cascaded to the departmental level. Existent policies should be enriched to ensure that they are
comprehensive and suit the needs of employees. Adequate financial and human resources should
be allocated for the implementation of work-life balance polices because they would not yield
any meaningful result without resource mobilization.
It is also recommended that the Government of Makueni County, together with all relevant
stakeholders, should claim ownership of the work-life balance policies process to ensure that the
process is sustainable. Furthermore, those in the policy and budgetary chain should be educated
to ensure work-life balance policies are not left out as a budgetary component and a strategic
human resource policy issue. Finally, the Government of Kenya should strengthen collaborations
between work-life balance policies and those responsible for their implementation. In a nutshell,
93
the results of this study gives a basis for the recommendation that the Government of Makueni
County should improve the work-life balance policies offered to employees in order to increase
their job satisfaction.
5.4.1 Contribution to existing body of knowledge
This study appreciates other scholarly work that has been done on the area of work-life balance
as it relates to job satisfaction. The study proves to be a milestone for researchers, policy makers
and students to properly understand the concepts of employee job satisfaction, work-life balance
and how they relate with each other. The study is however open to academic criticism.
5.4.2 Suggestions for further research
Building on this study, it may be fruitful for future research to explore the area of work-life
balance strategies from the perspective of other stakeholders apart from employees and
employers. Future research could identify the costs associated with formulation, implementation,
monitoring, evaluation and maintenance of work-life balance strategies within public institutions.
94
References
Abrahamson, M. (1983).Social Research Methods. Englewood Cliffs, NJ: Prentice Hall.
Bardoel,E., P. Tharenou and S. Moss. 1998. Organizational Predictors of Work-family Practices.Asia
Pacific Journal of Human Resources 36 (3): 31-49.
Becker, B. and M. Huselid. 1998. High Performance Work Systems and Firm Performance: A Synthesis
of Research and Managerial Implications. Research in Personnel and Human Resource
Management 16: 53-101.
Campbell, D. J., Campbell, K.M. & Kennard, D. (1994). The Effects of Family Responsibilities on the
Work Commitment and Job Performance of Nonprofessional Women. Journal of Occupational
and Organizational Psychology, 67, 283-296.
Cappelli, P. 2000. A Market-Driven Approach to Retaining Talent.Harvard Business Review 78 (1):
103-111.
Clark, S. C. (2004). Work/family Border Theory: A New Theory of Work/family Balance. Human
Relations, 53, 747-770.
Constitution of Kenya (2010).
Cooper, J. and Schedler, D. (2006). Business Research Methods, 9th Ed: New York, McGraw Hill.
Dunne, H., (2007). Putting Balance into Business: Work/life Balance as a Business Strategy for
Avoiding Brain Drain, Strategy HR Review, Vol.6 Iss: 6, pp.28-31.
Eikhof, D.R., Warhurst, C., &Haunschild, A., (2007). Introduction: What Work? What life? What
balance? : Critical Reflections on the Work-life Balance Debate. Employee Relation, Vol 29 Iss:
4, pp. 325-333.
Emerald Article, Human Resource Management International Digest, vol. 16 Iss: 6, 2008.
Employment Act No.11 of 2007
Erwin, P.J. and R.D. Iverson. 1994. Strategies in Absence Management. Asia Pacific Journal of Human
Resources 32 (3): 13-32.
Flick, M. (2002). An Introduction to Qualitative Research: London, Sage Publishers.
Foley, S. & Powell, N. (1997).Re-conceptualizing Work-Family Conflict for Business- Marriage
Partner: A Theoretical Model. Journal of Small Business Management, 35(4), 36-47.
95
Furnham, A. (1994). Personality at Work: The Role of Individual Differences in the Workplace.
Routledge.
Goodstein, J.D. (1994). Institutional Pressures and Strategic Responsiveness: Employer Involvement in
Work-family Issues. The Academy of Management Journal Vol. 37, No. 2 (Apr., 1994), pp.350382.
Gray, D. (2004). Doing Research in the Real World: London, Sage Publications.
Greenberg, J. and Baron, A.R., (2008). Behaviour in Organization 9th ed. Pearson Education, Inc.,
Upper Saddle River, New Jersey 07458, USA.
Grover, S.L. and K.J. Crooker. 1995. Who appreciates family-responsive human resource policies: The
impact of family-friendly policies on the organizational attached of parents and non-parents.
Personnel Psychology 48 (2): 271-288.
Higgins, C.A., Duxbury, L.E. and Irving, R.H. (1992).Work-Family Conflict in the Dual-Career Family.
Organizational Behaviour and Human Decision Processes, 51(1):51-75.
Hobson, C.J., L. Delunas and D.Kesic. 2001. Compelling evidence of the need for corporate work/life
balance initiatives: Results from a national survey of stressful life-events. Journal of
Employment Counseling 38(1): 38-44.
Houston, D.M., &Waumsley, J.A. (2003).Attitudes to Flexible Working and family Life. York: JRF
Policy Press.
Joplin, J.R.W. and C.S. Daus. 1997. Challenges of leading a Diverse Workforce. Academy of
Management Executive 11 (3).
Konrad, A.M., &Mangel, R. (2000).The Impact of Work-life Programmes on Firm Productivity.
Strategic Management Journal 21: 1225-1237.
Kossek, E., P. Dass, and B. DeMarr.1994. The dominant logic of employer sponsored work and family
initiatives: Human Resource Manager‟s Institutional Role. Human Relations 47 (9):1121-1139.
Kothari C. R. (2008). Research Methodology: Methodology and Techniques (2 ed.). Age International
Publishers: New Delhi.
Kramar, R. 1997.Developing and Implementing work and family policies. Asia Pacific Journal of
Human Resources 35 (3): 24-32.
Lambert, S. 2000. Added Benefits: The Link Between Work-life Benefits and Organizational Citizenship
Behavior. Academy of Management Journal 24 (1): 31-48.
96
Levine, D. (1995). Reinventing the Workplace: How Business and Employees Can Both Win. Brookings
Institution.
Lewis, S. & Cooper. 1995. Balancing the Work/home Interface: A European Perspective. Human
Resource Management Review 5 (4): 289-305.
Miller, Ann R. (1978).Changing Work Life Patterns: A Twenty-Five Year Review. Annals of the
American Academy of Political and Social Science. Vol. 435, America in the Seventies: Some
Social Indicators. Pp. 83-101, Sage Publications, Inc. in association with The American
Academy of Political and Social Science.
Morris, M.L., & Madsen, S. R. (2007).Advancing Work-life Integration in Individuals, Organizations,
and Communities. Advances in Developing Human Resources, (9) 439-454.
Mugenda, O. and Mugenda, A. (2003), Research Methods: Quantitative and Qualitative Approaches,
Acts Press, Nairobi.
Mukururi, N., and Ngari, M. (2014). Influence of Work-life Balance Policies on Employee Job
satisfaction in Kenya‟s Banking Sector: A Case of Commercial Banks in Nairobi‟s Central
Business District. IOSR Journal of humanities and Social sciences. Volume 19, issue 3, Ver. II.
PP 102-112
Mullins, W. (2010).Management and Organizational Behaviour. Prentice Hall. Great Britain.
Oloitiptip, R. &Gachunga, H., (2013), Influence of Work-life Balance on Organizational Performance at
Kenya Power, International Journal of Innovative Social and Science Education Research, 2(1),
69-85.
Orodho, A., J. (2003). Essentials of Educational and Social Science Research Methods. Nairobi: Mazola
Publishers.
Oso,Y. and Onen, D. (2009) General Guide to Writing Research Proposal and Report. A Handbook of
Beginning Researchers: Nairobi, Jomo Kenyatta Foundation.
Ratzon, N., et al., (2011).Are Young Adults with Special Needs Ready for the Physical Work Demands?
Research in Developmental Disabilities, 32, 371-376, ELSEVIER.
Reynolds, J. (2005). In the Face of Conflict: Work-life Conflict and Desired Work Hour Adjustments.
Journal of Marriage and Family, Vol.67, N).5, pp.1313-1331, National Council of Family
Relations.
Robbins, (2011). Organizational Behavior. Prentice Hall. New Jersey. USA.
97
Smith, W. (1975).Strategies of Social Research. Englewood Cliffs, NJ: Prentice Hall.
Specter, P. E., Job satisfaction: Application, Assessment, Causes, and Consequences, Sage, London,
1997.
Tulgan, B. (1996). Managing Generation X: How to Bring out the Best in Young Talent. Capstone.
Oford.
Vloeberghs, D., (2002). An Original and Data Based Approach to Work-life Balance. Equal
Opportunities International, Vol.21 Iss: 2, pp.25-57.
Waweru, E.M. (1984). Management of Human Resources in Kenya. Kenya Literature Bureau. Nairobi.
Way, N.2000. Talent War. Business Review Weekly August 18:64.
Welman, C. and Mitchelle, B. (2005). Research Methodology, 3rd ed. Cape Town: Oxford University
Press.
98
APPENDIX 1: QUESTIONNAIRE FOR EMPLOYEES
SERIAL NO……….
I am a student at South Eastern Kenya University taking MBA (Strategic Management option). I
am carrying out a research to determine the influence of work life balance policies on employee
job satisfaction. The target of the study is Government of Makueni County headquarters
employees and you have been identified to participate by way of responding to a questionnaire.
This is therefore to kindly request you to fill the questionnaire according to your understanding
of the questions and statements herein. Information provided will be treated with utmost
confidentiality. Do not write your name on the questionnaire.
SECTION A
1.
Age (tick one)
a)
Below 20 years
b)
21-40 years
c)
41-60 years
d)
Above 60 years
2.
Gender (tick one)
a)
Male
b)
Female
3.
Department………………………………………………..
4.
What is your level of management in the organization? (Tick one).
a)
Top level
b)
Middle level
c)
Low level
99
d)
Don‟t know
SECTION B
1. Provision for leave and job satisfaction
a) Do you think provision for leave influences job satisfaction (tick one)?
Yes
No
b). Please indicate the extent to which you agree to the following factors‟ influence on job
satisfaction on a scale of 1-5 where: Strongly Agree = 5 Agree= 4 Neutral = Disagree = 2
strongly disagree = 1
Indicator
5
1.
Provision for annual leave
2.
Compensation not to take leave
3.
Provision
for
Maternity/annual
leave
4.
Carrying forward leave days
5.
Sick leave
6.
Getting time off to care for family
emergencies
7.
Being
able
to
schedule
your
preferred day-offs
100
4
3
2
1
2. Personal development policies and job satisfaction
a) Do you think provision for personal development policies influences job satisfaction (tick
one)?
Yes
No
b)
Please indicate the extent to which you agree to the following factors‟ influence on job
satisfaction on a scale of 1-5 where: Strongly Agree=5 Agree=4 Neutral=3 Disagree =2 Strongly
disagree=1
Indicator
1.
5
Employee training in a Government
institution
2.
Provision to go for study leave
3.
Relocation assistance policy
4.
School fees paid by your employer
5.
Existence of employee assistance
programmes
6.
Access to full sponsorships for long
courses
7.
Access to short courses and in-
house training
101
4
3
2
1
3. Provision of labor policies and job satisfaction
a) Do you think provision for labor policies influences job satisfaction (Tick one)?
Yes
No
b) Please indicate the extent to which you agree to the following factors‟ influence on job
satisfaction on a scale of 1-5 where: Strongly Agree=5 Agree=4 Neutral=3 Disagree =2 strongly
disagree=1
Indicator
1.
Existence of labor policies
2.
Time to time review of employment
5
terms
3.
Membership to labor unions
4.
Due process in disciplinary matters
5.
Workplace health and safety
6.
Anti-harassment policy
7.
Anti-gender based violence policy
102
4
3
2
1
4. Employee welfare policies and job satisfaction
a) Do you think provision for personal development policies influences job satisfaction (Tick
one)?
Yes
No
b) Please indicate the extent to which you agree to the following factors‟ influence on job
satisfaction on a scale of 1-5 where: Strongly Agree=5 Agree=4 Neutral=3 Disagree =2 strongly
disagree=1
Indicator
5
1.
Team building and retreats and family days
2.
Availability of healthcare facilities
3.
Provision for bereavement/compassionate leave
4.
Availability of recreational facilities
5.
Personal/family issues
6.
Medical cover for employees and dependents
7.
Compensation for overtime
8.
Commuter and house allowances
103
4
3
2
1
MEASUREMENT OF DEPENDENT VARIABLE
a). Do you think work-life balance policies are related to job satisfaction? (Tick one)
Yes
No
b) Please indicate the degree to which you agree to the following FACTORS. Strongly agree=1
Agree=2 Neutral=3 Disagree =4 strongly disagree=5
FACTOR
1
5
Provision for leave has influenced job satisfaction
among headquarters employees of Government of Makueni
County.
2
job
Provision for personal development has influenced
satisfaction
among
headquarters
employees
of
Government of Makueni County.
3
Provision for labor policy has influenced job
satisfaction among headquarters employees of Government
of Makueni County.
4
Provision
of
employee
welfare
policies
has
influenced job satisfaction among headquarters employees
of Government of Makueni County.
5
Generally, would you say you are satisfied with your
job with regard to work-life balance policies and practices?
104
4
3
2
1
5.
Please indicate your marital status (Tick one).
a)
Single
b)
Married
c)
Divorced
d)
Widowed
e)
Separated
Thank you very much for your time.
105
APPENDIX II: INTERVIEW GUIDE FOR DEPARTMENTAL HEADS
Dear respondent, these interview questions are meant to collect information on a study that is
being conducted among staff of Government of Makueni County on the topic „Influence of
work-life balance policies on job satisfaction among staff of Government of Makueni County‟ in
partial fulfillment of my Master of Business Administration degree in Strategic Management.
Kindly answer the questions honestly. Information shared will be treated with utmost
confidentiality.
1. Do you think provision for leave influences job satisfaction among your staff?
2. Do you think provision personal development of your staff influences their job
satisfaction?
3. Do you think provision for labor policies influences job satisfaction among your staff?
4. Do you think provision for employee welfare schemes/programmes influences job
satisfaction among your staff?
Thank you for your time and cooperation.
106
APPENDIX III: AUTHORIZATION LETTER FROM SEKU
107
APPENDIX IV: INTRODUCTION LETTER FROM SEKU
108
APPENDIX V: APPROVAL FROM GOVERNMENT OF MAKUENI COUNTY
109
APPENDIX VI: THE X2 (CHI-SQUARE) DISTRIBUTION CHART
df
1
2
3
4
5
6
7
8
9
10
11
12
13
14
15
16
17
18
19
20
21
22
23
24
25
26
27
28
29
30
40
50
Probability Values
0.05
0.025
0.01
3.841
5.991
7.815
9.488
11.070
12.592
14.067
15.507
16.919
18.307
19.675
21.026
22.362
23.685
24.996
26.296
27.587
28.869
30.144
31.410
32.671
33.924
35.172
36.415
37.652
38.885
40.113
41.337
42.557
43.773
55.758
67.505
5.024
7.378
9.348
11.143
12.833
14.449
16.013
17.535
19.023
20.483
21.920
23.337
24.736
26.119
27.488
28.845
30.191
31.526
32.852
34.170
35.479
36.781
38.076
39.364
40.646
41.923
43.195
44.461
45.722
46.979
59.342
71.420
6.635
9.210
11.345
13.277
15.086
16.812
18.475
20.090
21.666
23.209
24.725
26.217
27.688
29.141
30.578
32.000
33.409
34.805
36.191
37.566
38.932
40.289
41.638
42.980
44.314
45.642
46.963
48.278
49.588
50.892
63.691
76.154
0.001
10.828
13.816
16.266
18.467
20.515
22.458
24.322
26.125
27.877
29.588
31.264
32.910
34.528
36.123
37.697
39.252
40.790
42.312
43.820
45.315
46.797
48.268
49.728
51.179
52.620
54.052
55.476
56.892
58.301
59.703
73.402
86.661
110

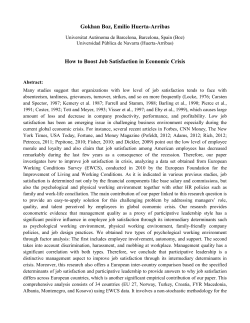


© Copyright 2026