
Tibial Acceleration & Musculotendinous Stiffness in Female Athletes: ACL Injury Prevention
TECHNISCHE UNIVERSITÄT MÜNCHEN Abteilung und Poliklinik für Sportorthopädie (Direktor: Univ.-Prof. Dr. A. Imhoff) Tibial acceleration profiles and musculotendinous stiffness of the lower extremity during the female menstrual cycle. Implications for the prevention of anterior cruciate ligament injuries in the female athlete Erik Hohmann Vollständiger Abdruck der von der Fakultät für Medizin der Technischen Universität München zur Erlangung des akademischen Grades eines Doktors der Medizin genehmigten Dissertation. Vorsitzender: Univ.-Prof. Dr. E. J. Rummeny Prüfer der Dissertation: 1. Univ.-Prof. Dr. A. Imhoff 2. Priv.-Doz. Dr. S. W. Vogt Die Dissertation wurde am 09.05.2011 bei der Technischen Universität München eingereicht und durch die Fakultät für Medizin am 20.06.2012 angenommen. Table of Contents 1. Introduction 1.1. Etiology of Anterior Cruciate Ligament Injuries .............................................. 1.2. Risk Factors in Females ................................................................................... ......... 1.2.1. Intrinsic Factors .......................................................................................... 1.2.1.1. Anatomy....................................................................................... 1.2.1.2. Hormonal Cycle .......................................................................... 1.2.2. Extrinsic Factors......................................................................................... 1.2.2.1. Environment ............................................................................... 1.2.2.2. Biomechanics ............................................................................. 1.3. Purpose .................................................................................................................... 1.4. Hypothesis ............................................................................................................... 1.5. Limitations ............................................................................................................... 1.6. Delimitations ............................................................................................................ 1 4 5 5 5 6 6 7 9 10 10 11 2. Material and Methods 2.1. Subjects ..................................................................................................................... 12 2.1.1. Inclusion Criteria ....................................................................................... 13 2.1.2. Exclusion Criteria ....................................................................................... 14 2.1.3. Study Group ............................................................................................... 14 2.1.4. Control Group ............................................................................................ 14 2.2. Outcome Measures ................................................................................................... 15 2.2.1. Blood Samples ........................................................................................... 15 2.2.2. Calendar ..................................................................................................... 16 2.2.3. Tibial Acceleration Measurements and Technique ................................... 19 2.2.4. Musculotendinous Stiffness Measurements .............................................. 24 2.3. Flowchart ................................................................................................................. 27 2.4. Data Analysis ........................................................................................................... 29 2.4.1. Blood Samples ........................................................................................... 29 2.4.2. Tibial Acceleration .................................................................................... 29 2.4.3. Musculotendinous Stiffness ...................................................................... 30 2.4.4. Control Group ........................................................................................... 30 2.4.5. Between Gender Comparisons ..................................................................... 30 3. Results 3.1. Demographics Study Group ....................................................................................... 31 3.2. Demographics Control Group .................................................................................... 31 3.3. Blood Analysis ........................................................................................................ 32 3.3.1. Study Group .............................................................................................. 32 3.3.2. Control Group ........................................................................................... 33 3.4. Tibial Acceleration Profiles ......................................................................................... 34 3.4.1. Study Group ............................................................................................... 34 3.4.1.1. Peak Tibial Acceleration ............................................................. 34 3.4.1.2. Time to Peak Tibial Acceleration ............................................... 34 I 3.4.1.3. Time to Zero Tibial Acceleration ........................................................... 35 3.4.2. Control Group ............................................................................................ 35 3.4.3. Tibial Acceleration Profiles Between Groups And Phases ........................ 36 3.5. Musculotendinous Stiffness ...................................................................................... 37 3.5.1. Study Group ............................................................................................... 37 3.5.2. Control Group ............................................................................................. 38 3.5.3. Musculotendinous Stiffness between groups and phases ..............................38 4. Discussion 4.1. Introduction ............................................................................................................... 40 4.2. Demographics .............................................................................................................. 40 4.3. Blood Samples – Hormone Analysis ........................................................................ 41 4.4. Tibial Acceleration Profiles ...................................................................................... 42 4.5. Musculotendinous Stiffness ...................................................................................... 48 4.6. Limitations .............................................................................................................. 52 4.7. Conclusion .............................................................................................................. 52 5. Summary ................................................................................................................. 54 6. References .................................................................................................................. 56 7. List of Figures .......................................................................................................... 64 8. List of Tables ............................................................................................................ 66 9. List of Abbreviations ............................................................................................. 67 10. Dedication ................................................................................................................ 68 11. Acknowledgments ................................................................................................69 Appendix I Human Research Ethics Committee ........................................................................70 Appendix II Informed Consent Form ........................................................................................ 78 Appendix III IKDC Subjective Questionnaire ........................................................................... 80 12. Curriculum Vitae ...................................................................................... ......... 86 II 1. Introduction 1.1. Etiology Of Anterior Cruciate Ligament Injuries The most frequent major injuries to the musculoskeletal system in active men and women occur in the knee and ankle joint [Miyasaka, et al. 1991]. Injuries to the anterior cruciate ligament are serious injuries and are amongst the most common injury patterns to the knee joint [Lephard, et al. 2002; Myklebust, et al. 2005]. Despite advances in surgical reconstruction, only 40-80% of athletes tend to return to their previous activities [Busfield, et al. 2009; Myklebust & Bahr 2005; Shah, et al. 2010]. Injuries to the anterior cruciate ligament (ACL) are associated with functional impairments and disability with the subsequent development of knee osteoarthritis [Øiestad, et al. 2009] with a reported incidence ranging from 10%-90% [Gillquist & Messner 1999; Lohmander, et al. 2007]. Keays, et al. [2010] recently identified five factors to be predictive of osteoarthritis: meniscectomy, chondral damage, patella tendon grafting, weak quadriceps and low quadriceps to hamstring ratios. Age, time delay to surgery, type of post-surgery physical activity, hamstring strength and residual joint laxity were not predictive of osteoarthritis. One of every 3000 people will suffer an anterior cruciate ligament injury in any given year [Lephart, et al. 2002; Miyasaka, et al. 1991]. It is estimated that more than 100,000 anterior cruciate ligament injuries occur in the United States annually [Frank & Jackson 1997]. The total number of primary anterior cruciate ligament reconstructions in the Scandinavian ACL registries from 2004-2007 was reported as 17,632 [Granan, et al. 2009]. The anterior cruciate ligament functions as the main primary stabilizer to anterior translation of the tibia [Butler, et al. 1980; Fukubayashi, et al. 1982]. In addition it serves as the 1 secondary restraint to tibial rotation and valgus/varus forces [Petersen & Zantop 2007]. Anatomically the anterior cruciate ligament consists of two bundles, the anteromedial and posterolateral bundle [Petersen & Zantop 2007] (Figure 1). This division is based on the orientation of the fibres and tensioning characteristics through the range of motion [Paschos, et al. 2010]. The anteromedial bundle shortens from 0 to 30 degrees of flexion followed by progressive lengthening from 30 to 120 degrees of knee flexion. The posterolateral bundle is longest with the knee in full extension and Figure 1: ACL: blue suture antero-medial bundle; green suture postero-lateral bundle. (from Knee Anatomy for Orthopaedic Surgeons, ESSKA, Athens 2004) progressively shortens as the knee flexes to 120 degrees [Amis & Dawkins 1991; Gabriel, et al. 2004]. The mean cross sectional area is 44 mm2. The ultimate tensile load measures up to 2160N in a young adult with stiffness values of 242 N/mm. It can tolerate a strain of approximately 20% before failure occurs [Noyes & Grood 1976]. Over the past decade there has been an increase in interest and participation in sports [National Federation of State High School Associations. 2002 High School Participation Survey]. Females have been shown to be mainly responsible for this greater participation in sporting activities [Giza, et al. 2005; Gwinn, et al. 2000; Viola, et al. 1999]. Female sports participation has increased nine-fold over the last decade and is expected to double within the next 10 years [Hewett, et al. 2005]. A concomitant increase in the incidence of lower extremity injury caused by sporting activities can be expected. It is widely accepted that musculoskeletal injuries with physical activity are sports-specific and not gender-specific [Medrano & Smith 2003]. However, females appear at significantly 2 higher risk of musculoskeletal injury when compared to their male counterparts [Giza, et al. 2005]. Several researchers have demonstrated that a female athlete participating in the same sports is at 2-8 times higher risk for an anterior cruciate ligament injury [Fagenbaum & Darling 2003; Giza, et al. 2005; Gwinn, et al. 2000; Viola, et al. 1999]. This is certainly concerning and raises the question as to why female athletes have a higher incidence of knee injuries, and in particular, ruptures of the anterior cruciate ligament. Seventy percent of all anterior cruciate ligament injuries in females occur as a non-contact injury [Hewett, et al. 2005; Myer, et al. 2005], whereas only 58% of all anterior cruciate ligament injuries in men can be classified as non-contact [Salci, et al. 2004]. Sports involving maneuvers such as deceleration and pivoting, cutting, and sudden change of direction, all pose high risks for all athletes [Eiling, et al. 2007]. The typical description of an injury to the anterior cruciate ligament is a non-contact situation with a planted foot, internal tibial rotation and knee flexion between full extension and 20 degrees of flexion while landing from a jump or during abrupt deceleration [Brophy, et al. 2010; Eiling, et al. 2007; Myklebust, et al. 2003]. Several factors have been implicated for this observed difference in gender disparity but causation has yet to be determined [Hakkinen 1991; Irmischer, et al. 2004; Prodromos, et al. 2007; Wojtys, et al. 2003]. However, the cause for a higher injury rate in females is most likely multifactorial [Brophy, et al. 2010] and will be discussed below. 3 1.2. Risk Factors In Females There are a number of intrinsic and extrinsic factors that may help explain the higher incidence of ligament injuries in females [Anderson, et al. 1987; Eiling, et al. 2007; Griffin 2006; Koga, et al. 2010; Salci, et al. 2004]. Intrinsic risk factors cannot be modified or eliminated, and include gender differences in anatomy such as femoral valgus angle, muscle strength, width of the femoral notch, and the relative smaller size of the anterior cruciate ligament in females in comparison to males [Anderson, et al. 1987; Bell &Jacobs 1986; Fagenbaum & Darling 2003; Hakkinen 1991; James, et al. 2004; Lephard, et al. 2002; Lund-Hanssen, et al. 1994; Medrano & Smith 2003; Rizzo, et al. 2001; Salci, et al. 2004; Tillmann, et al. 2002; Wojtys, et al. 2003]. The most striking intrinsic difference between male and females is their hormonal environment. Females undergo a natural regular fluctuation of their hormone levels during the menstrual cycle. This constant change of internal homeostasis has been suggested to influence ligament and muscle properties during certain stages of the cycle [Eiling, et al. 2007; Romani, et al. 2003; Wojtys, et al. 2002]. Intrinsic factors are genetically determined and cannot be influenced with training interventions or prevention programmes. However, these cyclical changes in mechanical properties related to normal hormonal fluctuations can potentially be mitigated by prescribing oral contraceptives [Hohmann, et al. 2005]. Extrinsic risk factors can be influenced or modified, and can be controlled by both players and coaches. They include environmental factors such as the playing surface (sand, grass, even or uneven ground) and climatic conditions [Griffin, et al. 2000]. Individual biomechanical factors, especially landing strategies following a jump or during ball sports, are also classified as extrinsic factors. The key factor appears to be dynamic activity [Griffin, et al. 2006]. It has 4 been well documented that women tend to land with decreased hip and knee flexion, an increased knee valgus angle and greater knee extension and rotation during deceleration activities [Fagenbaum & Darling 2003; Salci, et al. 2004]. All of which, places increased stress on the anterior cruciate ligament in the female athlete involved with dynamic sports. In fact it describes the typical non-contact mechanism of injury [Koga, et al. 2010]. 1.2.1. Intrinsic Factors 1.2.1.1. Anatomy Females express different anatomical features in comparison to males. The pelvis is wider and the muscles of the lower extremity are less developed and weaker [Griffin, et al. 2000; Griffin, et al. 2006; Toth & Cordasco 2001]. In addition, the visco-elastic properties (stiffness) of the muscle-tendon-units of females tend to show lower values [Eiling, et al. 2007]. Moreover, the anterior cruciate ligament is on average two millimetres smaller than in males [Arendt 2001]. More importantly, the ratio of the width of the femoral insertion of the anterior cruciate ligament on the lateral femoral condyle is significantly smaller highlighting the fact that the femoral imprint of the anterior cruciate ligament has a smaller diameter [Anderson, et al. 1987; Arendt 2001; Lund-Hanssen, et al. 1994; Rizzo, et al. 2001]. In addition, the femoral notch is less round and more narrow [Lund-Hanssen, et al. 1994]. Females also have an increased valgus knee angle and increased external tibial torsion [Malinzak et al 2001]. It is most likely that each of these factors contributes to some degree to the observed higher risk of female athletes sustaining a knee injury. 1.2.1.2. Hormonal Cycle During the menstrual cycle female sex hormones fluctuate periodically. In comparison to males, females have higher serum levels of estrogen throughout the menstrual cycle [Eiling, 5 et al. 2007]. Estrogen is the hormone responsible for an increase in soft-tissue laxity, softening the ligaments and connective tissue in order to prepare for childbirth [Romani, et al. 2003]. In addition, estrogen influences ligament cellular metabolism and renders it more susceptible to injury [Deie, et al. 2002; Shultz, et al. 2005]. Estrogen receptors have been discovered in ligaments, synovial tissues and muscles in females [Liu, et al. 1996]. Follicular stimulating hormone (FSH) is a glycoprotein and its synthesis and release is triggered by gonadotropin-releasing hormone (GnRH) from the hypothalamus. In sexually mature females, FSH acts on the follicle to stimulate estrogen release; in males, FSH acts on the testes to induce sperm production. An effect of FSH on soft-tissues and receptors in other tissues has not been described [Morris & Richards 1995]. Luteinizing hormone (LH) is also synthesized in the hypothalamus, and stimulates the follicle to produce estrogen. In females, a surge of LH triggers ovulation. In males, LH is also known as interstitial cell stimulating hormone (ICSH) and stimulates the Leydig cells to produce testosterone. The effect of LH on the musculoskeletal system is not known and receptor cells in soft-tissues have not been discovered [Morris & Richards 1995]. 1.2.2. Extrinsic Factors 1.2.2.1. Environment The quality of the playing or running surface has long been neglected as a cause for anterior cruciate ligament injuries. However, several studies in Australia [Lambson, et al. 1996; Orchard, et al. 1999; Orchard, et al. 2001; Orchard, et al. 2005] have demonstrated that the surface quality and type of grass both play an important role in preventing knee injuries. Shoe-surface-traction has a positive correlation with ground hardness, dryness and grass cover [Dowling, et al. 2010]. Reducing shoe-surface traction by watering, softer grass, and playing during the “wet season” or during the winter months all can help limit the risk of injuries to 6 the anterior cruciate ligament by allowing more sliding rather then sudden deceleration forces [Orchard, et al. 2001]. One of the best known examples of the playing surface influencing the athlete’s risk of knee injuries, was the renovation of an Australian Rugby Stadium prior to the Rugby World Cup 2003. This resulted in five players sustaining anterior cruciate ligament injuries during the first 240 minutes of football at the ground when it was reopened [Orchard, et al. 2008]. After changing the sand content and turf there were no further knee injuries recorded during the remainder of the season [Orchard, et al. 2008]. 1.2.2.2. Biomechanics These recognized gender specific differences in anatomy have genuine biomechanical consequences that lead to different kinematics, dynamic loading patterns and neuromuscular activation strategies. Women have decreased peak torque values of their lower extremity musculature, even when corrections for body size are made [Bell & Jacobs 1986; Hakkinen 1991]. Slower force production and delays in electromechanical coupling result in difficulties stabilizing the knee under load and during deceleration maneuvers [Eiling, et. al 2007; Bell & Jacobs 1986]. In females, lower hamstring to quadriceps ratios, as well as favouring quadriceps muscle activation over hamstring or gastrocnemius contractions during those maneuvers may place greater forces on the anterior cruciate ligament [Granata, et al. 2002]. Females also land with more knee extension and tend to demonstrate an increased dynamic valgus deformity of the knee during landing tasks [Granata, et al. 2002; Malinzak, et al. 2001]. This potentially reduces hamstring torque and early co-activation of agonistic muscle contraction. One possible explanation is a different muscle activation pattern in females. In contrast to males, females demonstrate a decreased medial to lateral quadriceps strength ratio which may contribute to the dynamic valgus [Bell & Jacobs 1986]. Furthermore, females 7 demonstrate higher ground reaction forces, lower hamstring activity and higher quadriceps peak torque values during landing [Chappell, et al. 2007]. Researchers have examined the effect of hormonal fluctuations on stiffness and knee laxity with equivocal results. Whilst several investigators [Deie, et al. 2002; Heitz 1999; Shultz, et al. 2005] support a positive correlation between estrogen levels and knee laxity, other studies [Beynnon, et al. 2005; Karageanes, et al. 2000; Van Lunen, et al. 2003] have found contrasting evidence. However, these latter studies did not measure hormone concentrations to confirm the actual phase of the cycle and limited their testing to a single specific test day to represent a particular phase of the menstrual cycle for each female subject [Griffin, et al. 2006]. The effect of female hormones on the kinematics of the knee is therefore not clear and needs further evaluation. Standard techniques to assess knee function in orthopaedic surgery consist of clinical examination, the use of arthrometers such as the KT-1000, questionnaires, scoring systems, functional hopping, and strength tests [Petschnig, et al. 1998]. However, none of those tools are able to reflect the contribution of dynamic stabilizers during abrupt deceleration maneuvers [Noyes 1995]. Deceleration in combination with rotational movements with the foot fixed on the ground during landing, has been identified as one of the main causes for non-contact injuries of the anterior cruciate ligament [Hohmann & Bryant 2005; Koga, et al. 2010]. During ground contact the lower extremity is subject to impact forces [LaFortune & Hennig 1991]. Under the action of these impact forces, the lower limb segments experience compressive forces and acceleration transients (shocks) [Hennig & LaFortune 1991, 8 LaFortune, et al 1995]. Tibial acceleration is one of the main indictors of dynamic stability and tibial shock [LaFortune, et al. 1995]. Using accelerometers attached to the proximal tibia, LaFortune, et al. [1995] demonstrated athletes who are able to arrest tibial acceleration faster, tend to display greater knee functionality whether the anterior cruciate ligament is intact, deficient or -reconstructed. Direct attachment of an accelerometer to bone constitutes the most accurate means of measuring the shock travelling through the skeletal structures of the body during locomotion [LaFortune, et al. 1995]. The less traumatic skin mounting technique has been described as a viable alternative, provided the accelerometer has low mass and is properly attached to the skin [LaFortune & Hennig 1991; Lafortune, et al. 1995]. When securely mounted, it provides a reliable measure of the amplitude and temporal characteristics of the shock transmitted to the leg during locomotor activities [Hennig & LaFortune 1991]. To date, no study has investigated whether hormonal fluctuations during the menstrual cycle in female athletes has an effect on the viscoelastic properties (musculotendinous stiffness) of the lower limb musculature and tibial acceleration profiles as an indicator for dynamic stability and tibial shock. 1.3. Purpose Therefore, the purpose of the present research was to investigate whether hormone level fluctuations during the menstrual cycle influence viscoelastic properties (musculotendinous stiffness) and tibial acceleration profiles of the lower extremity. The results of this study will enhance our understanding of the mechanisms contributing to the increased risk of anterior cruciate ligament injuries in females, and shed further light onto the possible relationship to certain phases of the menstrual cycle. Further understanding of the underlying causes of ACL 9 injuries in females may then result in prevention programs or recommendations made to the athlete to reduce gender specific risk factors. 1.4. Hypothesis Based on the previous literature, the following hypotheses have been developed for the present thesis: 1. Fluctuations of estrogen levels during the menstrual cycle will influence tibial acceleration profiles. 2. Fluctuations of estrogen levels during the menstrual cycle will influence musculotendinous stiffness values 1.5. Limitations (1) Laboratory tests cannot replicate all the functional demands an athlete places on his knee during the activities of daily life and participation in sports. Neuromuscular control, compensation mechanisms, and avoidance patterns during certain tasks cannot be assessed in a particular laboratory setting. Furthermore, muscle fatigue may have further profound effects which were not tested. (2) Tibial acceleration was investigated by using a uniaxial accelerometer measuring one- dimensional values only. The kinematics of the knee are indeed complicated in three dimensions, whereas this study only assessed antero-posterior dynamics. (3) Testing reflected a moment in time only and constitutes the status of the knee at that point in time. The influence of previous sporting activity, injuries to the lower extremity, and the use of medication (particularly non-steroidal anti-inflammatory drugs) during menstruation may have affected measurements. 10 (4) The assessment of lower limb function encompasses many variables. Both tibial acceleration and lower limb stiffness values have been shown to be both sensitive and specific [LaFortune et al 1995, Turcot et al 2008]. However, these two variables only indicate lower limb limitations of function. (5) Musculotendinous stiffness measured with the spring mass model relies on hopping at a frequency of 2.2 Hz. Hopping height and ankle pathology, both difficult to control, can result in greater stiffness values with maximal hopping attempts, and could affect the results unpredictably. 1.6. Delimitations (1) Female participants were recruited from a regional area and may not represent a true independent sample of the general athletic population. In addition, the sample consists of young adolescents who would have not yet experienced a high number of hormonal cycles (2) The accelerometer skin mounting technique, although described as a viable alternative to the direct bone mounting technique, can only function as an accurate estimate of the underlying bone acceleration. Movement of the accelerometer relative to the bone may result in inaccurate measurements. 11 2. Material and Methods 2.1. Subjects Subjects were recruited from regional netball teams after initial contact was made via the regional netball coordinator of Central Queensland. A research associate then visited all Aand B-grade teams during a training session, prior to season start, and the research project was discussed with all athletes present. The control group consisted of an age- matched male athletic population who were selected to be members of the Central Comets Rugby League Development Team playing at a similar level. This team is selected by the coaches and trainers of the local professional Comets Rugby League Football Team from the entire Central Queensland Region. Contact was made via the team doctor of the club. Similarly, the research associate presented the research project to all players during a training session. Athletes then had to contact the research associate via telephone or email to choose to participate in the research. All subjects who enrolled on a voluntary basis were recruited for a larger project “ The effect of cyclic female hormones on anterior cruciate ligament laxity and lower limb kinematics during landing and deceleration.” Ethical clearance was obtained from the Human Ethics Research Review Panel at CQUniversity (Appendix 1). Subjects who agreed to participate in the research and fulfilled the selection criteria signed an institutionally-approved Informed Consent Form (Appendix 2) that was countersigned by the legal guardian if the subjects were under the age of 18 years. All testing was conducted according to the Statement on Human Experimentation (National Health and Medical Research Council, 1992). The research project was executed at the air- 12 conditioned laboratory of the Musculoskeletal Research Unit of the CQUniversity, Rockhampton, Australia. Prior to participation, subjects of both the study and control groups were asked to complete the International Knee Documentation Committee Form (IKDC) questionnaire [Appendix 3] and were examined by an orthopaedic surgeon to exclude previous injuries or other existing pathology which may have resulted in the introduction of potential bias. In addition, the five tests described by Carter & Wilkinson [1964] were used for the diagnosis of benign joint hypermobility syndrome to rule out hyperlaxity. Volunteers who tested positive for hyperlaxity were excluded from the study. Each female subject was also required to keep a diary documenting data on their menstrual cycle for three months prior, during and three months following the test period. The following inclusion- and exclusion criteria were used for all subjects: 2.1.1. Inclusion Criteria: For subjects to be included in the study group the following criteria had to be met: 1. Consistent menstrual cycles for at least three months, which included the period of time during the study 2. Menarche more than one year ago 3. No use of hormonal contraceptives or other hormones for three months prior to and during the test sessions 4. Normal range of motion of hip, knee and ankle joint Subjects of the male control group had to only meet criteria 4 in order to be included in the study. 13 2.1.2. Exclusion Criteria: 1. Hyperlaxity syndrome 2. Any injury to the lower extremity twelve months prior or during the test period. 2.1.3. Study Group Eleven adolescent females aged 16.3+0.7 years who were actively playing netball in regional teams (8 A-grade players and state representatives and 3 B-grade players) were included in the study group. All subjects had been playing netball for a minimum of five years (mean 6.9+1.6) and were training for at least two hours per week at the time of testing. The skill level was assumed to be comparable. Netball (Figure 2) is a ball sport that is typically played by females in the Commonwealth countries and is similar to Basketball. In contrast to Basketball the ball is not allowed to touch the ground at any time. Sudden acceleration and deceleration movements, rapid changes of direction, and leaping Figure 2: Typical situation in Netball. Red player catches the ball during the flight phase and is landing. Blue player is defending. (own material) to catch the ball in the air followed by a landing task are typical features of the sport [Steele 1990]. These movement patterns all pose a high risk of knee injuries and in fact Netball is known as a high risk sport for anterior cruciate ligament injury [Hume & Steele 2000]. 2.1.4. Control Group As outlined above, the male control group was recruited from an age-matched sample from the Central Comets Rugby League Development Team. As Netball is a sport played almost exclusively by females, it was not possible to recruit male netball players. All six male players with a mean age of 16.0+0.0 years included players participated in training or 14 competition for at least two hours per week for a minimum of five years. As the male participants were not undergoing a menstrual cycle, it was assumed that two tests with an interval of one week would be sufficient to demonstrate the lack of hormonal influence on the variables to be evaluated in this study. This protocol for the male group was based on previous studies [Beynnon, et al. 2005; Deie, et al. 2002; Shultz, et al. 2005]. Shultz et al [2005] measured estrogen serum levels, anterior knee laxity and stiffness in males during four occasions and could not demonstrate any significant differences (p=0.44) between testing sessions. Similar Beynnon, et al. [2005] measured knee- and ankle laxity in males and females on four occasions and could not demonstrate significant (p=0.82) between test session differences for the male group. Deie, et al [2002] investigated knee laxity in males on nine occasions over a three-week period and did not find any differences between test occasions. 2.2. Outcome Measures 2.2.1. Blood samples Blood samples of the participants were taken from the antecubital vein within two hours of the same hour of the day by a medical practioner, nurse or trained phlebotomist at the beginning of each testing session. Prior to sampling, the site was cleaned with an alcoholic swab (Alcowipe Skin Cleansing SwabTM, ProMedica, Australia). A tourniquet was applied and care was taken that the alcohol had dried prior to venipuncture. Using a 21-gauge needle (Greiner Labortechnik, Austria) and vacutainers, a 10 ml blood sample was vacuum collected into an EDTA collection tube (VacutainerTM, Greiner Labortechnik, Austria). Gentle inversion of the collection tube insured proper mixing of the additive and blood. Blood samples were coded for each subject and test date. The samples were stored at 4°C in a refrigerator until completion of the test and were then transported to a commercial pathology 15 laboratory where they were analysed for luteinising hormone (LH), follicle stimulating hormone (FSH), estrogen and progesterone using radio-immuno-assay techniques. The analysis allowed the research team to match hormone levels with the specific menstrual phase of the testing date. Where the value of the hormone analysis was not within the documented ranges, it was assumed that the test date was either miscalculated or that the cycle was anovulatory; in either case the subject would be re-tested for that particular cycle. 2.2.2. Calendar The human menstrual cycle involves a complex change in female anatomy and physiology over an approximate period of 24-32 days [Speroff & Van de Wiele 1971]. The menstrual cycle can be divided into four distinctive phases, each of which is characterized by specific levels of pituitary and ovarian hormones. The first phase is called the menstruation phase, and lasts from two to seven days. The follicular or proliferative phase then lasts from two to seven days, and is characterized by the increase of FSH. In a signal cascade kicked off by LH, the follicles secrete estradiol which acts as an inhibitor to the pituitary secretion of follicular stimulating hormone. The ovulation phase is triggered next when the follicles secrete enough estradiol to stimulate the release of luteinizing hormone from the pituitary gland. In the average cycle, the LH surge starts around day 12 and lasts for a maximum of 48 hours. Finally, the luteal phase is the most consistent phase of the cycle and lasts for 14 days, triggered by the corpus luteum producing progesterone. The two sex hormones estradiol and progesterone play a role in the control of the menstrual cycle. Estrogen peaks twice during the follicular and the luteal phase. Progesterone remains absent prior to ovulation and increases during the luteal phase and pregnancy. 16 Figure 3: An overview of pituitary and ovary hormone levels and during the menstrual cycle (from www.embryology.med.unsw.edu.au) Hormone levels are influenced through a feedback mechanism with the pituitary gland. FSH stimulates immature follicles to grow and LH triggers ovulation. Figure 3 summarizes the interplay of pituitary and ovary hormones during the menstrual cycle. Because of inter-individual variation in cycle length, each female subject was asked to complete a diary for each of the three months prior, during, and three months after participation. They were asked to document the first and last day of bleeding (menstruation phase) using a simple classification to describe blood loss (+ = weak; ++ = normal; +++ = severe). Data collected prior to participation was used to calculate the days of testing. The first day of testing was determined by the onset of menstrual bleeding, with the test conducted either on the first day of menstruation or within 24 hours thereafter. The second test was performed during the follicular phase. The follicular phase is the most inconsistent phase but is characterized by a gradual increase in FSH with a slow but significant increase in estradiol. By relying on the estimated length of the previous cycle, the second test date was 17 determined by the mean between the calculated day of ovulation and the onset of menstrual bleeding. We assumed this would give us a valid estimate of the mid-follicular phase. The average cycle for a particular female participant was given a length of 32 Example: days using data from documented menstrual cycles recorded in the subject’s diary. According to Karageanes et al [2000] the average length of previous cycles can be used reliably to calculate an estimated day of ovulation. The luteal phase interval is consistent and lasts for 14 days. The day of ovulation therefore would be considered to be “Day 18”. The testing day for the midfollicular phase can then be calculated by dividing 18 (time to ovulation from day of bleeding) by two. This test day for the midfollicular phase is thus “Day 9” counting from the start of menstruation. For the test day of the midluteal phase, seven days were subtracted from the average length of the previous menstrual cycle. The average length of the cycle in this example was 32 days; the test day for the midluteal phase was calculated by subtracting 7 (which constitutes half the length of the luteal cycle) from the average cycle length (32-7). The test day for the midluteal phase during this subject’s cycle is thus “Day 25” counting forward from the first day of menstruation. For the given example, this particular participant would then undergoing testing at the beginning of her next menstrual cycle in the following way: Menstruation Day 1 Midfollicular Ovulation 9 18 Midluteal 25 All test subjects had to be tested within a 24 hour window of all calculated days except for ovulation. Due to the rapid changes of hormone concentrations at ovulation, subjects had to be tested on the exact calculated day of ovulation. Because of their adolescent age and 18 physical activity, irregular cycles had to be expected in some of the subjects. If a deviation of more than 10% of the calculated menstrual cycle occurred during testing, subjects were retested during the following cycle. Hormone analysis was performed during all testing sessions and hormone levels were compared with Nakamura’s data [1991] (Table 1). If hormone levels were inconsistent with typical levels as reported by Nakamura [1991], testing sessions were repeated for that particular phase. TABLE 1 -- 95% Confidence Limits of Hormones Used in Reproduction Phase of Menstrual Cycle Hormone Follicular Ovulation Luteal Menopause LH (mIU/ml) 4.0–20.0 43–145 3–18 >40 FSH (mIU/ml) 3.2–9.0 10–18 3–9 >30 Prolactin (ng/ml) 8.0–20.0 0–22 10–30 8–25 Estradiol (pg/ml) 30–140 150–480 50–250 10–30 Progesterone (ng/ml) 0.5–1.0 0.8–2.0 3.0–31 0.5–1.0 Testosterone (ng/dl) 20–85 20–85 20–85 8–30 * Free testosterone (ng/dl) 1.2–9.9 1.2–9.9 1.2–9.9 3–13 † DHEA-S (µg/ml) 0.5–2.8 0.5–2.8 0.5–2.8 0.2–1.5 From Nakamura RM and Stanczyk FZ: Immunoassays. In Mishell DR Jr, Davajan V, and Lobo RA, editors: Infertility, contraception and reproductive endocrinology, ed 3, Cambridge, Mass, 1991, Blackwell Scientific Publications. 2.2.3. Tibial Acceleration Profile Measurements And Technique A uniaxial accelerometer was used to measure landing characteristics in the anterior-posterior direction. The device was calibrated by recording the voltage output where the position of its recording axis was subject to 1.0g (gravities). By rotating it 180 degrees and measuring the difference between the two positions, the acceleration due to gravity representing 1.0 g was 19 defined. This is consistent with validation studies by McNair et al [1992] and Lafortune & Hennig [1991]. The accelerometer was mounted to a small aluminium plate shaped to correspond to the contour of the proximal tibia. This construct was then attached to the tibial tuberosity (Figure 4) with adhesive tape and Velcro straps. The tibial tuberosity provides a bony prominence for consistent placement with little overlying soft tissue that would otherwise interfere with data collection and inconsistent placement. Figure 4: The accelerometer was attached to the tibial tuberosity (own material) The accelerometer was aligned perpendicular to the longitudinal axis of the tibia and in line with the antero-posterior recording axis. Specific attention was paid to secure the device to the same location during each testing session by using anatomical landmarks (tibial tubercle, medial joint line). Lafortune, et al. [1995] have demonstrated that by achieving correct placement rotational forces did not distort the magnitude of peak tibial acceleration. The cable from the accelerometer was secured at waist level on the subject to reduce motion artifact. None of the subjects experienced any discomfort and the range of motion of the knee was not limited. Signals were filtered with a 60Hz digital filter. Lafortune and Henning [1991] demonstrated that 99% of signal power was contained below 60Hz. According to their findings, the tibial 20 acceleration signal needed correction for the effect of gravity. This was achieved by using their equation: Ag (t) = g sin (t) g = gravitational acceleration constant, and (t) = angle between the tibial longitudinal axis and the vertical. The acceleration time curve (Figure 5) was recorded and the following variables were calculated: (1) peak tibial acceleration (PTA), (2) time to peak tibial acceleration (TPTA), and (3) time to zero tibial acceleration (TZTA) Acceleration measures were recorded in gravities (g’s) and the temporal values were measured in milliseconds. Figure 5: tibial acceleration-time curve. The variables that were obtained from tibial acceleration for this research project: (A) peak tibial acceleration (PTA), (B) time to peak tibial acceleration (TPTA), (C) time to zero tibial acceleration 21 Peak tibial acceleration (PTA) has been previously identified as a descriptor for tibial shock and can be seen as an indirect measure of the loading vector for the anterior cruciate ligament during initial ground contact [Lafortune & Hennig 1991, McNair et al 1992]. In addition, it provides an estimate of the function of the anterior cruciate ligament during impact. Time to peak tibial acceleration (TPTA) is an important determinant of knee stability and functionality. However, TPTA also indicates the speed of loading of the anterior cruciate ligament and it may well be asked whether rapid loading (short TPTA) is counterintuitive for function as collagen bundles within the ligament may be stretched beyond their elastic recoil capacity [Lafortune & Hennig 1991]. The time to zero acceleration (TZTA) is the duration of positive axial acceleration and represents the time to attain constant velocity during deceleration [LaFortune & Hennig 1991]. A shorter TZTA duration indicates better neuromuscular control as a measurement of dynamic stability [Lafortune & Hennig 1991]. The longer TZTA, the more passive joint laxity or the presence of an anterior cruciate ligament deficiency can be assumed. Tibial acceleration data were analysed using custom written software (Visual Basic 5, Microsoft Corporation). During this task, subjects were required to run towards a force plate (AMTI BP400800 – 2000, American Mechanical Technology Inc., Watertown, Massachusetts) installed into a flat cement floor. The distance covered for each run-up measured approximately five meters and an average of 3-4 steps was taken by each subject. 22 The participant was asked to jump towards the force plate and land with the dominant leg on the plate. As they were approaching the force plate, an assistant was throwing a netball coinciding with the mid flight phase (Figure 6). This not only served to simulate conditions during play, but also to deviate the subject’s attention from concentrating on landing thus causing pre-activation of the lower Figure 6: A subject landing on the designated area (force plate) while catching a netball. In the background the timing lights can be seen. (own material) extremity muscles. Landing was deemed successful if the subject landed onto the designated area (force plate) catching the ball during the flight phase with no hopping, extra steps or other uncontrolled landing motions. Three consecutive run-ups were recorded following a familiarization session of up to five attempts. Only landings with the dominant leg were analysed. Prior to this task, reflective markers were placed at anatomic key positions (Figure 7) in order to record sagittal landing angles of the knee joint. Those markers were placed at the anterior superior iliac spine, greater trochanter, lateral femoral condyle, fibular head, lateral malleolus, lateral Achilles-tendon-calcaneus junction and lateral prominent head of the fifth metatarsal. Figure 7: Reflective markers were placed at the anterior superior iliac spine, greater trochanter, lateral femoral condyle, fibular head, lateral malleolus, lateral Achillestendon-calcaneus junction and lateral prominent head of the fifth metatarsals. (own material) 23 Markers were carefully placed at the most prominent position to ensure consistent and reliable placement during the remaining testing sessions. It was felt that it was more important to achieve consistent and reliable placement with each testing session as the study design was longitudinal, in contrast to cross-sectional study designs where correct anatomical placements are crucial. Placement of these markers enabled the research team to record the necessary kinematic data. Synchronization of data collection was achieved by the subject running through a set of timing lights (Fitness Technology, Skye, Australia) placed one meter from the edge of the force plate. An analogue output from the light gates triggered simultaneous collection of tibial acceleration profiles, kinematic data and ground reaction forces. 2.2.4. Musculotendinous Stiffness Measurements Farley, et al. [1991] and Ferris & Farley [1997] developed a model to calculate musculotendinous stiffness. It is based on the physical principle of damped harmonic motion. Given that no gravitational forces act on an oscillating spring a pendulum or a weight on a spring would swing indefinitely (Figure 8). If friction is introduced, the motion is said to be damped and will gradually decrease to zero (Figure 9). Figure 8: The force acting on, and the acceleration, velocity and displacment of a mass m undergoing simple harmonic motion. (Figure 15-8) page 307 from Hallyday & Resnik: Physics parts 1 and 2, John Wiley and Sons Inc, 1978 Figure 9: Damped harmonic motion plotted versus time. The motion is oscillatory with everdecreasing amplitude. The amplitude is seen to start with value A and decay exponentially to zero as t approximates ∞. (Figure 15-19) page 323 from Hallyday & Resnik: Physics parts 1 and 2, John Wiley and Sons Inc, 1978 24 The equation of damped motion is given by the second law of motion: F = ma F is the sum of the restoring force –kx and the damping force –b dx/dt. a (acceleration) is the change of velocity divided by the time interval dv/dt whereas velocity is distance traveled per time unit: dx/dt. Replacing acceleration (a) and force (F) we obtain the following formula: -kx –b dx/dt = m d2x/dt2 Given that the sum of damping and restoring force is zero we obtain the following result: (m d2x/dt2) + (b dx/dt) + kx = 0 This formula is the basic mathematical principle that allows us to calculate the stiffness of a given system. The sum of the restoring force –kx (negative value) and the damping force –b dx/dt equals zero. Therefore by further simplifying stiffness can be calculated as follows: -(2k) = m (d2x/dt2) or -(2k) = (m/dt) (d2x/dt) (m/dt) is equivalent to ground reaction force Fpeak at initial ground contact and can be obtained via a force plate. d2x/dt represents vertical acceleration and vertical displacement of the center of motion (COM). Those parameters can be calculated by double integration of COM in relation to Fpeak. Musculotendinous stiffness in a damped biological spring model is defined as the relation of muscle tension (F/A) to the change of length in relation to its original length (dl/lo). This basic mathematical model forms the basis for the thesis by Farley’s et al. [1991]. In this model, the basic assumption is that the lower extremity functions as a damped spring during 25 activities such as walking, running and jumping. Kx is equivalent to Young’s module of elasticity and measures the viscoelastic properties of the muscle-tendon-unit. The peak ground reaction force (Fpeak) and change of length (dl/lo occurs simultaneously during initial ground contact: K leg= F peak/dl Subjects were asked to hop unilaterally on each leg and then bilaterally on a force plate (American Mechanical Technology Inc., Watertown, Massachusetts) (Figure 10). A metronome was used to time hopping to a frequency of 2.2 Hz (132 hops/min). This frequency has been found to be the natural hopping frequency of human beings [Farley, et al. 1991; Ferris & Farley 1997]. Figure 10: Hopping test to assess musculotendinous stiffness on a force plate. (own material) Subjects were asked to hop barefoot with their hands crossed at the back in order to minimize variations in ground reaction forces introduced from footwear and to minimize contribution from the trunk and upper extremity (Figure 10). The force plate was connected to a data interface and amplified 1000 times. Prior to data collection, subjects were given a 10- to 30- second familiarization interval until the hopping frequency was consistent with that of the metronome. Data collection was then started over a 4 second interval at a frequency of 500Hz and saved onto a hard disk (Figure 11). Trials that were not within a 2% margin of the required interval of 2,2Hz were discarded. Three consecutive hops were used to calculate a mean value. Muskolotendinous stiffness (MTS) 26 was analysed using custom-written C+ software written by Professor Murphy (University of Vertical ground reaction forces (N.m-1) Technology, Sydney, Australia) based on the above mentioned principles. Figure 11: The graph demonstrating data collection of vertical ground reaction forces filtered with 500Hz. (own material) 2.3. Flow chart Prior to commencement of testing, all subjects were required to undergo a standardized warmup session. This was deemed necessary in order to reduce the injury risk during the netball landing task. Furthermore, it was thought to be important to prime the muscle-tendon-unit to limit the influence of temperature differences in the muscle. For the warm-up, each subject was asked to cycle on a stationary cycle ergometer (Monark, Varbor, Sweden) for a total of five minutes with a standardized work load of 100W. This was followed by 10 standardized netball landings (Figure 6) as described by Steele [1990]. The following flow chart demonstrates the procedure and order of tests during each testing session. 27 Familiarisation Subjects were familiarized with the proposed testing methods during the first visit Blood Sample Collection Blood samples of the participants were taken from the antecubital vein within two hours of the same hour of the day. Warm-Up: The warm-up consisted of five minutes cycling for all test subjects on a wind-braked cycle ergometer (Monark, Varber, Sweden) set at a workload of 100W and ten standardized netballl landings Musculotendinous Stiffness Measurements Subjects were asked to hop unilaterally on each leg and then bilaterally on a force plate to with a frequency of 2.2 Hz (132 hops/min). All measurement were performed barefoot with their hands crossed at the back. Placement of Reflective Markers Markers were placed at the anterior superior iliac spine, greater trochanter, lateral femoral condyle, fibular head, lateral malleolus, lateral Achilles-tendon-calcaneus junction and lateral prominent head of the first metatarsal. Tibial Accerelation Measurements The accelerometer was attached to the tibial tuberosity with adhesive tape and Velcro straps. During this task subjects were required to run and jump towards the force plate and land with the dominant leg on the plate. As they were approaching the force plate, an assistant was throwing a netball coinciding with the mid flight phase 28 2.4. Data Analysis Statistical analysis was performed using Systat (Version 13, Chicago, IL, USA). A level of significance of p < 0.05 was selected in all analyses to limit the chance of Type I error to 5%. In accordance with O’Keefe [2003] alpha level correction using Bonferroni or other such adjustments was not conducted so as to maintain statistical power. It is recognised that, whilst all the variables were carefully chosen, they are numerous and hence there is an increased risk of Type 1 error. However, the cost of incurring a Type 1 error was deemed minimal and therefore appropriate given the exploratory nature of the study. 2.4.1. Blood Samples Hormone levels were analysed at Sullivan and Nicolaides Laboratories (Rockhampton, Australia) and after being presented in a descriptive fashion, were then compared to Nakamura’s reference table (Table 1). A particular test session was included when hormone levels were within the 95% confidence interval as outlined by Nakamura [1991]. If hormone values were not within the confidence interval, a two-tailed one sample Students t-test was used to assess whether the level was significantly different from the reference value. If the alpha level was found to be more than 0.05, the result was included in the analysis. Repeated measures of ANOVA were used to assess within group serum estrogen levels for the female study group. 2.4.2. Tibial Acceleration Profiles All acceleration measures were included in the analysis; peak tibial acceleration (PTA), time to peak tibial acceleration (TPTA), and time to zero tibial acceleration (TZTA). The mean and standard deviations of error were calculated for each testing session. Repeated measures of 29 ANOVA were used to assess tibial acceleration measures between testing sessions and between groups. 2.4.3. Musculotendinous Stiffness For this test, only the results of the dominant leg were considered. To assess musculotendinous stiffness for the same individual between testing sessions, repeated measures of ANOVA were used. 2.4.4. Control Group Subjects of the control group were tested twice only. It was assumed that the male participants were not exposed to different levels of female hormones resulting in equal or similar values for musculotendinous stiffness and tibial acceleration profiles. Test results of the two sessions were analysed and compared using a paired sample Student t-test. If the results were not significantly different, the mean of the two sessions was calculated and its value used to compare to the female study group using ANOVA. 2.4.5. Between Gender Comparisons Serum estrogen levels, musculotendinous stiffness and tibial acceleration profiles between the male and female groups were compared by analysis of variance (ANOVA) with post hocmultiple comparisons performed using least significant difference tests. 30 3. Results 3.1. Demographics of Study Group Eleven female participants were included in the project, and Table 2 lists their demographic details. The mean age was 16.3+0.7 years (range 16-18) with a height of 164.+6.2 cm (range 154-172) and mean body mass of 60.7+6.3 kg (range 47-72). Table 2: Demographic details of the female study group 1 age 16 weight (kg) 62 height (cm) 172 years of experience 5 level of experience A League min training p/w (min) 240 2 16 57 163 6 A League 360 3 16 63 165 5 A League 210 4 18 55 160 10 A League 160 5 16 61 161 6 A League 420 6 16 64 171 6 A League 360 7 16 72 168 6 A League 180 8 16 63 167 8 B League 480 9 17 62 154 8 B League 240 10 16 62 167 8 A League 300 11 16 47 154 8 B League 240 Mean 16.3 60.7 164 6.91 290 SD 0.7 6.3 6.2 1.58 102.8 3.2. Demographics of Control Group Six male control subjects were included in the study, and Table 3 lists their demographic details. The mean age was 16.0+0.0 years, and their mean height was 175+5.4 cm (range 169185) with a mean body mass of 75+16.4 kg (range 58-105). 31 Table 3: Demographic details of the male control group age (years) weight (kg) height (cm) 1 16 105 185 2 16 73 178 3 16 63 169 4 16 72 173 5 16 58 174 6 16 79 173 Mean 16 75 175 SD 0 16.4 5.4 3.3. Blood Analysis 3.3.1. Study Group Progesterone, estrogen, LH and FSH of all female subjects (Table 4) were found to be within Nakamura’s reference values. Low levels of estrogen and progesterone were observed at the follicular phase. Peak values of estrogen and luteinizing hormones were observed during ovulation (Table 4). The highest level of progesterone was observed during the luteal phase (Table 4). There was a significant difference (p=0.0005-0.01) in estrogen levels between the ovulation, menstrual and follicular phase. However, no significant differences (p=0.09) in estrogen levels were observed between the ovulation and luteal phase. Luteinizing hormone was significantly (p=0.01) decreased during the menstrual phase and significantly (p=0.060.01) increased during the remaining three phases of the menstrual cycle. Progesterone was found to be significantly (p=0.02) increased during the luteal phase. Table 4 provides an overview of hormone fluctuations during the menstrual cycle of the study group. 32 Table 4: Overview of hormone levels including standard deviations during the menstrual cycle of the female study group. menstrual phase follicular phase ovulation luteal phase LH IU/l) 3.1+1.65 6.64+3.7 22.09+20.9 6.18+4.7 FSH (IU/l) 5.05+1.85 6.66+1.7 7.78+4.9 3.71+2.0 Estrogen (nmol/l) 105.41+36.9 175.36+50.5 510.4+290.4 336.26+168 Progesterone (pmol/l) 0.66+0.29 0.48+0.2 6.06+1.1 20.66+2.2 3.3.2. Control Group The results of hormonal fluctuations in the male control group are demonstrated in Table 5 and Figure 12. Estrogen levels of all males were significantly (p=0.0001) lower in comparison to their female counterparts. In fact they were at least 100 IU/l below the female levels compared to the follicular, ovulation, and luteal phase. There was no significant (p=0.19) between test difference for estrogen hormone serum levels. 90 80 70 60 50 40 30 20 10 0 test 1 LH IU/l) test 2 FSH (IU/l) Estrogen (nmol/l) mean Progesterone (pmol/l) Figure 12: Overview of hormone fluctuations of the male control group 33 Table 5: Overview of hormone levels including standard deviations between test sessions for the male control group. test 1 test 2 mean p-level LH IU/l) 6.06+0.7 6.32+0.7 6.19+0.7 0.47 FSH (IU/l) 3.95+2.5 3.77+2.2 3.86+2.3 0.45 Estrogen (nmol/l) 83.4+9.3 58.8+23 71.1+16.1 0.19 Progesterone (pmol/l) 0.37+0.2 0.14+0.12 0.25+0.16 0.06 3.4. Tibial Acceleration Profiles 3.4.1. Study Group 3.4.1.1. Peak Tibial Acceleration (PTA) The mean PTA during the menstrual phase (week 1) was 5.79+3.38 (g) (range 0.93-10.85). The mean PTA during the mid-follicular phase (week 2) was 6.21+3.17 (g) (range 1.7711.14). During ovulation (week 3) the mean PTA was 6.18+2.8 (g) (range 1.35-10.43). The mean PTA during the luteal phase (week 4) was 6.2+2.22 (g) (range 2.85-10.13). There was no significant difference between the cycles (p=0.45). 3.4.1.2. Time to Peak Tibial Acceleration (TPTA) The mean TPTA during the menstrual phase (week 1) was 28.09+4.7 (g) (range 20-35). The mean TPTA during the mid-follicular phase (week 2) was 31.14+7.55 (g) (range 18-43). During ovulation (week 3) the mean TPTA was 40.1+13.7 (g) (range 21.5-60). The mean TPTA during the mid-luteal phase (week 4) was 38.22+6.6 (g) (range 24-47). There was a significant difference between week one and two (p=0.04). A significant difference in TPTA was observed between week one and three (p=0.001) and week one and week four (p=0.002). A significant difference was also observed between week two and three (p=0.007). 34 3.4.1.3.Time to Zero Tibial Acceleration (TZTA) Figure 13 provides an overview of tibial acceleration profiles of the female study group. The mean TZTA during the menstrual phase (week 1) was 48.6+7.4 (g) (range 39-61.5). The mean TZTA during the mid-follicular phase (week 2) was 49.4+7.5 (g) (range 38-62). During ovulation (week 3) the mean TZTA was 47.7+11.9 (g) (range 29-66.5). The mean TZTA during the mid-luteal phase (week 4) was 47.8+6.2 (g) (range 37.5-61.5). There was no significant between test session difference (p=0.59). 48.55 49.41 47.67 50.00 45.00 40.00 35.00 30.00 25.00 20.00 15.00 10.00 5.00 0.00 47.47 40.10 38.22 31.14 28.09 Peak Tibial Acceleration Time to Peak Tibial Acceleration Time to Zero Tibial Acceleration 5.79 1 6.21 2 6.18 6.20 Time to Zero Tibial Acceleration Peak Tibial Acceleration 3 4 Figure 13: Overview of tibial acceleration profiles for the female study group 3.4.2. Control Group In the male control group, mean PTA during week one was 7.01+2.47 (g) (range 2.76-11.25). The mean PTA during week two was 7.59+2.24 (g) (range 4.63-10.65). There was no significant (p=0.48) between test session difference. The mean TPTA during week one was 28.33+5.1(g) (range 20-34). The mean TPTA during week two was 26.2+10.2 (g) (range 1240). There was no significant (p=0.29) between test session difference. The mean TZTA 35 during week one was 51.67+10.76 (g) (range 35.5-66). The mean TZTA during week two was 45.1+10.21 (g) (range 28-55.5). There was no significant (p=0.08) between test session difference. As there were no significant between session differences for all tibial acceleration variables in the male control group, the results for all variables were averaged and used for comparison with the female study group. The mean for PTA was 7.27+2.34 (g), for TPTA 27.25+8.06 (g) and for TZTA was 48.38+8.06 (g) (Figure 14). 50 40 30 48.38 20 27.25 10 7.27 0 Time to zero tibial acceleration Time to peak tibial acceleration 1 Peak tibial Peak tibial acceleration acceleration Time to peak tibial acceleration Time to zero tibial acceleration Figure 14: Overview of tibial acceleration profiles for the male control group 3.4.3. Tibial acceleration profiles between groups and phases The male control group demonstrated higher mean values for PTA (mean 7.27 m/s2) and TZTA (mean 48.38 ms) whilst TPTA (mean 27.25 ms) was shorter. Repeated measures of ANOVA revealed no significant between group differences for PTA (F=0.21, p=0.1) and TZTA (F=0.3, p=0.48) between the male control group and the female study group. However, significant between group differences were observed for TPTA (F=3.87, p=0.001). 36 3.5. Musculotendinous Stiffness 3.5.1. Study Group Figure 15 displays the combined mean values for musculotendinous stiffness for the female study control group. During the menstruation phase (week 1) the mean stiffness measured 12556+1412Nm (range 12018-15351). During the mid-follicular phase (week 2) the mean stiffness measured 12397+1005Nm (range 11290-14007). During ovulation (week 3) the mean stiffness decreased to 11423+1262Nm (range 10739-14523). During the mid-luteal phase (week 4) the mean stiffness measured 13179+1149Nm (range 10659-15222). MTS (N/m) 13500 13000 12500 12000 11500 11000 10500 MTS (N/m) menstrual phase follicular phase ovulation luteal phase 12556 12397 11423 13179 Figure 15: Musculotendinous stiffness values for the female study group. Repeated Measures ANOVA revealed a significant difference (F=3.5, p=0.04) between the ovulatory phase and the other phases of the cycle. Musculotendinous stiffness reduced by 11.2% during the ovulatory phase. The absolute value during ovulation was on average 9.9% less when compared to the menstrual phase, 8.5% less than during the follicular phase and 15.4% less during the luteal phase. 37 3.5.2. Control Group Figure 16 displays the results of musculotendinous stiffness for the male control group during the two testing sessions. The mean stiffness during week one was 15977+1402 Nm (range 13830-21451). The mean stiffness during week two was 15591+1823 Nm (range 1306821093). There was no significant (p=0.89) between test session difference; therefore the results for all variables were averaged and used for comparison with the female study group. The combined mean for musculotendinous stiffness measured 15784+1550 Nm (range 1306821451). MTS (N/m) 16000 15900 15800 15700 15600 15500 15400 15300 MTS (N/m) test 1 test 2 mean 15977 15591 15784 Figure 16: Musculotendinous stiffness for the male control group. 3.5.3. Musculotendinous stiffness between groups and phases Figure 17 shows the mean values for musculotendinous stiffness between groups and phases. It can be seen that musculotendinous stiffness in the male subgroup is highest (mean 15784 Nm), and in the female study group the stiffness was lowest at ovulation (11423 Nm). This difference is significant (F=4.14; p=0.004). Repeated measures of ANOVA revealed a significant (F=3.5; p=0.01) between group difference. Musculotendinous stiffness in the male 38 control group is significantly (F=3.5; p=0.01) higher than in the female study group. Musculotendinous stiffness in the male control group was significantly higher (F=8.4; p=0.02) than the highest value in the female group. MTS (N/m) 16000 14000 12000 10000 8000 6000 4000 2000 0 MTS (N/m) male luteal phase menstrual phase follicular phase ovulation 15784 13179 12556 12397 11423 Figure 17: Overall musculotendinous stiffness between groups and phases 39 4. Discussion 4.1. Introduction The current project investigated whether hormone level fluctuations during the menstrual cycle influence viscoelastic properties (musculotendinous stiffness) and tibial acceleration profiles of the lower extremity. It is a well known fact that anterior cruciate ligament injuries occur at a higher rate in females compared to male athletes performing the same sport [Eiling, et al. 2007; Fagenbaum & Darling 2003; Giza, et al. 2005; Gwinn, et al. 2000; Viola, et al. 1999]. Several explanations have been suggested to explain this consistent finding, but none has convincingly explained the cause. It is likely that a number of factors are responsible for the increased incidence of ACL injuries in the female population [Brophy et al 2010]. One factor that could be contributing to the higher injury rates is the cyclical fluctuation in female sex hormones, and their possible influence on the passive properties of the soft tissues with resultant adaptations of neuromuscular control during active motion [Eiling, et al. 2007]. 4.2. Demographics A group of young female athletes with a mean age of 16.3+0.7 years was recruited to assess these variables in a laboratory setting. The mean age of this group is younger than in previous studies. For example Wojtys, et al. [1998] previously examined the association between the menstrual cycle and anterior cruciate ligament injuries, but the mean age in their cohort was 23+11 years. Furthermore Wojtys, et a.l [2002] investigated the effect of the menstrual cycle on anterior cruciate ligament injuries in women with a mean age of 28+10 years. Park, et al. [2009] specifically investigated the relationship between knee joint laxity and knee joint mechanics during the menstrual cycle in a study group of women with a mean age of 22.7+3.5 years. It could be argued that the time since menses in the current research project was shorter 40 than in previously published studies. However, by selecting a much more specific age group, a more homogenous sample was created in the current study. In addition, strict inclusion criteria required at least one consistent cycle before, during and, after the testing sessions reducing confounding variables and the potential for type 1 errors. 4.3. Blood Samples – Hormone Analysis In the current project, blood samples of all subjects were taken at all test sessions. This served to assign participating female subjects to a particular phase of the menstrual cycle, and provided a measure of estrogen hormone levels in the male control group. Nakamura [1991] has published an extensive overview of hormone levels during the menstrual cycle, including 95% confidence intervals. Progesterone, estrogen, luteinizing hormone and follicular stimulating hormone of all female subjects in the present study (Table 4) were found to be within Nakamura’s reference values. The collection of blood samples during each testing session provided a more accurate measure of menstrual cycle status compared to measuring body temperature. Previous research [Shirtcliff, et al. 2001] noted that counting days from menstruation and measuring basal body temperature is unreliable to determine the cycle phase in a large percentage (83%) and results in incorrect interpretation of results. Prior studies [Park, et al. 2009; Shultz, et al. 2005; Van Lunen, et al. 2003] have used serum analysis to determine the stage of the menstrual cycle. Park, et al. [2009] investigated the relationship between knee laxity and joint mechanics. However, Park, et al. [2009] only divided the menstrual cycle into the follicular, ovulation and luteal phase and utilized estrogen and progesterone levels only. Van Lunen, et al. [2003] also used estrogen, progesterone, follicular hormone and luteinizing hormone to assign the menstrual, ovulation and midluteal phases to 12 subjects. Shultz, et al. [2005] measured daily serum levels of estrogen, 41 progesterone and testosterone across one complete menstrual cycle in 22 females to assess anterior knee laxity. Similar hormone levels were reported in these prior studies; hence the evidence suggests the current sample is comparable to previously published literature. 4.4. Tibial Acceleration Profiles In the present study, tibial acceleration profiles were investigated on four separate occasions throughout the female menstrual cycle, and at two occasions in the male control group. Tibial acceleration is a dynamic function which measures tibial shock attenuation during a standardized jump landing [McNair &Marshall 1994], and serves here as an indirect indicator of forces acting on the anterior cruciate ligament. Whilst direct attachment of the accelerometer to the bone is more accurate than skinmounting, the skinmounting technique provides an accurate estimate of tibial acceleration of the underlying bone structures as long as the accelerometer is properly fixed to the skin and is of low mass [Lafortune, et al. 1995] as was done in the current project. The present study could not demonstrate a significant within group difference between the different phases of the menstrual cycle for PTA (p=0.45) for the female study group. The male control group in the present study demonstrated overall higher but non-significant (p=0.48) between testing sessions values for PTA. The difference between the male and female group was not significant (p=0.1). PTA has been previously identified as a descriptor for tibial shock and can be seen as an indirect measure of the loading vector for the anterior cruciate ligament during initial ground contact [McNair & Marshall 1994]. In addition, it provides an estimate of the function of the anterior cruciate ligament during impact [LaFortune & Hennig 1991]. 42 Gender differences during dynamic tasks could be the result of an increased peak torque because of the commonly observed larger cross-sectional muscle diameter of males [Griffin, et al. 2000; Griffin, et al. 2006; Lephart, et al. 2002]. Women have demonstrated lower peak torque values of their lower extremity musculature [Bell & Jacobs 1986; Hakkinen 1991], and this is even true when corrections are made for body mass [Lephart, et al. 2002]. Thus these muscle strength differences and the higher body mass in males may help explain the gender difference for PTA observed in the current study. For the measurement of PTA in gravities (g), body mass has to be included into the calculation (g=m3 kg-1 s-2). Given these explanations, PTA in the current study may not be an important predictor of neuromuscular function within or between groups. In the female group of the present study, there was no significant difference between the different phases of the menstrual cycle for TZTA (p=0.59). The male control group in the present study demonstrated overall higher but non-significant between session values (p=0.08) for TZTA. Again, the difference between the male and female group was not significant (p=0.48). TZTA is the duration of positive axial acceleration and represents the time to attain constant velocity during deceleration [Lafortune & Hennig 1991, McNair & Marshall 1994]. A shorter duration indicates better neuromuscular control as a measurement of dynamic stability [McNair & Marshall 1994]. However, TZTA is also a measure of laxity. The longer TZTA, the more passive joint laxity or an anterior cruciate ligament deficiency can be assumed [Bryant 2007]. Greater passive joint laxity between males and females is one plausible explanation for the differences we have observed between the two groups. Shultz, et al. [2005] demonstrated that females had significantly (p=0.023) greater knee laxity than males, and these gender differences varied by day of the menstrual cycle (p=0.016). Earlier Rozzi, et al. [1999] measured knee joint laxity in both female and male soccer and basketball 43 players, and demonstrated that women have significantly (p=0.002) greater knee joint laxity values. Anterior knee laxity has also been investigated in our cohort and has been reported previously [Eiling, et al. 2007]. We could not demonstrate a significant effect of the menstrual cycle (p>0.05) on anterior knee laxity. In our 2007 study, anterior knee laxity increased nonsignificantly by an average of a 0.2 mm (3.9%) from the onset of menstruation to the midfollicular phase. At ovulation, anterior knee laxity increased non-significantly by a further 0.5 mm (10%) compared to the mid-follicular phase. Following ovulation, anterior knee laxity decreased non-significantly and was 0.5 mm (10%) lower at the time of the luteal phase [Eiling, et al. 2007]. However, anterior knee laxity was significantly (p=0.05) higher in the female group compared to the male control group. Increased knee joint laxity in the female study group possibly contributes to the above mentioned findings. As a consequence these values need to be interpreted with caution and may not reflect neuromuscular adaptations as a reaction to constant changes in estrogen serum levels. TPTA is an important determinant of knee stability and functionality [Bryant 2007; LaFortune&Hennig 1991]. A short TPTA would indicate good neuromuscular control with pre-activation of lower extremity muscles anticipating the impact prior to landing [McNair & Marshall 1994]. In the present study TPTA increased steadily throughout the menstrual cycle, reaching peak values at ovulation in the female study group. Significant within group differences were observed between week one and two (p=0.04), week one and three (p=0.001), week one and four (p=0.002) and week two and three (p=0.007) of the menstrual cycle. The male control group in the present study demonstrated lower but non-significant between testing session values (p=0.29) for time to TPTA; while the difference between the male and female group was significant (p=0.001). 44 This finding suggests that the male control subjects had a better ability to arrest tibial acceleration in a shorter period of time. As a consequence the anterior cruciate ligament may have to absorb higher forces during the deceleration process in dynamic jump landings. However a shorter TPTA also means that males may have better neuromuscular control. In addition a longer TPTA in the female study group may be indicative of poorer muscle control and an indication of increased anterior tibial translation. This potentially stretches the anterior cruciate ligament in the female group more than in the male group. A possible explanation for the observed gender differences in the tibial acceleration profiles could be differences in pre-activation of agonistic and antagonist muscles resulting in earlier eccentric contraction in the male athlete compared to the female athletes. Several researchers [Ebben, et al. 2010; Gehring, et al. 2009; Krishnan; et al. 2008; Sung &Lee 2009] have investigated muscle activation during dynamic activities and support this suggestion. For example, Gehring, et al. [2009] assessed two-legged landings and noticed a significant delay (p=<0.05) in hamstring and quadriceps activation in young females with a mean age of 22.6 years compared to a male control group with a mean age of 25 years. Furthermore, Sung & Lee [2009] demonstrated significant time delays in muscle activation (p=0.025) and lower EMG amplitudes of the dominant vastus medialis and hamstring muscles during repeated down stair climbing in female subjects compared to males. More recently, Ebben, et al. [2010] investigated hamstring and quadriceps activation patterns using EMG during drop jumps and a sprint and cut at a 45-degree angle (cut). These authors observed earlier activation of both the hamstring and quadriceps muscle groups in the pre-contact phase in males. Finally, Krishnan, et al. [2008] investigated the ability of males and females to recruit and modulate muscle activity placing the participants onto a HUMAN NORM Testing and Rehabilitation System (Computer Sports Medicine Inc, Stoughton, MA). These researchers 45 observed different between gender activation patterns for both the hamstring and quadriceps muscles. Females displayed significantly lower (p < 0.001) muscle activity patterns, and significantly higher magnitude of quadriceps (p < 0.001) muscle activity than males to achieve the same relative force level. Taken together, these previous studies support the findings of the present research and support the argument that females have poorer muscle control as indicated by the tibial acceleration profiles measured. Furthermore, muscle control in the current female study group varies throughout the menstrual cycle; an indication that the changing estrogen serum levels directly influence neuromuscular behaviour. Differences in knee kinematics could change torque positions for both the hamstring and quadriceps muscle group. This might explain gender differences in muscle activation, tibial acceleration profiles and even musculotendinous stiffness observed in the present study. Malinzak, et al. [2001] investigated running, side-cutting and cross-cutting and observed that compared to males, women had significantly less knee flexion-, more knee valgus-, greater quadriceps activation and lower hamstring activation during each of the three activities. Salci, et al. [2004] observed significantly (p<0.05) lower knee and hip flexion angles in females during block landings. Lephart, et al. [2002] assessed single-leg landing and forward hop tasks. With both tasks, females had significantly (p<0.05) less knee flexion, lower leg internal rotation, maximum angular displacement, and less knee flexion time to maximum angular displacement than males. In the present study, the measurement of tibial acceleration profiles during four different test occasions in the female study group and two test occasions for the male control group has potential limitations. Test-retest reliability has not been assessed in this project but has been previously investigated by Turcot, et al. [2008] and found to be reliable (r=0.75) at both slow 46 and fast speeds. It could therefore be assumed that the results for current tibial acceleration profile measurements during the four testing sessions in the female group were reliable and valid. Fatigue could also have influenced measurements in the current project. Coventry, et al. [2006] investigated the effect of fatigue on shock attenuation during single-leg landing in males and concluded that there was no significant change in shock attenuation. However, Conventry, et al. [2006] observed changes in hip and knee flexion during fatigue testing. The current project did not include this variable as an outcome measure. In contrast Flynn, et al. [2004] observed a significant decrease in PTA in fatigued young women. However, the authors have used static maximum voluntary contractions with jumping from a platform onto a force plate for data collection. These anaerobic isometric contractions may have caused the accumulation of lactic acid and other metabolic products within the muscle resulting in changes of force and strength development. Hence it could be argued that the authors [Flynn, et al. 2004] may have committed a type 1 error. Both male and female subjects for this current research have not been fatigued during the testing, and it cannot be entirely excluded that physical activities prior to testing could have introduced bias. Although all participants were asked not to perform any exercise four hours prior to testing, compliance was not verified. In the present study, tibial acceleration profiles were measured using the skinmounting technique which has been described as accurate by LaFortune, et al. [1995]. Manal, et al. [2003] demonstrated a considerable difference between bone versus skin mounted targets for the measurements of anterior tibial translation (ATT). However, in the present study, intraindividual tibial acceleration profiles in the male control group between test sessions would have resulted in different values if the skin mounted accelerometer had moved during the 47 testing or was placed at a slightly different location between test sessions. Anterior tibial translation measurements were not part of this research. Given these explanations, it can again be safely assumed that the results are reliable and valid. One of the purposes of the current research was to investigate whether estrogen level fluctuations during the menstrual cycle influence tibial acceleration profiles of the lower extremity in female athletes. A research hypothesis was formulated that estrogen levels will influence tibial acceleration profiles; this hypothesis is only partially supported by the results of the current research. Whilst there was a demonstrable change in PTA, TPTA and TZTA during the menstrual cycle, significant within-group differences for the female group and significant between group differences were only observed for TPTA. However, as outlined above, PTA values are most likely influenced by the subject’s body mass and anterior knee laxity may have contributed to TZTA measurements. If these factors are considered the hypothesis would be strongly supported by the results of the present research. 4.5. Musculotendinous stiffness The present study investigated changes of viscoelastic properties of the lower extremity using the oscillation technique to measure lower extremity musculotendinous stiffness during the menstrual cycle in female athletes. The findings of the research project clearly demonstrated that the male control group had significantly (p=0.01-0.004) higher values of lower extremity stiffness than the female study group. In the female study group, significant (p=0.04) differences between the ovulatory phase and the other phases of the cycle were also observed. Whilst musculotendinous stiffness 48 values were highest during menstruation, a significant decrease of 11.2% during ovulation was noted. The male control group did not demonstrate fluctuations of muscle stiffness between either of the two test sessions (p=0.89). Whilst both gender groups were physically active, males were mainly semi-professional rugby players who are not normally exposed to controlled jump landings. In contrast to Netball, automated landing responses are not routinely required for this sport rugby. It is therefore unlikely that the male athletes have developed automated neuromuscular pathways for these dynamic tasks. However it could be argued that the lack of automated reflex pathways may have resulted in intra-individual differences between the two test sessions, which was not observed. It could thus be argued that the females in the study group may have developed neuromuscular automated responses to dynamic landing tasks that should have lead to better pre-activation of muscle groups. This may have resulted in a higher reflex mediated muscle stiffness and subsequently affect stiffness measurements during the testing sessions. By assuming a more coordinated neuromuscular activation pattern, the female Netball player should be at an advantage and demonstrate less variation between the different phases of the menstrual cycle. However these observations were not made in the female study group. As a logical consequence the differences in musculotendinous stiffness are most likely related to the menstrual cycle and associated hormonal fluctuations. Whilst the above findings may explain dynamic physiological adaptations, other factors such as anatomical differences may also contribute to musculotendinous stiffness. Previous investigations [Griffin, et al. 2000; Griffin, et al. 2006] have demonstrated that women not only have a smaller cross-sectional area of the lower extremity muscles but also a diminished ability to recruit and contract muscles during a given task. The same studies demonstrated that 49 females have smaller stiffness values when compared to their male counterparts. This fact was explained by their small cross sectional muscle diameter [Bell &Jacobs 1986] and anatomical differences [Chapell, et al .2007]. Cross-sectional muscle diameter and strength measurements were not conducted in the present study, and this may have introduced bias. However as there was a significant difference in musculotendinous stiffness in the female study group across the menstrual cycle, assuming cross sectional muscle diameter did not change over the four week testing session, the odds of having introduced bias are rather small. The present research has utilized the oscillation technique which has been used extensively and is validated by several researchers [Farley, et al. 1991; Ferris &Farley 1997; Granata, et al. 2002; McNair, et al. 1992; Swanik, et al. 2004]. Muscle stiffness is a tissue property that describes the muscle’s ability to react to external forces [McNair, et al. 1992], and consists of an intrinsic and an extrinsic component. The intrinsic component can be described as passive resistance to stretching and is caused by the serial and parallel elastic elements of the muscletendon unit. The extrinsic component is related to the reflex response via the gamma pathway and can best be described as reflex mediated stiffness [Mc Nair, et al. 2001]. However only fifty percent of the force increment of a contracting muscle is due to the stretch reflex [McNair, et al. 2001]. A stiffer system may be able to absorb forces that would normally act on the anterior cruciate ligament [Eiling, et al. 2007]. In addition, stiffer systems result in a faster neurophysiological reflex response and cause earlier activation of the agonist muscle by decreasing the electromechanical delay of the stretch response [Kubo, et al. 2001]. This results in muscle pre-activation in anticipation of the impact, leading to a further increase in muscle stiffness which subsequently allows greater absorption of impact forces by the 50 muscle-tendon unit. As a consequence, strain patterns on the anterior cruciate ligament are reduced and the knee joint is actively stabilized, which further reduces impact and leads to a more stable joint prior to and during impact [McNair, et al. 1992]. The studies above explain how the physiological variable “musculoskeletal stiffnesss” influences the kinetic behaviour of the lower extremity. In contrast to the male control group in the present study, stiffness is significantly different during the various stages of the menstrual cycle. A logical explanation for this phenomenon would be the changing serum level of estrogen of the female participant. This argument is also supported by Clark, et al. [2010] who investigated acceleration transients in a group of women undergoing the normal menstrual cycle and a group of women who were taking a monophasic contraceptive pill (MOPC). With the regular use of MOCP the natural estrogen cycle is suppressed and a steady serum estrogen level is present. The authors could clearly demonstrate that medio-lateral acceleration during 15 consecutive gait cycles was significantly (p=0.011) more variable in the group not taking MOCP. In addition, our research group [Hohmann, et al. 2005] has previously demonstrated that musculotendinous stiffness in MOCP users did not vary compared to a group of women undergoing a normal menstrual cycle. One of the purposes of the current project was to determine differences in viscoelastic properties – musculotendinous stiffness - during the menstrual cycle. A research hypothesis was formulated that fluctuations of estrogen levels during the menstrual cycle will influence musculotendinous stiffness values. In the present female study group, significant (p=0.04) within group differences between the ovulatory phase and the other phases of the cycle were observed. Moreover, the male group demonstrated significantly (p=0.004) higher stiffness values than the female study group, and in the male control group stiffness did not fluctuate 51 between the two test sessions.The hypothesis is therefore supported by the findings of the current research. 4.6. Limitations In addition to the limitations discussed in 1.5. and 1.6. above, the current project has a number of other limitations. In modern times it is inherently difficult to recruit young women with a regular menstrual cycle who do not take oral contraceptive medication. In addition it was felt important to create a homogenous group to avoid the introduction of confounding variables. This could have possibly resulted in a type II error. However given the significant findings, it was felt that the chances of having committed a type II error were small. In addition previous researchers have published results using similar methods and sample sizes [Abt, et al. 2007; Heitz 1999; Hertel, et al. 2006]. The ovulatory phase lasts between two and four days. The determination of the exact day of ovulation is difficult and cannot always be achieved. However blood samples confirmed that the estrogen and luteinizing hormone levels were significantly higher than at any of the other phases of the cycle. It can therefore be safely assumed that the likelihood of having committed an error in determining the ovulatory phase was rather small. 4.7. Conclusion The results of the current project strongly suggest that hormonal fluctuations have a significant effect on musculotendinous stiffness of the lower extremity and TPTA indicating better neuromuscular control during low estrogen serum levels in the female cohort during the menstrual cycle. As a consequence, the female musculoskeletal system needs to constantly adjust to the changing hormonal environment, adapting neuromuscular strategies to minimize injury risk to the lower extremity. The constant need for neuromuscular adaptations may have 52 implications for the prevention of anterior cruciate ligament injuries in the female athlete. Furthermore, it potentially places the anterior cruciate ligament at an increased risk of injury. Future research needs to concentrate on the effect of the monophasic pill on the neuromuscular system as a potential preventative measure. It will also be important to investigate changes of neuromuscular properties in relation to age, as females may be able to more easily adjust to these challenging neuromuscular changes with increasing age and the number of cycles experienced. Furthermore the effect of muscle fatigue and sports-specific adaptations on the musculoskeletal system is unknown and warrants investigation. 53 5. Summary Previous studies have shown that a female athlete participating in the same sport as a male is at 2-8 times higher risk sustaining an anterior cruciate ligament injury. An obvious gender difference is the presence of fluctuating hormone levels in females during the menstrual cycle, and this by itself could be a potential independent risk factor for sustaining an anterior cruciate ligament injury. The purpose of the present study was to investigate whether hormone level fluctuations during the menstrual cycle influence viscoelastic properties (musculotendinous stiffness) and tibial acceleration profiles of the lower extremity. Eleven adolescent female netball players were included in the study. The control group was recruited from an age-matched sample of active male subjects. Test sessions in the female athletes were conducted at onset of menses, during the midfollicular phase, at ovulation and during the mid-luteal phase. Musculotendinous stiffness was assessed using the oscillation method. Tibial acceleration profiles, peak tibial acceleration (PTA), time to peak tibial acceleration (TPTA) and, time to zero tibial acceleration (TZTA)] were assessed with a uniaxial accelerometer placed on the tibial tuberosity during a standardised netball landing task. In the female study group there was no significant difference between cycle phases for PTA (p=0.45) and TZTA (p=0.59). For TPTA significant differences were observed between one and two (p=0.04),week one and three (p=0.001), week one and four (p=0.002) and week two and three (p=0.007). The male control group demonstrated overall higher values for PTA and TZTA, whilst TPTA was shorter compared to the female group. There was no significant (p=0.08) difference between any of the test sessions in the male control group. 54 There were no significant between group differences for PTA (p=0.1) and TZTA (p=0.48). However there was a significant difference (p=0.001) between the male control group and the female study group for time to TPTA with the females exhibiting significantly higher values. This finding strongly suggests that the male control subjects had a better ability to arrest tibial acceleration in a shorter period of time compared to females. As a consequence the anterior cruciate ligament of the female cohort may have to absorb higher forces during the deceleration process. However a shorter time to TPTA also suggests that males may have better neuromuscular control of the lower extremity during dynamic tasks. In addition a shorter TPTA in the females group is suggestive of poorer muscle control and an increase in anterior translation of the tibia. This potentially stretches the anterior cruciate ligament more than in the male group. The male control group demonstrated significantly (p=0.004) higher values of lower extremity stiffness than the female study group. In the female study group significant (p=0.04) differences between the ovulatory phase and the other phases of the cycle were also observed. Taken together, the results of the current project strongly support the study hypotheses that hormonal fluctuations have a significant effect on viscoelastic properties and tibial acceleration profiles in young females during the menstrual cycle. It appears that the female musculoskeletal system may need to constantly adjust to the changing hormonal environment and adapt neuromuscular strategies to minimize injury risk to the lower extremity. This constant need for neuromuscular adaptations potentially places the anterior cruciate ligament at an increased risk of injury, and may have implications for the prevention of anterior cruciate ligament injuries in the female athlete. 55 6. References Abt JP, Sell TC, Laudner KG, McCrory JL, Loucks TL, Berga SL, Lephart SM: Neuromuscular and biomechanical characteristics do not vary across the menstrual cycle. Knee Surg Sports Traumatol Arthrosc 2007; 15:901–907 Amis AA, Dawkins GPC: Functional anatomy of the anterior cruciate ligament. J Bone Joint Br 73B 1991; 2:260-267 Anderson AF, Lipscomb AB, Liudahl KJ, Addlestone RB: Analysis of the intercondylar notch by computed tomography. Am J Sports Med 1987; 15(6):547-552 Arendt EA: Relationship between notch width index and risk of non-contact ACL injury. In Griffin LY, (ed.): Prevention of non-contact ACL injuries. Rosemont, American Academy of Orthopaedic Surgeons, 2001, p. 33 Bell DG, Jacobs I: Electromechanical response times and rate of force development in males and females. Med Sci Sports Exerc 1986; 18:31-6 Beynnon BD, Bernstein I, Belisle A: The effect of estradiol and progesterone on knee and ankle laxity. Am J Sports Med 2005; 33:1298-1304 Busfield BT, Kharrazi FD, Starkey C, Lombardo SJ, Seegmiller J: Performance outcomes after anterior cruciate ligament reconstruction in the National Basketball Association. Arthroscopy 2009; 25 (8):825-830 Bryant AL: Knee function and neuromuscular adaptations following ACL rupture and reconstruction. PhD thesis, University of Wollongong, 2007 Brophy RH, Silvers HJ, Mandelbaum BR: Anterior cruciate ligament injuries: etiology and prevention. Sports Med Arthrosc Rev 2010; 18:2-11 Busfield BT, Kharrazi FD, Starkey C, Lombardo SJ, Seegmiller J: Performance outcomes of anterior cruciate ligament reconstruction in the National Basketball Association. Arthroscopy 2009; 25 (8):825-830 Butler DL, Noyes FR, Grood ES: Ligamentous restraints to anterior-posterior drawer in the human knee: a biomechanical study. J Bone Joint Surg Am 1980; 62:259-270 Carter C, Wilkinson J: Persistent laxity and congenital dislocation of the hip. J Bone Joint Br 1964; 62:40-45 Chappell JD, Creighton RA, Giuliani C, Yu B, Garrett WE: Kinematics and electromyography of landing preparation in vertical stop-jump: risks for noncontact anterior cruciate ligament injury. Am J Sports Med 2007; 35:235–241 Clark RA, Bartold S, Bryant AL: Tibial acceleration variability during consecutive gait cycles is influenced by the menstrual cycle. Clin Biomech 2010; 25:557–562 56 Coventry E, O’Connor KM, Hart BA, Earl JE, Ebersole KT: The effect of lower extremity fatigue on shock attenuation during single-leg landing. Clin Biomech 2006; 21:1090-1097 Deie MS Sakamaki Y,Sumen Y,Urabe Y,Ikuta Y: Anterior knee laxity in young women varies with their menstrual cycle. Int Orthop 2002; 26:154 Dowling AV, Corazza S, Chaudari AMW, Andriacchi TP: Shoe-surface friction influences movement strategies during a sidestep cutting task. Implications for anterior cruciate ligament injury risk. Am J Sports Med 2010; 38:478-485 Ebben WP, Fauth ML, Petushek E, Garceau LR, Hsu BE, Lutsch BN, Feldmann CR: Genderbased analysis of hamstring and muscle activation during jump landings and cutting. J Strength Cond Res 2010, 24 (2):408-415 Eiling E, Bryant AL, Petersen W, Murphy A, Hohmann E: Effects of menstrual cycle hormone fluctuations on muscultendinous stiffness and knee joint laxity. Knee Surg Sport Traumatol Arthrosc 2007; 15:126-132 Fagenbaum R, Darling WG: Jump landing strategies in male and female college athletes and the implications of such strategies for anterior cruciate ligament injury. Am J Sports Med 2003; 31(2):233-40 Farley CT, Blickhan R, Saito J, Taylor CR: Hopping frequency in humans: a test of how springs set stride frequency in bouncing gaits. J Appl Physiol 1991; 71 (6):2127-2132 Ferris DP; Farley CT: Interaction of leg stiffness and surfaces stiffness during human hopping. J Appl Physiol 1997; 82:15 Flynn JM, Holmes JD, Andrews DM: The effect of localized muscle fatigue on tibial impact acceleration. Clin Biomech 2004; 19:726-732 Frank CB, Jackson DW: The science of reconstruction of the anterior cruciate ligament. J Bone Joint Surg Am 1997; 79:1556-1576 Fukubayashi T, Torzilli PA, Sherman MF, Warren RF: An in-vitro biomechanical evaluation of anterior-posterior motion of the knee: tibial displacement, rotation and torque. J Bone Joint Surg Am 1982; 64:264 Gabriel MT, Wong E, Woo SL, Yagi M, Debski RE: Distribution of in situ forces in the anterior cruciate ligament in response to rotator loads. J Orthop Res 2004; 22:85-89 Gehring D, Meinyk M, Gollhofer A: Gender and fatigue have influence on knee joint control strategies during landing. Clin Biomech 2009; 24 (1):82-87 Gillquist J, Messner K: Anterior cruciate ligament reconstruction and the long-term incidence of gonarthrosis. Sports Med 1999; 27 (3):143-156 Giza E, Mithofer K, Farell L, Zarins B, Gill T: Injuries in women´s professional soccer. Br J Sports Med 2005; 39(4):212-6 57 Granan LP, Forssblad M, Lind M, Engebretsen L: The Scandinavian ACL registries 20042007: baseline epidemiology. Acta Orthop 2009; 80 (5):563-567 Granata KP, Padua DA, Wilson SE: Gender differences in active musculoskeletal stiffness, part II: quantification of leg stiffness during functional hopping tasks. J Electromyogr Kinesiol 2002; 12:127-135 Granata KP, Wilson SE, Padua DA: Gender differences in active musculoskeletal stiffness, part I: quantification in controlled measurements of knee joint dynamics. J Electromyogr Kinesiol 2002; 12:119-126 Griffin LY, Agel J, Albohm MJ, Arendt EA, Dick RW, Garrett WE, Garrick JG, Hewett TE, Huston L, Ireland ML, Johnson RJ, Kibler WB, Lephart S, Lewis JL, Lindenfeld TN, Mandelabum BR, Mrachak P, Teitz CC, Wojtys EM: Noncontact anterior cruciate ligament injuries: risk factors and prevention strategies. J Am Acad Orthop Surg 2000; 8:141-150 Griffin LY, Albohm MJ, Arendt EA, Bahr R, Beynnon BD, Demaio M, Dick RW, Engebretsen L, Garrett WE Jr, Hannafin JA, Hewett TE, Huston LJ, Ireland ML, Johnson RJ, Lephart S, Mandelbaum BR, Mann BJ, Marks PH, Marshall SW, Myklebust G, Noyes FR, Powers C, Shileds C Jr, Shultz SJ, Silvers H, Slauterbeck J, Taylor DC, Teitzz CC, Wojtys EM, Yu B: Understanding and preventing noncontact anterior cruciate ligament injuries . A review of the Hunt Valley II Meeting, January 2005. Am J Sports Med 2006; 34:1512-1532 Gwinn DE, Wilckens JH, McDevitt ER, Ross G, Kao TC: The relative incidence of anterior cruciate ligament injury in men and women in the United States Naval Academy. Am J Sports Med 2000; 27(1):98-102 Hakkinen K: Force Production Characteristics of Leg Extensor, Trunk Flexor, and Extensor Muscles in Male and Female Basketball Players. J Sports Med Phys Fitness 1991; 31:325-31 Heitz NA: Hormonal changes throughout the menstrual cycle and increased anterior cruciate ligament laxity in females. J Athletic Training 1999; 343:144-149 Hennig EM, LaFortune MA: Relationships between ground reaction force and tibial bone acceleration parameters. Int J Sports Biomech 1991; 7:303-309 Hertel J, Williams NI, Olmsted-Kramer LC, Leidy HJ, Putkian M: Neuromsucular performance and knee laxity do not change across the menstrual cylcle in female athletes. Knee Surg Sports Traumatol Arthrosc 2006; 14:817-822 Hewett TE, Myer GD, Ford KR, Heidt RS Jr, Colosimo AJ, McLean SG, van den Bogert AJ, Paterno MV, Succpo P: Biomechanical measures of neuromuscular control and valgus loading of the knee predict anterior cruciate ligament injury risk in female athletes: a prospective study. Am J Sports Med 2005; 33:492-501 Hohmann E, Stanton R, Bryant A : Does the pill reduce the incidence of ACL injuries in women? Proceedings of the 2005 Annual Scientific Meeting of the Australian Orthopaedic Association, Perth, Australia 58 Hohmann E, Bryant AL: Biomechanics of ACL rupture and deficiency, surgical repair, rehabilitation and post-surgical evaluation. In: Sports Science and Sports Medicine Reviews. Selected Topics. 2005 75-86. In Marshall S, Hohmann E, and Bryant AL, (eds.): Sports Science and Sports Medicine Reviews. Central Queensland University Publishing Unit, Australia, 2005, p. 75 Hume PA, Steele JR: A preliminary investigation of injury prevention strategies in Netball: are players heeding the advice? J Science Med Sport 2000; 3 (4):406-413 Irmischer BS, Harris C, Pfeiffer RP, DeBeliso MA, Adams KJ, Shea KG: Effects of a knee ligament injury prevention exercise program on impact forces in women. J Strength Cond Res 2004; 18(4):703-7 James CR, Sizer PS, Starch DW, Lockhart TE, Slauterbeck J: Gender differences among sagittal plane knee kinematics and ground reaction force characteristics during a rapid sprint and cut maneuver. Res Q Exerc Sport 2004; 75(1):31-38 Karageanes SJ, Blackburn K, Vangelos ZA: The association of the menstrual cycle with the laxity of the anterior cruciate ligament in adolescent female athletes. Clin J Sport Med 2000; 10:162-168 Keays SL, Newcombe PA, Bullock-Saxton JE, Bullock MI, Keays AC: Factors involved in the development of osteoarthritis after anterior cruciate ligament surgery. Am J Sports Med 2010; 38:455-463 Koga H, Nakamae A, Shima Y, Iwasa J, Myklebust G, Engebretsen L, Bahr R, Krosshaug T: Mechanisms for noncontact anterior cruciate ligament injuries. Am J Sports Med 2010; 38:2218-2225 Krishnan C, Huston K, Amendola A, Williams GN: Quadriceps and hamstring muscle control in athletic males and females. J Orthop Res 2008; 26 (6):800-808 Kubo K, Kanehisa H, Ito M, Fukunaga T: Effects of isometric training on the elasticity of human tendon structures in vivo. J Appl Physiol 2001; 91:26-32 Lambson RB, Barnhill BS,Higgins RW: Football cleat design and its effect on anterior cruciate ligament injuries: A three-year prospective study. Am J Sports Med 1996; 24:155159 LaFortune MA, Hennig EM: Contribution of angular motion and gravity to tibial acceleration. Med Science Sports Ex 1991; 23:360-363 LaFortune MA, Hennig EM, Valiant GA: Tibial shock measured with bone and skin mounted transducers. J Biomech 1995; 28:989-993 Lephart SM, Ferris CM, Riemann BL, Myers JB, Fu FH: Gender differences in strength and lower extremity kinematics during landing. Clin Orthop Rel Res 2002; 401:162-169 59 Liu SH, Al-Shaikh R, Panossian V, Yang RS, Nelson SD, Soleiman N, Fineman GA, Lande JM: Primary immunolocalization of estrogen and progesterone target cells in the human anterior cruciate ligament. J Orthop Res 1996;14:526-33. Lohmander LS, Englund PM, Dahl LL, Roos EM: The long-term consequence of anterior cruciate ligament and meniscus injuries. Am J Sports Med 2007; 35 (10):1756-1769 Lund-Hanssen H, Gannon J, Engebretsen L, Holen KJ, Anda S, and Vatten L: Intercondylar notch width and the risk for anterior cruciate ligament rupture. A case-control study in 46 female Handball players. Acta Orthop Scand 1994; 65(5):529-32 Malinzak RA, Colby SM, Kirkendall DT,Yu B,Garrett WE: A comparison of knee joint motion patterns between men and women in selected athletic tasks. Clin Biomech (Bristol, Avon) 2001; 16:438-445 Manal K, IM Davis, Galinat B, Stanhope S: The accuracy of estimating proximal tibial translation during natural cadence walking: bone vs skin mounted targets. Clin Biomech. 2003; 18:126-131 McNair PJ, Wood GA, Marshall RN: Stiffness of the hamstring muscles and its relationship to function in anterior cruciate deficient individuals. Clin Biomech 1992; 7:131-173 Mc Nair PJ, Marshall RN: Landing characteristics in subjects with normal and anterior cruciate ligament deficient knee joints. Arch Phys Med Rehabil 1994; 75:584-589 McNair PJ, Dombrowski EW, Hewson DJ, Stanley SN: Stretching at the ankle joint: viscoelastic responses to holds and continuous passive motion. Med Sci Sports Exerc 2001; 33 (3):354-358 Medrano D Jr. Smith D: A comparison of knee joint laxity among male and female collegiate soccer players and non-athletes. Sports Biomech 2003; 2(2):203-212 Miyasaka KC, Daniel DM, Stone ML, Hirshman HP: The incidence of knee ligament injuries in the general population. Am J Knee Surg 1991; 4:3-8 Morris JK, Richards JS: Luteinizing Hormone induces prostaglandine endoperoxide synthase2 und luteinization in vitro by A-kinase and C-Kinase pathways. Endocrinlogy 1995; 136 (4):1549-1558 Myer GD, Ford KR, Hewett TE: The effects of gender on quadriceps muscle activation strategies during a maneuver that mimics a high ACL injury risk position. J Electromyogr Kinesiol 2005; 15(2):181-189 Myklebust G, Engebretsen L, Braekken IH, Skjolberg A, Olsen OE, Bahr R: Prevention of anterior cruciate ligament injury in female team Handball players: a prospective intervention study over three seasons. Clin J Sports Med 2003; 13:71-78 Myklebust G, Bahr: Return to play guidelines after anterior cruciate ligament surgery. Br J Sports Med 2005; 39 (3):127-131 60 Nakamura RM, Stanczyk FZ: Immunoassays. In Mishell DR Jr, Davajan V, and Lobo RA, editors: Infertility, contraception and reproductive endocrinology, ed 3, Cambridge, Mass, 1991, Blackwell Scientific Publications Noyes FR. Grood ES: The strength of the anterior cruciate ligament in humans and rhesus monkeys. J Bone Joint Surg Am 1976; 58A (8):1074-1082 Noyes FR: The Noyes knee rating system. Cinncinati, Ohio, Cinncinati Sportsmedicine and Education Foundation, 1995 Øiestad BE, Engebretsen L, Storheim K, Risberg MA: Knee osteoarthritis after anterior cruciate ligament injury: a systematic review. Am J Sports Med 2009; 37:1434-1443 O’Keefe DJ: Colloquy: Should familywise alpha be adjusted? Human Communication Research 2003; 29 (3):431-447 Orchard J, Seward H, McGivern J, Hood S: Rainfall, evaporation and the risk of non-contact anterior cruciate ligament injury in the Austalian Football League. Med J Aust 1999; 170 (7):304-306 Orchard J, Seward H, McGivern J, Hood S: Intrinsic and extrinsic risk factors for anterior cruciate ligament injury in Australian footballers. Am J Sports Med 2001, 29:196-200 Orchard JW, Chivers I, Aldous D, Bennell K, Seward H: Rye grass is associated with fewer non-contact anterior cruciate ligament injuries than Bermuda grass. Br J Sports Med 2005; 39 (10):704-709 Orchard J, Rodas G, Lluis T, Ardevol J, Chivers I: A hypothesis: could portable natural grass be a risk factor for knee injuries? J Sport Science Med 2008; 7:184-190 Park SK, Stefansyn DJ, Ramage B, Hart DA, Ronsky JL: Relationship between knee joint laxity and knee joint mechanics during the menstrual cycle. Br J Sports Med 2009; 43:174179 Paschos NK, Gartzonikas D, Barkoula NM, Moraiti C, Paipetis A, Matikas TE, Georgoulis AD: Cadaveric study of anterior cruciate ligament failure patterns and uniaxial tension along the ligament. Arthroscopy 2010; 26 (7):957-967 Petersen W, Zantop T: Anatomy of the anterior cruciate ligament with regard to its two bundles. Clin Orth 2007; 454:447 Petschnig R, Baron R, Albrecht M: The relationship between isokinetik quadriceps strength and hop tests for distance and one-legged vertical jump following anterior cruciate ligament reconstruction. J Orthop Sports Phys Ther 1998; 28:23-31 Prodromos CC, Han Y, Rogowski J, Joyce B, Shi K: A meta-analysis of the incidence of anterior cruciate ligament tears as a function of gender, sport, and a knee injury-reduction regimen. Arthroscopy 2007; 23 (12):1320-1325 61 Richards JS: Maturation of ovarian follicles: actions and interactions of pituitary and ovarian hormones on follicular cell differentiation. Physiol Rev 1980; 60:51-89 Rizzo M, Holler SB, and Bassett FH. Comparison of males´ and females´ ratio of anterior cruciate ligament width to femoral intercondylar notch width: a cadaveric study. Am J Orthop 2001; 30(8):660-664 Romani W, Patrie J, Curl LA, Flaws JA: The correlations between estradiol, estrone, estriol, progesterone and sex hormone-binding globulin and anterior cruciate ligament stiffness in healthy, active females. J Womens Health 2003; 12(3):287-298 Rozzi SL, Lephart SM, Gear WS, Fu FH: Knee joint laxity and neuromuscular characteristsics of male and female soccer and basketball players. Am J Sports Med 1999; 27:312-319 Salci Y, Kentel BB, Heycan C, Akin S, and Korkusuz F. Comparison of landing maneuvers between male and female College Volleyball players. Clin Biomech (Bristol, Avon) 2004; 19(6):622-628 Shah VM, Andrews JR, Fleiig GS, McMichael CS, Lemak LJ: Return to play after anterior cruciate ligament reconstruction in national football league athletes. Am J Sports Med 2010; 38 (11):2233-2239 Shirtcliff EA, Reavis R, Overman WH, Granger DA: Measurement of gonadal hormones in dried blood spots versus serum: verification of menstrual cycle phase. Horm Behav 2001; 39:258-266 Shultz SJ, Sander TC, Kirk SE, Perrin DH: Sex differences in knee joint laxity change across the female menstrual cycle. J Sports Med Phys Fitness 2005; 45:594-603 Speroff L, Vande Wiele RL: Regulation of the human menstrual cycle. Am J. Obs Gyn 1971; 109:234-247 Steele JR: Biomechanical factors affecting performance in Netball. Implications for improving performance and injury reduction. Sports Med 1990; 10 (2):88-102 Sung PS, Lee DC: Gender differences in onset timing and activation of the muscles of the dominant knee during stair climbing. Knee 2009; 16 (5):375-380 Swanik CB, Lephart SM, Swanik KA, Stone DA, Fu FH: Neuromuscular dynamic restraint in women with anterior cruciate ligament injuries. Clin Orth Rel Res 2004; 425:189-199 Tillmann MD, Smith KR, Bauer JA, Cauraugh JH, Falsetti AB, Pattishall JL: Differences in three intercondylar notch geometry indices between males and females: a cadaver study. Knee 2002; 9(1):41-46 Toth AP, Cordasco FA: Anterior cruciate ligament injuries in the female athlete. J Gender Specific Med 2001; 4(4):312-27 62 Turcot K, Aissaoui R, Boivin K, Hagenmeister N, Pelletier M, de Guise JA: Test-retest reliability and minimal change determination for 3-dimensional tibial and femoral accelerations during treadmill walking in knee osteoarthritis patients. Arch Phys Med Rehabil 2008; 89:732-737 Van Lunen BL, Roberts J, Branch JD, Dowling EA: Association of menstrual-cycle hormone changes with ACL laxity measurements. J Athl Train. 2003; 38:298-303 Viola RW, Steadman JR, Mair SD, Briggs KK, Sterett WI: Anterior cruciate ligament injury incidence among male and female professional Alpine skiers. Am J Sports Med 1999; 27(6):792-795 Wojtys EM, Huston LJ, Lindenfeld TN, Hewett TE, Greenfield ML: Association between the menstrual cycle and anterior cruciate ligament injuries in female athletes. Am J Sports Med 1998; 26 (5):614-619 Wojtys EM, Huston LJ, Boynton MD, Spindler KP, Lindenfeld TN: The effect of the menstrual cycle on anterior cruciate ligament injuries in women as determined by hormone levels. Am J Sports Med 2002; 30 (2):182-188 Wojtys EM, Huston LJ, Schock HJ, Boylan JP, Ashton-Miller JA: Gender differences in muscular protection of the knee in size matched athletes. J Bone Joint Surg Am 2003; 85A(5):782-9 63 7. List of Figures Figure 1: Anterior Cruciate Ligament: outline of the antero-medial and posterolateral bundle. (from: Knee Anatomy for Orthopaedic Surgeons, ESSKA, Athens 2004) Figure 2: A typical situation in Netball is demonstrated. One player (red) catches the ball during the flight phase and is landing on her dominant leg. Another player (blue) is defending. (own material) Figure 3: Gives an overview of pituitary and ovary hormone levels during the menstrual cycle. (from www.embryology.med.unsw.edu.au) Figure 4: demonstrates how the accelerometer was attached to the tibial tuberosity. (own material) Figure 5: The tibial acceleration-time curve is demonstrated. The variables that were obtained from tibial acceleration for this research project: (A) peak tibial acceleration (PTA), (B) time to peak tibial acceleration (TPTA), (C) time to zero tibial. (own material) Figure 6: A subject landing on the designated area (force plate) while catching a netball. In the background the timing lights can be seen. (own material) Figure 7: Reflective markers were placed at the anterior superior iliac spine, greater trochanter, lateral femoral condyle, fibular head, lateral malleolus, lateral Achilles-tendon-calcaneus junction and lateral prominent head of the first metatarsals. (own material) Figure 8: Demonstrates the force acting on, and the acceleration, velocity and displacment of a mass m undergoing simple harmonic motion. [(Figure 15-8) page 307 from Hallyday & Resnik: Physics parts 1 and 2, John Wiley and Sons Inc, 1978] Figure 9: Demonstrates damped harmonic motion plotted versus time. The motion is oscillatory with everdecreasing amplitude. The amplitude is seen to start with value A and decay exponentially to zero as t approximates ∞. [(Figure 15-19) page 323 from Hallyday & Resnik: Physics parts 1 and 2, John Wiley and Sons Inc, 1978] Figure 10: Demonstrates the hopping test to assess musculotendinous stiffness on a force plate. (own material) Figure 11: The graph demonstrating data collection of vertical ground reaction forces filtered with 500Hz. (own material) 64 Figure 12: Overview of hormone fluctuations of the male control group. (own material) Figure 13: Overview of tibial acceleration profiles for the female study group. (own material) Figure 14: Overview of tibial acceleration profiles for the male control group. (own material) Figure 15: The results for musculotendinous stiffness values for the female study group. (own material) Figure 16: The results for musculotendinous stiffness for the male control group. (own material) Figure 17: The results for overall musculotendinous stiffness between groups and phases. (own material) 65 8. List of Tables Table 1: 95% Confidence Limits of Hormones Used in Reproduction. (from Nakamura RM and Stanczyk FZ: Immunoassays. In Mishell DR Jr, Davajan V, and Lobo RA, editors: Infertility, contraception and reproductive endocrinology, ed 3, Cambridge, Mass, 1991, Blackwell Scientific Publications) Table 2: Demographic details of the female study group. (own material) Table 3: Demographic details of the male control group. (own material) Table 4: Overview of hormone levels including standard deviations during the menstrual cycle of the female study group. (own material) Table 5: Overview of hormone levels including standard deviations between test sessions for the male control group. (own material) 66 9. List of Abbreviations ACL Anterior Cruciate Ligament ANOVA Analysis of Variance ATT Anterior Tibial Translation EMG Electromyogram FSH Follicular Stimulating Hormone GnRH Gonadotropin Releasing Hormone Hz Hertz ICSH Interstitial Cell Stimulating Hormone IU International Units LH Luteinizing Hormone MOCP Monophasic Contraceptive Pill MS Milliseconds MTS Musculotendinous Stiffness N Newton Nm Newtonmeter N.S. Non Significant PTA Peak Tibial Acceleration TA Tibial Acceleration TPTA Time to Peak Tibial Acceleration TZTA Time to Zero Tibial Acceleration W Watt 67 10. DEDICATION FOR STEFANIE MY WIFE For putting up with the busy life of a full-time surgeon with academic inspirations 68 11. ACKNOWLEDGMENTS Sincere thanks to the following people without whose assistance; this thesis would not have been possible: Associate Professor Peter Reaburn (School of Health and Human Movements, CQ University) for his continous support and help. Peter you are a true asset to the University. The School of Human Movements and the staff of the Musculoskeletal Research Unit for providing feedback and support Professor Andreas Imhoff for his continuous support and help, taking me on as a mature student and being so patient with the delivery of this thesis. Dr. med Elisabeth Eiling for all her hard work in recruiting subjects, coordonation and testing of all subjects CONROD Professor Kevin Tetsworth (Director Orthopaedics Royal Brisbane Hospital, and Professor for Orthopaedic Trauma, University of Queensland) for his friendship and continous help with research projects and publications. The numerous subjects who gave up their time to repeatedly come to the laboratory to participate in this study. Stefanie, my wife who supported me for all these years. 69 APPENDIX I Ethics Application to the Human Ethics Research Review Panel at Central Queensland University HUMAN RESEARCH ETHICS COMMITTEE Request for Ethical Clearance (to conduct research involving human participants and/or access to personal information) The attention of researchers is invited to the University’s R2.1 Code of Conduct for Research and related documentation including the National Statement on Ethical Conduct in Research Involving Humans (2001) available on the Internet at: http://www.health.gov.au/nhmrc/ethics/contents.htm This proforma, completed in black type, is to be submitted to the Office of Research. Where a response is not intended, insert “NOT APPLICABLE.” Please do not fix with staples. RESEARCH TEAM Principal Researcher (Where Principal Researcher is a Postgraduate Researcher or Honours Researcher, include contact details and name of degree) Eiling, Ms, Elisabeth (cand. med.) Central Queensland University Building 77/1.11 Ph: 49 232116 (Family Name, Title, Given Name) Other Investigators Hohmann, Dr, Erik Orthopaedic surgeon Department of Orthopaedics Rockhampton Health Service District Ph. 4920 63 56 (Family Name, Title, Given Name) Principal Supervisor of Postgraduate Researcher (where relevant) (Include Location and Contact Information) Bryant, Dr, Adam Central Queensland University Building 77/1.05 Ph: 49 306752 (Family Name, Title, Given Name) 70 DECLARATION BY FIRST-NAMED INVESTIGATOR 1. The information contained herein is, to the best of my knowledge and belief, accurate. I accept responsibility for the conduct of the proposed research and agree to abide by the University’s Code of Conduct for Research and any other provision as determined by the Human Ethics Research Review Panel. 2. I undertake to ensure that data is collected and maintained in accord with University requirements. 3. I, together with my co-investigators and any support staff, have the appropriate qualifications, experience and access to facilities to conduct the research as described in the attached documentation, and will be able to deal with any emergencies and/or contingencies that may arise during or as a result of the conduct of the proposed research. Signature of Principal Researcher: Date: Signature of Principal Supervisor of Postgraduate Researcher (where relevant) Date: 1. 1.1 PROJECT DETAILS Project Title The effect of cyclic female hormones on anterior cruciate ligament laxity and lower limb kinematics during landing and deceleration Proposed commencement date of involvement with human participants: 24/06/03 Proposed duration of the data collection from human participants: from 24/06/03 to 30/11/03 Please note that the project may not begin until clearance is granted by the Human Ethics Research Review Panel 1.2 Briefly describe the research purpose, techniques and procedures to be adopted and/or implemented for the conduct of the proposed research. PURPOSE: The purpose of this research is to investigate the effects of alternating levels of female sex hormones during a normal female cycle on the ACL laxity, and lower limb biomechanics during landing and deceleration. Several studies (Arendt, E. & Dick, R., 1995; Ireland, M.L. & Wall, C., 1990) have shown a higher incidence of ACL injuries in female athletes compared to their male counterparts when participating in the same sport. Various reasons to explain this phenomenon have been put forward. One of these being the fluctuation of female sexual hormones during a typical menstrual cycle given the fact that these hormones can affect the 71 mechanical properties of soft tissue. A correlation between the levels of estrogens, progesterone and relaxin and the laxity of the ACL has been hypothesized. This study will investigate the relationships between ACL laxity, landing kinetic and kinematics and female hormone levels to delineate which days of the cycle there is an increased risk of ACL injury. According to these findings, a guideline for female athletes can be established to take precautions on those days to help prevent injury. TECHNIQUES AND PROCEDURES: All testing will be conducted at the Biomechanics Laboratory of Central Queensland University. The subjects will be required to complete an International Knee Documentation Committee (IKDC) knee evaluation form (see attached). The female subjects were required to map their menstrual cycle for two months prior to testing and throughout the testing period. They have been provided with calendars and instructions for completing this stage of the protocol (See attached). Subjects with consistent 26-30 days cycles, normal length of menses (4-7 days) and menarche longer than 1 year ago will be selected. The subjects will be required to attend 5 sessions in total. The first session will be a familiarisation session in which each subject will be shown the equipment and introduced to the testing procedure. The procedure for blood sampling, knee laxity measurements using the KT-2000™ and force plate test (hopping and deceleration experiments) will be explained and demonstrated to the subjects. The subjects will then be required to attend 4 more testing sessions first day of menses, day 7, 14 and 21 prior to the first day of their menses. During these sessions blood samples will be taken, the KT-2000™ will be used to displace the tibia in anterior and posterior direction to measure knee laxity (both knees) and a landing test over a force plate will be used to calculate lower limb adaptations together with a test of musculotendinous stiffness which includes a jumping protocol to be performed over the force plate. Subjects will be required to refrain from any strenuous exercise for 48 hours prior to conducting sessions. All subjects will be required to consume “standard meals” based upon their typical diet and drink plenty of water prior to attending the laboratory testing sessions. Prior to the testing sessions all subjects will have two resting blood sample of 10 ml taken from the non-dominant arm using a 21 gauge needle. The blood sample will be taken from the antecubital vein. Alcohol swabs will be used to clean the area prior to the collection of blood and all researchers 72 will be wearing gloves, laboratory coats and will observe universal safety precautions. One of these blood samples will be stored on ice and sent to Sullivan and Nicolaides Laboratory Rockhampton and will be analysed for Progesterone, LH, FSH and Estradiol. The other sample will be stored at Central Queensland University at –80º C (it might be used for further analysis of relaxin levels by ELISA in the course of the study). Knee laxity measurements will be taken on both legs of the subjects using the KT-2000™ knee arthrometer ® which is a safe and effective way for determining the amount of movement within the knee joint. Both legs will be supported at 30º knee flexion. A strap will be placed around the subjects’ thighs to keep the legs stable. The subjects’ feet will be placed on a foot-rest to prevent excessive movement. The subjects arms will be placed beside the individual and their head will be rested on a pillow. The KT-2000 will be strapped to the anterior surface of the tibia via 2 Velcro straps, enabling the device to be positioned over the joint line of the knee. The machine will be used to displace the tibia in the anterior direction at 15, 20 and 30 pounds of pressure and in the posterior direction at 15 and 20 pounds of pressure. For the landing task, the individuals will be asked to accelerate for approximately six steps whilst approaching the force plate. Shortly before they hit the force plate, they will be required to catch a ball from one of three directions. By knowing that they might have to catch a ball, the subjects will be distracted and thus cannot concentrate on placing the foot on the force plate. This will make the test situation more realistic and better comparable with real sport situations occurring in team sports such as European handball or basketball. A standard video camera will be used for the collection of kinematic data, which will later be analysed using the Peak™ software/hardware. The tibial acceleration in the anterior/posterior direction will be measured with a uniaxial accelerometer (Crossbow CXL 10LP1). Anatomic landmarks will be highlighted by placing spherical, reflective markers. The leg stiffness will be measured by the hopping technique developed by previous researchers (Farley, Blickman, Saito, and Taylor 1991; Ferris and Farley 1997; Farley, Houdijk, Van Strien and Louie 1998). When running 73 and hopping, the musculoskeletal system behaves as a single linear “leg spring”. This phenomenon allows calculating the stiffness of the overall musculoskeletal system by using the stiffness data obtained for the leg. The individuals will be required to hop at a constant frequency (in accordance with a metronome) on a force plate; three consecutive jumps will be used to obtain an average for analysis. Unilateral and bilateral hops will be performed. NOTE: Where an agency (eg, government department, statutory authority and recognised cultural collective) is the source of either participants or confidential information, attach a statement(s) from an authorised officer confirming the agency’s support for the proposed research. 1.3 Briefly describe the research benefits of this project. 1. Cost saving due to decrease in female ACL and other lower limb injuries 2. May be able to provide females with information on when to avoid or modify exercise in order to reduce lower limb injuries. 1.4 How will stakeholders obtain details of outcomes from the proposed research? (Stakeholders may include participants, project sponsors and/or other interested parties) The participants will be provided with feedback in both written and verbal form. A written report in plain English will be given to each subject explaining the general findings of the research as well as individual information relating to their levels of hormones and stiffness and laxity and how this may effect them. Verbal feedback will be provided throughout the study. All subjects will receive a written report of outcomes of the project therefore there will not be a section on the consent form to tear of for this. The Consent Form should include a separate tear off section for participants to fill in if they wish to receive a plain English version of the outcomes of the project. 2. PROPOSED PARTICIPANTS 2.1 Who are the proposed participants and how will they be selected/recruited It is proposed that 15 - 25 members of a cheerleader team (Rockhampton Central Comets Rugby League) and a netball team from the Cathedral College between the ages of 14-20 who are not taking any form of oral contraception or other hormone therapy and with no previous ACL injury will be recruited for this study. The 14-20 age group was chosen as the vast majority of competitive females will be found in this group. Thus, the results of the study will be more applicable. Furthermore, the validity of the results will be higher due to the selective population. Error will also be minimized by selecting participants with menstrual bleeding of normal length (4-7 days) and regular cycles(26-30 days) with no evidence of chronic or acute diseases. The participating girls can be considered recreational athletes; this might be advantageous as they hopefully respond more genuinely to the different experiments in contrast to high-trained athletes who have developed certain movement patterns in order to obtain knee stability. The subjects will be required to fill out a CQU and International Knee 74 Documentation Committee (IKDC) questionnaire to establish eligibility for the study (see attached). All subjects will be informed of the risks of the experiment and sign a consent form approved by the ethics committee of Central Queensland University. 2.2 Please indicate the sample size (approximate if necessary). What mechanisms will be adopted to protect the rights of those unable to provide informed consent? (eg, children, mentally ill, aged and infirm) As the girls participating in this study are minors, the researchers will contact the test persons as well as their parents or their responsible guardians prior to the study and will explain the experiments that will be undertaken as well as the study concept in detail. The consent form does not only have to be signed and agreed upon by the participating girls but also by their parents/guardians. The researchers put emphasis on the right of the girls and their parents/guardians to withdraw from the study at any time free of prejudice. The participating girls will have the opportunity to discuss concerns, etc with the main researcher who is female herself at any time if questions arise or if they feel uncomfortable with the documentation of their personal data. 2.3 What are the processes or steps involved in obtaining informed consent? All participants will be provided with an information sheet and consent form outlining their right to withdraw from the study at any time (see attached). 2.4 How will the participants be informed of their right to withdraw from the study? Participants will be informed both verbally at the start of each session and in written form (information sheet) of their right to withdraw from the study for whatever reason without prejudice. 2.5 In the consent form specify how the results will be used and what the participant is consenting to. If necessary indicate how the Principal Researcher will seek consent to use the results should this change from the original consent given. (Example – consent was only sought to publish results in a thesis and supply a plain English copy of results to participants. The Principal Researcher now wishes to publish a paper or do a national radio broadcast and therefore needs to seek further consent.) (Please attach a copy of the proposed Information Sheet(s) and Consent Form(s)to be used for the project. Please note that any project proposing to use participants under the age of 18 years must obtain consent from parent/guardians as well as from the participants.) Exemplar Consent Forms and 75 Information Sheets are available at http://www.cqu.edu.au/research/research_services/ethical%20clearance.htm Any written information provided to a participant or subject must contain the statement, "Please contact Central Queensland University's Office of Research (Tel 07 4923 2607) should there be any concerns about the nature and/or conduct of this research project." 3. 3.1 CONFIDENTIALITY/ANONYMITY Where this project involves the use of personal information obtained from a Commonwealth Department or Agency, detail how it is proposed to meet provisions of the Privacy Act 1988. Not Applicable 3.2 How is it proposed to maintain confidentiality and/or anonymity in respect of collected data/information? Particular attention to detail is necessary in the case of research involving any of the following: structured questionnaires participant observation audio or video-taping of participants and/or events access to personal information (including student, patient or client details) The participant’s records will be kept private and confidential. The following steps will be taken to ensure records are secure. 1.Hard copy of results will be kept in a locked filing cabinet 2. All computer data will be coded to ensure anonymity of the participant. 3. Back-up data on floppy disk will be stored in a locked cupboard 4. Back-up of hard drive information will be stored on the Faculty of Arts, Health and Sciences computer network. All subjects will remain strictly confidential with published results maintaining the anonymity of the subjects. Please note that all original data arising from the project must be stored in a secure location for a minimum period of five years (This includes audio cassettes that are later transcribed and data relating to identification of participants). 4. RISK MANAGEMENT 4.1 Identify, as far a possible, any negative sequelae which might arise during or as a consequence of the proposed research. Particular attention to detail is necessary where the proposed research involves any of the following: administration of any stimuli, tasks, investigations or procedures which participants might experience as physically or mentally painful, stressful or unpleasant; performance of any acts which might diminish the self esteem of participants or cause them to experience depression, embarrassment or regret; deception of participants; collection of body tissues or fluid samples. Detail proposed support for participants who experience negative sequelae. 1. All results will remain strictly confidential and published results will maintain anonymity of subjects 2. The testing protocols are designed to be safe and have been found to be safe in previous studies using the same methods. 3. Familiarisation sessions will be included in the study to make sure that participants fully understand the testing techniques that will be used. 76 4. Subjects will be free to withdraw at any time for any reason. 5. Individual result reports will be provided to each participant. The risks to participants are relatively minor. A qualified blood will perform all blood sampling and universal precautions, including the use of gloves, laboratory coats and alcohol swabs will be followed. There is a minimal risk (close to zero) of tearing tissue during the knee laxity test and the running and deceleration tasks. Abnormal response to testing knee laxity and stiffness of the lower limb, such as soreness of joints may occur. These responses are no worse than soreness associated with moderate exercise. The deceleration will put only a minor strain onto the lower limb joints as the test persons are only accelerating six steps. The ball that will be thrown at the girls will be very soft and its travelling speed will be low, the risk of injury imposed by the ball will therefore be negligible. If there is injury sustained during the testing sessions subjects will be directed to seek immediate medical care from their G.P. Also, an orthopaedic surgeon is involved in the study and will oversee each testing session and provide medical care in the event of injury during a session. For monitoring purposes (see National Statement 2001, page 20) the Principal Researcher is required to lodge documentation to the Office of Research as necessary upon completion of the project or annually whichever is sooner, the progress to date or outcome in the case of completed work, maintenance and security of records, compliance with the approved protocol and compliance with any conditions of approval. This may also include immediate reports from researchers in the event of serious or unexpected adverse effects on participants, proposed changes in the protocol, any unforeseeable events or if the project is discontinued before the expected date of completion. Office Use Only Date Received Registration No. Cleared (if required, further documents to be lodged at Office of Research) Cleared Subject to provision of further detail to the satisfaction of the Chair Clearance Not Granted Period of Approval Signature (HREC Chair) Date Date Certification / Advice Issued 77 APPENDIX II Institutionally Approved Consent Form CENTRAL QUEENSLAND UNIVERSITY SCHOOL OF HEALTH AND HUMAN PERFORMANCE The effect of cyclic female hormones on anterior cruciate ligament laxity and muscultotendinous stiffness of the lower limb. INFORMED CONSENT FORM I____________________________________________________ Have read the information contained in the information sheet on the investigation of The effect of cyclic female hormones on Anterior Cruciate Ligament laxity and musculotendinous stiffness of the lower limbs. I have also received a verbal explanation of the study by one of the researchers and agree to participate in this study. I understand that: 1. Information obtained from this study is confidential 2. I am free to withdraw my consent and discontinue participation at any time without any problems. NAME:____________________________________________________________ DATE:_____________________________________________________________ SIGNATURE:_______________________________________________________ NAME OF WITNESS:________________________________________________ DATE:_____________________________________________________________ SIGNATURE OF WITNESS:___________________________________________ I certify that the terms of the form have been verbally explained to the subject, that the subjects understands the terms of participating in this study prior to signing the form. I have asked the subject if he/she needs to discuss the project with an independent person before signing the form and he/she declined or has done so. Arrangements for an interpreter have been made where English is not the subjects first language. NAME OF RESEARCHER:_____________________________________________ 78 DATE:______________________________________________________________ SIGNATURE OF RESEARCHER:________________________________________ 79 APPENDIX III IKDC subjective questionnaire 80 81 82 83 84 85 Curriculum Vitae Education 1968 - 1981 Primary School and High School, Germany 1981 - 1986 Study of Physics, University of Heidelberg, Germany 1986 - 1992 Study of Medicine, University of Frankfurt, Germany 1993 Internship, Worms, Germany 1994 Internship, Johannesburg Hospital, South Africa 1995 – 1997 Basic Surgical Training (Plastic Surgery, Orthopaedic Surgery, General Surgery and Trauma Surgery), Johannesburg Hospital and Baragwanath Hospital, University of the Witwatersrand, South Africa 1997 – 2000 Higher surgical training in Orthopaedic Surgery, University of the Witwatersrand, Johannesburg, South Africa 2000 – 2001 Fellowship in Orthopaedic Sportsmedicine, Department of Orthopaedic Sports Medicine (Prof Imhoff), University of Technology, Munich, Germany Postgraduate Examinations 03/00 FRCS 11/01 German Board Specialist Examination in Orthopaedic Surgery Board certified 08/05 German Board Specialist Examination in Sports Medicine Board Certified 06/07 German Board Examination in Trauma Surgery Board Certified 12/09 PhD, CQ University, Rockhampton, Australia 86 Current Employment since 03/02: Consultant Orthopaedic Surgeon, Rockhampton Hospital, Australia 2004-2010 head of department 6/03 appointment as Senior Lecturer at the University of Queensland, Medical School, Brisbane, Australia 2/09 appointment as Associate Professor for Orthopaedic Surgery at the University of Queensland, Medical School, Brisbane, Australia since 06/03: Director of the Musculoskeletal Research Unit 6/03 appointment as Associate Professor at the Faculty of Health, Central Queensland University, Rockhampton, Australia 12/10 appointment as Professor for Biomechanics, CQ University, Rockhampton, Australia Publications (as per 12/10) Presentations at regional level 84 Presentations at national and international level 187 Invited Guest Lectures 21 Publications 23 Book Chapters 8 Books 4 Other Activities since 03/02 Head Team Physician of the Rockhampton Comets Rugby League Club 05/02 – 06/03 Member of Executive Committee of Sports Medicine Australia Central Queensland Branch since 10/03 appointment as “instructor” for postgraduate orthopaedic arthroscopic training by the Association of German Speaking Arthroscopists (AGA) 87 05/06 Team Physician of the Basketball Rockets Team, Rockhampton, Australia since 07/06 reviewer for the British Journal of Sports Medicine 05/07 – 12/08 reviewer for the Journal of Arthroscopy since 08/07 reviewer for the Journal of Orthopaedic Research 07/08 Team Physician for Tonga and medical adviser during the Rugby League World Cup 2008 09/06 – 12/09 examiner for the Intercollegiate MRCS examination for the English, Scottish and Irish Colleges of Surgeons since 01/09 Editorial Board Member, Journal of Arthroscopy 88


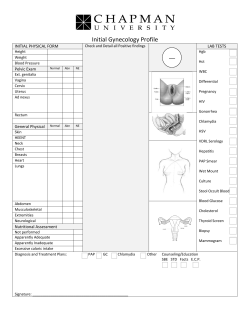


© Copyright 2026