
STRATEGIC PLAN, 2010–2014 Enhancing Industry Competitiveness KENYA SUGAR INDUSTRY
KENYA SUGAR INDUSTRY STRATEGIC PLAN, 2010–2014 Resource Mobilisation & Utilisation Implementation Strategy Monitoring Evaluation Reporting Enhancing Industry Competitiveness Strategic Plan, 2010-2014 i ii Kenya Sugar Industry Table of Contents Acronyms.......................................................................................................................ii Foreword.......................................................................................................................iv Acknowledgements.....................................................................................................v Executive Summary....................................................................................................vi Chapter 1: Introduction 1.1 1.2 1.3 1.4 1.5 Historical Background..............................................................................................................1 Importance of the Sugarcane Sector to the Economy................................................................2 Sugar industry Stakeholders......................................................................................................3 Scope of Services.......................................................................................................................4 Methodology............................................................................................................................4 Chapter 2: Kenya’s Development Agenda and Challenges..................................6 2.1 2.2 Attaining Vision 2030 . ............................................................................................................6 Trade Environment for Kenyan Sugar.......................................................................................8 Chapter 3: Review of the Strategic Plan 2004-2009............................................ 12 3.1 3.2 3.3 3.4 Strategic Objectives (2004-2009)............................................................................................12 Achievements..........................................................................................................................12 Lessons from Plan Implementation.........................................................................................21 Situational Analysis.................................................................................................................22 Chapter 4: Strategic Plan 2010-2014..................................................................... 24 4.1 4.2 4.3 4.4 4.5 Rationale for the 2010-2014 Strategic Plan.............................................................................24 Vision, Mission and Core Values of the Sugar industry...........................................................24 Analysis of Challenges along the Sugar industry Value Chain..................................................25 Strategic Goals (2010-2014)...................................................................................................26 Strategic Objectives (2010-2014)............................................................................................27 Chapter 5: Implementation Strategy and Resource Requirements................. 40 5.1 5.2 5.3 5.4 Implementation Strategy.........................................................................................................40 Resource Mobilisation and Utilisation.....................................................................................42 Accountability . ......................................................................................................................44 Implementation Risks.............................................................................................................44 Chapter 6: Monitoring, Evaluation and Reporting.............................................. 46 6.1 6.2 6.3 6.4 6.5 Monitoring ............................................................................................................................46 Evaluation . ............................................................................................................................46 Reporting . .............................................................................................................................47 Information Sharing ..............................................................................................................47 Conclusion ............................................................................................................................47 Annexes....................................................................................................................... 48 Strategic Plan, 2010-2014 iii Acronyms ACP AgGDP AIDS AMS BPO CDF CET CFC CIF COMESA CSR CSS CU EAC ERSWEC EU GDP GOK HIV ICT ISO KARI KECATRA KenGen KESGA KESMA KESREF KIRDI KPLC KRB KSB KSSCT LATF M&E MCI MDG MoA MoASP MoE MoF MoI MoLG MoR MoRDA iv African, Caribbean and Pacific Countries Agricultural Gross Domestic Product Acquired Immune Deficiency Syndrome Agricultural Management System Business Process Outsourcing Constituency Development Fund Common External Tariff Common Fund for Commodities Cost, Insurance and Freight Common Market for Eastern and Southern Africa Corporate Social Responsibility Customer Satisfaction Surveys Customs Union East African Community Economic Recovery Strategy for Wealth and Employment Creation European Union Gross Domestic Product Government of Kenya Human Immunodeficiency Virus Information and Communication Technology International Organisation for Standardization Kenya Agricultural Research Institute Kenya Cane Transporters Association Kenya Electricity Generating Company Kenya Sugar Growers Associations Kenya Sugar Manufacturers Association Kenya Sugar Research Foundation Kenya Industrial Research and Development Institute Kenya Power and Lighting Company Kenya Roads Board Kenya Sugar Board Kenya Society of Sugarcane Technologist Local Authority Transfer Fund Monitoring and Evaluation Millennium Cities Initiative Millennium Development Goals Ministry of Agriculture Ministry of Agriculture Strategic Plan Ministry of Energy Ministry of Finance Ministry of Industrialization Ministry of Local Government Ministry of Roads Ministry of Regional Development Authority Kenya Sugar Industry MoT MoWI MT MTER MTP NTB OGC OTE PESTLE PRSP PS RRA SACCO SDF SDL SMART SMARTEST STI SUCAM SWOT TARDA TCD TCH TNA USA VCC WTO Ministry of Trade Ministry of Water and Irrigation Metric Tonne Mid Term Evaluation and Review Medium Term Plan Non-Tariff Barriers Outgrowers companies Overall Time Efficiency Political, Economic, Social, Technological, Legal and Environment Poverty Reduction Strategy Paper Permanent Secretary Rural Roads Authority Savings and Credit Cooperatives Sugar Development Fund Sugar Development Levy Specific, Measurable, Attainable, Realistic, Timed Specific, Measurable, Attainable, Realistic, Timed, Engaging, Siring, Team Science, Technology and Innovation Sugar Campaign for Change Strengths, Weaknesses, Opportunities and Threats Tana and Athi Regional Development Authority Tonnes Crushed per Day Tonnes Crushed per Hour Training Needs Assessment United States of America Vale Columbia Center World Trade Organisation Strategic Plan, 2010-2014 v Foreword T he sugar industry is a major contributor to the agricultural sector which is the mainstay of the economy and supports livelihoods of at least 25% of the Kenyan population. The subsector accounts for about 15% of the agricultural GDP, is the dominant employer and source of livelihoods for most households in Western Kenya comprising Nyanza, Rift Valley and Western Provinces. In 2008/2009, the industry produced close to 520,000 tonnes of sugar operating at 56 percent of the installed capacity. The industry has the potential of producing over 1 million tonnes of sugar if operated at 89 percent of the installed capacity. This would meet the domestic needs, currently standing at about 700,000 tonnes, and provide a sustained surplus for export. By February 2012, the industry will begin operating under a liberalized trade regime after the COMESA safeguard measures lapse. In such environment, the industry will have to enhance its competitiveness along the entire value chain and reduce production costs by at least 39% to be in line with EAC partner states and COMESA sugar producing countries. At the moment, the industry is facing several challenges including capacity underutilization, lack of regular factory maintenance, poor transport infrastructure and weak corporate governance. Consequently, most factories have accumulated large debts amounting KSh. 58 billion. In the new Plan, the industry will require KSh 51.1 billion. KSh. 15.3 billion will be used to initiate power co-generation projects in various factories. KSh. 12.8 billion will be used to initiate ethanol production projects. The remaining KSh. 23 billion will be used to carry out other activities outlined in this Plan. As a matter of urgency, the Government through the Privatization Commission has appointed Transaction Advisors to work out the final details for the privatization of all publicly owned factories. Alongside the privatization, the Government will initiate a programme for financial restructuring of indebted public factories. This will be in addition to the continued Government support in the development of essential infrastructure such as roads, irrigation as well as basic research and extension. The 2010-2014 Kenya Sugar Industry Strategic Plan is intended to be the basis of facilitating the transformation required in the sugar subsector. It sets out the framework that will enable the industry achieve its vision of being ‘a world class multi-product sugarcane industry’ in the next five years. Despite the challenges the industry faces, this Plan underlines the industry’s commitment of being efficient, diversified and globally competitive. It is my hope that the objectives, strategies and activities recommended in this Plan will be implemented fully to revamp and resuscitate the sugar industry. I am therefore pleased to launch the Kenya Sugar Industry Strategic Plan 2010-2014. Hon. William S. Ruto, M.P, Minister for Agriculture vi Kenya Sugar Industry Acknowledgements T he formulation of the Kenya Sugar Industry Strategic Plan 2010-2014 comes at a time when the industry needs to rethink its direction as it approaches the liberalization of the sugar trade regime in 2012. The industry needs to find ways of repositioning itself competitively. This would require that the industry goes beyond sugar, think more about sugarcane as a whole and exploit market opportunities that the broader sugarcane industry provides. The sugar industry stakeholders have been at the forefront in championing for a better, efficient and diversified sugarcane industry. It was through their efforts that considerable achievements were realised in the outgoing plan. It was also due to their participation and concurrence that the formulation and preparation of the incoming Plan became possible. First, I wish to thank His Excellency the President of the Republic of Kenya, Hon. Mwai Kibaki, EGH, MP and the Right Honourable Prime Minister of the Republic of Kenya, Hon. Raila Amollo Odinga, MP for their unwavering support for the sugar sub-sector. I am also grateful for the Minister for Agriculture, Hon. William S. Ruto for his robust support and vision for the development of the sugar industry. Secondly, I would like to thank the Board members and management team of Kenya Sugar Board for their invaluable contributions in setting the agenda for the new Plan. Special thanks to Ms. Rosemary Mkok, Chief Executive Officer, Kenya Sugar Board and her management team for the leadership they provided in the preparation of this Strategic Plan. Thirdly, I wish to express my deepest gratitude and appreciation to all industry stakeholders for their active participation in the preparation of this Strategic Plan. Lastly, I thank Log Associates consultants for facilitating the review and preparation of this Plan. I am confident that this Strategic Plan will serve as the industry’s framework for decision making, planning, resource mobilisation and performance monitoring in the next five years. Thank you. Z. Okoth Obado Board Chairman, Kenya Sugar Board Strategic Plan, 2010-2014 vii Executive Summary I. Background The Kenyan sugarcane industry is a major employer and contributor to the national economy. Sugarcane is one of the most important crops in the economy alongside tea, coffee, horticulture and maize. By far, the largest contribution of the sugarcane industry is its silent contribution to the fabric of communities and rural economies in the sugar belts. Farm households and rural businesses depend on the injection of cash derived from the industry. The survival of small towns and market places is also dependent on the incomes from the same. The industry is intricately weaved into the rural economies of most areas in western Kenya. Besides the socio-economic contributions, the industry also provides raw materials for other industries such as bagasse for power co-generation and molasses for a wide range of industrial products including ethanol. Molasses is also a key ingredient in the manufacturing of various industrial products such as beverages, confectionery and pharmaceuticals. II. Methodology In preparing this Strategic Plan, the consultant adopted a participatory and collaborative approach and methodology comprising Literature Review, Key Informants Interviews (KII), Focused Group Discussions (FDGs) and Stakeholder Consultative Workshops. Consultations were held with industry stakeholders in structured discussions as well as personal interviews with key informants. The consultant also held a validation workshop and discussed the recommendations of the Draft Strategic Plan 2010-2014. The validation workshop was attended by board members and management team of the Kenya Sugar Board. III. Structure of the Report This Plan is set out in six chapters. After an introduction in chapter one, Kenya’s Development Agenda and Challenges is outlined in chapter two followed by a review of the 2004-2009 Strategic Plan in chapter three. The proposed Strategic Plan 2010-2014 is discussed in chapter four. Implementation Strategy and Resource Requirements is presented in chapter five. The document concludes with a discussion on Monitoring, Evaluation and Reporting in chapter six. IV. 2004-2009 Strategic Plan Review Findings A review of the 2004-2009 Strategic Plan showed that: 1. 2. 3. 4. viii The Plan goals of creating a world class sugar industry were ambitious and had not been realized, having been set at a time when the industry was still a high cost producer The consumption-production gap still persists and growing, delaying the industry’s goal of being a net exporter Yield levels declined from a modest yield level of 73 tonnes per hectare to about 70 tonnes per hectare over the last five years. Farmer support services provided by outgrower institutions and contractors were inadequate in quality and timeliness including seed cane, fertilizer supplies, and cane harvesting and transportation. Kenya Sugar Industry 5. 6. 7. 8. Most the factories, that are the backbone of the industry were struggling in debt and were unable to maintain effective crushing capacity, carry out routine maintenance and essential rehabilitation and pay farmers on time. Funding to the industry was inadequate to meet infrastructural development needs such as irrigation, roads, research and factories modernization The safeguards that were put in place to protect the industry including COMESA region quotas and taxes had many loopholes Governance in many of the industry institutions including outgrower institutions and publicly owned factories continued to be a big challenge Overall, even though the goals of the 2004-2009 Strategic Plan were ambitious, the Plan instrument assisted in getting the industry stakeholders to seek a common ground for the good of the industry. V. The 2010-2014 Strategic Plan Rationale for the Plan The Kenya Sugar Industry Strategic Plan for 2010-2014 provides a road map of how the industry intends to be a “world class multi-product sugarcane industry.” To enable the Government achieve its strategic objectives of being a middle-income country by the year 2030, this revised strategic plan aims at making the industry more efficient, diversified and globally competitive to contribute to the overall objective outlined in the Agricultural Sector Development Strategy (2009-2020) and the Kenya Vision 2030. The Plan provides a framework for setting goals, defining key actions, and mobilizing resources for funding programmes in the industry. It is a unifying instrument at the strategic level for industry stakeholders, who otherwise are autonomous operators. It lays the ground for enhanced performance of the sugar industry premised on a rational utilization of all resources in the sector. Vision The new vision for the industry is to be ‘a world-class multi-product sugarcane industry’. Mission The new mission of the industry is to ‘facilitate a multi-product sugarcane industry that is efficient, diversified and globally competitive’ through: enhanced industry’s competitiveness through cost reduction strategies and efficiency improvements, expanded product base, improved infrastructure and strengthened regulatory framework. Strategic Goals The formulation of this Plan came at a time when the industry needs to rethink its direction as it approaches the liberalization of the sugar trade regime in 2012. The industry needs to find ways of repositioning itself competitively. This would require that the industry goes beyond sugar, think more about sugarcane as a whole, and exploit market opportunities presented by multiple sugarcane products. This Plan will therefore put new pressure on the industry to find and invest resources in the new direction where the industry needs to go. In the light of the above, the 2010-2014 Strategic Plan is intended to seek a more limited but achievable set of goals. The stakeholders have identified and endorsed four strategic goals. 1. Enhancing Competitiveness in the industry in order to transform it to a leaner, lower cost industry that can take on its competitors through: Strategic Plan, 2010-2014 ix n n n n n Reduction in farm level risks Efficient, reliable harvesting and transport operations Effective, efficient, milling operations Enhanced human resource capacity Streamlined corporate governance 2. Expanding the product base to take advantage of opportunities created in the production process and increase factory profitability through value addition and product diversification by: n Initiating power co-generation projects n Initiating ethanol production projects n Producing industrial sugar and alcohol n Encouraging intensification to increase food security 3. Investing more in infrastructure by: n Improving road transport n Investing in irrigation n Investing in and promoting the use of ICT n Increasing funding in Research and Development n Modernisation of mills 4. Strengthening the policy, institutional and legal environment by: n Improving the management of the sugar import policy n Strengthening Corporate Governance n Finalising and implementing the Sugar Regulations n Finalising the implementation of the privatisation programme n Establishing a coordination mechanism for roads maintenance in the sugar zones n Supporting measures to develop a comprehensive policy on co-generations and exploitation of bio-fuels and other sugarcane products VI. Implementation Strategy and Resource Requirements Reporting the progress of implementation will be critical in adjusting strategic directions and measuring performance. Progress reports will be made on quarterly basis. The reports will outline in summary form projected targets, achievements, facilitating factors and challenges. The reports will be prepared and submitted by UCs to the SRF where a summary report will be prepared and submitted to the MC for review. Issues that will require policy interventions will be forwarded to the NICC through the KSB Board. x Kenya Sugar Industry Chapter 1 Introduction 1.1 Historical Background Industrial sugarcane farming was introduced in Kenya in 1902. The first sugarcane factory was set-up at Miwani 10km north of Kisumu in 1922 and later at Ramisi in the Coast Province in 1927. After independence, the Government explicitly expanded its vision of the role and importance of the sugar industry as set out in Sessional Paper No 10 of 1965 which sought, inter alia, to: n Accelerate socio-economic development n Redress regional economic imbalances n Promote indigenous entrepreneurship n Promote foreign investment through joint ventures In pursuit of the above goals, the Government established five additional factories in the 1960s and 1970s: Muhoroni (1966), Chemelil (1968), Mumias (1973), Nzoia (1978), and South Nyanza (1979). Later, several more were to come on stream: West Kenya (1981), Soin Sugar Factory (2006) and Kibos Sugar & Allied Industries (2007), bringing the total number of milling companies to ten (10). The two older factories ceased operations: Ramisi sugar factory collapsed in 1988 and Miwani sugar factory was put under receivership. The establishment of the publicly owned factories was predicated on the need to: n Achieve self sufficiency in sugar with a surplus for export in a globally competitive market n Generate gainful employment and create wealth n Supply raw material for sugar related industries n Promote economic development in the rural economy and beyond through activities linked to the sugar industry In support of the above goals, the Government invested heavily in sugar factories, holding about 83% of the equity, later reduced to 70% after it divested 36% of its interest in Mumias Sugar Company. These resource injections into the subsector were in addition to the resources from the Sugar Development Fund (SDF), set up in 1992, that has contributed about KSh. 11 billion into the industry for cane development, factory rehabilitation, research and infrastructure development. These investments did not, however, help achieve the self-sufficiency in sugar as consumption continued to outstrip production. Total sugar production grew from 368,970 tonnes in 1984 to 520,000 tonnes in 2008 leaving Kenya a net importer of sugar with imports rising from 4,000 to 220,000 tonnes over the same period. The deficit is being met through imports from the COMESA region and other sugar producing countries including Brazil, United Kingdom and Mexico. Figure 1.1 shows production and consumption status since 2001. In 2003, the Government set up a Task Force on the Sugar Industry Crisis1 whose objective was to examine the problems facing the sugar subsector and make recommendations for revitalizing the industry. 1 Otherwise known as the Amayo Task Force Report dated 1st July 2003 Strategic Plan, 2010-2014 1 Following the Task Force’s recommendations, the Government made the following decisions: (a) Made changes in the management of all publicly owned milling companies with a view to improving corporate governance (b) Reduced lending rates on SDF loans from 10% to 5% (c) Wrote off KSh. 4.7 billion on accrued interest and penalties on SDF loans (d) Disbursed KSh. 800 million towards settling arrears owed by milling companies to farmers (e) Increased research funding from the Sugar Development Levy by (SDL) doubling the allocation from 0.5% to 1% (f ) Successfully negotiated for a four-year COMESA safeguard to give the industry time to restructure and become globally competitive 80 Tonnes (x10000) 60 40 20 0 2001 2002 2003 2004 2005 2006 2007 2008 Year Production Consumption Imports Exports Fig. 1.1: Sugar Production, Consumption, Imports and Exports Trends Concurrent with the structural reforms the Government was implementing, the industry continued to expand its processing capacity: Kenya Sugar Board (KSB) registered three new mill white sugar factories, namely: Butali, Kwale International Sugar Co. Ltd and Trans Mara Sugar Companies with a combined potential capacity of 5,000 TCD. It is also expected that an additional mill would be established in the Tana River basin, with a potential capacity of 9,000 TCD. With the operationalisation of these new factories and the upgrading of the existing mills, the industry’s capacity would be close to 38,000 TCD, which would result in a production of about 1 million tonnes of sugar per annum. Apart from the regular sugar mills, there are four licensed and operational jaggery millers, namely: Lubao, Shajanand, Farm Industries and Homa Lime Jaggeries, who have a combined capacity of about 300 TCD. There are also in excess of three hundred informal and mostly mobile jaggeries, each of which crushes between 3-35 tonnes of sugarcane per day. 1.2 Importance of the Sugarcane Sector to the Economy The Kenyan sugarcane industry is a major employer and contributor to the national economy. It is one of the most important crops alongside tea, coffee, horticulture and maize. Currently, the industry directly supports approximately 250,000 small-scale farmers who supply over 92 percent of the cane milled by the sugar companies. An estimated six million Kenyans derive their livelihoods directly or 2 Kenya Sugar Industry indirectly from the industry. In 2008, the industry employed about 500,000 people directly or indirectly in the sugarcane business chain from production to consumption. In addition, the industry saves Kenya in excess of USD 250 million (about KSh. 19.3 billion) in foreign exchange annually and contributes tax revenues to the exchequer (VAT, Corporate Tax, personal income taxes, cess). In the sugarbelt zones, the sugar industry contributes to infrastructure development through road construction and maintenance; construction of bridges; and to social amenities such as education, health, sports and recreation facilities2,3. The sugarcane industry provides raw materials for other industries such as bagasse for power cogeneration and molasses for a wide range of industrial products including ethanol. Molasses is also a key ingredient in the manufacturing of various industrial products such as beverages, confectionery and pharmaceuticals. By far, the largest contribution of the industry is its silent contributions to the fabric of communities and rural economies in the sugarcane belt. Farm households and rural businesses depend on the injection of cash derived from sugarcane. The survival of small towns and market places is also dependent on the incomes from the same. The industry is intricately weaved into the rural economies of most areas in Western Kenya. 1.3 Sugar industry Stakeholders The Kenya Sugar industry has a wide range of stakeholders, each with a role to play. (i) The Government of Kenya (GoK) The Government of Kenya (GoK) through the Ministry of Agriculture (MoA) has the overall responsibility for the industry’s development. The GoK has a role of supporting the industry through regulation, enhancement of competition and fairplay, and provision of an enabling environment for all stakeholders. Currently, the GoK is the largest shareholder in the industry. (ii) The Kenya Sugar Board (KSB) The Kenya Sugar Board (KSB) is a public body set up by the Sugar Act, 2001, under the Ministry of Agriculture. The Board is mandated to: i. Regulate, develop and promote the sugar industry ii. Co-ordinate the activities of individuals and organisations in the industry iii. Facilitate equitable access to the benefits and resources of the industry by all interested parties (iii) Kenya Sugar Research Foundation (KESREF) The Kenya Sugar Research Foundation (KESREF) established in 2001, is the scientific wing of the industry mandated to develop and transfer appropriate technology in the sugar sub-sector. It also carries out socio-economic studies to enhance the development of sugar as a commercial business. The Foundation is funded mainly through grants from the Sugar Development Fund (SDF). It has its headquarters in Kibos, Kisumu with sub-stations in Mumias, Mtwapa and Opapo. 2 3 Bracing for COMESA: Kenyan Sugar industry, Mumias Sugar Company Bulletin 2008 Kenya Sugar Board Strategic Plan (2008-2012) and Year Book of Statistics (2008) Strategic Plan, 2010-2014 3 (iv) Cane Growers/Outgrower Institutions Sugarcane farmers (outgrowers) supply 92% of the cane milled. A large number of institutions including Outgrower Institutions, Societies, Unions and SACCOs represent these farmers. The role of these institutions is to promote, represent and protect the interest of the farmers. The institutions operate under the Kenya Sugarcane Growers Association (KESGA). (v) Cane Transporters Cane transporters are responsible for provision of cane transportation services in the industry. Transporters operate under the Kenya Cane Transporters Association (KECATRA). (vi) Millers/Jaggeries The role of the millers is to make fair return on investment through efficient operation of the sugar mills or jaggeries for the production of sugar and other products for sale and making timely payments to cane growers. The millers operate under an apex institution known as the Kenya Sugar Manufacturers Association (KESMA). Millers are a critical node in the sugarcane industry because of the role they play in value addition. The profitability and hence strength of the industry depends on how efficiently they operate. (vii) Other Industry Stakeholders Other industry stakeholders include: n Importers n Financial institutions n Consumers n Special interest groups • Kenya Society of Sugarcane Technologist (KSSCT) • Sugar Campaign for Change (SUCAM) 1.4 Scope of Services The scope of services outlined in the Terms of Reference for the preparation of the 2010-2014 Strategic Plan, were as follows: i. Review the current strategic plan and other relevant documentation which shall include, but not limited to the National Vision 2030; the Ministry of Agriculture Strategic Plan 20062010; the Sugar Act 2001; Guidelines for the preparation of strategic plans 2008-2010 from the office of the Prime Minister, Ministry of State for Planning, National Development and Vision 2030; and prepare a critique of issues for consideration ii. Conduct a stakeholders’ workshop to collect views on possible amendment to the current document iii. Arising from (1) and (2) above, prepare a draft industry strategic plan 2010-2014 iv. Conduct a workshop for the Board and Management Team to take them through the draft industry strategic plan 2010-2014 v. Prepare a final draft to be presented to the Board, Management Team and sugar stakeholders vi. Prepare and present the final document 1.5 Methodology In reviewing the strategic plan, the consultant adopted a participatory and collaborative approach comprising Literature Review, Key Informant Interviews (KII), Focused Group Discussions (FDGs) and Stakeholder Consultative Workshops. 4 Kenya Sugar Industry 1.5.1 Literature Review The consultant reviewed a wide range of published materials and documents in the course of the assignment, including: i. Kenya Sugar Industry Strategic Plan (2004-2009) ii. Kenya Sugar Board Strategic Plan (2008-2012) iii. Kenya Vision 2030, A Globally Competitive and Prosperous Kenya iv. Sessional Paper of 2008 on Revitalisation of Sugar industry (March 2008) v. Agriculture Sector Development Strategy (2009-2020) vi. Economic Recovery Strategy for Wealth and Employment Creation vii. Report of the Task Force on Sugar industry Crisis, 1st July 2003 viii. Guidelines for Preparation of Vision 2030 based Strategic Plans ix. Report on Cost of Cane and Sugar Production (KSB, 2006, 2007) x. Year Book of Sugar Statistics (KSB, 2008) xi. Kenya Sugar industry Report (EPZA, 2005) xii. Working Papers (Millennium Cities Initiative & Vale Columbia Center, 2008) xiii. National Policy on Sugar industry (GoK, April 2001) xiv. National Sugar Conference Report (October, 2004) xv. Economic Governance Reform in the Sugar Subsector (February, 2005) xvi. Energy Act, 2006 xvii. Various internet sources 1.5.2 Stakeholder Consultative Workshops The consultant held two stakeholder consultative workshops in Kisumu. The first workshop was held on 21 and 22 May 2009. The second workshop was held on 17 June 2009. The workshops’ participants comprised representatives of Outgrower Institutions (OGIs), Millers, Transporters, Cane Researchers, Universities, Ministry of Agriculture, KESREF and Kenya Sugar Board. These workshops were used as discussion forums to gather information on key issues affecting the industry and the way forward. 1.5.3 Debriefing Workshops The consultant conducted three debriefing workshops. The first workshop was held on 10 July 2009 with the management team of the Kenya Sugar Board. The second and third workshops were held on 27 July 2009 and 14 August 2009 respectively with the Board and Management Team of KSB. The comments and suggestions from the three debriefing workshops have been incorporated in this report. Strategic Plan, 2010-2014 5 Chapter 2 Kenya’s Development Agenda and Challenges 2.1 Attaining Vision 2030 Kenya’s medium and long-term development agenda is set out in the Kenya Vision 2030. The Vision is built on the foundation of the Economic Recovery Strategy for Wealth and Employment Creation (ERWEC) 2003-2007. It is the country’s new development blueprint covering the period 2008-2030. The vision aims to transform Kenya into a newly industrialising, middle-income country providing a high quality life to all its citizens in a clean and secure environment by the year 2030. The Vision is also expected to be a major vehicle for the realisation of the Millennium Development Goals (MDGs). The vision is based on three pillars: the economic, the social and the political. These pillars are anchored on macroeconomic stability; continuity in governance reforms; enhanced equity and wealth creation opportunities for the poor; infrastructure; energy; science, technology and innovation (STI); land reform; human resources development; security as well as public sector reforms. The sugar industry will contribute to the attainment of three pillars through various interventions discussed below: 2.1.1 Economic Pillar The economic pillar aims to attain an average Gross Domestic Product (GDP) growth rate of ten per cent (10 %) per annum and sustain it to 2030. The programs envisaged to move the economy up the value chain are tourism, agriculture, wholesale and retail trade, manufacturing, business process outsourcing and financial services. The sugarcane industry will play a key role in the attainment of the goals set for the programmes in agriculture and manufacturing; and to benefit substantially from programmes envisaged in the wholesale and retail, and financial services programmes. Agricultural Sector: The sugarcane industry already accounts for about 15% of agricultural GDP. In the Vision 2030, Kenya aims to build an agricultural sector that is innovative, business oriented and modern through: n n n n n Transforming key institutions to promote agricultural growth Increasing productivity in the sector Land policy and land use reforms Expanding irrigation in arid and semi-arid lands Improving market access for smallholders through better supply chain management To realise the above objectives, the Vision has identified seven flagship projects for implementation by the year 2012. Three of the projects that are relevant to the sugar subsector include irrigation development along the Tana River Basin; development and implementation of a 3-tiered fertilizer cost reduction programme; and development of an Agriculture land use Master Plan. 6 Kenya Sugar Industry Wholesale and Retail Trade: The 2030 vision for wholesale and retail trade is to move towards greater efficiency in the country’s marketing system by lowering transaction costs through institutional reforms. This involves strengthening informal trade (through investment in infrastructure, training and linking it to wider local and global markets). This is expected to raise the market share of products (including sugar and co-products) sold through normal channels such as supermarkets from 5% to 30% by 2012. The envisaged flagship projects such as creation of wholesale hubs, building of retail markets and a free trade port are market opportunities that will be exploited by the sugar industry in the incoming planning period. Manufacturing Sector: Kenya aims to have a robust, diversified and competitive manufacturing sector through: Restructuring local industries that use local materials but are currently uncompetitive e.g sugar and paper manufacturing n Exploiting opportunities in value addition to local agricultural produce n Adding value to intermediate imports n With fuller exploitation of forward linkages in the value chain, the industry has an opportunity to increase significantly its contribution to the manufacturing sector. Financial Sector: The 2030 vision for financial services is to create a vibrant and globally competitive financial sector in Kenya. The sector is expected to create jobs and promote high levels of savings to finance investment needs. One of the most urgent steps towards creating a competitive financial environment in Kenya is introducing legal and institutional reforms that will enhance transparency in all transactions, build trust and make enforcement of justice more efficient. This will be achieved by: n n n n n Undertaking legal and institutional reforms to make Kenya more competitive as a financial centre Consolidation of banks to make them larger and stronger Introduction of credit referencing Strengthening informal and micro-finance institutions and SACCOs Deepening financial markets by raising institutional capital through pension funds, expanding bond and equity markets as well as tapping external sources of capital The reforms are also expected to strengthen the regulatory and oversight authority which in turn will help increase investor confidence in the economy and thus increase investment opportunities in the sugarcane sector as well. Increased investment in the sector will lead to higher production of sugar and co-products, which will then contribute to the realisation of the envisaged 10% GDP growth rate. To fully utilize the potential in the sugarcane industry, some essential reforms have been identified in the Agricultural Sector Development Strategy 2009-2020 to complement the broad reforms envisaged under Vision 2030, these include: Land reforms to reduce inequality and increase intensification Improving efficiencies in the supply chain e.g. enhancing access to input markets, raising cane yields, reducing post-harvest losses and upgrading factory capacity n Increasing access to credit facilities particularly for farmers n Increasing value addition by more processing and product diversification n Strengthening corporate governance in the sugarcane industry n n Strategic Plan, 2010-2014 7 2.1.2 Social Pillar The social component addresses issues of equity and social justice; national cohesion, security and environmental concerns. It lays great emphasis on the development of education and training, better healthcare, improved water and sanitation, sustainable and better environmental management as well as vital national attention to gender equity, youth, vulnerable groups, housing, and poverty reduction. Developments envisaged in the social pillar will be important in providing opportunities for social safety nets and greater mobility in the social space. The sugar industry will contribute significantly to the social development through provision of employment opportunities and wealth creation in the rural areas of Kenya. As a social tool, a vibrant sugar industry will act as a catalyst for raising the standards of living in various rural households through direct and indirect incomes. The sugar industry will also contribute to the realisation of the goals of the social pillar through its corporate responsibility activities in health, education, water and sanitation, and recreation activities. 2.1.3 Political Pillar The political component aims to realise a democratic political system predicated on greater economic and political devolution, respect for the rule of law, and protection of rights and freedoms for all citizens. Under this component, Kenya’s development agenda is to improve accountability, reduce impunity and begin the real fight against corruption, and thus promote efficiency in the governance and management of public affairs. Good corporate governance in the sugar industry is essential in order to create a climate of fairness, transparency and accountability especially now when major decisions are needed to make the industry leaner, efficient and more competitive. 2.2 Trade Environment for Kenyan Sugar 2.2.1 Global Trade Environment and Obligations In the last two decades, the world has witnessed rapid economic growth and expansion of trade, driven primarily by emerging Asian Tiger economies. The rapid and continued strong growth in China and India will further put upward pressure on prices of crude oil. This will continue to cause major challenges to Kenya’s sugar industry that is significantly dependent on fossil fuel for cane transportation. In addition, there is evidence to suggest that financial market challenges in the United States of America (USA) and Europe, are affecting global markets thus impacting negatively on Kenya’s trade performance in goods and services. The overall effect of the credit crunch will be felt in terms of reduced purchasing power of foreign buyers of Kenyan goods, and lower domestic access to credit, grants, and donor support. Capital markets will also be more concerned at the likely impact of reducing global trade flows on the creditworthiness of countries like Kenya. The European Commission (EU) trading block, despite cutting prices by 36%, will still be an attractive sugar export destination. At an average price of 22 cents per pound, the EU price is still 4 cents above the open trade price. International competition from low cost sugar producers is a big challenge to the local sugar industry. The average cost of sugar production in 2006/07 in Kenya was KSh. 42,192 (USD 680) per tonne. The world average cost of production for the same is USD 263 per tonne. As a result, importers view Kenya as an attractive market. Kenya needs to bring its cost structure, 8 Kenya Sugar Industry productivity and quality control to levels comparable to those of its competitors in order to exploit the opportunities availed by the global market. Kenya’s is a signatory to World Trade Organization (WTO), the Cotonou Partnership Agreements (ACP-EU), COMESA Free Trade Agreement and the East African Community Customs Union. Sugar imports and exports are affected by what happens in these trade regimes. 2.2.2 COMESA and East African Community Customs Union Obligations Table 2.1: COMESA Import Quota The Kenyan sugar industry is protected by COMESA safeguard measures. The safeguards were first granted in 2004 and were to expire in February 2008. Despite the remarkable progress made during the safeguard period, the industry was not ready for an open trade regime in sugar. Kenya therefore sought and was granted an additional four years of protection from March 2008 to February 2012, with a declining tariff and an increasing quota (Table 2.1). Year Quota (tonnes) Tariff Rate (%) 2008/09 220,000 100 2009/10 260,000 70 2010-2014/11 300,000 40 2011/12 340,000 10 Open market 0 1 March 2012 The extension was granted subject to certain conditions, including: i. ii. iii. iv. v. vi. vii. Rising sugar import quota in tandem with a declining tariff as shown in Table 2.1 The Government adopts a privatization plan within the first 12 months and takes verifiable steps to privatize the remaining publicly owned factories by 2011 The industry to implement cane payment system based on sucrose content instead of weight The Government adopts an energy policy aimed at promoting co-generation and other forms of bio-fuel production that will contribute to making the industry more competitive Kenya Sugar Board (KSB) to increase funding for research on high yielding and early maturing varieties and spearhead its dissemination by farmers The Government to increase funding for road infrastructure The Government to submit twice yearly performance reports to the COMESA Council on all measures, activities and improvements on the sugar sector’s competitiveness Sugar prices in Kenya need to drop by at least 39% to be in line with COMESA levels. Such a price drop in less than 3 years is drastic and requires major cost reduction strategies for the industry. Although there are eight sugar mills in production, industry sources indicate that only West Kenya, Mumias and Kibos & Allied Industries would survive if the safeguards were to be lifted now because they can produce sugar at costs similar to other COMESA countries. These factories are equipped with modern facilities that can process sugarcane efficiently4. 4 KSB (2008), Cost of Cane and Sugar Production and Personal Interviews Strategic Plan, 2010-2014 9 Table 2.2: Cost of Sugar Production in COMESA and Selected EAC countries Country Cost USD/ tonne Kenya 415-500 Sudan 250-340 Egypt 250-300 Swaziland 250-300 Zambia 230-260 Malawi 200-230 Uganda 140-180 Tanzania 180-190 While Tanzania is not a member of COMESA, Uganda is not a signatory to the COMESA Free Trade Agreement. Consequently, the two countries can and do import sugar from outside COMESA. These sugars find their way into Kenya through Informal Cross Border Trade (ICBT), which poses an unfair competition to the local sugar producers. Similar problems also occur through transhipment of sugar via other COMESA countries (such as Egypt) from nonCOMESA countries (such as Brazil). The East African Community (EAC) commenced implementation of a common customs union in 2005. The Customs Union encompasses the removal of internal tariffs, application of a Common External Tariff (CET) and elimination of Non-tariff barriers (NTB). The CET applies zero tariff rates for raw materials, 10% for intermediate goods and 25% for finished products. Whilst this is a welcome move, it is worth noting that within the EAC, the cost of sugar production is lowest in Uganda followed by Tanzania then Kenya. The practical consequence is that even within the EAC; a duty free movement of sugar would imply that Uganda and Tanzania producers would pose a challenge to their Kenyan counterparts. The EAC Customs Union also include Burundi and Rwanda who are also members of the EAC. Ultimately, the custom union might include Southern Sudan and the Democratic Republic of the Congo in future. Therefore, it is necessary that domestic production be more efficient and competitive and internal prices be realigned with regional levels for the industry is to survive the anticipated regional sugar trade liberalization. 2.2.3 National Challenges The country is facing a monumental task of overcoming poverty: 56% of the population lives below the poverty line; an unemployment rate in excess of 40%, compounded by an increasing number of youths leaving school who are looking for white-collar jobs. These problems are exacerbated by high inequality in income and asset distribution and a deteriorating gender inequality. The pressure to create jobs in the economy is therefore very high and the sugar industry is expected to play a significant role. These adverse trends have led to considerable disparities in development among the different regions of the country, which is posing a serious challenge to national cohesion and development. In addition, insecurity in neighbouring Somalia coupled with homegrown criminality, including the emergence of organized gangs and militia and availability of illegal firearms have combined to create an adverse investment climate and have put considerable pressure on state resources. 10 Kenya Sugar Industry The state of infrastructure is unsatisfactory in terms of adequacy and quality because of years of deferred maintenance. Roads in particular, require a major effort for rehabilitation and maintenance; irrigation infrastructure has stagnated at very low levels since the 1970s – the share of irrigated agricultural output is less than 10% of AgGDP. The limited use of irrigation has increased farm level risks and hindered a sustainable increase in yields. The infrastructure problems are likely to persist unless there is a clear plan and programme of implementation over the medium and long-term. For the sugar industry, the process of seeking to build a competitive industry will be impeded by an inadequate and poor quality infrastructure. Corporate governance has been a challenge for the industry for a long time. The sugar industry needs to transform itself to profitability and efficiency path through sound management practices. There is need to develop and implement policies that would ensure that the principles of good governance are instituted and maintained. This would ensure competitiveness, transparency, accountability and sustainability of the industry. Land is an important factor of production as it provides the foundation for all other activities such as agriculture, water, settlement, tourism, wildlife and forestry, and infrastructural activities. However, over the years, administration and management of land has been a challenge due to lack of a comprehensive land tenure policy. This has led to fragmentation of land into small and uneconomic land units. Small land sizes has led to strong competition for land between food crops and sugarcane, which has increased food insecurity. The agricultural sector is developing a National Land Use Policy and Master Plan, which will provide guidelines regarding the use of land. Development projects recommended under Vision 2030 will increase demand on Kenya’s energy supply. Currently, Kenya’s energy costs are higher than those of her competitors. Kenya must, therefore, generate more energy at a lower cost and increase efficiency in energy consumption. To help meet the energy needs, the industry will invest in co-generation with the aim of selling surplus power to the national grid. Strategic Plan, 2010-2014 11 Chapter 3 Review of the Strategic Plan 2004-2009 3.1 Strategic Objectives (2004-2009) To turn around the sugar industry, the outgoing Plan identified nine (9) Strategic objectives for implementation during the period 2004-2009. These objectives and actions are presented in Annex I. 3.2 Achievements A review of the outgoing Plan revealed that the level of implementation of activities was only about 30% of what was intended, many of the activities are work-in progress. The poor implementation of the plan was attributed to the fact that the objectives were way too ambitious, not SMART5 hence extremely difficult to implement and monitor. Implementation of some activities was delayed by lack of funds. 3.2.1 Attainment of the Mission The Kenya Sugar Industry Strategic Plan (2004-2009) set out the mission of the industry as to: “consistently achieve self-sufficiency and capacity for export of sugar and related products through implementation of competitive global industry best practices.” However, this mission was not achieved during the Plan period. The industry is still a net exporter. The goal of being globally competitive is still a dream because the industry did not implement the structural measures that would have brought down costs and increased its competitiveness. But of great concern, is the focus on sugar and self-sufficiency without regard to profitability and efficiency. It became clear that the sugar industry could not simultaneously seek self-sufficiency and global competitiveness. As illustrated by the COMESA conditionality for granting an extension of its safeguards, the industry needs to become competitive through major structural changes. This calls for a review of the mission. 3.2.2 Analysis of the Sugar Industry Performance (2004-2009) I. Increased Sugarcane Production and Productivity Area under Cane Area under cane grew from 131,507 hectares in 2004 to 169,421 hectares in 2008 (Fig 3.1), representing an increase of 28.8%. The increase in cane area was attributed to the addition of Kibos and Soin Sugar Zones as new cane areas. Additionally, apart from SONY Sugar Company and Miwani, all the other companies increased areas under cane. Most of the increase was from the West Kenya zone, which rose by 198.2% (Table 3.1) 5 12 Specific, Measurable, Attainable, Realistic, Timed Kenya Sugar Industry 169,421 Area under cane (Ha) 158,568 147,730 144,765 131,507 122,580 126,826 117,131 2001 2002 2003 Fig. 3.1: Area under Cane (2001-2008) 6 2004 2005 2006 2007 2008 Year Source: Year Book of Sugar Statistics, KSB, 2008 Table 3.1: Area under Cane Year Company Chemelil Muhoroni Mumias (+Busia Zone) Nzoia SONY Miwani Kibos West Kenya Soin Total 2004 2008 Ha 10,219 11,146 56,792 19,449 20,941 5,560 7,400 131,507 Ha 13,341 14,259 64,637 23,899 19,322 4,633 2,622 22,070 4,638 169,421 Increase/ Decrease Ha 3,122 3,113 7,845 4,450 -1,619 -927 2,622 14,670 4,638 37,914 Increase/ (Decrease) % 30.6 27.9 13.8 22.9 (7.7) (16.7) New zone 198.2 New zone 28.8 Source: Year Book of Sugar Statistics, KSB, 2008 Cane Varieties In 2008, cane variety CO 945 occupied 35.72% of the total area under cane. Varieties CO 421, CO 617 and N14 occupied 28.4%, 13.29%, 10.95% of the total area respectively. KESREF developed four new cane varieties (KEN 82-062, KEN 82-472, EAK 73-335 and D8484) in 2007. However, the area under cane for Kenyan bred varieties remained just under 5% of the gross area. The slow adoption rate to Kenyan varieties is attributed to inefficient factory utilisation capacity that translates into delayed harvesting which raises the risks to the farmers, and to some extent weak research-extension-farmer linkages. Most farmers do not want to adopt early maturing cane varieties because they deteriorate faster and the factories do not have the capacity to harvest in good time. 6 Source: Kenya Sugar Board Strategic Plan (2008-2012), Year Book of Sugar Statistics Strategic Plan, 2010-2014 13 Area Harvested, Cane Deliveries and Cane Yields Area Harvested: Total area harvested in the nucleus estates and the outgrower farms was 54,465 hectares in 2008 compared to 54,191 hectares in 2004, indicating an increase of 0.51%. This does not however include the area harvested by non-contracted farmers. The mean area harvested over the entire planning period was 38.9% of the total area with a standard deviation of ±3.4. The largest area harvested was recorded in 2007 (Fig. 3.2). However, the best industry average was achieved in 2002, when 42.6% of the area under cane was harvested. 75 Average yield (Tonnes/Ha) 73 71 69 67 65 63 2001 2002 2003 2004 2005 2006 2007 2008 Year Fig. 3.2: Area Harvested (2001-2008) 7 Cane Deliveries: Total cane deliveries for the year 2008 were 5,125,821 tonnes against 4,660,995 tonnes in 2004, representing a cane supply increase of approximately 10% over the planning period. The best supply was recorded in 2007 at 5,204,214. The decrease in cane supply in 2008 was attributed to poor rains, post election related violence including a spike in cane burning cases which affected operations at the farm, transportation and factory levels. Cane Yields: The average cane yield for the year 2008 was 72.9 TC/Ha against 73.8 TC/Ha in 2004 representing a decrease of 1.2% (Fig. 3.3). The mean yield for the entire planning period was 70.4 TC/Ha with a standard deviation of ±3.1. Highest cane yields were recorded in SONY sugar belt (five-year average, 86.0TC/Ha) followed by Nzoia Sugar company (five-year average, 83.6TC/Ha) then Mumias Sugar Company (five year average, 70.9TC/Ha). Lowest yields were recorded in Chemelil (five-year average, 60.3TC/Ha). The challenge remains in respect of raising cane yields. 7 14 Source: Kenya Sugar Board Strategic Plan (2008-2012), Year Book of Sugar Statistics Kenya Sugar Industry Thousands 61 59 Harvested area (Ha) 57 55 53 51 49 47 2001 2002 2003 2004 2005 2006 2007 2008 Year Fig. 3.3: Average Yield, Tonnes/Ha8 Future Outlook for the Sugar industry: According to the mini-survey conducted in January 2009, it was revealed that all zones except West Kenya and Kibos have “excess” cane. The industry is projected to produce 8,146,913 tonnes against a consumption of 6,377,453 tonnes leaving an “excess” of 1,769,560 tonnes (28%) II. Increased Sugar Production Cane Crushed, Sugar Made and Recoveries In 2008, a total of 5,165,786 tonnes of cane was crushed at a sugar recovery rate of 10.03% to make 518,026 tonnes of sugar. In 2004, a total of 4,805,887 tonnes of cane was milled to make 512,835 tonnes of sugar, giving a recovery rate of 10.67. Some sugar factories such as Chemelil and Muhoroni are still recording sugar recoveries below the industry standard of 10.1%. The industry’s long-term target is to achieve recovery levels of 11.5%. Quality of sugarcane crushed deteriorated during the outgoing planning period. In 2008, the weighted average pole % cane as a measure of cane quality reduced to 12.7% from 13.2% in 2004 (Fig.3.4). This was still lower than the industry’s long-term target of 13.50%. The average fibre % cane rose to 17.72% from 17.46% in 2004 (Fig.3.4). The long-term industry’s target for fibre is 15.50%. 8 Source: Year Book of Sugar Statistics, KSB, 2008 Strategic Plan, 2010-2014 15 19.0 18.0 Cane quality (%) 17.0 16.0 15.0 14.0 13.0 12.0 2001 2002 2003 2004 2005 2006 2007 2008 Year Pol % cane Fig. 3.4: Cane Quality (2001-2008)9 Time Account Fibre % cane Hundreds During the outgoing planning period, the total gross time available for grinding was 70,112 hours. The actual hours used for grinding over the same period was 40,188 hours representing 57.3% of the gross grinding time. The industry grinding time standard deviation was computed as±417.5 hours (±4.8%). Figure 3.5 shows account of the factory time within the planning period under review. 95 85 Time (Hours) 75 65 55 45 35 2001 2002 2003 2004 2005 2006 2007 Year Gross grinding time 9 10 16 Fig. 3.5: Factory Time Account10 Source: Year Book of Sugar Statistics, KSB, 2008 Source: Year Book of Sugar Statistics, KSB, 2008 Kenya Sugar Industry Actual grinding time 2008 Causes of time losses: i. ii. Lack of cane resulting mostly from delays in harvesting and transportation Frequent factories’ breakdowns due to lack of maintenance Based on the above, none of the sugar factories met the standard for Factory Time Efficiency (FTE) of 92%. Additionally, all the sugar factories with the exception of Mumias Sugar Company, failed to meet the industry’s standard of Overall Time Efficiency (OTE) of 82%. Capacity Utilisation The combined installed capacity of sugar factories in the country is 24,040 TCD. This could produce about 883,691 tonnes of sugar per year. However, during the planning period, the average capacity utilised was 13,522.50TCD (56.25%), and even though this was a modest increase over the previous period, it is still far below optimal (Fig. 3.6). The decline in capacity utilisation needs to be addressed first before expensive options such as capacity expansion are sought. Capacity utilisation (%) 70 65 60 55 50 45 2001 2002 2003 2004 2005 2006 2007 2008 Year Fig. 3.6: Average Factories’ Capacity Utilization (2001-2008)11 Future Outlook for the Sugar industry: The excess cane in the sugar industry has been occasioned mainly by inefficiency in the utilization of the milling capacity which currently stands at 56.25%. Stakeholders’ Concern: ‘Why can’t KSB address the issue of the factories’ inability to crush existing cane? 11 Source: Year Book of Sugar Statistics, KSB, 2008 Strategic Plan, 2010-2014 17 III. Expanded Product Base Very little was achieved under this strategic direction. Plans for expanding the product base were largely tentative. Partly because the industry was beset with debts and pressing demand for factory rehabilitation. The industry also lacked a comprehensive legislation to undertake the same. During the outgoing planning period, Mumias Sugar Company was the exception, having launched a co-generation plant to generate electricity to supply the national grid. Some sugar factories such as Muhoroni, despite their indebtedness, were giving out bagasse freely to small business entrepreneurs for the production of briquettes and soft boards. Currently, no feasibility study has been carried out on the production of ethanol and other cane products. Industry records indicate that production of power alcohol was undertaken for sometime at the Agro-Chemical and Food Company for blending with petrol. This programme could not be sustained because there was no policy and legal framework to regulate its use. In addition, there was resistance from the multi-national petroleum companies who feared a reduction in their market share. This strategic direction needs to be pursued in the next planning period. Challenges to Product Diversification: i. Co-generation: Uncompetitive pricing mechanism ii. Limited technology and factory capacities iii. Weak legal and regulatory framework Stakeholders’ Concerns: 1. There are no concrete steps towards 2. Needs to accelerate its intensification programme diversification e.g. introducing sweet sorghum in the farming community as a way of complementing cane farming IV. Policy and Legal Framework The major achievements under this strategic direction were: i. ii. iii. iv. v. The Cabinet approved the Privatisation Plan Commenced implementation of the Privatisation Programme Drafting of the Sugar Act, 2001 Amendment Bill Drafting of the Sugar (General) Regulations Classification of sugar as a special commodity under the East African Community Customs Union hence a CET of 100% or USD 200 per tonne whichever is higher vi. ISO certification is on going in some sugar factories. Already five factories (Mumias, Muhoroni, Chemelil, Nzoia and West Kenya) are ISO certified. It should be noted that ISO certification focuses mainly on the process audits that may not be an indicator of satisfactory performance in terms of service delivery. 18 Kenya Sugar Industry Finalization and implementation of all pending policy and legal instruments will be a major milestone in the incoming Plan. Pending actions include: i. Passing of the Sugar Amendment Bill ii. Gazetting of the Sugar General Rules iii. Reclassification of sugar as a food iv. Finalisation of regulations to restructure outgrower institutions Stakeholders’ Concerns: Delay in the implementation of policy and legal actions V. Privatisation of the Sugar Industry During the period under review, the Privatisation Bill was passed by parliament and recently the Privatization Commission has commenced preparatory work towards offering the candidate factories for privatization. Speed will be of essence because of the urgency to restructure in good time to realign factories with the new trade regime expected after the expiry of COMESA safeguard measures in 2012. Work in progress: i. The basic framework for OGIs has been prepared. It envisages OGIs that will become effective service providers. Stakeholders’ Concerns: Mushrooming of many outgrower institution with minimal service delivery VI. Funding for the Industry The funding of the industry was a challenge. This was exacerbated by poor managerial and business practices. During the period under review, the industry was not able to attract strategic investors to inject the much needed capital in the sub-sector. As a result, most millers and outgrower institutions have severe cash flow and liquidity problems. As a coping mechanism, some of the millers were not remitting Sugar Development Levy (SDL), which led to greater default penalties. The low funding has compounded the financial problems of factories that were already highly leveraged. Despite this, there were some notable achievements, including: i. Farmer education on the availability of credit facilities ii. Development of proposals for funding (KESREF/EU) iii. Development Partnerships (EU awarded 6 million Euros to the industry for structural adjustments) iv. Development of proposals for SDF funding that led to increased funding for the industry Strategic Plan, 2010-2014 19 Stakeholders’ Concerns: Since its inception in 1992, SDF has grown to be the largest source of industry funding. Is the SDF funding sustainable? VII. Efficient Supply Chain Management Supply chain management is still a challenge in the sub-sector. For the industry to remain competitive, improved management actions such as cost cutting and productivity improvements along the supply chain should continue and intensified in the next planning period. Notable achievements under this strategy included: i. ii. iii. iv. v. Establishment of quarterly consultative forums Frequent stakeholder workshops Adoption of e-commerce in procurement Development of some cost reduction policies Simplified Cane Payment Formulae The industry was not able to establish an accountable and specialized procurement body to help stakeholders reduce costs through economies of scale. Each industry institution insisted on its own procedures to maintain control of the process. In addition, Parastatals mills are bound by the public procurement procedures, which are cumbersome and costly. Stakeholders’ Concerns: Some companies were ISO certified yet the services to farmers were still wanting IX. Socio-Economic Development The following were achieved during the outgoing planning period: i. Policy on social corporate responsibility developed but not yet adopted ii. Community empowerment through awareness creation on HIV/AIDS and Malaria iii. Environmental health and safety standards developed iv. Supported sports development The following were not achieved: i. Infrastructural development was considered far too modest ii. Sugar industry business plan was not realised iii. Brand Kenya initiative was still in the initial stages of conceptualization 20 Kenya Sugar Industry Stakeholders’ Concerns: Dilapidated infrastructure leading to high cost of cane and sugar production 3.3 Lessons from Plan Implementation Several interviews and discussions were held to determine the salient lessons learnt since the industry’s Strategic Plan (2004-2009) was formulated and the experiences during its implementation. Overall, all stakeholders interviewed concurred that the Strategic Plan instrument was good. They also all agreed that the outgoing Plan could have achieved more. The useful lessons drawn from the implementation of the same were: i. Due to lack of a well-institutionalised monitoring, evaluation and reporting system, many stakeholders did not report diligently on their operations both current and planned. As a result there was no reliable empirical information for accurate forecasting beyond a quarter or two. This meant that the data that informed internal decision-making was not the same as was shared during the Plan’s quarterly implementation review meetings. This denied the planners the opportunity to gather information that would have been essential in facilitating the design and redesign of a longer-term strategy for the transformation of the industry. ii. Lack of a proper implementation framework was a major shortcoming in the outgoing Plan. This made it difficult to implement the strategic actions. Additionally, the objectives were not SMARTEST12, which made it difficult to measure performances against targets. iii. There was no linkage between Plan’s strategic objectives and the national agenda. Thus the implementation of the Plan was done in isolation. iv. Lack of funds and/or delayed funding led to delays in the implementation of some of the strategic objectives. v. There was no harmony between the Strategic Plan, work plans, performance contracts and budgetary provisions. This reduced efficiency and effectiveness of strategy implementation. vi. The role of KSB in carrying out monitoring and evaluation of the Plan’s implementation was full of challenges. The Board was not able to enforce and supervise its implementation. vii. Lack of a risk mitigation mechanism in the outgoing Plan was a major set- back in the realisation of the strategic objectives. Some of the declining outputs were as a result of risk that could have been anticipated and mitigated. viii. There were extremely high expectations at the onset of the Plan’s implementation. Some of the stakeholders had expected the Plan to be an instrument through which the Government would 12 Specific, Measurable, Attainable, Realistic, Timed, Engaging, Siring, Team effort Strategic Plan, 2010-2014 21 identify funding needs and release funds towards the same. Essentially, this group of stakeholders turned to Government as a lender of first resort and seemed disappointed when they learnt otherwise. ix. High indebtedness by most of the factories led to lack of implementation of some of the strategic objectives as some of the funds for implementation were to be from internal sources. This increased pressure on the Sugar Development Fund (SDF), which was already inadequate. Based on the foregoing, the incoming Strategic Plan (2010-2014) has been formulated taking cognisance of the above lessons. 3.4 Situational Analysis At the end of the 2004-2009 planning period, the sugar industry is still struggling to transform itself into a vibrant, efficient, diversified and competitive industry. A SWOT and PESTLE analysis demonstrated the state of affairs. 3.4.1 Strength, Weaknesses, Opportunities and Threats (SWOT) Analysis The Strengths, Weaknesses, Opportunities and Threats (SWOT) analysis of the Kenya’s sugar industry involved the assessment of both the internal and external environment in which the industry operates. The results are outlined below: I. Strengths: The following were identified as the industry main strengths: a. b. c. d. e. f. II. Weaknesses: The major weaknesses of the industry are: a. b. c. d. e. f. g. h. i. j. k. l. Over-reliance on a single product (sugar ) for revenue Limited irrigation Weak corporate governance High level of industry indebtedness Substantial Government ownership High post harvest losses (estimated to be at least 5%) Poor transport infrastructure Capacity underutilisation (56.25% of TCD) Low capacity mills (only 12.5% of operating factories above 3,500 TCD) High costs of production Inadequate and uncoordinated funding Lack of performance monitoring and evaluation system IV. Opportunities: Possible opportunities for exploitation in the Industry include: a. b. c. d. e. f. 22 Vast potential for expansion of area under cane Unutilized processing capacity Strong agronomic research capacity Resilient, hardworking farmers Stakeholder participation and concurrence Protected local markets Ready local and regional markets Agronomic potential Government goodwill Proven opportunities for product diversification (co-generation, ethanol) Sucrose based pricing and cane payment system Sugarcane production through irrigation Kenya Sugar Industry V. Threats: The threats to the realisation of the vision and mission include: a. b. c. d. e. f. g. h. i. j. k. l. Continued reduction of the SDL Informal cross-border trade Strong import competition Uneconomic land sub-division High energy costs High tax burden Risk of insolvency of some producers Food insecurity Risk of slow adoption of new technologies Political interference in affairs of the industry Climate change due to environmental degradation Malaria and HIV/AIDS 3.4.2 PESTLE Analysis In addition to the SWOT analysis, an analysis of Political, Economic, Social, Technological, Legal and Environmental (PESTLE) challenges that the Kenya sugar industry faces was done. The analysis helped in understanding the challenges that might hinder the competitiveness of the industry. Annex II is a summary of the outcome of the analysis. Overall, the analysis showed that poor corporate governance creates uncertainties in the investment climate and may hinder the privatization process. It also pointed to the high production costs and the singular focus on sugar that had resulted in a non-competitive industry. The analysis also revealed the ecological risks of environmental degradation and climate change and the consequent negative impact on water and farming systems. 3.4.3 Stakeholders Comparative Advantage Analysis The sugar industry has strong linkages with stakeholders identified in section 1.3 of this report. All these stakeholders play important roles in the industry. The industry recognises that stakeholders will facilitate the implementation of the incoming plan based on their comparative advantages. Annex III is a summary of the stakeholders’ comparative advantage analysis. Strategic Plan, 2010-2014 23 Chapter 4 Strategic Plan 2010-2014 4.1 Rationale for the 2010-2014 Strategic Plan The Agricultural Sector Development Strategy (2009-2020), and the Vision 2030 emphasize the need for increasing productivity, commercialisation and competitiveness of the agricultural sector as well as the need for efficiency and better management in the utilisation of public resources. This is to enable the Government achieve its strategic objectives of being a middle-income country by the year 2030. The Kenya Sugar Industry Strategic Plan 2010-2014, will be one of the key building blocks for both the Agricultural Strategy and Vision 2030 goals. The 2010-2014 Strategic Plan will be used to maintain and build on the successes achieved in the 20042009 Strategic Plan. The revised Plan will aim at consolidating the gains made, identify new options to improve efficiency and increase the industry’s competitiveness. It will also take cognisance of the lessons learnt in the last five years. The Plan will provide a framework for setting goals, defining key actions and mobilizing resources to fund programmes that will achieve agreed goals. It will also provide an opportunity for the exchange of ideas by a wide array of stakeholders in the industry. It will increase awareness of industry-wide limitations and opportunities leading to a greater appreciation of actions to be undertaken. Consequently, there will be greater willingness to share information, gather new ideas and more correctly situate local area issues in an industry context. The periodic consultation forums to review status of the Plan’s implementation will provide opportunities for all industry stakeholders to learn from the leaders and innovators in the industry. The Plan will be an empowerment tool for internal lobby groups to press their demands for resources and better quality services. In addition, it will lay ground for enhanced performance of the sugarcane industry premised on proper utilisation of resources, arising from clearly identified goals, targets and verifiable indicators. The Plan will set strategic objectives that will help achieve the vision and mission of the industry. Above all, the formulation of the sugar industry Strategic Plan 2010-2014 comes at a time when the industry needs to rethink its direction as it approaches the liberalization of the sugar trade regime. The industry needs to find ways of repositioning itself competitively. This requires that the industry goes beyond sugar, think more about sugarcane as a whole and exploit market opportunities that the broader sugarcane industry can provide. It also puts new pressures on the industry to find and invest resources in the new direction where the industry needs to go. 4.2 Vision, Mission and Core Values of the Sugar industry Following extensive consultations and discussions by the industry stakeholders, KSB management and the Board, it was agreed as follows: 24 Kenya Sugar Industry 4.2.1 Vision The new vision for the industry is to be ‘a world-class multi-product sugarcane industry’. 4.2.2 Mission The new mission of the industry is to ‘facilitate a multi-product sugarcane industry that is efficient, diversified and globally competitive’. This will be realised by enhancing industry’s competitiveness through cost reduction strategies and efficiency improvements, expanding product base, improving infrastructure and strengthening the regulatory framework. 4.2.3 Core Values To achieve the Vision and Mission of the industry, stakeholders have pledged to uphold the following six core values: 1. 2. 3. 4. 5. 6. Product and Service Excellence: through excellent product and service delivery it will strive to exceed customer expectations Stakeholder Partnership: to optimise synergies in order to meet set goals by consciously and deliberately nurturing team spirit, collaboration and consultation Integrity: to uphold virtues of integrity through honesty and fairness in all operations Accountability: to strive to be responsible custodians of all resources entrusted to the industry in a professional and transparent manner Social Responsibility: endeavour to be socially responsible to society and pursue industry goals though socially acceptable practices that preserve the environment; promote socio-economic development, support vulnerable groups and HIV/AIDS and Malaria programmes Gender Mainstreaming: embrace principles of gender equity, fairness and balance across gender 4.3 Analysis of Challenges along the Sugar industry Value Chain After five years of implementing the Strategic Plan 2004-2009, the original strategic issues and objectives of the sugar industry broadly remain the same in spite of the marked improvement in addressing them. In the incoming planning period, the key strategic issues have been derived after a comprehensive analysis of the challenges and/or gaps along the industry’s value chain (Fig 4.1). Strategic Plan, 2010-2014 25 Farm level operations Pre-Factory Operations Processing Distribution NUCLEUS ESTATES HARVESTING CANEYARD OPERATIONS BY PRODUCTS INDUSTRIAL CONSUMERS SMALLHOLDERS TRANSPORTATION MILLING OPERATIONS WHOLESALERS / RETAILERS DOMESTIC CONSUMERS Consumption CHALLENGES • High cost of inputs • Weak researchextension-farmer linkages • Low adoption of high yielding cane varieties • Excessive land subdivision • Delayed payments to farmers • Limited irrigation • Inefficient OGIs • Drought, Cane fires, diseases • Long maturity periods • Inadequate funding (SDF) • Lack of collateral • Food insecurity • Limited irrigation • Delayed and uncoordinated harvesting • Labour intensive • Dilapidated infrastructure • High post harvest losses (cane spillage, poaching etc.) • Inappropriate trailer designs • Inadequate funding (SDF) • Poor cane yard management • Small and uncoordinated planting and harvesting units • Irregular routine factory maintenance • Low crushing capacity • Low sugar extraction rates • Slow adoption of new and appropriate technology • Lack of industrial research • High cost of sugar production • High indebtedness • Narrow product base • Dilapidated processing equipment • Inefficient factory operations • Wastage in cane yard • Inadequate funding (SDF) • High taxation • Strong cartel of sugar importers • Limited value addition and product diversification • Inadequate funding SDF • Imports cheaper • Incapacity to process industrial sugar • Poor • product quality • Lack of consumer representation in SDF committees Fig. 4.1: Challenges along the Sugar Industry Value Chain 4.4 Strategic Goals (2010-2014) Arising from the stakeholders’ consultations, SWOT and PESTLE analysis, a number of strategic goals were identified along the sugar industry’s value chain. These issues and proposed actions are summarised in Fig. 4.2. 26 Kenya Sugar Industry Farm level operations Pre -Factory Operations Processing Distribution STRATEGIC ISSUES Enhance Competitiveness • Reduce cost of farm inputs • Increase supply of quality seed cane • Increase adoption rate of new technology • Intensify farm level research • Invest in irrigation • Increase research funding • Encourage good husbandry practices • Modernise and promote the use of ICT Expand Product Base Enhance Competitiveness • Improve cane yard management • Reduces postharvest losses • Increase research funding • Modernise and promote the use of ICT Enhance Competitiveness • Intensify industrial and applied research • Increase processing efficiency • Reduce cost of sugar production • Factory rehabilitation and modernisation • Embrace condition maintenance • Modernise and promote the use of ICT Enhance Competitiveness • Harmonise marketing pattern • Increase market research • Branding • Maintain adequate stock levels • Modernise and promote the use of ICT Expand Product Base Expand Product Base Expand Product Base • Feed in tariff • Implement legislation on blending Improve Infrastructure Improve Infrastructure • Increase income streams from expanded product base • Implement legislation on blending Improve Infrastructure Rehabilitate rural roads • Consider other modes of transport • Increase transport units • Invest in road improvement Regulatory Framework • Encourage intensification to increase food security Regulatory Framework • Pass the Sugar Amendment Bill • Gazette Sugar General Rules • Harmonize all sugar laws • Finalise and implement regulations to restructure outgrower institutions • Establish a sugarbelt roads management committee Improve Infrastructure • Invest in ICT • Embrace e-commerce and e-procurement Regulatory Framework Regulatory Framework • Encourage good corporate governance • Enforce measures to eliminate tax evasion Fig. 4.2: Strategic Issues 4.5 Strategic Objectives (2010-2014) A synthesis of the 2004-2009 Plan review and discussions with industry stakeholders led to a recognition of four (4) key strategic objectives that will be the pillars of the 2010-2014 Strategic Plan. These strategic objectives are: 1. 2. 3. 4. Enhancing industry competitiveness Expanding product base Improving infrastructure Strengthening the regulatory framework Strategic Plan, 2010-2014 27 In order to ensure that the identified strategic objectives are comprehensively addressed, a number of strategies have been formulated for each objective. A set of activities have been identified for each strategy in order to work towards the achievement of the desired results. A results matrix has been developed and presented as Annex IV. The following section therefore presents the strategic objectives, proposed strategies and activities/actions to be undertaken under each strategy. 4.5.1 Strategic Objective 1: To Enhance Sugar Industry Competiveness Kenya remains a high cost sugarcane and sugar producer compared to regional competitors. The average cost per tonne to produce sugar in Kenya is higher than that of its COMESA competitors. In the 2008/09 season, the average industry sugar production cost per tonne was USD 428 vs. an estimated cost of USD 263 for its competitors13. These costs are too high to remain competitive, yet without cost reduction, the industry cannot compete. To bring its costs in line with its competitors, the industry needs to reduce its costs by a factor of about 39%. In the incoming planning period, 2010-2014, the sugar industry will reduce sugarcane production cost by 15% and 22% for plant crops and ratoon crops respectively as shown in Tables 4.1a. During the same period, sugar production cost will be reduced by 46% as shown on Table 4.1b. Table 4.1a: Actual and Required Cost Reduction in Cane Production per tonne Cost (KSh/Tonne Base year Item PC 2009/10 R Land development 316 Seed cane Cane maintenance Harvesting and loading Cane transport (24km radius) Total PC 316 269 0 362 315 206 R 2011/2012 2012/2013 PC PC PC 43 316 269 0 362 315 206 189 600 600 1,753 22.9 USD* 43 2010/2011 R 43 316 269 0 362 315 189 172 530 530 1,164 1,666 15.2 21.8 R R 43 316 43 269 0 269 0 362 315 362 315 172 150 150 150 150 450 450 400 400 400 400 1,077 1,569 980 1,497 908 1,497 908 14.1 20.5 12.8 19.6 11.9 19.6 11.9 *Exchange rate – USD 1 = KSh. 76.55; PC – plant cane; R - ratoon Source: Log Associates, 2009, Proposed Cost Reduction for Plant and Ratoon Crops Table 4.1b: Actual and Required Cost Reduction in Sugar Production per tonne Cost (KSh/Tonne) Item Factory Cost Other business support costs Total USD* Base year 2009/2010 2010/2011 2011/2012 2012/2013 5,909 5,023 4,269 3,757 3,306 26,873 22,841 19,415 17,085 15,034 32,782 27,864 23,684 20,842 18,340 428.2 364.0 309.4 272.3 240.0 *Exchange rate – USD 1 = KSh. 76.55 Source: Log Associates, 2009, Proposed Cost Reduction in Sugar Production 13 28 Calculations based on figures from Cost of Cane and Sugar Production 2008 by KSB Kenya Sugar Industry The above tables are illustrations costs in two key stages of the production and value chain but are not the only areas that require cost reduction. The industry needs to gain production efficiencies at all stages of the value chain. One of the key elements of value chain enhancement is the expansion of the product base. In Mauritius for instance, the share of sugar revenue in the total revenue mix is only about 40%. The remaining 60% is derived from sugarcane coproducts including power generation, ethanol, industrial sugar and other products. The 20102014 Strategic Plan will redirect the Kenya sugar industry in the same direction. To enhance the competitiveness of the industry, the following strategies will be implemented: Strategy 1.1: Reduction in Farm Level Risks Farmers face many risks in the production cycle including unpredictable rainfall, cane fires, uncertainty in the timing of cane harvesting among many others. These risks ultimately result in increased sugarcane production costs and diminished returns to the farmer. In the incoming period, the industry will strive to reduce farm level risks by: i. Increasing sugarcane production and productivity through efficient farm operations: The search for an efficient and competitive sugarcane industry starts with the farmer. Farmers need to increase cane yields through consistent fertilizer application, use higher yielding and early maturing varieties and where feasible adopt supplemental irrigation and drainage. With good husbandry practises, farmers can profitably increase the number of ratoon crops and save replanting costs. The industry will increase the area under sugarcane by 32% and yield per hectare by 36% (Table 4.2). During the same period, the ERC% sucrose content in cane will be increased to 87.25%. It is also expected that 20,000Ha of sugarcane will be planted along the Tana River Basin14. Table 4.2: Farm Level Annual Targets Year 14 Area under Cane (Ha) Yield (Tonnes/Ha) 2008/2009(Base Year) 169,421 73 2009/10 177,892 79 2010/11 196,682 84 2011/12 206,363 90 2012/13 215,290 95 2013/14 224,925 100 Source: Log Associates, 2009, Projected Area under Cane and Yields ii. Developing the use of and financing irrigation for sugarcane production: There exist vast potential to increase irrigated sugarcane production in Kenya particularly in the Tana River Basin, Nyando Basin and Nzoia Basin. While estimates vary, the potential irrigable land in these three basins alone is in the range of 700,000 hectares. In the incoming period, the industry will expand cane area under irrigation by about 40,000 hectares annually to reach an estimated total of 2000,000 hectares by the end of the Plan period. Studies indicate that yields from irrigated fields range from 120-150 TCH compared to the 70-100TCH from rain-fed fields. Therefore, 200,000Ha irrigated cane field would produce 40,500,000 tonnes of sugarcane. In such controlled growing conditions, the sucrose content in the sugarcane can be boosted to an average of 15% compared to 13.5% for rain-fed conditions. During the planning period 2010-2014, the industry will TARDA Strategic Plan 2008-2012 Strategic Plan, 2010-2014 29 invest in irrigation in the Tana, Nyando and Nzoia river basins. Already, the Ministry of Water and Irrigation (MoWI) is working on the details of constructing multi-purpose dams in Nyando and Nzoia basins as a lasting solution to perennial flooding in these areas. The water from these dams will be used by the industry for irrigation projects. The GoK has also stepped up campaigns for developing irrigation infrastructure along the Tana River basin. The sugar industry will support these initiatives to fast track implementation. Table 4.3 outlines the targeted area under cane to be irrigated over the next five-year period. Table 4.3: Annual Targets for Irrigated Area under Cane Year Irrigated Area (Ha) 2008/2009(Base Year) 400 2009/10 44,000 2010/11 84,000 2011/12 124,000 2012/13 164,,000 2013/14 204,000 Source: Log Associates, 2009, Proposed Irrigated Area under Cane iii. Creating an insurance scheme to cushion the farmers from losses arising in the industry: Sugarcane farmers continue to suffer from unforeseen calamities occasioned by unpredictable weather patterns with erratic and prolonged periods of drought. Cane fires and theft have also become increasingly frequent. During the planning period, the industry will pilot and if successful, expand sugarcane crop insurance working in collaboration with private sector partners. iv. Enhancing results oriented research-extension-farmer linkages to accelerate adoption rates of high yielding varieties: Adoption rates of new technology at farm level have generally been in the 30% range. Despite the advantages of high yielding and early maturing varieties, farmers have shown little enthusiasm for the new technologies. The extension messages need to be disseminated more aggressively while keeping in mind that the principle of sugarcane farming as a business starts with the farmer who needs transparent pricing, and prompt payment to run the farm as a business. In the incoming period, sugar factories and outgrowers will phase out long maturing cane varieties like CO 421 while replacing them with varieties such as CO 945, EAK 73-335 varieties, which are early maturing, rich in sucrose content and resistant to diseases. Table 4.4 outlines the targeted proportional area under high yielding Kenyan cane varieties over the next five-year period. Table 4.4: Annual Targets for Proportion of High Yielding Cane Varieties Year 30 Proportion (%) 2008/09(Base Year) 5 2009/10 10 2010/11 25 2011/12 40 2012/13 45 2013/14 50 Source: Log Associates, 2009, Proposed Proportion of High Yielding Varieties Kenya Sugar Industry v. Implementing a land tenure policy that encourages economies of scale: Land fragmentation through subdivision is a major threat to plantation crops such as sugarcane. A mix of population pressure and cultural practises has led to an escalation of land subdivisions. The sugarcane industry will continue to articulate the risks of uncontrolled subdivision. It will also design and implement innovative arrangements such as block farming15 and satellite villages16 that will help increase land sizes under cane cultivation. These approaches are consistent with the recommendations of the Agricultural Sector Development Strategy 2009-2020 and the Kenya Vision 2030. vi. Ratooning: Farmers need to make a fair return on investment. Studies have shown that the margins are small for plant crop. Subsequent ratoons, if well maintained, bring good profits to the farmer (Table 4.5). Currently, there are only two ratoons in the industry. Tanzania, whose production cost is the lowest in EAC region, has 5-8 ratoons. Brazil, which is the leastcost cane producer (USD20/t) in the world, has only 20% of the total area under cane on new plantings. The remaining 80% is under ratoon crops. Top sugar producing countries are known to produce over 10 ratoons, while marginal producers hardly go beyond two ratoons hence sustaining losses due to high production costs17. To increase earnings from cane farming, farmers will be encouraged to increase the number of ratoons to five or more. Table 4.5: Profit Margins Plant Crop vs. Ratoon Crop Sugarbelt Profit (KSh/Tonne) Nyando Plant Crop 310 Ratoon Crop 1,107 Western 621 958 Light soils 669 946 Heavy Soils 572 970 Mean 543 995 South Nyanza Source: Kenya Sugar Board, 2007, Cost of Cane and Sugar Production Study Strategy 1.2: Efficient, Reliable Harvesting and Transport Operations On average, harvesting and transport operations account for 48% of the total cost of sugarcane production with a range of 37%-52%18. In 2008, harvesting, loading and transport costs amounted to KSh. 806 per tonne, which translated into KSh. 4.163 billion (assuming all cane transported within 24km radius19). This huge cost was borne by the farmers. The industry will seek to reduce this cost to levels in the range of 10%-15% in the next five years by: i. 15 16 17 18 19 Improving cane yard management: Losses related to a poor transport system are translated into unavailability and inefficient movement of sugarcane in the cane yard. This leads to capacity underutilisation in the factory. The losses due to capacity underutilisation are huge. Good cane yard management is needed to reduce the uneconomically lengthy turnaround times by cane haulage units. Efficient cane yard operations will also lead to reduced staleness and mitigate losses to the farmer. To improve efficiency of operations, cane yards will be rehabilitated, automated and modernised. The monitoring benchmarks will be reduced staleness index (Table 4.6) and increased cane delivery trips. Discussions on Block Farming are presented in XI Satellite village farming involves consolidating small parcels of land and consolidating farmers into eco-friendly villages Kegode P, 2005, Economic Governance Reform in the Sugar Sub-Sector Outgrowers cane production costs, 2007/2008 The true picture is that some cane is transported even at70km Strategic Plan, 2010-2014 31 Table 4.6: Annual Targets for Staleness Index Staleness Index (Days) 4 2009/10 2 2010/11 2 2011/12 1 2012/13 1 2013/14 1 Source: Log Associates, 2009, Proposed Reduction in Staleness Index ii. Year 2008/2009 (Base Year) Reducing post-harvest losses: Sugarcane farmers lose huge amounts of revenue as a result of post-harvest losses. A 5% loss in 2008 was equivalent to 258,289.3 tonnes of sugarcane. The cost of sugarcane ranges between KSh. 2,500-3,100 per tonne. This implies that farmers lost approximately KSh. 646-800 million. The industry will reduce post-harvest losses to less than 2% through stronger oversight, improved trailer designs and infrastructure development (Table 4.7). Table 4.7: Annual Targets for Post-Harvest Losses Year Percentage post-harvest losses 2008/2009 (Base Year) 5 2009/10 4 2010/11 3 2011/12 2 2012/13 2 2013/14 2 Source: Log Associates, 2009, Proposed Reduction in Post-Harvest Losses iii. Reducing time lapse between cane maturity and harvesting: The average cane maturity period is 18 months. Farmers wait for up to 6-12 months before cane is harvested. This has made cane farming unattractive to most of them. Some have opted out of cane farming. The delays in harvesting operations are attributed to uncoordinated and unpredictable harvesting and transport schedules; and inefficiencies in mill operations. All this is happening due to lack of proper planning. Information and Communication Technology can provide the tools needed to coordinate transport and harvesting operations. Through ICT scheduling, the waiting period for harvesting will be reduced to less than a month (Table 4.8). The industry will also institutionalise harvesting operations to make it more reliable and predictable. 32 Table 4.8: Waiting Time between Cane Maturity and Harvesting Year Time (months) 2008/2009 (Base Year) 6-12 2009/10 4 2010/11 3 2011/12 2 2012/13 1 2013/14 1 Source: Log Associates, 2009, Proposed Time Lapse between Cane Maturity and Harvesting Kenya Sugar Industry iv. Promoting the use of other modes of transport: Industry players need to experiment with different modes of cane transport including light rail and trucks. Animal drawn carts are suitable for small factory capacities such as those common in India. v. Increasing research funding for harvesting and transport: Research in harvesting and transport is lagging behind as most of KESREF research is agronomic. During the incoming Plan period, the industry will increase funding to KESREF to explore mechanised harvesting operations. While mechanical harvesting may save on labour, it increases post-harvest losses and leads to soil compaction. Soil compaction leads to poor infiltration, slow drainage and reduced aeration, limiting root growth, nutrient uptake and crop yields. KESREF while undertaking research towards mechanisation should seek ways of mitigating such setbacks. Strategy 1.3: Effective, Efficient and Reliable Milling Operations The role of the millers is to make a fair return on investment through efficient operation of mills and/or jaggeries for the production of sugar and other products for sale, and make timely payments to cane growers. In the next five years, the millers will enhance industry’s competiveness by: i. Increasing sugar production through efficient processing: All factories need to operate optimally through efficient modern style management and carry out regular condition maintenance. Valuable time is lost while extensive maintenance is being undertaken. In the incoming plan period, sugar production will be increased by 122% by the year 2014, recovery levels and capacity utilisation increased to 11.5% and 89% respectively (Table 4.9). Other efficiency performance benchmarks such as FTE and sugar co-product production per tonne will also be monitored. Currently, all the efficiency benchmarks are lower than those of major competitors. The various efficiency benchmarks are presented in Annex V. Table 4.9: Factory Level Targets Year Capacity Utilisation Rendement (%) Made Sugar(Tonne) 2008/9(Base Year) 50 10.0 518,128 2009/10 61 10.5 565,236 2010/11 70 11.5 670,830 2011/12 75 11.5 813,286 2012/13 80 11.5 982,257 2013/14 89 11.5 1,151,557 Source: Log Associates, 2009, Proposed Factory Level Targets over the next Five Years ii. Creating economies of scale: Apart from Mumias and the proposed TARDA sugar company, all the other sugar factories are below 4,000TCD (Annex VI). As the industry seeks to become more efficient and competitive, all options for achieving economies of scale will have to be considered. The envisaged privatization programme offers an opportunity to increase economies of scale through factory mergers in the Western and Nyando zones. Other opportunities for achieving economies of scale will be realised through the construction of a new, larger capacity factory in Tana River Basin. Investing simply in rehabilitation and upgrading of mills, while necessary, is not sufficient. Strategic Plan, 2010-2014 33 iii. Intensifying industrial and applied research: The Kenya sugarcane industry needs a centre of excellence in applied research. This will be achieved through strengthening of KESREF research capacity and other innovative approaches such as twinning arrangements between factories and local universities to bring together researchers and practitioners. iv. Benchmarking with international standards: For Kenya’s sugar products to be competitive nationally, regionally and globally, millers must benchmark their production processes with international best practices. The industry will achieve this by carrying out the following activities: (a) Providing information on production technologies and quality standards and facilitating their application, adaptation and uptake; (b) Providing information on international best practices for local millers to benchmark themselves; and (c) Participating in regional and international negotiations on issues affecting the sugar industry Strategy 1.4: Enhanced Human Resource Capacity The twin problems of bureaucratic interference and poor corporate governance have combined to obscure the efficacy of the human resource development programmes in the industry. Although Kenya has many educational institutions, both private and public, which provide quality education, the industry still lacks adequate skilled human resources. Arrangements are underway to create partnerships between the industry and training institutions to produce the kind of professionals that the industry needs. Already there are ongoing arrangements with Masinde Muliro University of Science and Technology (MMUST), Egerton University, Maseno University and Moi University towards the same end. More institutions need to come on board particularly middle level, diploma type training institutions to supplement these efforts. In addition to the external training programmes, factories and outgrower institutions will beef up their internal training capacities. To reinforce a strong skill development programme through training, staff recruitment policies will be strictly merit based. The management styles will be progressive and results oriented. It is only through a combination of these approaches that industry will eventually overcome the current human resource constraints. In order to deliver on the vision and mission setout in this Strategic Plan, the industry will recruit, train, promote and retain its staff, to effectively deliver quality services to all the stakeholders. In this regard, staff will sign performance contracts with respective institutions binding them to deliver on targets. To ensure availability of skills, talents, and knowledge required, the industry will carry out the following activities: i. Undertaking a sugar industry Training Needs Assessment (TNA) and implementing its findings ii. Preparation of a staff retention strategy though better remunerations, staff motivation and workforce compensation iii. Signing Performance Contracts; iv. Implementing a Performance Appraisal System (PAS) v. Strengthening industry’s collaborations with training institutions/universities Strategy 1.5: Streamlined Corporate Governance There are major challenges in corporate governance in some of the institutions in the industry. These challenges are pronounced particularly in institutional and supply chain management both in outgrower institutions and at the corporate levels of publicly owned factories. This was the result of poor recruitment policies and political patronage. The industry is moving towards 34 Kenya Sugar Industry ISO certification which may help highlight governance weaknesses and if addressed will help mitigate some of the challenges. Greater private sector participation in the industry within a strong regulatory environment will also complement the steps the Government is taking to improve the same. In order to streamline corporate governance in the industry, the following activities will be carried out: i. ii. iii. iv. v. vi. Conducting periodic Customer Satisfaction Surveys (CSS) Ensuring the undertaking of International Organization of Standards (ISO) certification Sensitization of industry on quality standards and certification requirements Advocacy on governance, security, high cost of doing business, among others Improvement of communication amongst industry stakeholders and the rest Training on prudent financial management 4.5.2 Strategic Objective 2: To Expand Product Base Most countries are growing cane and producing sugar with the aim of getting a range of products and by-products. Cane is cultivated as a strategic product to support industries such as: Beverages, Confectionery, Pharmaceuticals, Wines, Spirits, Power Alcohol, Animal Feeds, Energy, Chemicals and Fertilizers. The Kenya sugarcane industry has embraced the market reality that the industry needs to expand its product base as a means of strengthening its competitiveness globally. Therefore, backward and forward linkages need to be exploited to their fullest potential. However, in Kenya, mill white sugar is still the core commodity produced from sugarcane. Diversification to other co-products such as power co-generation and ethanol production for sale is still very limited and largely unexploited. Figure 4.3 illustrates the technical potential for sugarcane products. Sugar Cane Sugar/Solids Mollasses/Juice Raw Sugar Refined Sugar Fertilizers Industrial uses Crop Residues Steam and Electricity Industrial uses Commercial Products Ethanol Fuel Briquettes Block Board Stillage Industrial Paper Fertilizer Methane 20 Fig. 4.3: Potential sugarcane products20 Log Associates, 2001, Financial Restructuring Strategy to Sony Sugar Company Strategic Plan, 2010-2014 35 The Kenya sugarcane industry has the raw material and favourable market conditions to substantially expand its product base particularly into power generation, ethanol and industrial sugar and alcohol. To address this area of concern and to increase profitability and competitiveness of the industry, the following programmes will be undertaken: Strategy 2.1: Value Addition and Product Diversification While the industry will seek to exploit the full range of industrial products from sugarcane and sugar, the flagship projects under the theme of value addition and expansion of the product base will be power generation and ethanol production. Before the initiation of production of co-products, it is important that rigorous technical, financial and economic feasibility studies be carried out. i. Initiating co-generation projects: The demand for electricity has in the past continuously outstripped supply, precipitating a significant level of unmet demand. This shortfall is estimated to be 380GWh. The shortfall is further exacerbated by frequent drought occasioned by climate change. The sugar industry has large potential for co-generation that if fully exploited may help meet some of the power demands. Currently, only an estimated 36.5MW is generated through co-generation. Apart from Mumias Sugar Company that has initiated a massive cogeneration project to produce 35MW of electricity for their own use and for sale, the rest of the factories consume all the power they generate. During this Plan period, sugar factories will initiate co-generation projects and produce sufficient electricity for internal use and for sale to Kenya Power and Lighting Company (KPLC) to help alleviate the shortfall in the country. Through the Tana Integrated Sugar Project, it is proposed that 34MW of power would be produced through co-generation21,22. Chemelil Sugar Company and KenGen have also signed a MoU to develop a 20MW power plant to generate electrical power using bagasse23. Table 4.10 shows the potential revenue from co-generation. Table 4.10: Potential Revenue from Co-generation Miller Potential Local use Sales Rate Hours/ year MW Capital Cost Estimates MW MW KSh Hours Mumias W/Kenya 36.3 5.4 11.4 1.0 24.9 4.4 3000 3000 7,128 7,128 532 94 4,9261 733 Muhoroni Nzoia 9.5 14.2 1.7 2.2 7.8 12 3000 3000 7,128 7,128 167 257 1,289 1,927 Chemelil 20.0 2.4 17.6 3000 7,128 376 2,714 SONY 13.8 2.4 11.4 3000 7,128 244 1,872 Miwani 13.8 2.4 11.4 3000 7,128 244 1,872 TARDA 36.3 11.4 24.9 3000 7,128 532 4,926 149.3 34.9 114.4 300 7,128 2,446 20,259 Total Potential Revenue (KSh., millions) Per annum KSh, millions Source: Log Associates, 2009, Co-generation Potential and Projected Revenues ii. Initiating ethanol production projects: Kenya’s fuel consumption stood at 1.4 and 3.3 million litres of petrol and automotive diesel respectively per day in 2006 with an average 21 22 23 36 Tana and Athi Development Authority, 2008-2012 Strategic Plan The Tana Integrated Sugar Project is estimated to cost KSh. 24 billion KenGen, Five Year Business Plan, 2007-2012 Kenya Sugar Industry growth rate of 2.8% per year. Projections indicate that Kenya will require 1.7 and 4.1 million litres of petrol and automotive diesel respectively per day by 2014. By 2030, the fuel consumption will be 2.7 and 6.5 million litres of petrol and automotive diesel per day. Currently, Kenya requires 85 million litres of ethanol per year for a national 10% (E10) blend. At current consumption levels, this would need to grow to 93 million and 148 million litres by 2014 and 2030 respectively. It is estimated that a tonne of molasses can be converted into 220 litres of ethanol. In 2008, the sugar industries produced approximately 180,000 tonnes of molasses, which would have produced 39.6 million litres of ethanol. The current ethanol prices in the world are between KSh. 30-35 per litre. In Kenya, the price of ethanol is in the range of KSh. 55-70 per litre24. This would have translated into KSh. 2.178 billions. It is expected that the construction of Tana Integrated Sugar Project would produce 22 million litres of ethanol, which would be equivalent to KSh. 1.21 billions.25 With cane deliveries proposed in this Plan, it is possible to realise considerable amounts of revenue as shown in the Table 4.11. A conventional ethanol plant capital costs about KSh. 1.6 billion26. This implies that eight operational sugar factories would require 12.8 billion to initiate ethanol production projects. Table 4.11: Ethanol Production 2008/09 2009/10 Tonnes 5,165,786 5,110,632 Tonnes 180,802 182,000 Potential Ethanol Produced Litres 39,776,332 40,040,000 2010/11 5,808,049 203,281 44,721,021 55-70 2.5-3.1 2011/12 6,286,269 220,019 48,404,271 55-70 2.7-3.4 2012/13 7,192,730 251,745 55,384,021 55-70 3.0-3.9 2013/14 8,010,834 280,379 61,683,422 55-70 3.4-4.3 Year Cane Deliveries Molasses Produced Cost per litre Potential Revenue KSh. 55-70 55-70 KSh, Billions 2.2-2.8 2.2-2.8 Source: Log Associates, 2009, Projected Ethanol Production Potential and Revenues iii. Producing industrial sugar and industrial alcohol: Projections of sugar consumption indicate that the demand for industrial sugar is expected to continue to increase. Currently, the Kenyan sugar industry does not have the capacity for processing industrial sugar and industrial alcohol. Miwani was the only factory that could process these products. In the 2010-2014 Strategic Plan the industry will revive its capacity for producing refined sugar, industrial sugar and industrial alcohol. The distillery and sugar refinery at Miwani Sugar Company will provide a starting point but the industry as a whole will diversify into these products. iv. Encouraging intensification to increase food security: To reduce exit from cane farming due to pressure from other agricultural produce, the industry will encourage intercropping and mixed farming amongst farmers. 24 25 26 Clint Oguya, Agrochemical, personal communications, 31 August 2009 TARDA Strategic Plan 2008-2012 Each factory should effect a comprehensive feasibility study on the same Strategic Plan, 2010-2014 37 4.5.3 Strategic Objective 3: To Enhance Infrastructure Development Inadequate, unreliable and poor state of physical infrastructure in the sugar growing zones has led to low productivity, high production and distribution costs; and uncompetitive products and service delivery. The industry will improve the state of physical infrastructure by implementing the following strategies: Strategy 3.1: Improve Road Transport Infrastructure This strategy will be achieved by implementing the following activities: i. Setting up a mechanism to coordinate utilisation of public funds available for road infrastructure development ii. Increasing SDF allocation for infrastructure development iii. Dedicating 15% of sugar tax revenue to infrastructure development in the sugar belt Strategy 3.2: Modernise and Promote the Use of Information and Communication Technology (ICT) There are numerous opportunities for the application of ICT in the sugar industry including business process improvement in sugarcane production, office operations, management of OGIs, strategic management, performance monitoring, research and information sharing. Despite such array of uses, the industry has not fully invested, modernised and promoted the use of ICT. Apart from Mumias Sugar Company that has invested in the Agricultural Management Systems (AMS) to coordinate planting, harvesting, transport and milling operations, the ICT infrastructure in most of the sugar factories is still at infancy stage. To tap these opportunities, the industry will modernise and promote the use of ICT by: i. Improving the ICT infrastructure through networking ii. Encouraging e-commerce and e-procurement iii. Increasing training of staff on the use of ICT including the new fibre optic cable architecture iv. Increasing information sharing through ICT 4.5.4 Strategic Objective 4: To Strengthen the Regulatory Framework The passing of the Sugar Act, 2001 went a long way in strengthening the regulatory framework in the sugar industry. However, some of the supporting regulations have not been approved. A number of proposals that would have improved the business environment in the sugar industry including tax proposals are pending approval. To strengthen the legal framework, the following specific strategies will be undertaken: Strategy 4.1: Finalise the Policy and Legal Framework Work- in- Progress and Implement them The review revealed that there were pending actions under the policy and legal framework in the outgoing planning period. The industry will conclude the pending actions by: i. ii. iii. iv. Passing the Sugar Amendment Bill Gazetting Sugar General Rules Harmonizing all sugar laws Finalising and implementing regulations to restructure outgrower institutions Strategy 4.2: Strengthen the Management of Sugar Import Policy Illegal and uncoordinated importations of sugar are major contributors to the sub-sector problems. To address this concern, the industry will: 38 Kenya Sugar Industry i. ii. iii. iv. Enhance capacity for a robust assessment of market conditions Support measures to eliminate tax evasion Support the implementation of rules of origin Strengthen its advocacy role with KRA, Ministry of Trade (MoT), Ministry of Finance (MoF) Ministry of Energy (MoE) and MoA Strategy 4.3: Strengthen the Framework for Corporate Governance Weak corporate governance has been a problem in the industry for a long time. The sugar industry needs to transform itself to profitability and efficiency path through sound management ethics. To address corporate governance challenges, the industry will: i. ii. Ensure prompt payment to farmers Strengthen the management of OGIs, through governance and institutional capacity building programmes iii. Sign sugar industry agreements between millers, growers and other service providers iv. Conclude privatisation of sugar factories v. Establish and implement the framework of implementation and M&E system for the 2010-2014 Strategic Plan Strategy 4.4: Development of an Institutional Framework for Coordination of Roads Maintenance in the sugarbelt There exists an opportunity for the sugar industry, through KSB, to collaborate with central and local government in the utilisation of the petroleum and the local government cess funds, CDF and LATF for road maintenance and rehabilitation. To ensure efficient utilisation of these funds, the industry will: i. Establish a sugarbelt roads management committee comprising KSB, Millers, OGIs and GoK departments responsible for roads. Strategy 4.5: Development of a comprehensive policy on co-generation and exploitation of bio-fuels and other sugarcane products The Energy Act, 2006, sets out the National Policies and Strategies for short, medium and long-term energy development in Kenya. The Minister for Energy has the mandate through the Act, to promote co-generation by sugar millers and sale of the same to the national grid; and promote the production and use of gasohol and biodiesel. However, there is still no comprehensive policy and legal framework to regulate the production and use of these products. In the incoming period, and working closely with the Ministry of Energy, the industry will: i. Support measures to develop a comprehensive policy on co-generation and exploitation of bio-fuels and other sugarcane products. Strategic Plan, 2010-2014 39 Chapter 5 Implementation Strategy and Resource Requirements 5.1 Implementation Strategy Implementation responsibilities of this strategy will be devolved to all levels in order to allow for maximum participation of all the relevant stakeholders. Formal existing institutional structures including the oversight bodies that undertake regulatory responsibilities will be charged with carrying out their appropriate roles. Stakeholder institutions such as millers, OGIs, Cane Transporters, KESREF, KSB and farmers will be accorded their rightful say in the implementation of this strategy. 5.1.1 Implementation Framework Successful implementation of the Plan will depend significantly on a practical implementation framework, which is easy to coordinate. The Kenya Sugar Board (KSB), having the dual legal mandate to develop and regulate the industry should exercise its authority towards the same. KSB needs to remain as the voice of the industry in consultation with all stakeholders. Given the matrix nature of industry decision-making organs, the Plan’s implementation framework will have a wide spectrum of players. 5.1.2 Institutional Structure The implementation of the 2010-2014 Strategic Plan will be the responsibility of the following institutional structures: National Inter-ministerial Coordinating Committee (NICC) The Committee will comprise MoF, MoE, MoA, MoT, MoWI, MoR, MoPW, MoLG and MoRDA. It will deal with policy and legislative issues affecting the industry. The NICC will be convened and chaired by the Permanent Secretary, Ministry of Agriculture from time to time as need arises. Monitoring Committee (MC) The industry will establish a Monitoring Committee (MC) through a legal notice by the Minister of Agriculture to monitor the implementation of this Strategic Plan. The committee will sit twice yearly. Structured reports will be prepared and presented to the Committee by Monitoring and Evaluation Officer who will be stationed at the Kenya Sugar Board headquarters in Nairobi. The Committee will assess progress on the status of Plan’s implementation focusing on the industry adjustment and preparedness for a liberalized trade regime. The Committee will comprise chief executive officers or chairpersons of KSB, KESMA, KESGA, KECATRA and KESREF, representatives from MoA and consumers. The committee will be convened and chaired by the Chairman of KSB Board. The MC will report to the NICC through the KSB Board. 40 Kenya Sugar Industry Stakeholders Review Forum (SRF) The Stakeholders Review Forum (SRF) will comprise senior managers of stakeholder institutions. The Chief Executive, Kenya Sugar Board, will chair it. The SRF will sit quarterly to review the progress of implementation of the Plan based on reports prepared by the M&E Officer. Unit Committees (UC) Factories’, OGIs’ and other stakeholders’ level committees will comprise Unit Committees. These committees will be set-up at respective stakeholder units and will meet monthly. The committees will carry out the specific activities of the Plan and report progress to senior managers sitting at the SRF. The composition of the UCs will be senior technical and managerial staff of the various stakeholder institutions. Figure 5.1 outlines the proposed institutional structure and the implementation framework. Ministry of Agriculture, PS (Chair) Ministry of FinanceMinistry of Energy Ministry of Water and Irrigation Ministry of Trade Ministry of Public Works Ministry of Roads Ministry of Local Government Ministry of Regional Development Authority National Inter-Ministerial Coordinating Committee KSB, Board Chairman (Chair) KESMA KESGA KESREF KECATRA Representative MoA Consumer Representatives KSB, Board Monitoring Committee KSB, CEO (Chair) M&E Officer Senior Management of Stakeholder Institutions Stakeholders Review Forum Factories OGIs KESREF Other Stakeholder Representatives Unit Committees M&E Measure targets, outputs, corrective action Implementation Allocate resources and carry out activities Resources Match Resources and strategies Review the appropriateness of chosen strategy Strategic Objectives Fig. 5.1: Institutional Structure and Implementation Framework Strategic Plan, 2010-2014 41 5.1.3 Private Sector Participation The implementation of this Plan calls for close collaboration and participation of the public and private sector. While privatization is not a panacea, private sector participation brings with it increased financial discipline; capital injection; new management styles; a stronger commercial orientation and some insulation from political interference. The privatization of the Mumias Sugar Company, and the subsequent improvement in performance, is a case in point. In the interim, any decisions made on factories’ rescue, should be synchronized with the proposed privatization actions to avoid investing in low priority interventions. The drive towards diversification and value addition is also likely to be realized if done in the context of wholly or largely privatized sugar subsector. 5.2 Resource Mobilisation and Utilisation The resources required for the Kenya sugar industry to implement the 2010-2014 Strategic Plan include, financial, human and physical resources. Successful implementation of the same will not only depend on the quality and commitment of the stakeholders, but also on the availability and efficient utilisation of resources required to undertake the various activities. Weak corporate governance, high debt burden and lack of funds for investment continue to plague the Government owned mills. This was manifested in delayed farmer payments; lack of routine and preventive maintenance; failure to invest in new machinery; and the overall degeneration of effective processing capacity. The resources from internally generated sources and the Sugar Development Levy are inadequate to meet the scope of activities proposed in this Plan. Table 5.1 is a summary of financial resources requirements for implementing the same. Table 5.1: Plan Implementation Cost Estimates Strategic Objective Enhance sugar industry Competitiveness Expand product base Enhance infrastructure development Strengthen regulatory framework Total 2009/10 2,905 Years (KSh, millions) 2010/11 2011/12 2012/13 2,984 5,725 5,745 Total 2013/14 950 18,309 58 607 55 1,007 55 1,007 9 1,007 5 607 182 4,235 77 77 25 25 25 229 3,647 4,123 6,812 6,786 1,487 22,955 Source: Log Associates, 2009, Plan’s Implementation Cost Estimates The cost inherent in implementing activities outlined in the strategy will be huge. The industry requires at least KSh. 23 billion to implement the activities recommended in this Plan (Annex VII), 15.3 billion to invest in co-generation and 12.8 billion to invest in ethanol production. The industry needs a further KSh. 58 billion to clear all debts on sugar factories and OGIs balance sheets. (Annex VIII). Funding this Plan will require a public-private partnership comprising budget resources, government devolved funds, internally generated funds and loans, grants from development partners and joint venture agreements as discussed below. 5.2.1 Funding Sources To realise the objectives of the 2010-2014 Strategic Plan, there will be various financial sources as briefly explained below: 42 Kenya Sugar Industry i. Internally Generated Funds at Factory Level Most of the sugar companies with the exception of Mumias, Soin, Kibos and West Kenya Sugar Companies are barely making surpluses. The scope for factory generated funds is thus limited for publicly owned factories. These publicly owned factories are looking for grants and soft debt financing. Nevertheless, the funds generated from internal sources will be utilized for factory maintenance, modernisation and rehabilitation. ii. Sugar Development Fund A sugar development levy of 4% of the ex-factory price is charged by the Kenya Government on all sugar sales. This levy is collected by the Kenya Revenue Authority and is managed by KSB as the Sugar Development Fund (SDF). After 17 years of implementation, SDF has grown to become the single largest source of funding for the industry. The fund utilisation per component is shown in Figure 5.2. KSB administration (35%) Research and extension (23%) Cane development (17%) Infrastructure (7%) Factory rehabilitation (18%) Fig. 5.2: SDF Allocation per Component27 At the present state, the sugar industry requires funding on a much larger scale than can be met by the SDF. The funding gaps will be bridged through alternative financing. iii. Soft loan financing and Grants Given the importance of the sugar sub-sector in poverty reduction, infrastructure development, environmental conservation and energy, the subsector will continue to attract concessional funding from development partners. The industry will also continue seeking for financial grants from the GoK. iv. Loans The sugar industry is already attracting donor funds from a variety of sources including the European Union (EU) and CFC. The subsector can attract more funds from a range of initiatives including energy, environment, water and sanitation, and rural roads, all of which have a direct impact on sustainable development and MDGs. The industry will therefore prepare and present proposals to willing donors for the purposes of sourcing for funds for its development. v. 27 CDF/LATF Funds The sugar industry will collaborate with institutions implementing the CDF and LATF funded projects to harness the resources directed towards infrastructural development in the sugarbelt. KSB, SDF Operational Manual, February 2006 Strategic Plan, 2010-2014 43 vi. Carbon Credits Carbon credits are a key component of national and international attempts to mitigate the growth of concentrations of greenhouse gases. One carbon credit is equal to a tonne of carbon. The sugar factories through cane farming, co-generation and ethanol production will produce environmentally friendlier energy sources, which will allow them to enter into agreements with Carbon Finance Companies around the world, through Clean Development Mechanism (CDM). These credits will be exchanged for hard currencies to help finance some of the activities in this Plan28. viii. Joint Venture Agreements Joint ventures are strategic weapons used by organisations to enhance competitiveness. A joint venture is an agreement formed by two or more parties to undertake an economic activity together. The parties agree to contribute equity, share revenue, expenses and control the enterprise. In the incoming Plan period, the industry will enter into joint venture agreements with like-minded organisations/corporations to undertake some of the strategies/activities highlighted in this Plan. Possible areas for such agreements are power-cogeneration, ethanol production and irrigation. 5.2.2 Human Resources Whilst there are many skilled personnel in the country, the industry has excess unskilled staff. The industry lacks human resources capacity to carry out the wide range of research that the industry needs. Most of the farmer institutions have also failed to provide essential extension services to the farmers. To meet the human resources gaps, the industry will carry out staff rationalisation to determine the level of human resource requirements under the strategy for enhanced human resource capacity. 5.3 Accountability Accountability for the implementation of this Plan and the use of resources will critical since it will require proper utilization of financial, human and material resources. This demands that all stakeholders in the sugar industry and other sectors take responsibility and be accountable for their use. All institutions using industry resources will account for the same in accordance to the laid down regulations and procedures. 5.4 Implementation Risks There are several risks to the implementation of this Strategic Plan, including the timely availability of resources and political goodwill. This requires that possible risks be analysed to take precautionary measures in good time and prevent failure of the Plan’s implementation. The following are some of the major risks identified for consideration: i. Failure to Realize the Privatisation Process: The survival of the Kenya sugar industry appears directly pegged to privatization and subsequent private sector participation in increasing efficiency. Failure to divest GoK shareholding in the industry portends doom. ii. Poor Plan Implementation: All of the participating institutions need to diligently carry out the actions identified in Chapter 4. Failure to carry out the changes needed to make the industry more 28 Corporations like Mumias, Ken-Gen just to mention a few, have already signed carbon credit agreements through the Clean Development Mechanism (CDM). The CDM is a support scheme under the United Nations Climate Convention and the Kyoto Protocol. 44 Kenya Sugar Industry efficient and competitive, will pose a major risk to the industry. Individual institutional plans that are intended to help achieve the global industry objectives need to be developed and implemented diligently. iii. Lack of Political goodwill: Political goodwill is necessary for the implementation of this Strategic Plan. If political goodwill is lacking, there remains the risk of failure in implementing the same. iv. Lack of resources: Resources are essential for the implementation of the activities highlighted in this Plan. Inadequate human, financial and other resources pose risks to the implementation of these activities. v. Insecurity: Insecurity is both a threat to human life and a major risk against the objective of attracting investment. It also often causes disruption of planned activities, leads to business losses and increases business costs. For meaningful private sector investment, the industry must operate in a conducive and secure environment. vi. Poor Communication: The absence of an effective and agreed communication strategy may result in poor information flow and thereby delay decision-making. This will result in a risk of failure and/or delay in the implementation of the Plan. vii. Lack of Ownership: The lack of ownership by the stakeholders, for instance farmers, may lead to failure in the implementation of the strategic plan. viii. Resistance to change/negative attitude: Resistance to change by farmers, transporters, millers and outgrower institutions may result in failure or delay in the Plan’s implementation. 5.4.1 Risk Mitigation Framework The matrix below gives a list of the risks, their ranking and suggested mitigation strategies. Table 5.2: Risk Mitigation Framework No. Risk Priority Mitigation Measure 1. High Accelerate the ongoing privatisation efforts 2. Failure to realise privatisation process Poor Plan Implementation High 3. Lack of Political goodwill High Close monitoring and tie funding to agreed performance outcome Strong lobbying for political goodwill and issue-based decisions 4. Lack of resources High Design and implement a Sugar Restructuring Programmes 5. Insecurity High 6. Poor Communication Medium Liaise with Provincial Administration to address insecurity concerns in the sugar subsector Prepare and implement a communication strategy to ensure effective information flow. 7. Lack of ownership Low 8. Resistance to change/ Negative attitude Low Consultation and involvement of stakeholders at all stages of strategy formulation and implementation Create awareness of the intended changes in good time through active participation and discussions with stakeholders Strategic Plan, 2010-2014 45 Chapter 6 Monitoring, Evaluation and Reporting 6.1 Monitoring The successful implementation of this Plan will depend largely on how the activities and outputs are effectively monitored and evaluated. The Plan’s monitoring will be through the institutional arrangements defined in section 5.1.2 of this report. Monitoring will be done using the instrument provided in Annex IX. The instrument has expected outcomes, indicators and annual targets for gauging performance. Monitoring will help determine whether the implementation is on track; establish the need for any adjustment in light of the changes in the sugar subsector and political environment. 6.1.1 Monitoring Mechanism Institution Strategic Plans For ease of monitoring, the sugar industry stakeholders will align their objectives and strategies with the Kenya Sugar Industry Strategic Plan 2010-2014. The individual strategies should have clearly defined activities with specific timelines for implementation. The realisation of the individual strategic plans will feed into the overall objectives of the sugar industry. Supervision The KSB will carry out supervision of the overall Plan’s implementation and prepare quarterly reports. This will require the cooperation of all industry stakeholders. Findings from the supervision missions will be presented to the MC and follow-up actions discussed. KSB will ensure prompt submission of the reports. Service Delivery Surveys The MC will organize surveys on the quality of service delivery. The information from such surveys will be disseminated to all the stakeholders. Quarterly Review Meetings (QRM) Stakeholders review sessions will be held quarterly with stakeholders’ representatives. This is will keep the Plan’s activities and outputs on track during implementation, and enable the stakeholders to identify and take necessary actions to address emerging challenges. This is will give the industry a chance to interrogate what is being done. The QRM will be undertaken through the SRF. 6.2 Evaluation The Plan will be subjected to four evaluations, which are two Internal Annual Evaluations; MidTerm Evaluation and Review; and Final Evaluation. The evaluations will be done using the indicatormonitoring tool provided in Annex X. 46 Kenya Sugar Industry 6.2.1 Internal Annual Evaluation (IAE) To ensure that the experiences of the previous Plan’s implementation are not repeated, the industry will undertake two internal annual evaluations of the Plan. The first annual review will be held at end of the year 2010. The second annual review will be held at the end of the year 2013. The two evaluations will be done by an independent team of consultants with experience in the sugar industry. 6.2.2 Mid-Term Evaluation and Review (MTER) The purpose of the Mid- Term Evaluation and Review (MTER) will be to assess the extent to which the Plan is meeting its implementation objectives and timelines. The MTER will be carried out in December 2011, three months before the expiry of the COMESA protocol and will therefore provide an opportunity to: (i) assess readiness for the open trade regime; and (ii) provide recommendations for the remaining phase of the Plan. The MTER will be done by an independent team of consultants. 6.2.3 Final Evaluation The prime purpose of the Final Evaluation for the Strategic Plan 2010-2014, expected to be carried out at the end of May 2014, will be to address four issues: • • • • Effectiveness (Impact): The extent to which the implementation of activities met the stated strategies and objectives Sustainability: Assesses the sustainability of the achievements made Lessons Learnt: Document lessons learnt Terms of Reference (TORs): Prepare the TORs for the next strategic plan. 6.3 Reporting Reporting the progress of implementation will be critical in adjusting strategic directions and measuring performance. Progress reports will be made on quarterly basis. The reports will outline in summary form projected targets, achievements, facilitating factors and challenges. The reports will be prepared and submitted by unit committees to the SRF, where a summary report will be prepared and submitted to the MC for review. Issues that will require policy interventions will be forwarded to the NICC through the KSB Board. 6.4 Information Sharing Information sharing and reporting will be key in reviewing this Plan. It will also provide a mechanism for monitoring and evaluation. Various stakeholders have established websites through which information can be shared. Additionally, the industry stakeholders will be meeting quarterly to share amongst themselves and report emerging challenges. Reports on the implementation status of the Plan will also be made available quarterly and annually by KSB. 6.5 Conclusion The revised Kenya Sugar Industry Strategic Plan 2010-2014 focuses on objectives, strategies and activities that will enhance industry’s competitiveness. If truly implemented, it will lay a firm foundation for the industry to become efficient, diversified and globally competitive. Strategic Plan, 2010-2014 47 Annexes Annex I: Strategic Objectives and Actions (2004-2009) Strategic Objective Strategic Actions 1. Increase sugarcane production and productivity • • • • • Strengthening research –extension- farmer linkages Irrigation Development Motivation to cane farmers to intensify production Land reform in sugar growing areas Expansion of sugar cane growing into new areas 2. Increase sugar production • • • Enhance management capacity within the industry institutions Optimise existing factory capacity Modernising existing factories 3. Expand product base • Product diversification 4. Strengthen Policy, Legal and Regulatory Framework • External interventions • Policy reforms on taxation • Classify sugar as special commodity • Review and implement policy of Revitalisation of Sugar industry • Institutionalise inter-ministerial standing committee on sugar Internal interventions • Review Sugar Act 2001 and its regulations • Develop and document procedures for arbitration among stakeholders • Adopt good corporate governance practices • Implement industry standards on Environmental Health and Safety • 5. Privatisation of Sugar Institutions • • • • • Promotions to attract financial service providers Management and financial restructuring Transformation of farmer institutions from advocacy to service provision Promotion of private sector partnerships Divestiture of GoK shareholding 6. Sustainable Funding for Industry, • • • Internally generated funds Sugar Development Fund (SDF) External Sources 7. Stream Supply Chain management • • • • • • Institutionalisation of policies, strategies and structures Monitoring cost reduction programmes Establishment of Central procurement body for the industry Transforming Stakeholder apex to central procurement units Lobbying for e-commerce in procurement Establish industry consultative forum to negotiate on pricing, costing, timing and improved provision of goods and services 8. Adopt World Class Standards • • • • • • • Develop and implement appropriate standards and policies Establish a national quality control laboratory for the industry Develop and adopt appropriate service delivery standards Develop ICT strategies and systems for the sugar industry Benchmarking with best practices in the world Keeping up to date trends and statistics from leading global sugar producers Adapting to the existing multilateral trading arrangements 9. Enhance SocioEconomic Development and Environmental Management • Enhance industry contribution to socio-economic development in sugar growing areas and the country as a whole. Improve industrial relations in the sub-sector Development and improvement of infrastructure Increased environmental health and safety Effective marketing strategy 48 Kenya Sugar Industry • • • • Strategic Plan, 2010-2014 49 Technological Social Economic • • • • • • • • • • • • • • • • Political High cost of advanced technologies Low negotiation capability Low adaptability of advanced technology Language barriers resulting in additional transactional costs Drug trafficking and Drug abuse leading to reduced productivity Human trafficking and brain drain Increasing Oil prices Increasing food price Counterfeiting WTO) agreements on bilateral trade Standards Non-Tariff Barriers (e.g Minimum Residue Limits) Sanitary and Phytosanitary standards World focused mostly on Governance and Human Rights Terrorism Global Issues Annex II: PESTLE Analysis • • • • Low funding for Research and Development Language Barriers High HIV/AIDS prevalence Regional conflicts Increasing food prices Obligations under Regional Agreements And Standards Non-Tariff Barriers (NTBs) World Trade Organization (WTO) agreements on bilateral arrangements • • • • • Piracy along the Somalia coastline Conflicts (Darfur Crisis, Southern Sudan, Eritrea/Ethiopia) • • Regional • • • • • • • • • • • • • • • • • • • • Private Mills (Mumias, West Kenya, Soin and Kibos) have invested in upgrades, but parastatals Mills are mired in debt and unable to upgrade or even carry out routine maintenance Low funding for Research and Development Slow pace of transformation to shorter maturity cane varieties High population growth rate Low literacy levels High HIV/AIDS and malaria prevalence Language barriers High crime rates Economic crimes (money laundering, corruption, fake currencies), Increasing Oil prices Food insecurity Poor enforcement of tax laws and International Agreements and Standards Counterfeit goods High inflation Underdeveloped export market access for sugar Low funding for export market development Regional crises diverting attention and resources from local needs Lack of a long term roadmap for the development of the sugar belt Ministry of Agriculture starting to focus but it needs to be structured National • • • • • • • • • • • Lack of competitiveness Need for an injection of capital to assist in Mill modernization through privatization and dilution of public capital holding in sugar factories Language barriers and insecurity increase costs of doing business Diseases leading to absenteeism and low labour productivity Drug abuse reduces productivity Unfair competition A disenabling investment climate Strong competitive pressure Need for increased efficiency in the sugar industry Need for increased funding for market development Uncertain investment climate Effect 50 Kenya Sugar Industry • • • Climate change and desertification Slow domestication of Multilateral Environmental Agreements(MEAs) High legal costs • • Climate change and desertification Slow domestication of Multilateral Environmental Agreements(MEAs) National Ratification of Regional Treaties Rapid degradation of water towers, biodiversity and habitats Declining availability of fresh water Pollution and waste management Poor enforcement of environmental standards • • • • • • • • Weak institutional capacity in the sugar industry Bureaucratic regulatory and administrative framework Few qualified personnel on commercial law (both bench and bar) Informality of businesses High legal costs • KESREF KIRDI • Kenya Sugar Board • • • • • • • • Government (MoA) Breeding appropriate cane varieties Recommending appropriate fertilizers Appraising, studying, developing and monitoring technologies Pest and diseases, agronomic packages, farm machinery, environment and safety issues in sugar. Carry out industrial research Regulate, develop and promote the sugar industry Coordinate activities within the industry Facilitate equitable access to benefits and resources Sector coordination and policy formulation Responsibilities Stakeholders Policy formulation Regulation Coordination Strategy setting Advisory Research Innovation • • • • • • • Comparative Advantage • • • • Enhanced research-extension –farmer linkages High and sustained technology adoption rates Efficient, effective quality service delivery Overall sector Target Annex III: Stakeholder Comparative Advantage Analysis Environment Legal Climate-dependent sectors such as agriculture adversely affected Degrading environment impacting the poor adversely Need for simplification of regulations Need for increased corporatization Need for stricter contract enforcement Performance standards needed for Judiciary • • • • • • • Conduct more research into new early maturing seed varieties that are disease resistant and have high sucrose content Increase farmer training Increase research on irrigation, processing, harvesting , transport and marketing Issue licenses Provide regulations, procedures and guidelines on various areas of operation in the industry Link to the government Provide policy direction in the sugar sub-sector What they can do to the sugar industry • • • • • • Strategic Plan, 2010-2014 51 • • • • • • • • • Other Institutions: KESGA,KESMA, Transporters Consumers Universities and Research Institutions • • • • • • Sugar Millers Outgrower Institutions Farmers Training Research Innovations Buy sugar Cane Transport Advocacy for outgrowers and millers Purchase and mill sugarcane Market sugar and its by-products Grow, harvest and transport cane Coordinate all cane growing activities Supply quality seed cane Harvest and transport cane To produce quality cane with high sucrose content Adopt recommended crop husbandry practices Elect competent representatives • • • • • • • Science, technology and innovation Feedback on sugar quality Transportation Advocacy Processing Input supply Cane Production • • • • • • • • • • Highly trained personnel Increased collaboration Good quality sugar at competitive prices Reduced Transport cost Effective service delivery to farmers Efficient supply chain management Increased sugar and co-products production Must seek to satisfy farmers, transporters Increased cane production Competitive return to land and labour • • • • • • • • • Innovate new products and technologies of sugar production Broaden product base Market intelligence Demand quality and competitive prices Provide transport services Reduce on-transit cane losses Encourage technology adoption and its implementation Advocate for efficient supply chain management Increased efficiency in sugar processing Must become key partners in the drive for efficient sugar production • • To be business oriented Ensure food security through intercropping, border cropping Reduce land subdivision • • 52 Kenya Sugar Industry Transporters, Millers, Farmers, cane cutters Farmers, Transporters, Millers, KSB, MoA (GoK) KESREF, KSB, Millers, MoA Reducing time lapse between cane maturity and harvesting Promoting the use of other modes of transport Increasing research funding for harvesting and transport Farmers Ratooning Transporters, OGIs, Farmers Farmers, KSB, KESREF, MoA Implementing a land tenure policy that encourages economies of scale Reducing post-harvest losses KESREF, Farmers, OGIs, Millers Enhancing results oriented researchextension-farmer linkages to accelerate adoption rates Millers, Transporters KSB, Millers, Insurance firms, Farmers Creating an insurance scheme to cushion the farmers from losses arising in the industry Improving cane yard management KESREF, MoA, Farmers, MoWI, KSB Developing the use of and financing irrigation for sugarcane production Efficient, Reliable Harvesting and Transport Operations Farmers, KESREF, OGIs, Millers, KSB Increasing sugarcane production and productivity through efficiency farm operations Reduction in Farm Level Risks Responsibility Activity Strategy Strategic Objective 1:- To Enhance Sugar Industry Competitiveness Annex IV: Results Matrix (2010-2014) • • • • • • • • • • • • • • • Improved cane transport system Lower unit transport cost Timely harvesting Efficient scheduling of transport operations Increased cane supply Lower Caneyard losses Reduced cycle times Reduced cane production cost Block farming Satellite villages Higher productivity High of high yielding and early maturing varieties in the total crop Lower farm level risks Higher yields Higher yields at lower costs Output • • • • • • • • • • • • • • • • % of harvesting and transportation in total cost Share of transport in production cost % of cane harvested at maturity Timeliness of evacuation from farm Cycle time lapse % of losses Reduced staleness index Improved sugar quality % of ratoon crops Reduced land subdivision Increase adoption to high yielding varieties % of incidence covered Change in farm level investment Area under irrigation % of water recycled into irrigation Area under cane, yield levels/ha, sucrose content Output Indicators 2012 2012 2010-2011 2010-2014/ Continuous 2010-2014/ Continuous 2010/ continuous 2011/ continuous 2011/ Continuous 2011 2010-2014/ Continuous 2010-2014/ Continuous Timeframe Strategic Plan, 2010-2014 53 Streamlined corporate governance Enhanced Human Resource Capacity Effective, Efficient and Reliable Milling Operations All stakeholders All stakeholders All stakeholders Improvement of communication amongst industry stakeholders and the rest Training on prudent financial management Millers, KSB, Consumers Sensitization of industries on quality standards and certification requirements Advocacy on governance, security, high cost of doing business, among others Millers, KSB, Consumers Millers, KESREF, OGIs, Universities Strengthening industry collaboration with training institutions Ensuring the undertaking of International Organization of Standards (ISO) certification Millers, OGIs, KSB, KESREF Implementing a performance appraisal system KSB, Millers, OGIs, KESREF, Consumers Millers, OGIs, KESREF, KSB Signing of performance contracts Conducting periodic Customer Satisfaction Surveys(CSS) Millers, KSB, OGIs KSB, Millers, OGIs Benchmarking with international standards Preparation of staff retention policy KESREF,KIRDI, Universities Intensifying industrial and applied research KSB, Millers, OGIs, KESREF Millers, KSB, MoA, GoK, Private sector Creating economies of scale Undertaking training needs assessment and implementing its findings Millers, Private Sector, KSB, KESREF Increasing sugar production through efficient processing • • • • • • • • • • • • • • • Efficient financial management Efficient communication systems Good corporate governance Quality Standards Quality standards Report on quality service delivery Increased skilled human resource pool Good Performance Optimal performance Optimal staff levels Number of Staff trained Best practices New technologies Lower production costs Higher sugar production at lower cost • • • • • • • • • • • • • • • • Profit margins Rate of information flow % of factories that are self sustaining % of customers receiving quality service ISO Certification % of customers receiving quality service Collaboration agreements reached Level of targets being achieved Number of performance contracts signed Number of staff retained Efficient, effective and motivated staff Optimal staff levels retained International standards adopted New technologies introduced Integration of factories, mergers, acquisitions Capacity utilised, FTE, recovery rates, 2012 2012 2012 2012 2012 2012 2014/ continuous 2010/ continuous 2010/ continuous 2010/ continuous 2011 2014 2014 2012 2010-2014 54 Kenya Sugar Industry KSB, Millers Farmers, OGIs, Transporters, Millers and Distributors Millers, KSB Millers, Private sector Partnerships Millers, Private sector Partnerships Millers, Private sector Partnership Commissioning and undertaking value chain analysis and product diversification studies (feasibility, technological and economic studies) Implementation of recommendations from the value chain analysis and product diversification study Developing diversification programmes tailored to suit specific factory requirements in line with market opportunities Initiating co-generation projects Initiating ethanol production projects Producing industrial sugar and alcohol KSB, GoK, MoR, MORDA, MOLG KSB, SDF committee KSB, MoA, MoF, GoK Activity Setting up a mechanism to coordinate utilisation of public funds available for road infrastructure development Increasing SDF allocation for infrastructure development Dedicating 15% of sugar tax revenue to infrastructure development Strategy Improve road transport infrastructure Responsibility OGIs, KESREF, Millers, Farmers Responsibility Encouraging intensification to increase food security Activity Strategic Objective 3:- To Enhance Infrastructure Development Value Addition and Product Diversification Strategy Strategic Objective 2:- To Expand Product Base Industrial sugar and alcohol Ethanol Electricity New product lines Recommendations adopted Reports Integrated and intensive farming Increased food supply • • • Improved infrastructure Infrastructure development Coordinating mechanism Output • • • • • • • • Output Tonnes of industrial sugar produced Litres of industrial alcohol produced Litres of ethanol produced Amount of electricity supplied to the grid Number of new products reaching the market Number of viable recommendations Number of studies completed Number of famers practising integrated farming Number of farmers exiting cane production • • • Amount of sugar tax revenue allocated to sugar SDF allocation to infrastructure Amount fund allocated to roads Output Indicators • • • • • • • • • Output Indicators 2010 2010-2014 2010-2014 Timeframe 2013 2013 2013 2012 2011 2011 2010-2014 Timeframe Strategic Plan, 2010-2014 55 All stakeholders KSB. OGIs, Millers KSB, Millers, OGIs Encouraging E-commerce and E-procurement Increasing training of staff on the use of ICT Increasing information sharing through ICT Development of a Legal Framework for Corporate Governance Millers, KSB GOK Farmers, OGIs, KSB, MoA KSB, OGIs, GOK Millers, Farmers, Transporters, cane cutters All stakeholders, Conclude privatisation of sugar factories Strengthen the management of OGIs, through governance and institutional capacity building programmes Strengthen the management of OGIs Sign sugar industry agreements between millers, growers and other service providers Establish framework of implementation and M&E system KRA, MoT, MoF, MoE, MoA, KSB Strengthen advocacy role with other stakeholders Ensure prompt payment to farmers KRA, KSB Finalise and implement regulations to restructure OGIs Support measures to eliminate tax evasion KSB, MoA, OGIs, Farmers Harmonise all sugar laws KSB, GOK All stakeholders Gazette the Sugar General Rules Enhance capacity for a robust assessment of market conditions KSB, MoA Pass the Sugar Amendment Bill Finalise the policy and legal framework work-in-progress and implement them Strengthen the management of Sugar Import Policy Parliament, MoA Activity Strategy Responsibility All stakeholders Improving the ICT infrastructure through networking Strategic Objective 4:- To Strengthen the Regulatory Framework for the Sugar industry Modernise and promote the use of ICT Information market place e.g. Website, emails etc. Pool of skilled personnel Streamlined procurement procedures Networked sugar industry • • • • • • • • • • • • • Implementation Framework M&E system Improved service delivery More effective and efficient OGIs Management efficiencies Privatised sugar subsector Timeliness of Payment Higher revenues to KRA and SDF More accurate of import requires Efficient outgrower institutions Sugar Laws Sugar General Rules Revised Sugar Act Output • • • • Number of stakeholders with websites Number of staff trained Number of e-procured items Common sugar industry database • • • • • • Number of agreements signed Numbers of OGIs restructured Numbers of mills privatised Time lapse between cane delivery and payment % change in SDF collection Accuracy of estimates Output Indicators • • • • 2010 2010 2010-2014 2010 2010-2012 2010-2014 2010/ continuous 2010-2014 2010-2014 2010 2010 2010 2010 Timeframe 2010 2010-2014 2012 2011 56 Kenya Sugar Industry Support measures to develop a comprehensive policy on co-generation and exploitation of bio-fuels and other sugarcane products Establish a sugarbelt roads management committee KSB, MoA, MoE 7 8 1 2 3 4 5 6 7 Throughput Capacity Utilization % Sugar Made (T) Cane crushed (TCY) TCD - Designed TCD - operational Mill Numbers TCH OTE % FTE % Available extraction time(days) 6 Out of field crop, Days 2 Annual & mini maintenance, Days Crop length (Average) Days 1 Time Account Cane fibre % Cane pol % PARAMETERS 3 1 Cane quality EFFICIENCY 85,810.59 15 296.25 80.46 94.65 201.95 251 68.4 - 14.97 80.46 2,402,763.00 21,156,562.00 106,650.00 RSA 12.99 • • 77.38 500,937.00 4,179,975.00 23,379.12 18,089.98 3 324.71 77.38 90.74 186.48 241 87.81 124 13.74 13.7 Swaziland KSB, Millers, MoR, MoLG, GoK Annex V: Benchmarking with Competitors Development of a comprehensive policy on co-generation and exploitation of bio-fuels and other sugarcane products Development of an institutional Framework for Coordination of Roads Maintenance in the sugarbelt 14 81.46 512,372.00 4,231,784.00 22,148.88 18,042.48 2 461.44 81.46 89.45 194.69 239 81.54 126 14.01 Zimbabwe Comprehensive policy Framework for coordination of roads maintenance 170 15.11 13.96 82.68 215,484.00 1,817,273.00 11,216.88 9,273.56 2 233.69 82.68 92.67 161.22 195 89.4 61,455.05 710,845.00 2,790.24 2,494.47 1 116.26 89.4 73.31 286.08 320 5.61 45 18.47 10.78 Uganda Functioning committee 111.96 Malawi • 80 1,432,569.60 13,023,360.00 50,400.00 40,320.00 7 300 80 92 294 323 - 42 15.5 13.5 Kenya long term 2012 2012 Strategic Plan, 2010-2014 57 2 3 4 5 6 Undetermined losses % ERC % sucrose in cane ROR % Rendement % RBHR R/Extraction % 1.92 86.05 86.24 11.36 88 98 1.74 86.38 86.99 11.98 89.55 96.39 9,000 39,440 Soin Kibos & Allied Sugar Industries Miwani Mumias Nzoia West Kenya SONY Butali Trans Mara Kwale International Sugar Co. TARDA Total 3. 4. 5. 6. 7. 8. 9. 10. 11. 12. 13. 3,000 1,000 1,000 3,120 2,500 3,360 9,200 800 800 100 2,200 Muhoroni 2. 3,360 Chemelil TCD 1. Factory Annex VI: Capacity of Existing and Proposed Sugar Factories Source: Kenya Sugar Board 1 Separation efficiency 3.14 86.48 85.6 12.11 88.04 96.68 2.93 87.15 85.14 11.86 87.53 97.06 0.12 _ 83.81 11.56 86.67 96.75 2 86.25 86 11 89 96.63 58 Kenya Sugar Industry Effective, Efficient and Reliable Milling Operations Benchmarking with International standards 6. 7. 5 5 5 Providing information on production technologies and quality standards and facilitating their application, adaptation and uptake Providing information on international best practices for local millers to benchmark themselves Participating in regional and international negotiations on issues affecting the sugar industry 100 50 80 Intensify industrial and applied research Carry out regular condition maintenance 5 5 5 100 2500 2500 Invest in rehabilitation of the mills and upgrade them to more modern and efficient technology. Increase processing efficiency 20 14 12 6 Increasing research funding for harvesting and transport Promoting the use of other modes of transport 15 5 Increasing ICT use in scheduling of cane harvesting and transport operations 10 10 5 10 20 15 250 15 2011 5 5 5 100 150 5000 20 20 20 15 10 25 30 300 20 2012 5 5 5 100 150 5000 20 20 25 15 0 30 50 300 20 2013 Estimated Costs (KSh. Millions) Reducing post-harvest losses Improving cane yard management 6 Enhancing results oriented research-extension-farmer linkages to accelerate adoption rates Strategic Objective 2: To Expand Product Base Efficient, Reliable Harvesting and Transport Operations 5. 6 200 Creating an insurance scheme to cushion the farmers from losses arising in the industry Developing the use of and financing irrigation 2. 3. 4. 10 2010 Activities Increasing efficiency in sugarcane production Reduction in Farm Level Risks Strategy 1. Strategic Objective 1: To Enhance Sugar industry Competitiveness Annex VII: Plan Implementation Cost Estimates 5 5 5 100 150 0 20 20 30 15 0 30 50 400 20 2014 25 25 25 100 600 15000 92 80 95 60 30 111 151 1450 85 Total Strategic Plan, 2010-2014 59 Value Addition and Product Diversification 3 0 50 Commissioning and undertaking value chain survey analysis and product diversification studies Implementation of recommendations from the value chain analysis and product diversification study Developing diversification programmes tailored to suit specific factory requirements in line with market opportunities Improve road transport infrastructure 3 3 Increasing training of staff on the use of ICT 100 Funding road development Increasing information sharing through ICT 500 Increasing SDF allocation for infrastructure development Setting up a mechanism to coordinate utilisation of public funds available for road infrastructure development 13. Development of a Institutional Framework for Coordination of Roads Maintenance in the sugarbelt 12. Strengthen Framework for Corporate Governance 11. Strengthen Management of Sugar Import Policy Total Budget Estimate Establish a sugarbelt roads management committee 3,647 5 50 10 Conclude privatization of sugar factories Establish and implement a M&E system for strategic plan 2010-2014 0 5 Ensure prompt payment to farmers 1 1 Support measures to eliminate tax evasion Support implementation of rules of origin Strengthen the management of OGIs 5 Enhance capacity for a robust assessment of market conditions Strategic Objective 4: To Strengthen the Regulatory Framework for the Sugar industry 10. Promote the Use of ICT: 9. 1 5 Encouraging intercropping and mixed farming to enhance food security reduce exit from cane farming Strategic Objective 3: To enhance Infrastructure Development 8. 4,223 5 10 50 5 0 1 1 5 3 3 500 500 1 50 0 0 5 6,812 5 10 0 5 0 0 0 5 3 3 500 500 1 50 0 0 5 6,786 5 10 0 5 0 0 0 5 3 3 500 500 1 0 0 4 5 1,487 5 10 0 5 0 0 0 5 3 3 100 500 1 0 0 0 5 22,955 25 50 100 25 0 2 2 25 15 15 1700 2500 5 150 0 7 25 60 Kenya Sugar Industry Coastal Sugar Belt ( Ramisi) 16,585 692 11,963 - 11,963 - 3,930 361 22 3547 - Interest Source: State of SDF Funds, KSB. 13,835 254 South Nyanza Sugar Belt ( Sony Sugar) Grand Total 9,774 - 9,774 - Sub-total Western Sugar Belt West Kenya Sugar Co. Nzoia Sugar Co. Busia Sugar Co. 3,807 104 Muhoroni Sugar Co. Sub-total Nyando Sugar Belt 366 3337 - Principal GoK loans Miwani Sugar Co. Agro Chemical Co. Chemelil Sugar Co. 839 152 5 - 5 - 682 654 28 - - Principal 2,093 201 0 - 0 - 1892 1,892 0 - - Interest Financial Institutions Loans 4,682 355 1,089 - 787 302 3,238 1268 1,875 - 95 Principal 802 87 272 - 199 73 443 303 134 - 6 Interest Non performing SDF Loans 3,252 242 1,471 - 1471 - 1,539 527 411 - 601 566 566 - - - - - - - Penalties KSh., Millions Levy Arrears SDL 3,311 - 1,321 - 1,321 - 1,990 0 1,433 - 557 Principal 3,181 - 937 - 937 - 2,244 2,244 - Penalties Statutory payments e.g. Taxes Annex VIII: Loans and Grants to Sugar Factories (31 December 2007) 95 95 - - 0 0 0 - Farmers Arrears 972 23 200 - 200 - 749 175 - - 574 Performing SDF Loans 14,627 331 6,744 - 6,744 - 7,552 4,684 2,153 - 715 Other Creditors 58,096 - 2,998 27,032 - 26,657 375 28,066 9,968 8,666 6,884 2,548 Total Strategic Plan, 2010-2014 61 Ha Ha Ha Ha TC/ Ha x. Kwale International** xi. Transmara** xii. Miwani* Total area under cane Yield per hectare *Miwani Rehabilitated and Operational by 2011 **New factories operational by 2013 Ha ix. Butali** 2008/2009 Ha Ha vi. West Kenya Ha Ha SONY v. vii. Soin Ha iv. Nzoia viii. Kibos 2008/2009 Ha iii. Mumias 2008/2009 2008/2009 2008/2009 2008/2009 2008/2009 2008/2009 2008/2009 2008/2009 2008/2009 2008/2009 2008/2009 2008/2009 Ha Ha Ha Base Year Chemelil i. Area under cane Optimal yield levels Unit ii. Muhoroni Indicator Outcome Outcome Indicator: Tonnes of cane harvested Outcome: Optimal yield levels Goal: Enhanced Sugar industry Competiveness Firm/Farm Level Annual Targets Annex IX: Annual Targets Monitoring Indicators 73 169,421 4,633 - - - 2,622 4,638 22,070 19,322 23,899 64,637 14,259 13,341 Base Value 79 177,892 4,633 - - - 2,753 4,870 23,174 20,288 25,094 67,869 14,972 14,008 2009/10 84 196,682 4,865 3,000 5000 2,600 2,884 5,102 24,277 21,254 26,289 71,101 15,685 14,625 2010/11 90 206,363 5,096 3450 5500 2860 3,015 5,334 25,381 22,220 27,434 74,333 16,398 15,342 2011/12 95 215,290 5,328 3600 6000 3120 3,146 5,566 26,434 23,186 28,679 77,111 17,111 16,009 2012/13 100 224,925 5,560 3750 6250 3250 3,278 5,798 27,588 24,153 29,874 80,874 17,874 16,676 2013/14 62 Kenya Sugar Industry 62,242 2008/2009 2008/2009 2008/2009 Ha Ha Ha Ha Ha Ha Ha Ha Ha Ha Ha Tonnes % Tonnes iii. Mumias iv. Nzoia SONY v. vi. West Kenya vii. Soin viii. Kibos ix. Butali x. Kwale International xi. Transmara xii. Miwani Total Tonnes of Cane Harvested Post-harvest losses Cane delivered to mills - 2008/2009 Ha ii. Muhoroni 2008/2009 2008/2009 2008/2009 2008/2009 2008/2009 2008/2009 2008/2009 2008/2009 2008/2009 2008/2009 2008/2009 5,165,786 5 5,125,821 - - - 1,326 297 7,480 5,489 5,909 27,191 5,507 9,043 Ha 2008/2009 Ha Chemelil i. Base Value Area of Cane Harvested Base Year Optimal Harvesting and Transport Schedules Unit Indicator Outcome Outcome Indicator: Tonnes of cane harvested and delivered to mills Outcome: Optimal Harvesting and Transport schedules Goal: Enhanced Sugar industry Competiveness Harvesting and Transport Annual Targets 5,110,632 4 5,323,575 70,981 - - - - 1,404 314 7,034 8,559 7,730 29,053 7,105 9,782 2009/10 5,808,049 3 5,987,680 74,846 1,076 - - - 1,471 303 7,565 9,208 8,316 28,740 7,643 10,524 2010/11 6,286,269 2 6,414,560 80,182 1,248 - - - 1471 325 8105 9866 8910 30,792 8189 11,276 2011/12 7,192,730 2 7,339,520 91,744 1,463 1,345 3,360 1,345 1,604 347 8,645 10,524 9,504 32,845 8,735 12,027 2012/13 8,010,834 2 8,174,320 102,179 1,614 1,560 3,898 1,560 1,672 338 9,618 11,707 10,574 36,540 9718 13,380 2013/14 Strategic Plan, 2010-2014 63 2008/2009 % % % % % % % % % % Tonnes iv. Nzoia SONY v. vi. West Kenya vii. Soin viii. Kibos ix. Butali x. Kwale International xi. Transmara xii. Miwani Recovery Levels Sugar Made *Projected Sugar consumption by 2014 – 877,133 tonnes of sugar *Export potential – 500,000 tonnes Industry long term goal – 1,432,569 tonnes of made sugar 2008/2009 % iii. Mumias 2008/2009 2008/2009 2008/2009 2008/2009 2008/2009 2008/2009 2008/2009 2008/2009 2008/2009 2008/2009 2008/2009 % ii. Muhoroni 2008/2009 Base Year % Unit Chemelil Capacity Utilisation Optimal Processing Levels i. Indicator Outcome Outcome Indicator: Tonnes of sugar made Outcome: Optimal Processing Levels Goal: Enhanced Sugar industry Competiveness Factory Level Annual Targets 518,128 10.0 - - - - 88 68 60 51 58 66 52 50 Base Value - - - - 88 68 61 61 61 66 61 61 565,236 10.5 2009/10 50 - - - 88 70 70 70 70 70 70 70 670,830 11.0 2010/11 58 - - - 88 75 75 75 75 75 75 75 813,286 11.5 2011/12 68 50 50 50 88 80 80 80 80 80 80 80 982,257 11.5 2012/13 1,151,557* 11.5 75 58 58 58 89 89 89 89 89 89 89 89 2013/14 64 Kenya Sugar Industry Months Days Synchronised timely harvesting Staleness index Ha Area under cane irrigated Optimal harvesting and transport schedules % High yielding varieties Optimal yield levels achieved Unit Indicator Outcome Outcome Indicator: Tonnes of cane harvested Outcome: Optimal yield levels Goal: Enhanced Sugar industry Competiveness Other Critical Annual Targets 2008/2009 2008/2009 2008/2009 2008/2009 Base Year 4 6-12 400 5 Base Value 2 4 44,000 10 2009/10 2 3 84,000 25 2010/11 1 2 124,000 40 2011/12 1 1 164,000 45 2012/13 1 1 204,000 50 2013/14 Strategic Plan, 2010-2014 65 Score Card Indicator Variance Satisfactory Below Average Poor 3 1 Good 4 2 Very Good Comment Achieved 5 Target Year Comments 0-36 37-52 53-68 69-84 85-100 Target Achievement Level (%) Scorecard* Annex X: Plan Indicator Tracking Evaluation Tool Improvement Action Achievement to Date Mean Scorecard Cumulative Annex XI: Sugarcane Production – Recommendations for Competitiveness Excerpts from Cost of Sugarcane and Sugar Production, Kenya Sugar Board, 2008 1.1 Seed Cane Production Seed cane for establishment of milling cane be obtained from properly selected “B” nurseries which have been developed with seed cane from properly treated and inspected seed from “A” nurseries. There is need for all sugar zones to invest in and operationalise seed cane treatment units. The price for seed cane should be at a premium, higher than that of cane for milling. This will motivate selected farmers to produce adequate good quality seed cane. There is need for training of seed certification officers and field inspectors for quality assurance. Procedures for certification must also be developed and documented. KESREF must play a leading role in this process, backed by the sugar companies and OGIs. Standard variety composition should gradually be restored to 20:40:40 for early, mid and late maturing varieties. The seed cane for this restoration should be established in the nucleus estate, where all the required standards for seed cane preparation will be adhered to. 1.2 Fertilizer Application There is need for regular undertaking of soil tests to determine actual deficiencies in order to apply appropriate corrective measures, instead of sticking to a fixed fertilizer regime regardless of the changing soil needs. There is need for equipping of the soil testing laboratory at KESREF to meet industry demand for effective and timely testing. Fertilizers are applied mostly manually on top of the ridges and are usually washed away when applied in the rainy season. Urea is a volatile fertilizer and is less effective when applied on top of the ridges. For better effectiveness, fertilizer should be incorporated into the soil using fertilizer ridgers or by hand in small furrows adjacent to the cane stools, then covered with soil. In the MSC zone especially, efforts to stem diversion of fertilizer to sale for cash, could be supplemented by: Ensuring prompt payment for cane deliveries Re-instating the farmers’ advance scheme to meet social needs and crop maintenance costs before payments are received Undertaking specific research to ascertain the appropriate fertilizer regimes for each zone Supplying fertilizer in a timely manner, when required Closely supervising fertilizer application 1.3 Cane Harvesting and Transportation Effective mechanization is only possible through viable farm units, hence the need for block farming with minimum plot sizes of 25 Ha. 66 Kenya Sugar Industry There is need to use purpose built unit for cane haulage eg. Bell instead of general multipurpose use units in order to cut down on cost of maintenance and improve on availability, hence efficiency. Cane Yard management at the factory is key to reduction of the uneconomically lengthy turnaround time by cane haulage units. Cane transportation rates account for 30-37% of the total cost of sugarcane production. In order to minimise on this cost, it makes business sense to increase productivity of existing cane areas rather than expanding cane catchment areas to uneconomically distant zones. High cane spillage especially in the Mumias Sugar Zone could be mitigated by having the trailer baskets fitted with all round expanded metal and secured with rope or cargo netting. In areas where farmers have smaller cane plots, it is worthwhile considering animal drawn carts to ferry cane from the fields to a collection centre. This would save on costs and protect the plots and cane stools from destruction. 1.4 Roads Infrastructure An industry infrastructure development blue print be formulated and implemented. The industry collaborates with central and local government in the utilization of petroleum levy and the local government cess. The following sources of funding have been identified for long-term sugar roads maintenance: The Central Government through the ministry of public Works and the Kenya Roads Board, from taxes and fuel levy The local authorities through Cess funds levied on sugarcane sales Funds generated internally by the sugar companies Grants from the Sugar Development Fund. In a liberalized market, the use of sugar company resources in maintaining sugar roads, which are public roads, is not desirable as it increases production overheads and ultimately adds to the cost of sugar. It is proposed that the management of sugar roads be placed under a committee comprising KSB, millers, outgrower representatives, local government and the Kenya Roads Board. 1.5 Quality based Cane Payment System The modified cane payment formula should be adopted and implemented in all sugar companies as a pilot cane testing unit is established to guide the industry towards sucrose based cane payment. Price of cane = av. Price of sugar x farmer’s sharing ratio TC/TS Ratio Farmer’s sharing ratio: 50% TC/TS ratio: 10% Strategic Plan, 2010-2014 67 The system will create incentive for farmers to deliver clean high sucrose sugar and the millers to improve sugar recovery, with overall increased productivity for the industry. Currently, there exists a Cane Pricing Committee which under the law comprises representation from KSB, KESGA and KESMA and has the function of reviewing sugarcane prices which Paragraph 8 of the 2nd Schedule of the Sugar Act 2001 demands that it be determined on the basis of sucrose content. The importance of cane pricing in providing growers with quality incentives and protection from poor mill performance cannot be over-emphasized. Conditions to be met for a Successful System Availability of high sucrose seed cane must be guaranteed (major role for KESREF) The grower must guarantee ability to supply and the miller to crush, cane at the optimal sucrose level. The preferred payment system must be backed by the law and governed by strict and clear regulation. In this regard, there must be a neutral and professional arbitration body to police the regulation and deal with any queries arising. The farmers and millers must be fully enlightened on the system, its implications and what is expected of them for the growth of the industry. The preferred cane payment system must be one that provides the farmer and the miller an equitable share of the industry’s earnings based on their respective costs of production, plus a reasonable return on their investments. The system must encourage and reward the farmer for supply of good quality cane to the mills. The system must encourage and reward the factory for operating at optimal efficiency. 1.6 Ratooning Unless in exceptional cases where sugarcane husbandry is of high quality, farmers hardly make any profit from the plant crop. Subsequent ratoons, if well maintained to sustain high yields, bring good profits to the farmer. Emphasis must therefore be placed in ratoon maintenance through selection at planting of varieties with high ratoonability, cane husbandry practices such as ridging which stimulates cane growth and proper fertilizer application. 1.7 Management and Profitability The use of inputs and factors of production varies in the different sugar belts due to management styles, technologies and geographical characteristics. MSC is a high input use scheme attributed to a centrally planned management system. With the exception of hired labour, the level of use of inputs is determine and paid for by the miller. The profits earned by the farmer are an implicit land rate for leasing out their land. Since the inputs are supplied centrally, the farmer has lower leverage in bargaining for better prices. The input costs are also higher due to mark up costs for the transactions. In the absence of choice of input use, cases of diversion, especially of fertilizer are high. 68 Kenya Sugar Industry In W/Kenya, CSC and MUSCO zones, the input use is generally lower and farmers have more autonomy in deciding the level of input use. This autonomy has a disadvantage in that there is more variability in production levels. One advantage however is that farmers can access inputs at relatively lower prices than in the MSC zone. 1.8 Research KESREF was incorporated in January 2001 with the principal objective of conducting sugar research and undertaking technology transfer. Low levels of funding, poor and inadequate infrastructure, and reliance on SDF as the only source of funding which is not adequate limit the performance of the Foundation. To enable the Foundation effectively carry out its mandate, there is need to increase research funding, develop bankable projects proposals to attract financial support from donors and venture into other sources of income generation. Current R & D activities have concentrated on agronomic and socio-economic research while farm mechanization, sugar milling and processing are almost non-existent. Potential research capacities that can be exploited exist at KESREF, KIRDI29 and local universities. 2.0 Strategies for Smallholder/Outgrower Development It is often argued that the smallholder nature of sugarcane production in Kenya is one of the key challenges that lead to high cost of production. While the smallholder nature is distinctly unique in the case of Kenya compared with other regional producers, it can by all means be streamlined and made efficient as is demonstrated by Indian sugarcane production which is also largely smallholder yet enviable competitive. 2.1 Measures to Address Smallholder Constraints In order to address the typical constraints of smallholder production system, the following measures have to be considered: Improved access to long term and affordable cane development finance Improved access to higher yielding and disease resistant cane varieties, and seed cane Improved capacity of cane growers in: cane growing techniques, business understanding, enforcement of grower/miller contracts, continuous civic education programmes Improved capacity of the management systems: MIS to make operations more effective and efficient; staff capacity through training and development; engaging with technical partners to facilitate development. Improved road network to improve haulage and reduce transportation costs; and Equitable division of proceeds through the cane pricing formula. A study undertaken by the ISO has identified the following four possible strategies for further development of smallholder/ outgrower cane production: • • • • 29 The Business Linkages Model; Block Farming; Adoption of new cane varieties; and Strengthening of Grower Association. Collaboration MOU between KESREF and KIRDI was signed in August 2006. This led to a joint study involving KSB on the Assessment of Industrial Research and Development needs of the Kenyan Sugar industry. Strategic Plan, 2010-2014 69 2.2 The Business Linkages Model The ‘business linkages’ model was developed by Kilombero Sugar Company Ltd (KSCL) in Tanzania and the International Finance Corporation (IFC) which financed a project proposal entitled – the Kilombero Business Linkages Project (KBLP). The project, assessed as successful, involves promoting business and commercial linkages between KSCL and the outgrower community through innovative financing mechanisms and capacity building programmes. It has allowed new farmers to enter the market and existing farmers to expand and improve their cane farming activities. Support was provided for vital infrastructural development, creation of an information management system, and delivery of agriculture and business training to farmers, farm groups and local entrepreneurs through leveraging commercial and donor funding. KBLP’s initial analysis revealed that it was necessary to increase outgrowers’ access to finance and assist farmers to improve crops, adopt new technologies and view their farms as profit making operations. Under KBLP, the KSCL aimed to provide a reliable and stable market for outgrower cane while all other services such as land preparation, weeding, cane loading and infrastructure maintenance, is provided by the community for the community. The following were identified by KBLP as priority areas to achieve the objectives: • • • • • • • Develop a comprehensive management information system; Enhance business, agricultural and technical skills; Contribute to SME and micro-enterpreneur development; Develop Kilombero Community Trustand Trust Farm to provide finance for outgrower community development projects; Improve infrastructure in outgrower areas; Increased access to finance for existing and new farmers; and Build the capacity of associations that represent outgrower farmers. The success of this project is hinged on supporting partners and a market to outgrower production, all driven by clear economic objectives. 2.3 Block Farming The problem of land fragmentation is notable in East Africa, and has been cited as a key constraint to efficient sugarcane production. One strategy being pursued to address land fragmentation is Block farming – a contiguous farming area operated under shared ownership. 2.3.1Benefits of Block Farming As a result of continuous plots, roads, drainage and other necessary infrastructure can be more easily constructed and maintained Easier to provide extension services for improved husbandry and higher productivity Reduced incidence of accidental fire because the grid road network acts as a firebreak Planting lines will be more uniform, ensuring more accurate and easier application of herbicide and fertilizer Easier harvesting due to uniform maturity period and easy accessibility to cane. Harvest efficiency also improved because cane loaders no longer have to travel long distances when loading cane into trucks Cost per unit of cane planting and maintenance operations will decline through the exploitation of economies of scale 70 Kenya Sugar Industry A drainage system will ensure productivity losses associated with water logging will be reduced and even allow harvesting of cane during the rainy season if required. 2.3.2 Challenges of Block Farming All participating growers must start planting at the same time; A high risk of free-riding; and Farmers must stay with the block arrangement whilst the agreed period is in force. 2.3.3 Requirements for Successful Block Farming Strong institutional factors are crucial to the success of block farming. Strong farmer associations at local and apex levels are needed to sensitize growers to build consensus skills among block members Financing mechanisms must be made available Extension and training Services Supportive sugar miller and government to ensure appropriate institutions for policy and regulation At least 4 hectare blocks are necessary for sustainable commercial sugarcane farming. Maximum number of farmers per block is 20. Aerial photographs and GPS should be used to indicate block boundaries. 2.4 Improved Cane Varieties One of the factors leading to low production and productivity of sugarcane is the existence of low yielding varieties which are also susceptible to diseases and insect pests. The diseases are generally seed-borne and are easily spread by use of unclean seed cane. While improved cane varieties can increase productivity in O/G farms, sustainability will only be guaranteed by better cultural practises and a business sense. The incentive to use treated seed cane, proper zone specific varieties and good crop husbandry can only be sustained by the following factors: Much greater focus on grower extension and training; Introduction/ enforcement of legislative sanction; A cane payment system that properly rewards growers for the quality of their cane. The ISO and CFC (providing grant financing) approved a project submitted by the Sugar Board of Tanzania aimed at addressing the problems of low productivity and profitability in the smallholder sector in East Africa (Tanzania, Kenya and Uganda) through importation and evaluation of superior sugarcane varieties, multiplication, production, use of certified seed cane and promotion of proper practices of crop husbandry and management. The project is also expected to overcome the current short falls of lack of clean planting material by introducing certified seed cane production systems which will ensure healthy seed cane and effective control over the spread of diseases and pests. 2.5 Strengthening Outgrower Institutions (a) In order to address the low levels of education among farmer leaders, training and capacity building of the management of Outgrower institutions is a priority. Directors of Outgrower bodies must have acceptable minimum levels of education to enable then understand and interpret policy. Strategic Plan, 2010-2014 71 (b) Immediate independent audits of each of the Outgrower institutions should be undertaken to determine the nature and extent of the liabilities. Restructuring of the financial state of the Outgrower bodies is a pre-requisite in making them viable. (c) Accountability in the leadership of Outgrower Institutions could be enhanced through reviewing the Memoranda and Articles of Association, such that the grower bodies are limited by shares rather than guarantee. Under their present structure, the outgrower directors have nothing to lose by running down the institutions. (d) For effective operation of outgrower institutions, they must be focused on the farmers needs at the grass root and be accountable to the grower members who shall be shareholders of the company. Essentially then, the outgrower bodies shall be governed by the Co-operatives Act. (e) Outgrower bodies must be run by competent management, based on sound commercial principles with proper checks and balances in place to ensure that set targets are achieved. KSB could play a coordinating role ensuring that the controls are in place and that the institutions so established take advantage of the existing community strengths. (f ) Directors and management of Outgrower institutions should be put on binding Performance Contracts modeled in the form of those currently obtaining in the Civil Service in order to ensure quality service delivery and accountability. (g) The OGIs need to develop and adhere to a risk management policy to enable them identify, assess and manage risks in order to minimize the negative impact thereof. (h) There is a programme supported by the World Association of Beet and Cane Growers (WABCG) to strengthen sugarcane and beet producers’ organizations in developing countries (undertaken by Agricord). The basic premise of the programme is that grower/ miller relationships determine the level of income generation by a smallholder farmer. The organizational degree of outgrowers determines the degree of bargaining power and the way proceeds are shared. Annex XII: Sugar Production – Recommendations for Efficiency Excerpts from Cost of Sugarcane and Sugar Production, Kenya Sugar Board, 2008 i. Undertake financial restructuring of government owned sugar companies to prepare them for privatization within a given period; Government should gradually divest from ownership of sugar companies through sale of its equity in parastatal mills to strategic partners. Such divestiture should take cognizance of the socio-economic impact on the local community. ii. Promote rehabilitation, modernization and expansion of the factories to maintain sufficient capacity for the production of sugar to meet domestic consumption requirements at all times and surplus for export; iii. Promote the development of new factories in viable regions of the country by the private sector; iv. Support industrial and applied research. Seek in-house support for mill maintenance e.g. enlisting the services of institutions such as KIRDI and Numeric Machining for fabrication of mill parts. 72 Kenya Sugar Industry v. Enhance income streams through value addition of co-products vi. Guard against diseconomies of scale as introduced by overheads from dominant functional departments and systems rigidity as may be evident in the local best of the breed companies compared to regional competitors. vii. Empower managers through-out the company to approach cost containment differently by modifying the manner in which they produce, report, supervise, control, appraise and market products and services. viii. The industry must identify and eliminate low value-adding tasks, which increase overheads but must limit the frequency of cost cutting activities as they wear down morale. ix. Tune corporate structure to emerging conditions of lean innovative and balanced production systems. x. Carry out assessment of the working patterns in the industry that lead to high costs and encourage modification of such factors to reduce costs. xi. To avoid impaired decision making, the industry should standardize its accounting reports and monitor its cost data more consistently to reduce irrelevance, inaccuracy and issuance of misleading information. xii. Industry must modify its decision making process to cut down paper work, filing etc., without diluting the management of financial and staff resources. Effective use of IT by senior managers in finding out the accurate details of occurrences and making decisions must be encouraged. It must receive equal attention as labour, materials and overheads. xiii. The industry must map out its value chain in order to quantify value added by each activity and set out equitable rates and prices for all inputs to support sustainability for the benefit of all players. xiv. Probably allow the Agriculture Department to run the nucleus estate as a semi autonomous business selling its cane to the company to help assess the real cost of cane and due returns. This may further encourage other growers contracts, such as leases, where grower practices are wanting. xv. De-link the cost of cane handling (harvesting, loading, transport e.t.c) from the grower’s proceeds. In any case all such services are secured by contracts between the millers and service contractors without consulting the grower. A review of value addition activities in these operations among the accountable parties should bring down the costs. xvi. Embrace condition maintenance at the factory to pre-empt breakdowns and ensure that valuable time is not lost while extensive repairs and maintenance are being undertaken. Strategic Plan, 2010-2014 73 74 Kenya Sugar Industry
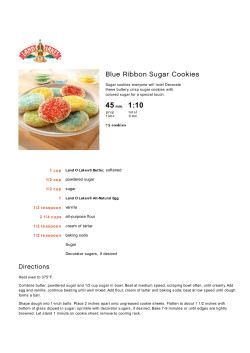
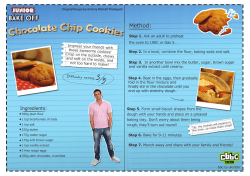
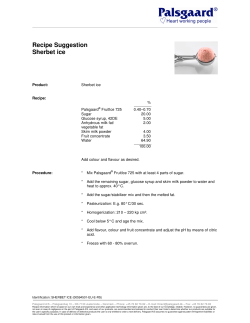
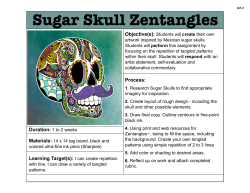
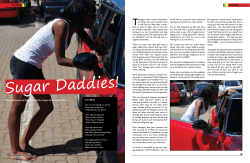
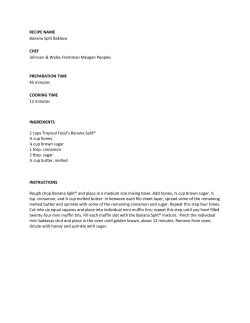
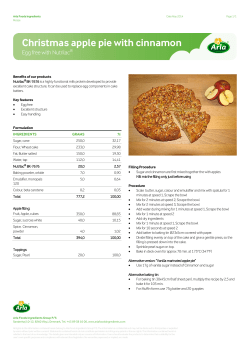
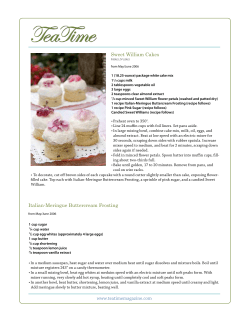

© Copyright 2026