
View/Open
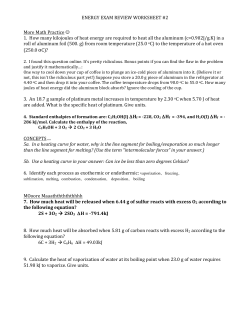
Available online at www.sciencedirect.com
ScienceDirect
Energy Procedia 40 (2013) 384 – 391
European Geosciences Union General Assembly 2013, EGU
Division Energy, Resources & the Environment, ERE
Upscaled modeling of CO2 injection and migration with
coupled thermal processes
S. E. Gasdaa*, A. F. Stephansena, I. Aavatsmarka, H. K. Dahleb
a
Center for Integrated Petroleum Research, Uni Research, Allégaten 41, N-5020 Bergen, Norway
b
Department of Mathematics, University of Bergen, Allégaten 41, N-5020 Bergen, Norway
Abstract
A practical modeling approach for CO2 storage over relatively large length and time scales is the vertical-equilibrium
model, which solves partially integrated conservation equations for flow in two lateral dimensions. We couple heat
transfer within the vertical equilibrium framework for fluid flow, focusing on thermal processes that most impact the
CO2 plume. We investigate a simplified representation of heat exchange that also includes transport of heat within
the plume. In addition, we explore available CO2 thermodynamic models for reliable prediction of density under
different injection pressures and temperatures. The model concept is demonstrated on simplified systems.
Published
by Elsevier
Ltd. Open
© 2013
2013The
TheAuthors.
Authors.
Published
by Elsevier
Ltd.access under CC BY-NC-ND license.
Selection and
peer-review
under responsibility
of the GFZof
German
Research
CentreResearch
for Geosciences
Selection
and/or
peer-review
under responsibility
the GFZ
German
Centre for Geosciences
Keywords: geologic CO2 sequestration; numerical modeling; CO2 density; PVT formulations; cubic equations-of-state; nonisothermal fluid flow; vertical equilibrium model; sharp-interface; upscaling
1. Introduction
CO2 migration in the deep subsurface involves physical and thermal processes that occur at multiple
spatial and temporal scales. These mechanisms can play an important role in the security of underground
CO2 storage, in particular, the coupling between thermal and geomechanical processes that can lead to
fracturing and loss of caprock integrity [1]. Additionally, a better understanding of thermal impact on
CO2 properties is essential for reliable simulation of temperature-related plume dynamics at the field scale
* Corresponding author. Tel.: +47-555-83394; fax: +47-555-88265.
E-mail address: [email protected].
1876-6102 © 2013 The Authors. Published by Elsevier Ltd. Open access under CC BY-NC-ND license.
Selection and peer-review under responsibility of the GFZ German Research Centre for Geosciences
doi:10.1016/j.egypro.2013.08.044
S. E. Gasda et al. / Energy Procedia 40 (2013) 384 – 391
[2]. Mathematical models and subsequent simulation must capture the relevant processes at length and
time scales appropriate for CO2 storage, however, the handling of multiple physics over several disparate
scales in an efficient manner remains a computational challenge [3].
In this paper, we present the vertical equilibrium (VE) model for coupled thermal processes. The VE
model allows for partial integration of the three-dimensional equations, thus greatly reducing the
computational effort involved. The two-dimensional horizontal flow equations can be then solved
analytically, semi-analytically and numerically [3]. The latter allows for the greatest flexibility regarding
horizontal heterogeneity in the geological and fluid properties. The integrated model has been developed
recently to include a capillary fringe [4] and subscale structural [5] and solubility trapping [6]. In this
work, we extend the VE model for non-isothermal systems by coupling the horizontal flow with energy
transport.
Nomenclature
CΣ
total compressibility [1/Pa]
CΣ,θ
total heat expansion coefficient [1/K]
Cth
total specific heat capacity [J/kg/K]
H
thickness of storage aquifer [m]
P
coarse-scale pressure located at a reference datum [Pa]
Pc
coarse-scale capillary pressure [Pa]
R
specific gas constant [J/kg/K]
Q
mass rate source/sink [kg/s]
S
depth-integrated saturation [-]
U||
depth-integrated volumetric phase flux in lateral direction [m2/s]
a
coefficient in general cubic equation of state
b
coefficient in general cubic equation of state
h
specific phase enthalpy [J/kg]
v
specific volume [m3/kg]
Θ
temperature [K]
Ψ
energy source/sink [J/kg/s]
α
subscript to indicate phase; α = c (CO2), b (brine), or s (solid)
αB
bulk compressibility of medium [1/Pa]
β
phase compressibility [1/Pa]
δ1
parameter in general cubic equation of state
δ2
parameter in general cubic equation of state
ηc
thickness of CO2 plume [m]
385
386
S. E. Gasda et al. / Energy Procedia 40 (2013) 384 – 391
θ
dipping angle of aquifer [o]
ρ
phase density [kg/m3]
ϕ
porosity [-]
2. Vertical equilibrium model
We consider non-isothermal flow of two fluid phases in a porous medium. The fluids consist of a
lighter CO2 phase and denser brine phase. The fluids and rock matrix are compressible. Mineral reactions
and mutual solubility are ignored. The VE sharp-interface model is applied to this system, which is based
on the following assumptions:
• aspect ratio of the domain is large;
• fluids are segregated due to gravity;
• capillary fringe characteristic length compared with aquifer height is negligible;
The above list implies that vertical flow can be neglected, and therefore pressure is in equilibrium
vertically and the vertical saturation profile is well defined. This greatly simplifies the resulting
integrated flow and heat transport equations. The VE model presented here consists of a horizontal
compressible flow equation that is coupled with a vertically integrated energy flow equation.
2.1. Compressible fluid flow
Applying the VE assumptions, subsequent integration of the fine-scale 3D mass conservation
equations results in the following mass conservation equation for each fluid phase,
H
∂ (φρα Sα )
+ ∇ · ρα Uα = Qα , α = c, b.
∂t
(1)
Let the total compressibility be defined as,
CΣα =
φ ∂ρα
∂φ
+
= φβα + (1 − φ)βs + αB .
ρα ∂p
∂p
(2)
The mass conservation equations can then be combined to obtain a pressure equation that solves for
coarse-scale pressure P at the bottom of the reservoir,
H [Sc CΣc + (1 − Sc)CΣb ]
∂Pc
∂P
+ HSc CΣc
∂t
∂t
∂Θ
+ HSc CΣΘ
+ ∇ · Uc + Ub = QΣ ,
∂t
(3)
387
S. E. Gasda et al. / Energy Procedia 40 (2013) 384 – 391
where the source term is the sum over both fluid phases. Here, we have used the VE assumption so that
pα(z) = Pα - ραgcosθz. Then, Pc becomes the coarse-scale capillary pressure, defined as Pc = −Δρ(1ηc)Hgcosθ. The multiphase extension Darcy’s law is used for volumetric phase fluxes.
In the development of the pressure equation, further simplifications have been made regarding fluid
and matrix properties:
• Rock permeability, porosity and relative permeability are vertically homogeneous;
• Brine phase is slightly compressible due to pressure;
• Velocity of solid surface is slow compared to fluid flow;
• Vertical CO2 density changes within the plume are neglected;
These assumptions may be relaxed if necessary.
2.2. Energy transport
The integrated energy conservation is written in terms of temperature, which is appropriate if changes in
enthalpy and temperature are relatively small [3]. The following assumptions are made:
• no fluid phase changes;
• temperature of solid and fluid phases is in equilibrium locally;
• thermal conductivity can be neglected;
• brine temperature is constant;
• vertical temperature changes within CO2 plume are negligible, i.e. Θ(x,y,z,t)=Θ(x,y,t);
• negligible impact of pressure on energy transport;
The resulting energy balance equation becomes,
HCth
∂Θ
+ ∇ · hc ρc Uc = Ψc ,
∂t
(4)
where the total specific heat capacity is defined as,
Cth =
∂
(hc φρc − hs (1 − φ)ρs ) .
∂Θ
(5)
2.3. Numerical solution
The coupled system of equations (1), (3), and (4) is solved using an IMPES (Implicit Pressure Explicit
Saturation) type solution strategy. The pressure equation (3) is solved implicitly using finite-difference
spatial discretization. Then, the temperature (4) and CO2 saturation (1) are solved explicitly in a
sequential manner. A volume correction is used in the pressure equation to account for small volume
balance errors that occur when conserving mass in the compressible case.
3. Improved cubic equation of state for CO2
Cubic equations of state may be written in the form [7],
P =
a(Θ)
RΘ
−
,
v − b (v − δ1 b)(v − δ2 b)
(6)
388
S. E. Gasda et al. / Energy Procedia 40 (2013) 384 – 391
where δ1 < δ2. Special cases of this cubic equation of state are the Peng-Robinson equation with
parameters δ1= -(√2+1) and δ2 = (√2 – 1) and the Soave-Redlich-Kwong equation with δ1 = -1 and δ2 = 0.
Also the van der Waals equation is a special case of this form with δ1 = δ2 = 0 and a(Θ) independent of Θ,
although it does not satisfy the required inequality for δ1 and δ2.
The parameters δ1 and δ2 may be chosen to give an equation of state with an improved accuracy for a
given substance in a given region of temperature and pressure. As an example is shown the case with δ1 =
-3.8 and δ2 = 0.9. This case of the cubic equation of state is compared with the Span-Wagner equation [8]
for CO2 for temperatures in the interval 300−310 K and pressures in the interval 7−8 MPa. Curves of
equal density are shown in Figure 1 for the values 250, 300, 350, 400, 450, 500, 550, 600, 650 and 700
kg/m3, with the 250 curve at the right-bottom and the 700 curve at the left-top. The density curves are
fairly good for the liquid and supercritical domains, but there are larger deviations in the vapor domain.
Also, the saturation curve shows a deviation in the lower part.
Fig. 1. CO2 density contours computed near the critical point for two equations of state: (a) Span and Wagner; (b) cubic equation of
state with improved coefficients.
4. Application
The non-isothermal VE model presented in Section 3 was applied to two CO2 injection and migration
scenarios. The first represents CO2 migration in a sloping aquifer due to buoyancy and subject to a
geothermal gradient. The temperature conditions are typical of North Sea aquifers, which could bring
CO2 close to the critical point where density is most sensitive to small changes in temperature. The
second test case represents injection of CO2 at a colder temperature than reservoir conditions. This case
is also representative of injection of CO2 that has been transported a long distance along the sea floor
before being pumped into the aquifer. These cases demonstrate the impact of CO2 density on plume
evolution over relatively short and long temporal and spatial scales.
4.1. Sloping aquifer
CO2 migrates in a saline aquifer in a postinjection situation. The saline aquifer is bounded top and
bottom by impermeable boundaries. The aquifer is modeled as a 10-m wide cross-section with fixed Θ
S. E. Gasda et al. / Energy Procedia 40 (2013) 384 – 391
and P conditions at the upslope boundary. All rock and fluid properties are given in Table 1. CO2
properties are calculated according to Span and Wagner [8]. CO2 is emplaced as a fully saturated square
initial condition 2.5 km in width and centered at x = 6.25 km. The simulation time is 5000 yrs.
Table 1. Aquifer geometry, rock and fluid properties for sloping aquifer simulation case.
Parameter
Value
Units
Aquifer extent
100
m
Aquifer thickness
50
m
Dip angle
1
o
Top surface depth
1800-800
m
Permeability
130
mDarcy
Porosity
15
%
Geothermal gradient
35.6
C/km
Surface temperature
7
C
Brine density
1010.6
kg/m3
Brine viscosity
0.6
cP
Brine compressibility
0.46
GPa-1
Rock specific heat capacity
920
J/kg/K
Rock density
2650
kg/m3
Rock bulk compressibility
0.3
GPa-1
Two cases of CO2 density variation are simulated: 1) variable density according to P and Θ, and initial
Θ equal to reservoir temperature; and 2) constant density of 570 kg/m3. The initial density and
temperature profiles are given in Figure 2a.
After 5000 years (Figure 2b), the two cases show that there is only a slight overestimation of plume
speed when assuming a constant density (case 2) compared with density variation in equilibrium with
aquifer conditions (case 1). A larger domain extending further upslope would lead to larger discrepancy
between the results because the density begins to change rapidly once the plume passes 80 km, which
corresponds to 1000-m depth.
4.2. Injection of cold CO2
The saline aquifer is horizontal and extends 20 km in lateral extent. The top surface lies uniformly at a
depth of 1800 m, while the initial temperature is uniform at 70 C. The system is modelled as radially
symmetric with fixed Θ and P boundary conditions. The aquifer and fluid properties are the same as given
in Section 4.1. CO2 is injected at a rate of 1 Mtons/yr with a temperature of 20 C into the center of the
domain for 5 years. A comparison with CO2 injected at reservoir temperature is performed.
The results (Figure 3) show a large difference in plume shape in the first 250 km away from the
injection well. The cold CO2 injection leads to a compact plume near the well that expands as temperature
increase away from the well. The reservoir temperature case has a more classical conical shape to the
plume. The density variation is greatest for the cold CO2 case, varying from over 900 kg/m3 to nearly 600
kg/m3, which is mostly due to temperature variation. It is interesting to note the increase in temperature
near the well for the CO2 injection at reservoir conditions, which could be due to a pressure increase of 25
389
390
S. E. Gasda et al. / Energy Procedia 40 (2013) 384 – 391
bar that causes an energy increases as the CO2 compresses. However, the increased energy also raises the
temperature and subsequently decreases CO2 density as a result. This complex process requires further
examination.
Fig. 2. Sloping aquifer simulation case: (a) left column shows CO2 density (top) and temperature (bottom); (b) right column shows
resulting plume interface with initial condition (top) and upslope extent (bottom); all three cases of density variation are shown:
variable density (solid) and constant density (dashed).
5. Summary
In this paper, we present a coupled thermal and VE flow model along with preliminary results for
aquifers in which temperature may be have a significant impact on CO2 density. The following
observations can be made:
• VE models are well suited for large-scale and long-term storage simulation;
• non-isothermal capability can further extend the applicability of the VE model to more complex
systems;
• further investigation is required into the behavior of PVT formulations and extension of cubic
equations-of-state to give more reliable CO2 properties;
• preliminary results show expect CO2 behavior impacted by temperature, although further work is
required to verify the results against fully 3D non-isothermal simulators; and
• the validity of assumptions in the integrated temperature model will be explored in future work.
S. E. Gasda et al. / Energy Procedia 40 (2013) 384 – 391
Fig. 3. (a) first column shows resulting plume interface; (b) right column shows CO2 density (top) and temperature (bottom); two
cases injection temperature are shown: 20 C (solid) and 70 C (dashed).
Acknowledgements
This work has been sponsored by the Norwegian Research Council and Statoil ASA through the
MatMoRA-II project (project.no. 215641).
References
[1] Gor, GY, Elliot, TR, Prévost, JH. Effects of thermal stresses on caprock integrity during CO2 storage. Int J Greenhouse Gas
Contr 2013;12:300–9.
[2] Nazarian, B, Held, R, Høier, L, Ringrose, P. Reservoir management of CO2 injection: pressure control and capacity
enhancement. in Proceedings of 11th Int Conf on Greenhouse Gas Technologies, Kyoto, Japan, 2012;1–11.
[3] Nordbotten, JM, Celia, MA. Geological Storage of CO2: Modeling approaches for large-scale simulation. New Jersey:
Wiley; 2012.
[4] Nordbotten, JM, Dahle, HK. Impact of the capillary fringe in vertically integrated models for CO2 storage. Water Resour Res
2011;47:W02537.
[5] Gasda, SE, Nilsen, HM, Dahle, HK, Gray, WG. Effective models for CO2 migration in geological systems with varying
topography. Water Resour Res 2012;48:W10546.
[6] Gasda, SE, Nordbotten, JM, Celia, MA. Vertically-averaged approaches for CO2 migration with solubility trapping. Water
Resour Res 2011;47:W05528.
[7] Aavatsmark, I. Mathematische Einführung in die Thermodynamik der Gemische. Berlin: Akademie Verlag; 1995.
[8] Span, R, Wagner, W. A new equation of state for carbon dioxide covering the fluid region from the triple point temperature
to 1100 K at pressures up to 800 MPa. J Phys Chem Ref Data, 1996;25:1509–96.
391


© Copyright 2026