
Comparing the fatty acid levels of preterm and term breast... Turkish Journal of Medical Sciences Turk J Med Sci (2014) 44: 305-310
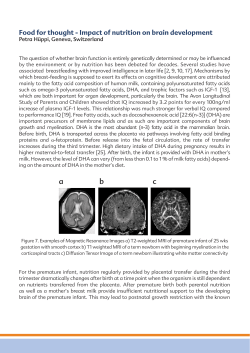
Turkish Journal of Medical Sciences Turk J Med Sci (2014) 44: 305-310 © TÜBİTAK doi:10.3906/sag-1302-131 http://journals.tubitak.gov.tr/medical/ Research Article Comparing the fatty acid levels of preterm and term breast milk in Turkish women 1, 2 1 2 2 İbrahim AYDIN *, Özden TURAN , Fevzi Nuri AYDIN , Esin KOÇ , İbrahim Murat HİRFANOĞLU , 3 1 1 4 5 Mesut AKYOL , Muzaffer ÖZTOSUN , Emin Özgür AKGÜL , Hilmi DEMİRİN , Selim KILIÇ , 1 1 Mehmet Kemal ERBİL , Taner ÖZGÜRTAŞ 1 Department of Biochemistry, Gülhane Military Medical Academy, Etlik, Ankara, Turkey 2 Department of Pediatrics, Division of Newborn Medicine, Faculty of Medicine, Gazi University, Ankara, Turkey 3 Department of Biostatistics, Gülhane Military Medical Academy, Etlik, Ankara, Turkey 4 Department of Biochemistry, Faculty of Medicine, Düzce University, Düzce, Turkey 5 Department of Public Health, Gülhane Military Medical Academy, Etlik, Ankara, Turkey Received: 27.07.2013 Accepted: 01.05.2013 Published Online: 15.01.2014 Printed: 14.02.2014 Aim: Lipids are the main source of calories and considered very important in infant growth. We aimed to compare fatty acid composition of term and preterm breast milk. This is the first study that compares the fatty acid levels of preterm and term breast milk in Turkish women. Materials and methods: Breast milk samples were obtained from mothers of term (n = 15) and preterm (n = 15) infants on postnatal days 3, 7, and 28. Fatty acid composition of human breast milk was determined longitudinally by gas-chromatography/mass spectrometry. Results: There were 31 fatty acids measured in the milk samples. In the first month, 17 fatty acid levels had significant differences. In group comparison, some fatty acids (C14:0, C16:0, C18:1 and C20:5) had significantly increased in the preterm group (P = 0.041, P = 0.046, P = 0.027, P = 0.033, respectively), whereas myristoleic acid (C14:1) and eicosanoic acid (C20:0) had significantly increased in the term group (P = 0.015, P = 0.048, respectively). Conclusion: Term and preterm milk have different compositions of fatty acids. Breast milk composition changes over time. As a general conclusion, breast milk provides the lipid requirements of infants. Key words: Breast milk, fatty acid, preterm, term 1. Introduction Breast milk has been recommended as the sole source of food for healthy infant growth during the first 6 month of life (1,2). Milk fat is the major source of energy, essential fatty acids, and fat-soluble vitamins for breastfed infants (3). Newborn and particularly preterm infants have only very limited body stores of fatty acids (FAs), but they have high requirements for deposition in their rapidly growing tissues (4–6). On the other hand, the FA composition of breast milk shows considerable variation with regards to factors such as the duration of pregnancy, stage of lactation, maternal parity, and geographic region (7–15). Many studies have been performed to determine the content of FA in breast milk collected from mothers with preterm and term infants, but the information on the composition of milk from Turkish women has remained incomplete (16,17). In this study, we reported on the compositional changes of FA in breast milk during the *Correspondence: [email protected] first month of lactation and compared FA composition of breast milk donated by mothers giving birth with full-term and preterm infants. 2. Materials and methods 2.1. Subjects In this longitudinal study, 30 healthy volunteer mothers were included (preterm n = 15, term n = 15) from the postnatal wards on the day after delivery. Gestational age was determined according to the last menstrual period of the mothers and early ultrasound findings of pregnancy. All infants were Ballard scored. Infants’ first and fifth minute APGAR scores and the delivery method were found by scanning the records of the hospital. Infants’ head circumference, crown rump length, weight changes, maternal age, gravidity, and parity information were recorded. For comparison, 5 mL of breast milk was collected from mothers of preterm (n = 15) and term 305 AYDIN et al. / Turk J Med Sci neonates (n = 15) on days 3, 7, and 28 in the postpartum period by an electrical pump between 08:00 and 11:00 hours before nourishing the baby and from only 1 breast. All milk samples were stored at –80 °C until analyzed. The study was explained to the mothers and their written consent was obtained prior to enrollment. The institutional medical ethics committee’s approval of the project was obtained. 2.2. Analysis of fatty acids in breast milk FA methyl esters were prepared with sodium methylate and methanolic boron trifluoride and extracted into hexane (Sigma, USA) by following the method developed by Molto-Puigmarti et al. for chromatographic analysis (18). Subsequently, they were separated and quantified by fast-gas chromatography with flame ionization detection according to the same method. Each sample was analyzed in duplicate. The methyl esters were separated with a Shimadzu QP2010 Plus GC/MS by a 0.25 × 0.25 mm × 30 m fused silica column. FAs were identified by comparing the retention times to those of authentic standards (Sigma). FA content has been expressed as percent (wt/wt) of total FA, because percent values may reflect essential FA status better than absolute plasma concentrations (19). Operating conditions were as follows: injector port temperature 250 °C; helium as carrier gas at a linear velocity of 24.69 cm/s at 110 °C; inlet pressure 255 kPa; split ratio 1:50 and injection volume 1 µL; detector temperature 270 °C; H2 flow 40.0 mL/min; air flow 450 mL/min; N2 make up gas 40.0 mL/min; sampling rate 50 Hz. A programmed temperature run was used to separate fatty acids. The initial oven temperature was 110 °C, isothermal for 1 min. It was increased at a rate of 55 °C/min to 160 °C and held for 7.5 min. Next, the temperature was increased at a rate of 20 °C/min to 170 °C, held for 2 min, then increased at 4.5 °C/min to 190 °C with no hold, and finally increased at 9 °C/min to 230 °C and held for 5 min. Total analysis time was 26 min. 2.3. Statistics The compliance of FA levels in milk with the normal distribution was evaluated by Shapiro–Wilk test. Values were presented as mean ± SD for normal distribution and [median (IQR)] for the non-fit normal distribution. Group comparisons were made by using the Mann–Whitney U test or Student’s t-test. Depending on the distribution, repeated measure analysis of variance (ANOVA) or Friedman nonparametric analysis of variance were performed in order to investigate changes of FA levels by time (days 3, 7, and 28). SPSS 15.0 for Windows (SPSS Inc., USA) was used for the statistical analyses. Differences were considered significant at P < 0.05. 3. Results When the age, gravidity, and parity data of those who were included the study were evaluated, there were no statistically significant differences among groups. There are significant differences in other clinical parameters (P < 0.05). Clinical data of the participants are shown in Table 1. Table 1. Clinical data of participants. Preterm (n = 15) Mean ± SD (Median) Term (n = 15) Mean ± SD (Median) Primiparity (yes/no) 8/7 8/7 Maternal age at delivery 29.33 ± 5.6 (29) 28.2 ± 3.0 (28) *Mode of delivery (C-section/vaginal) 10 / 5 1 / 14 Baby’s sex (M/F) 7/8 6/9 *Duration of pregnancy (weeks) 34.1 ± 2.7 (35) 40.1 ± 0.8 (40) *APGAR score (1st min) 8.6 ± 0.7 (9) 9.1 ± 0.5 (9) *APGAR score (5th min) 9.8 ± 0.4 (10) 10 ± 0.0 (10) *Birth weight (g) 2211 ± 614 (2340) 3396 ± 304 (3400) *Birth length (cm) 44.5 ± 3.8 (45.5) 49.9 ± 1.4 (50) *Birth head circumference (cm) 31.7 ± 2.4 (32.3) 35.2 ± 1.1 (35.5) *: Statistically significant difference between preterm and term groups (P < 0.05). 306 AYDIN et al. / Turk J Med Sci The saturated fatty acids (SFAs) accounted for the majority of fatty acids in the breast milk. C14:0, C16:0, and C18:0 were the main saturated fatty acids found in the milk. The predominant monounsaturated fatty acid (MUFA) was C18:1. The most abundant n-6 polyunsaturated fatty acid (PUFA) was C18:2 in milk. n-3 FAs were the smallest PUFA component of breast milk. Preterm total SFA percentage, MUFA percentage, and n-3 PUFA percentage levels were higher than term on days 3, 7, and 28. Term milk n-6 PUFA percentage levels were higher than preterm on days 3, 7, and 28 (see Table 2). Total SFA percentage, MUFA percentage and PUFA percentage levels were in a Table 2. FA composition (weight percentage of total FA) of breast milk at first month of lactation. Fatty acids (FA) C 10:0 a C 11:0 a C 12:0 b C 13:0 a C 14:0 b C 15:0 a C 16:0 b C 17:0 b C 18:0 a C 20:0 b C 21:0 a C 22:0 b C 23:0 b C 24:0 % SFA a C 14:1 a C 15:1 a C 16:1 b C 17:1 b C 18:1 b C 20:1 b C 22:1n9 b C 24:1 % MUFA a C 18:2n6c a C 18:2n6t a C 18:3n6 b C 20:2 b C 20:4n6 % n-6 PUFA a C 18:3n3 a C 20:3n3 a C 20:5n3 a C 22:6n3 % n-3 PUFA a Day 3 Preterm 0.03 (0.15) trace 3.5 (4.38) 0.04 ± 0.02 Y 8.83 ± 2.49 0.6 ± 0.26 Y19.75 ± 1.66 0.71 ± 0.28 8.74 ± 3.05 0.51 ± 0.17 1.09 ± 0.52 0.23 ± 0.1 0.13 ± 0.09 0.32 ± 0.11 44.48 0.23 ± 0.13 trace 2.5 (2.84) 0.47 ± 0.26 Y 20.33 (10.2) 1.39 ± 0.41 0.34 ± 0.1 0.72 ± 0.26 25.99 0.27 (8.4) 22.57 ± 5.8 0.33 ± 0.21 2.22 ± 0.79 1.73 ± 0.66 27.12 1.12 ± 0.53 0.11 (0.08) 0.08 (0.07) 1.09 (0.9) 2.4 Term 0.26 (0.36) 0.02 (0.02) 1.58 (5.31) 0.06 ± 0.08 7.78 ± 5.9 0.64 ± 0.61 19.66 ± 9.33 0.65 ± 0.62 7.95 ± 6.34 §0.65 ± 0.58 0.94 ± 0.68 0.35 ± 0.38 0.18 ± 0.21 0.47 ± 0.42 41.53 §0.27 ± 0.31 0.01 (0.01) 2.14 (2.78) 0.34 ± 0.42 19.09 (15.59) 1.21 ± 0.92 0.33 ± 0.25 0.78 ± 0.51 24.17 6.8 (13.59) 19.35 ± 13.1 2.15 ± 7.23 2.11 ± 1.64 1.82 ± 1.41 32.23 0.84 ± 0.73 0.12 (0.13) 0.06 (0.14) 1.08 (0.9) 2.1 Day 7 Preterm 0.06 (0.85) 0.02 (0.02) 4.93 (3.95) 0.06 ± 0.03 10.44 ± 3.14 0.66 ± 0.31 25 ± 10.29 0.81 ± 0.33 8.39 ± 6.9 0.58 ± 0.23 1.24 ± 0.48 0.27 ± 0.11 0.21 ± 0.12 0.36 ± 0.18 53.02 0.33 ± 0.17 trace 1.7 (2.36) 0.51 ± 0.28 15.25 (4.22) 1.23 ± 0.55 0.3 ± 0.12 0.77 ± 0.39 20.1 0.48 (3.12) 19.1 ± 12.77 0.46 ± 0.2 2.12 ± 1.05 1.9 ± 0.79 24.08 1.59 ± 0.87 0.17 (0.17) 0.12 (0.11) 0.93 (0.31) 2.81 Term 0.04 (0.18) trace 4.97 (3.81) 0.06 ± 0.04 9.05 ± 1.95 0.63 ± 0.32 19.7 ± 6.29 0.69 ± 0.37 9.33 ± 5.08 0.5 ± 0.29 0.89 ± 0.37 0.24 ± 0.12 0.13 ± 0.08 0.33 ± 0.21 46.57 0.32 ± 0.21 trace 3.22 (2.49) 0.37 ± 0.31 14 (6.79) 1.05 ± 0.58 0.25 ± 0.15 0.74 ± 0.53 20 6.98 (12.43) 19.75 ± 6.97 0.29 ± 0.14 1.8 ± 0.87 2.66 ± 3.68 31.48 1.16 ± 0.57 0.09 (0.15) 0.09 (0.09) 0.68 (0.91) 2.02 Day 28 Preterm 0.23 (0.41) trace 5.37 (6.06) 0.04 ± 0.02 9.06 ± 2.9 0.5 ± 0.16 23.1 ± 7.08 0.65 ± 0.2 9.96 ± 4.69 0.54 ± 0.18 0.94 ± 0.42 0.25 ± 0.07 0.11 ± 0.07 0.26 ± 0.11 51.02 0.25 ± 0.12 0.01 ± 0.01 2.28 (2.3) 0.44 ± 0.16 14.33 (8.58) 1 ± 0.41 0.2 ± 0.12 0.64 ± 0.41 19.15 0.56 (13.76) 23.47 ± 7.31 0.47 ± 0.16 1.49 ± 0.68 1.36 ± 0.39 27.35 1.59 ± 0.78 0.08 (0.15) Y 0.17 (0.15) 0.65 (0.97) 2.49 Term 0.13 (0.39) trace 6.91 (2.59) 0.05 ± 0.03 9.6 ± 1.93 0.64 ± 0.28 23.05 ± 8.91 0.69 ± 0.4 8.45 ± 4.06 0.53 ± 0.25 0.81 ± 0.43 0.26 ± 0.11 0.16 ± 0.11 0.27 ± 0.14 51.56 0.38 ± 0.18 0.02 (0.01) 1.64 (5.29) 0.43 ± 0.37 13.31 (8.15) 0.86 ± 0.35 0.17 ± 0.08 0.37 ± 0.13 17.17 9.28 (10.14) 16.3 ± 6.94 0.63 ± 0.36 1.41 ± 0.51 1.81 ± 0.91 29.43 1.2 ± 0.67 0.05 (0.02) 0.08 (0.06) 0.52 (0.52) 1.85 §: Term > preterm (P ≤ 0.05), Y: preterm > term (P ≤ 0.05). SFA: saturated FA, MUFA: monounsaturated FA, PUFA: polyunsaturated FA. Data are shown as mean ± SD (for normal distribution) or median (IQR) (if they do not fit normal distribution). a: Change of FA level with the progression of lactation is statistically significant (P < 0.05), b: change by time is not significant (P > 0.05). 307 AYDIN et al. / Turk J Med Sci comparable range to other published values (20–23). Total FA levels of preterm and term breast milk changes on days 3, 7, and 28 of lactation are shown in the Figure. In this study we determined the levels of 31 FAs in breast milk. As a result of analysis of variance, FA levels were found to change over time in 17 FAs (P < 0.05), but 14 of them did not (P > 0.05). Statistically significant differences were found between groups in 9 fatty acids, but 3 of them were ignored since they were present only in trace amounts. In group comparison, some FAs (SFAs C14:0 and C16:0 on day 3, MUFA C18:1 on day 3, and C20:5 on day 28) significantly increased in the preterm group compared to the term group (P = 0.041, P = 0.046, P = 0.027, P = 0.033, respectively), whereas myristoleic acid (C14:1) and eicosanoic acid (C20:0) on day 3 significantly increased in the term group (P = 0.015, P = 0.048, respectively). Preterm and term FA compositions of breast milk are shown in Table 2. 4. Discussion Although breast milk is universally considered to be the optimal form of nutrition for newborn infants, the fat content and FA composition of breast milk show % SFA 60 considerable variability. Populations, the effects of the extent of maternal FA body stores, nutritional status, parity, and various other factors may affect the variability of breast milk FA composition (7–15). One of these factors is the gestational age. In this study we argue that preterm infants may need more FA than term infants. Thus, we investigated whether there are differences in their mothers’ milk. Furthermore, we determined FA composition and time-dependent changes of breast milk in Turkey. There are many studies on breast milk FA composition, but the results are not consistent. Kumbhat et al. (24) reported the difference in fat concentration in preterm and term milk as nonsignificant. Paul et al. (25) reported a significant increase in fat concentration with the progression of lactation, but no significant difference between term and preterm milk. Gross et al. (26) observed a nonsignificant difference in fat concentration in both the progression of lactation and decreased gestation. Bitman et al. (27) did not find any difference when comparing FA composition of breast milk on day 42 of lactation in women giving birth to very preterm (26 to 30 weeks), preterm (31 to 36 weeks), and term (37 to 40 weeks) infants. Similarly, Genczel-Boroviczeny et al. (28) did not find any 50 25 40 20 30 15 20 0 10 Term 10 5 Preterm Day 3 Day 7 % MUFA 30 Day 28 0 Term Preterm Day 3 % n - 6 PUFA 35 3.0 30 2.5 25 0 % n - 3 PUFA 1.5 15 5 Term Preterm Day 3 Day 7 Day 28 1.0 Term 0.5 Preterm 0.0 Day 3 Figure. Changes of total FA levels of preterm and term breast milk at first month of lactation. 308 Day 28 2.0 20 10 Day 7 Day 7 Day 28 AYDIN et al. / Turk J Med Sci differences on days 5, 10, 20, and 30 of lactation in mothers of preterm as compared to term infants. Contrary to all of them, Luukkainen et al. (29) reported significantly higher contributions of C20:4 and C22:6 to the FA composition of breast milk in mothers of preterm rather than term infants. Kovacs et al. (30) reported significant differences in longchain PUFA (LCPUFA), C20:4, and C22:6 between term and preterm breast milk. In this study, we found some differences in total SFA percentage, MUFA percentage, and PUFA percentage levels. When all FAs compositions were evaluated, while the contribution of MUFA percentage and n-6 PUFA percentage decreased, SFA percentage levels increased with the progression of lactation. Although term and preterm FA composition changed together in the SFA percentage, MUFA percentage, and n-6 PUFA percentage FA groups, the term and preterm groups showed different types of changes in n-3 PUFA percentage. On the other hand, significant changes during the progression of lactation were found in 17 fatty acid levels. Contrary to Kovacs et al. and Luukkainen et al. (29,30), we did not find any significant difference in C20:4, C22:6, and LCPUFAs, but we found statistically significant differences in some FA levels (C14:0, C16:0, C18:1, C20:5, C14:1, and C20:0) between the preterm and term groups. Newborn, and especially preterm, infants have only very limited body stores of FAs. It is shown that essential FAs are very important for the development of visual acuity, the nervous system, and later growth in fetal and neonatal stages (31–34). Thus, it is extremely important to provide adequate nutrients and especially essential FAs in early infancy. As is well known, arachidonic acid (C20:4), docosahexaenoic acid (DHA; C22:6) and eicosapentaenoic acid (EPA; C20:5) can be synthesized by chain elongation and desaturation of essential FA, but linoleic acid (LA; C18:2n-6) and alpha-linolenic acid (ALA; C18:3n-3) cannot be. Moreover, endogenous synthesis of these FAs from their precursors LA and ALA is limited in preterm infants. In our study, we found increased ALA levels in the preterm group. Additionally, we measured cis and trans isoforms of LA. While cis-LA (C18:2n-6c) levels were higher (day 7) in the term group (did not fit normal distribution), trans-LA (C18:2n-6t) levels were higher in the preterm group but not did not differ significantly (P > 0.05). We think that further studies with greater numbers of samples can give more information about LA levels and their physiological role in breast milk. In our study, the majority of the differences were on day 3 of lactation. These data suggest that breast milk, and especially early infancy period colostrum, may have an important role for preterm nutrition. When previously reported studies are evaluated, similar results to our study can be observed (30,35). Nevertheless, according to some studies there are no differences in these FA levels between preterm and term groups (26–28). The control of growth in neonates is very complex. FAs are considered important in neonates’ development. In fact, FAs may have a central or key factor role on stimulating the development of newborns. Breast milk is universally considered to be the optimal nutrition for infants, and breast milk contains a considerable amount of LCPUFAs (36–38). However, the content (39–42) and FA composition of breast milk may show considerable variety between populations (9,10). Furthermore, the stage of lactation also has an important role in determining the FA composition of breast milk. This study determined changing levels of FAs by the progression of lactation in breast milk from mothers of preterm neonates and compared them to those from mothers of term infants. The results of this study and other similar studies can help to improve infant formula, but more detailed studies are needed. Acknowledgment The authors would like to thank the mothers who took part in this study for their help. References 1. ESPGAN Committee on Nutrition. Guidelines on infant nutrition. III. Recommendations for infant feeding. ACTA Pediatr Scand 1982; 302: 1–27. 2. Mete E, Çatal F, Tayman C, Uras N, Akça H, Ulukanligil M, Özkaragöz F. Comparison of human milk, cow’s milk and infant formulas for their antifungal effects against environmental fungi. Turk J Med Sci 2009; 39: 67–72. 3. Koletzo B, Rodriguez-Palmero M, Demmelmair H, Fidler N, Jensen R, Sauerwald T. Physiological aspects of human milk lipids. Early Hum Dev 2001; 65: 3–18. 4. Larque E, Demmelmair H, Koletzo B. Perinatal supply and metabolism of long-chain polyunsaturated fatty acids: importance for the early development of the nervous system. Ann N Y Acad Sci 2002; 967: 299–310. 5. Innis SM. Perinatal biochemistry and physiology of long-chain polyunsaturated fatty acids. J Pediatr 2003; 143: 1–8. 6. Crawford MA, Golfetto I, Ghebremeskel K, Min Y, Moodley T, Poston L, Phylactos A, Cunnane S, Schmidt W. The potential role for arachidonic and docosahexaenoic acids in protection against some central nervous system injuries in preterm infants. Lipids 2003; 38: 303–315. 7. Jensen RG. Lipids in human milk. Lipids 1999; 34: 1243–1271. 309 AYDIN et al. / Turk J Med Sci 8. Minda H, Kovacs A, Funke S, Szasz M, Burus I, Molnar S, Marosvölgyi T, Decsi T. Changes of fatty acid composition of human milk during the first month of lactation: a day-to-day approach in the first week. Ann Nutr Metab 2004; 48: 202–209. 9. Ruan C, Liu X, Man H, Ma X, Lu G, Duan G, DeFrancesco CA, Connor WE. Milk composition in women from five different regions of China: the great diversity of milk fatty acids. J Nutr 1995; 125: 2993–2998. 10. Koletzko B, Decsi T. Role of long-chain polyunsaturated fatty acids in infant growth and development. In: Bendich A, Deckelbaum RJ, editors. Primary and Secondary Preventive Nutrition. Totowa, NJ, USA: Humana Press; 2001. pp. 237–252. 25. Paul VK, Singh M, Srivastava LM, Arora NK, Deorari AK. Macronutrient and energy content of breast milk of mothers delivering prematurely. Indian J Pediatr 1997; 64: 379–382. 26. Gross SJ, Geller J, Tomarelli RM. Composition of breast milk from mothers of preterm infants. Pediatr 1981; 68: 490–493. 27. Bitman J, Wood DL, Mehta NR, Hamosh P, Hamosh M. Comparison of the lipid composition of breast milk from mothers of term and preterm infants. Am J Clin Nutr 1983; 38: 300–312. 28. Genczel-Boroviczeny O, Wahle J, Koletzko B. Fatty acid composition of human milk during the first month after term and preterm delivery. Eur J Pediatr 1997; 156: 142–147. 11. Martin JC, Bougnoux P, Finon A, Theret V, Antoine JM, Lamisse F, Couet C. Dependence of human milk essential fatty acids on adipose stores during lactation. Am J Clin Nutr 1993; 58: 653–659. 29. Luukkainen P, Salo MK, Nikkai T. Changes in the fatty acid composition of preterm and term human milk from 1 week to 6 months of lactation. J Pediatr Gastroenterol Nutr 1994; 18: 355–360. 12. Rocquelin G, Tapsoba S, Dop MC, Mbemba F, Traissac P, Martin-Prével Y. Lipid content and essential fatty acid (EFA) composition of mature Congolese breast milk are influenced by mothers’ nutritional status: impact on infants’ EFA supply. Eur J Clin Nutr 1998; 52: 164–171. 30. Kovacs A, Funke S, Marosvölgyi T, Burus I, Decsi T. Fatty acids in early human milk after preterm and full-term delivery. J Pediatr Gastroenterol Nutr 2005; 41: 454–459. 13. Spear LM, Hamosh M, Bitman J, Spear ML, Wood DL. Milk and blood fatty acid composition during two lactations in the same woman. Am J Clin Nutr 1992; 56: 65–70. 14. Decsi T, Oláh S, Molnár S, Burus I. Fatty acid composition of human milk in Hungary. Acta Paediatr 2000; 89: 1394–1395. 15. Büyüktuncer Z, Tosun BN, Ayaz A, Gezmen Karadağ G, Kocabaş Keser A, Aksoy M, Yurttagül M, Yücecan S, Besler HT. Implications of socio-economic status on the dietary fatty acid intakes in Turkish women. Turk J Med Sci 2010; 40: 305–312. 16. Sauerwald TU, Demmelmair H, Koletzo B. Polyunsaturated fatty acid supply with human milk. Lipids 2001; 36: 991–996. 17. VanderJagt DJ, Arndt CD, Okolo SN, Huang YS, Chuang LT, Glew RH. Fatty acid composition of the milk lipids of Fulani women and the serum phospholipids of their exclusively breast-fed infants. Early Human Development 2000; 60: 73–87. 18. Molto-Puigmarti C, Castellote AI, Lopez-Sabater MC. Conjugated linoleic acid determination in human milk by fastgas chromatography. Anal Chim Acta 2007; 602: 122–130. 19. Decsi T, Koletzo B. Growth, fatty acid composition of plasma lipid classes, and plasma retinol and alpha-tocopherol concentrations in full-term infants fed formula enriched with w-6 and w-3 longchain polyunsaturated fatty acids. Acta Paediatr 1995; 84: 725–732. 20. Fidler N, Koletzo B. The fatty acid composition of human colostrums. Eur J Nutr 2000; 39: 31–37. 21. Fidler N, Salobir K, Stibilj V. Fatty acid composition of human milk in different regions of Slovenia. Ann Nutr Metab 2000; 44: 187–193. 22. German JB, Dillard CJ. Saturated fats: a perspective from lactation and milk composition. Lipids 2010; 45: 915–923. 23. German JB, Dillard CJ. Composition, structure and absorption of milk lipids: a source of energy, fat-soluble nutrients and bioactive molecules. Crit Rev Food Sci Nutr 2006; 46: 57–92. 24. Kumbhat MM, Khanna SA, Bijur AM, Jadhav LS. Breast milk composition to gestation. Indian Pediat 1985; 22: 229–233. 310 31. Birch DG, Birch EE, Hoffman DR, Uauy RD. Dietary essential fatty acid supply and visual acuity development. Invest Ophthalmol Visual Sci 1992; 33: 3242–3253. 32. Innis SM. Essential fatty acids in growth and development, Prog Lipid Res 1991; 30: 39–103. 33. Carlson SE, Rhodes PG, Ferguson MG. Docosahexaenoic acid status of preterm infants at birth and following feeding with human milk and formula. Am J Clin Nutr 1986; 44: 798–804. 34. Birch EE, Birch DG, Hoffman DR, Uauy R. Retinal development in very low-birth-weight infants fed diets differing in omega-3 fatty acids. Invest Ophthalmol Visual Sci 1992; 33: 2365–2376. 35. Tonbul A, Tayman C, Karadağ A, Akça H, Uras N, Tatlı MM. Small-for-gestational-age newborns need a special fluid therapy strategy. Turk J Med Sci 2010; 40: 185–190. 36. Uauy R, Hoffman DR. Essential fat requirements of preterm infants. Am J Clin Nutr 2000; 71: 245–250. 37. Koletzko B, Thiel I, Abiodun PO. The fatty acid composition of human milk in Europe and Africa. J Pediatr 1992; 120: 62–70. 38. Hamosh M, Henderson TR, Kemper MA, Orr NM, Gil A, Hamosh P. Long-chain polyunsaturated fatty acids (LC-PUFA) during early development: contribution of milk LC-PUFA to accretion rates varies among organs. Adv Exp Med Biol 2001; 501: 397–401. 39. Jensen CL, Heird WC. Lipids with an emphasis on long-chain polyunsaturated fatty acids. Clin Perinatol 2002; 29: 261–281. 40. Ozgurtas T, Aydin I, Turan O, Koc E, Hirfanoglu IM, Acikel CH, Akyol M, Serdar M, Erbil KM. Soluble vascular endothelial growth factor receptor-1 in human breast milk. Horm Res Paediatr 2011; 76: 17–21. 41. Ozgurtas T, Aydin I, Turan O, Koc E, Hirfanoglu IM, Acikel CH, Akyol M, Erbil MK. Vascular endothelial growth factor, basic fibroblast growth factor, insulin-like growth factor-I and platelet-derived growth factor levels in human milk of mothers with term and preterm neonates. Cytokine 2010; 50: 192–194. 42. Aydın İ, Özgurtaş T, Turan Ö, Koç E, Hırfanoğlu İM, Açıkel C, Garipoğlu G, Akyol M, Tunç T, Erbil MK. Biochemical comparison of preterm and term newborn’s mother’s milk. Turk J Biochem 2009; 34: 242–249.


© Copyright 2026