
How to Effectively Measure and Monitor Activity in Your Portal Environment
How to Effectively Measure and
Monitor Activity in Your Portal
Environment
An Oracle White Paper
December 2004
How to Effectively Measure and Monitor Activity in
Your Portal Environment
Executive Overview.......................................................................................... 3
Monitoring And Administering Your Oracle Portal.................................... 4
Oracle Application Server & Oracle Enterprise Manager ...................... 4
Oracle Portal & The Oracle Enterprise Manager 10g Application
Server Control ............................................................................................... 5
Real Time Monitoring ............................................................................. 5
Administration .......................................................................................... 6
Diagnostic Log File Correlation Via The Oracle Enterprise
Manager 10g Application Server Control Log Viewer ....................... 7
Oracle Portal & The Oracle Enterprise Manager Grid Control............ 8
Historical Metric Reports........................................................................ 9
Thresholds and Automatic Notifications ........................................... 10
Summary ...................................................................................................... 10
Measuring Portal Activity............................................................................... 10
Business Centric Portal Analytics............................................................. 11
The Bottom Line: How Is My Portal Being Used ................................. 12
Addressing Your Business Centric Portal Analytics Needs.................. 12
NetIQ WebTrends................................................................................. 13
Omniture SiteCatalyst............................................................................ 13
Omniture SiteCatalyst Reports ................................................................. 14
My Oracle and Business Centric Portal Analytics – Case Study.......... 14
Most Popular Pages Report .................................................................. 15
Deploying Omniture SiteCatalyst on My Oracle............................... 16
Summary ...................................................................................................... 17
Conclusion........................................................................................................ 18
How to Effectively Measure and Monitor Activity in Your Portal Environment
Page 2
How to Effectively Measure and Monitor Activity in
Your Portal Environment
EXECUTIVE OVERVIEW
Today's enterprises are gaining competitive advantage and realizing increased
productivity by deploying enterprise portals within their IT infrastructures.
Enterprise portals are specifically designed to be the single source of interaction
with corporate information and the focal point for conducting day-to-day business.
Oracle Application Server 10g includes a complete and integrated solution for
building, deploying, and maintaining a world-class enterprise portal.
Oracle Portal combines a rich, declarative environment for creating a portal Web
interface, publishing and managing information, accessing dynamic data, and
customizing the portal experience along with an extensible framework for any
Web-based technology, including J2EE-based application access and Web Services.
Using Oracle Portal, e-businesses have the power to connect employees, partners,
and suppliers with the information they need as well as the flexibility to create
views tailored to each community.
In the Oracle Application Server, monitoring and administration tasks are
performed via Oracle Enterprise Manager. Although these tasks can be applied to
all OracleAS components, each component makes use of the Oracle Enterprise
Manager services and interface to a different extent.
As well as monitoring how your portal is performing, you will also want to
measure how your portal is being used. For example you need answers to ‘How
many people are visiting your portal’, ‘what are the top-10 pages’, and ‘What time
is the best for taking a downtime’.
This paper describes how to take advantage of the management features of Oracle
Enterprise Manager for administering and monitoring Oracle Portal as well as how
Web Analytics products/services such as Omniture SiteCatalyst can help you
answer common ‘Business Centric Portal Analytics’ questions. This paper further
provides a Case Study on how the My Oracle business owners use Omniture
SiteCatalyst to meet their business centric portal analytics needs.
How to Effectively Measure and Monitor Activity in Your Portal Environment
Page 3
MONITORING AND ADMINISTERING YOUR ORACLE PORTAL
Oracle Application Server & Oracle Enterprise Manager
Oracle Portal 10g utilizes two related management interfaces that, when used
together, provide a complete set of efficient tools to reduce the cost and
complexity of managing your enterprise:
•
Oracle Enterprise Manager 10g Application Server Control (Oracle
Application Server Control). Installed with every instance of the Oracle
Application Server (OracleAS), the Application Server Control immediately
provides you with the management tools you need to monitor and administer
a single OracleAS instance.
•
Oracle Enterprise Manager 10g Grid Control. The Oracle Enterprise Manager
Grid Control provides a wider view of your network so you can manage
multiple OracleAS instances. In addition, the Grid Control provides a robust
feature set designed to help you manage all aspects of your enterprise,
including your Oracle databases, hosts, listeners, and other components.
(Note: The Grid Control is installed separately using an Oracle Enterprise
Manager installation CD-ROM).
For Oracle Portal 10g the Grid Control can be used for monitoring multiple
instances from the one console whereas you must drill-down to the corresponding
Application Server Control to perform configuration tasks.
Figure 1. Oracle Portal & Oracle Enterprise Manager
How to Effectively Measure and Monitor Activity in Your Portal Environment
Page 4
Oracle Portal & The Oracle Enterprise Manager 10g Application Server
Control
Each Oracle Portal Oracle home contains its own Application Server Control
installation. You can use the Application Server Control to manage your Oracle
Portal mid-tier in three fundamental ways:
•
Real Time Monitoring
•
Administration
•
Detailed Log File Diagnostics
Real Time Monitoring
In addition to containing its own Application Server Control installation, each
Oracle Portal oracle home also contains its own Oracle Management Agent
installation. Starting the Application Server Control for a given Oracle Home also
starts the associated Management Agent as the Application Server Control relies
on the Management Agent for its supply of real time metrics.
In the case of the Portal Target Page the Application Server Control provides a
rich display of metrics To see this information, click Portal:<portal DAD name>
in the list of system components. The default schema name is portal. (Alternatively
you can access this page directly from within Oracle Portal. First click the
Administer tab on the Portal Builder page, click the Portal sub-tab and then click
Portal Service Monitoring.)
This is the first place to go to check the health of your Portal installation. From
this page you can see the overall status of the Portal midtier itself, data on how the
midtier is using the OracleAS Metadata Repository, and status of all other
OracleAS Components that the Portal is dependent upon. For information on
how to troubleshoot your portal, see chapter 13 “Troubleshooting Oracle Portal”
in the Oracle Portal Configuration Guide.
How to Effectively Measure and Monitor Activity in Your Portal Environment
Page 5
Figure 2. Oracle Application Server Control main Portal page
Administration
The page depicted in Figure 2 also allows you to easily access several
administration tasks, including:
•
Creating, Editing and Deleting DADs via the DAD wizard (by drilling through
to the DAD wizard from the mod_plsql Services link)
•
Changing the Portal Web Cache Settings that this Portal midtier uses
•
Editing the OC4J_Portal Web.xml configuration file (by drilling through to
the OC4J_Portal Target Page from the Parallel Page Engine Services link)
In addition you can perform the following tasks from the Application Server page:
•
Reassociating an Oracle Portal midtier with a new Identity Management Server
(SSO & OID)
•
Reassociating an Oracle Portal mid-tier installation with a new, different, or
relocated OracleAS Metadata Repository
How to Effectively Measure and Monitor Activity in Your Portal Environment
Page 6
Figure 3. Oracle Application Server Control page showing re-association page
Diagnostic Log File Correlation Via The Oracle Enterprise Manager 10g Application
Server Control Log Viewer
One important step in troubleshooting an Oracle Portal installation is examining
the log files of the various OracleAS components that Oracle Portal uses. You can
do this from the Application Server Control UI by clicking the Logs link in the top
right hand corner of every page.
Because Oracle Portal can satisfy a large number of requests simultaneously,
tracing a single request through the various Oracle Portal components can be
difficult, as information relating to these requests is intermingled.
Oracle Portal makes use of an Execution Context Identifier (ECID), a unique
number that is assigned to a request and attached to information recorded for that
request. As a request is passed from one component to another, the ECID is
incremented to form a sequence. This means that an individual request can be
tracked through any number of components by following this ECID sequence.
An ECID is generated by the first OracleAS component to receive a request
without an ECID. Figure 4 shows the process through which a request with an
ECID (represented by a solid arrow) is incremented as it moves through the
system.
How to Effectively Measure and Monitor Activity in Your Portal Environment
Page 7
Figure 4. Oracle Portal ECID generation and flow
The Application Server Control Log Viewer allows the Administrator to visually
correlate a number of log file entries together, based on the ECID, to expose the
request flow from one component to another.
Oracle Portal & The Oracle Enterprise Manager Grid Control
The Oracle Enterprise Manager Grid Control is installed into its own, separate
oracle home from the Oracle Portal Oracle home it is managing. In the majority of
cases the Grid Control is actually installed on a completely separate node to your
OracleAS installation. The Oracle Enterprise Manager Grid Control installation
consists of the Management Agent, Management Service and Management
Repository.
•
The Oracle Management Agent is a process that is deployed on each
monitored host, and is responsible for monitoring all targets on the host, for
communicating that information to the middle-tier Management Service, and
for managing and maintaining the host and the products installed on the host.
Each OracleAS installation has one Oracle Management Agent pre-installed
with every Oracle Home.
•
The Oracle Management Service is a web application deployed on an instance
of Oracle Application Server 10g J2EE and Web Cache. It renders the user
interface for the Grid Control, works with all Management Agents in
How to Effectively Measure and Monitor Activity in Your Portal Environment
Page 8
processing monitoring and job information, and uses the Management
Repository as its data store.
•
The Oracle Management Repository consists of two or more tablespaces in an
Oracle database that contains all the information available about
administrators, targets, and applications that are managed within Enterprise
Manager.
The Management Service uploads the monitoring data it received from the
Management Agent to the Management Repository. The Management Repository
then organizes the data so that the data can be retrieved by the Management
Service and displayed on the Grid Control. Because data is stored in the
Management Repository, it can be shared between any number of administrators
accessing the Grid Control.
Figure 5. Oracle Enterprise Manager Grid Control architecture
The Grid Control is used for managing Oracle Portal in two primary ways:
•
Displaying historical metric and performance information
•
Configuring alert thresholds and proactive notification mechanisms
Historical Metric Reports
Whereas the Application Server Control displays real time metrics, the Grid
Control shows metrics that have been collected over a period of time. The range of
Oracle Portal metrics that are to be collected are configured (by default) at install
time.
You can use these collected metrics to monitor historical trends. For any of the
collected metrics you can graph their performance over a period of time of up to
How to Effectively Measure and Monitor Activity in Your Portal Environment
Page 9
31 days. In addition you can also graph this same metric side by side with the same
metric from a different Oracle Portal installation that is also being monitored.
In addition to using the supplied graphs and reports that are part of the Grid
Control to view these collected metrics you may use any standard relational
reporting tool to create your own reports. Access to the collected metric data is
possible via a set of public database views that are documented in the Grid Control
document ‘Extending Enterprise Manager’ which is available from Oracle
Technology Network (http://otn.oracle.com).
Thresholds and Automatic Notifications
In the Grid Control, you can define and adjust the thresholds for Oracle Portal
metrics. Thresholds are boundary values against which monitored metric values are
compared. You can specify a warning threshold such that, when a monitored
metric value crosses that threshold, a warning alert is generated. Alerts can notify
you of impending problems that you can address in a timely manner. Alerts
specific to Oracle Portal can be viewed from the Portal Target page in the Grid
Control.
Editing metric thresholds is useful because you can add or change the thresholds
to fit the monitoring needs of your organization. When defining a threshold, you
should choose a value that avoids too many unnecessary alerts.
Once you have tailored your thresholds to your organization you can set up
notification alerts to execute when certain metrics exceed the pre-set thresholds.
To set up a notification in the Grid Control you first establish at least one
Notification Method for either an Outgoing Mail Server, a Script (OS Command
or PL/SQL) or an SNMP Trap. Once you have a Notification Method defined
then you can link it to a Notification Rule through which you can choose the
targets and conditions for which you want to receive notifications in the Grid
Control.
Summary
The combination of Oracle Portal 10g and Oracle Enterprise manager provides a
powerful yet easy to use environment for managing and monitoring your Portal
deployments. Application Server Control provides Administrators with an out of
the box environment to view real time metrics and log file information for
powerful troubleshooting. In addition the Grid Control provides Administrators
with a flexible architecture for examining historical trends in metrics information
as well as the ability to configure notifications for proactive management.
MEASURING PORTAL ACTIVITY
Monitoring your portal is one side of the coin, in understanding your portal.
Measurement is the other. Who is using the Portal? How? When? What
pages/links are most effective? What are users accessing? Measurement is
How to Effectively Measure and Monitor Activity in Your Portal Environment
Page 10
achieved through ‘Business Centric Portal Analytics’. Business centric portal
analytics is targeted towards business users and executives, site content
contributors, page designers, portal administrators, and business users.
Business Centric Portal Analytics
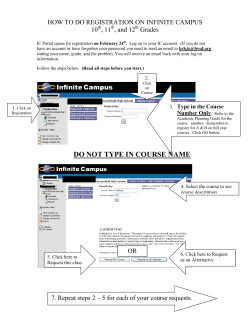
Today Oracle is realizing increased productivity through its enterprise portal, My
Oracle (Figure 7). My Oracle is specifically designed to be the single source of
interaction with Oracle’s corporate information and the focal point for employees
conducting their day-to-day business. My Oracle provides Oracle employees with
access to the applications and tools they need to do their job. It also acts as a
single source of truth to the information they need. My Oracle is based on Oracle
Portal. To learn more about My Oracle, please see the ‘Portal Implementation
Case Study: My Oracle’ White Paper on Oracle Portal Center on the Oracle
Technology Network.
Oracle Portal
Search
Page Buttons
Company
News
Page Locator
Image
Collaboration
Links
Employee
Application
(SSO)
Links
Figure 7. My Oracle Home Page
You’ll see how the My Oracle business owners were able to use Omniture
(www.omniture.com) SiteCatalyst to address the needs of knowing how their portal
was being used.
How to Effectively Measure and Monitor Activity in Your Portal Environment
Page 11
The Bottom Line: How Is My Portal Being Used
Everyday Oracle Portal and website business owners are faced with common
questions on how their portal is being used. They need to be able to answer
questions such as:
•
How many people are visiting my portal?
•
What are the Top 10 Pages on my portal?
•
What content are my users downloading?
•
How are they finding my portal?
•
When is the peak/off-peak time visiting time?
•
What time is best for taking a downtime?
Most often these questions go unanswered. Portal business owners such as Site
Managers, Marketing, Sales and Human Resource specialists need timely, relevant,
information on how their portal is being used. Site managers need to know how
users are responding to the site structure, Marketing managers need to know which
pages users are looking at, and how they can highlight pages more prominently,
Sales managers need to know what content are sales people looking at, and HR
people need to know how many people are accessing the Self Service Applications.
You can make costly decisions if you don’t know how your portal is being used.
You could invest in a custom built solution that will end up costing you and your
company more than you want or need to spend.
The bottom line is that your portal business owners need timely, relevant,
information to effectively do their jobs. Your company can’t afford to manage its
site without knowing how it is being used.
As you’ll see Web Analytics products/services such as Omniture’s SiteCatalyst can
provide answers to your portal usage questions.
Addressing Your Business Centric Portal Analytics Needs
Some of your business centric portal analytics needs can be addressed via the
portal performance reports, but solutions such as Omniture SiteCatalyst or NetIQ
WebTrends provide a more complete understanding of how your portal is being
used.
The Oracle Portal Performance Reports are included within Oracle Portal. The
reports provide the following types of information: How long an overall request
took, how much of that time was spent in a user's procedure, what user made the
request, whether a database connection was obtained from the connection pool,
what type of caching was used, etc. The reports execute against the data collected
by the performance logging service of mod_plsql. For a full description of how to
implement this logging service, please see the Tech Note 'Portal Performance
Monitoring in Oracle Portal' on Oracle Portal Center on the Oracle Technology
Network. These capabilities thus require no additional software purchase.
How to Effectively Measure and Monitor Activity in Your Portal Environment
Page 12
You could use the Oracle Portal Performance Logs to assess portal usage as well as
performance. However, the Portal Performance logs will need to be parsed to
extract the necessary data, and that data extracted to produce charts for
determining portal usage. Thus, you won’t get all the information your business
users need, and it won’t be immediate. Third party solutions, such as Omniture’s
SiteCatalyst or WebTrends, provide immediate information on portal usage.
The Oracle Portal Performance Logs are still used on My Oracle to maintain a
history of the CPU costs of generating content from within a web provider versus
the additional framework costs versus the overall page generation costs. We also
use the Portal Performance Logs to determine the fastest and slowest running
portlets. Web Analytics solutions such as SiteCatalyst and WebTrends do not
currently provide this level of portal performance information.
NetIQ WebTrends
NetIQ WebTrends works by extracting data contained within the web server logs
or by collecting data from the web client. With WebTrends 7, WebTrends
provides a remotely hosted service, as well as a customer installable software
solution. You can learn more about NetIQ WebTrends at
http://www.netiq.com/webtrends/.
Omniture SiteCatalyst
Omniture SiteCatalyst is a remotely hosted, subscription-based reporting solution
for real-time web site analysis. Omniture is the first company to provide real-time
web analytics. Omniture has been helping enterprise-class web site business
owners since 1996 to answer the tough questions that drive their online success.
Omniture’s customers include Oracle, General Motors, EBay, AOL Time Warner,
Hewlett-Packard, and more.
SiteCatalyst provides thousands of built-in and custom report combinations that
match the individual needs of your business. This flexible, in depth reporting lets
you drill down through more than just ‘average’ site statistics to identify, analyze
and measure the factors that most influence your portal’s success.
SiteCatalyst works by placing the Omniture SiteCatalyst code on the portal pages
you want to track. It provides real-time data and analysis right away. Anyone
equipped with an Omniture SiteCatalyst account can quickly, easily, and securely
get up-to-the minute information about your portal usage.
You can learn more about Omniture SiteCatalyst at www.omniture.com.
How to Effectively Measure and Monitor Activity in Your Portal Environment
Page 13
Omniture SiteCatalyst Reports
Omniture SiteCatalyst’s advanced reporting capabilities generate over 150,000
report combinations:
•
Traffic reporting lets you analyze all aspects of visitor activity, such as traffic
patterns, popular channels, preferred technology and finding methods used.
•
Customer data, including customer loyalty, sales cycle, products purchased,
promotional activity and affiliate programs, are identified by Commerce
reporting.
•
Paths reports let you track and record entire browsing paths of both your
visitors and customers, from start to finish. You can easily view your site
traffic as it flows from one page or item to the next, discover new patterns and
popular paths, or search out the specific paths that your visitors take.
•
Custom Insight reporting and a fully interactive calendar let you quickly
identify and track any factors you can identify, for any time period you choose.
These and Omniture’s other features present the facts, trends, and insight you
need to answer your portal usage questions. With the answers to your portal’s
business related questions, you can spend your time improving and executing your
portal initiatives, rather than acquiring the information needed to justify changes.
My Oracle and Business Centric Portal Analytics – Case Study
My Oracle usage has risen month-on-month since deploying Omniture
SiteCatalyst. We understand what our users are looking at, and what they are not.
We spend more time on developing the right portal. Users spend less time looking
for content.
This case study shows how My Oracle benefited through using Omniture
SiteCatalyst for its business centric portal analytics. It also describes how
SiteCatalyst was deployed on Oracle’s employee portal.
My Oracle is the portal for Oracle employees. The My Oracle business owners
have the same common business questions as you, on how their portal is being
used. Over the years, attempts were made to use the Oracle Portal logs to answer
these questions. This involved at least two servers to record and crunch, on an
overnight basis, the 3GB of log data generated on a daily basis. Yet we were
unable to answer our business user’s questions:
•
No real-time information for decision makers
•
No charting capabilities
•
No ability to answer business users questions
How to Effectively Measure and Monitor Activity in Your Portal Environment
Page 14
•
No ability to answer historic portal usage questions, since the data was not
available.
To address the business user’s needs, we examined the option of building a
comprehensive business Centric Portal Analytics solution, licensing and installing a
solution, or using a third-party hosted solution. As our requirements developed,
we decided that we wanted a hosted solution. We did not want to manage or
maintain any hardware or software, and we did have the resources required to
analyze log files or run the web analytics applications. WebTrends hosted and
installed solutions did not at that time meet our requirements. Thus we choose
Omniture SiteCatalyst for My Oracle.
With Omniture SiteCatalyst, My Oracle business owners have access to all the
reports they need, whenever they need them. Since it is easy to deploy and
administer, SiteCatalyst also saves Oracle money. Only one person - on very a
limited basis – is responsible for managing the Omniture SiteCatalyst deployment
on My Oracle.
The Omniture SiteCatalyst reports that the My Oracle business users use the most
are:
•
Most Popular Pages Report
•
Daily/Hourly Unique Visitors Per Day
•
Page Views per Hour/Day
The Most Popular Pages Report is discussed here. Usage of the other two reports
are discussed in the ‘Portal Implementation Case Study: My Oracle’ White Paper
on Oracle Portal Center on the Oracle Technology Network.
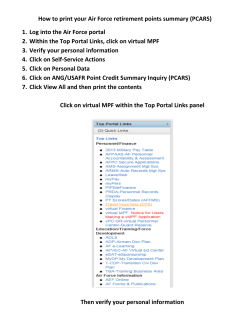
Most Popular Pages Report
The Most Popular Pages report (Figure 8) ranks pages on a site based on those
that receive the most traffic. By default, pages are ranked by the number of times
they were viewed, with the pages receiving the most page views listed first. The
Most Popular Pages report can be viewed by visits, meaning you can now see
which pages are most popular on a per-visit basis.
This report also lists all pages being tracked by SiteCatalyst, so you can verify that
the SiteCatalyst code is indeed on the pages you want to monitor. This report is
used to:
•
Identify important pages that are getting missed so we can highlight them
more prominently.
•
Evaluate marketing effectiveness related to announcements made within
Oracle.
•
Monitor traffic to all pages in one easy-to-read report.
•
Discover the pages or products in which our visitors are most interested.
How to Effectively Measure and Monitor Activity in Your Portal Environment
Page 15
Site
Picker
Date
Picker
Navigation
Tree
Most Popular
Pages Chart
Most
Popular
Pages
Figure 8. Omniture SiteCatalyst Most Popular Pages Report
Deploying Omniture SiteCatalyst on My Oracle
Omniture SiteCatalyst is a completely hosted web analytics solution. It works by
the addition of a snippet of HTML (typically < 1K) on the pages of your portal
site. In that snippet are variables with which you can customize the data being
collected. A supporting JavaScript library file (typically < 15k) is also be uploaded
to the portal website. This file is referenced by the HTML code snippet and is
downloaded once per visitor and cached.
When the page is downloaded by a visitor to the portal, the browser executes the
SiteCatalyst code while rendering the page. The SiteCatalyst code collects data
about the page view (including any custom variables employed) and initiates an
image request to the SiteCatalyst data collection servers. The data is passed in to
the server as part of the request, and the data collection servers return a 1 x 1 pixel
transparent image. The data is then processed and built into the SiteCatalyst
reports which are available over the web.
For My Oracle the supporting JavaScript library file was placed on a My Oracle
mid-tier and ‘pinned’ (i.e. permanently cached). This ensures that there is
minimum impact on My Oracle performance. The HTML code (see box below) is
added to the My Oracle ‘Footer’. The Footer is added to any page made published
to My Oracle employees. Thus Omniture SiteCatalyst automatically begins to
track usage. There is nothing required to be done from the Omniture SiteCatalyst
website to begin tracking a page.
How to Effectively Measure and Monitor Activity in Your Portal Environment
Page 16
<script language="JavaScript">
var s_pageName= ""
var url = document.location.href;
function siteCatalystPageId() {
var regexp = eval("/&_mode=16/")
var resultArray = url.match(regexp)
if (resultArray) { // On Edit page
s_pageName= document.title + " Edit Page"
} else {
s_pageName = document.title + " Page"
}
}
siteCatalystPageId();
</script>
After adding Omniture SiteCatalyst to My Oracle we found that there was on
average less than 0.3 second performance impact on the download of the first My
Oracle page that a user visits. There is less than a 0.1 second performance impact
on the download of subsequent pages, since the user’s browser caches the
Omniture SiteCatalyst cookies.
Summary
In summary, the Portal Performance Logs are useful for answering
technical/performance questions. Third party solutions, such as WebTrends and
Omniture, are useful for answering business related questions, such as portal usage.
When Oracle looked at means to collect usage statistics and building our solution
based off the Portal reports, the advantage of Omniture SiteCatalyst over locally
stored usage statistics is that it provided real-time business centric portal analytics.
How have the My Oracle business owners and the portal users benefited from
business centric portal analytics? Take a look:
•
•
Business owner benefits:
o
Receive current information to make immediate decisions.
o
Know how our portal is being used… Make better decisions.
o
Understand the users better, so can provide what they need.
My Oracle user benefits
o
•
Users spend less time looking for content they need.
My Oracle portal administrators and DBA benefits:
o
Spend more time on developing the right portal.
The business owners and the portal users have benefited from the addition of
Omniture SiteCatalyst to My Oracle. The business owners receive the reports they
How to Effectively Measure and Monitor Activity in Your Portal Environment
Page 17
need. Oracle employees receive more relevant content. The corporation saves
money through lower costs of providing the reports.
For My Oracle, installation of Omniture SiteCatalyst involved two easy steps:
•
Deploy the Omniture SiteCatalyst base JavaScript file to a My Oracle middletier
•
Add the Omniture SiteCatalyst HTML file to the My Oracle footer
CONCLUSION
The combination of Oracle Portal 10g, Oracle Enterprise manager and business
centric portal analytics products/services such as Omniture SiteCatalyst and
WebTrends provide powerful and yet easy to use tools to manage, monitor and
measure your Portal deployments.
How to Effectively Measure and Monitor Activity in Your Portal Environment
Page 18
How to Effectively Measure and Monitor Activity in Your Portal Environment
December 2004
Authors: Jitinder ‘Jay’ Sethi, Michael Andrew
Oracle Corporation
World Headquarters
500 Oracle Parkway
Redwood Shores, CA 94065
U.S.A.
Worldwide Inquiries:
Phone: +1.650.506.7000
Fax: +1.650.506.7200
www.oracle.com
Copyright © 2004, Oracle. All rights reserved.
This document is provided for information purposes only
and the contents hereof are subject to change without notice.
This document is not warranted to be error-free, nor subject to
any other warranties or conditions, whether expressed orally
or implied in law, including implied warranties and conditions of
merchantability or fitness for a particular purpose. We specifically
disclaim any liability with respect to this document and no
contractual obligations are formed either directly or indirectly
by this document. This document may not be reproduced or
transmitted in any form or by any means, electronic or mechanical,
for any purpose, without our prior written permission.
Oracle is a registered trademark of Oracle Corporation and/or its
affiliates. Other names may be trademarks of their respective owners.


© Copyright 2026