
How to Verify and Update Retention Times in and MultiQuant™ Software Scheduled
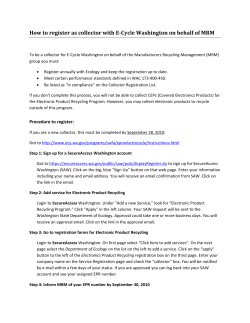
How to Verify and Update Retention Times in
Scheduled MRM™ Acquisition Methods using Analyst® and
MultiQuant™ Software
André Schreiber and Yun Yun Zou
AB SCIEX Concord, Ontario (Canada)
Overview
The following document describes a procedure to update
retention times and other parameters when transferring
acquisition methods using the Scheduled MRM™ algorithm from
one laboratory to another.
The following steps need to be completed to update the
acquisition method:
®
1.
Open original acquisition method in Analyst software and
export MRM method table into Excel worksheet.
2.
Run standard mix using the original acquisition method.
3.
Process and review in Analyst or MultiQuant™ software to
verify and update retention times. Copy updated retention
times from result table into Excel worksheet.
4.
Copy MRM method table from updated Excel worksheet into
®
Analyst software.
5.
Adjust Scheduled MRM™ parameters and save updated
acquisition method.
®
1. Export MRM Method
®
Open the original acquisition method in Analyst software
(Figure 1).
Two MRM transitions are monitored per compound. Target
analytes are in alphabetical order. A large ‘MRM detection
window’ of 180 seconds is recommended for verification to
ensure that all compounds will be detected after transferring the
method to another LC system.
Highlight the MRM table to export all parameters. This can be
done by simply clicking the top-left corner of the table. Copy the
complete table using ‘Ctrl+C’ (Figure 2).
Figure 1. Original Scheduled MRM™ method
Paste the table into an empty worksheet in Excel using ‘Ctrl+V’.
Add a header row and delete all empty and duplicate columns
(Figure 3).
p1
Figure 2. Highlight the MRM table and copy parameters
Figure 4. Multi-pesticide standard at 1 ng/mL analyzed using an AB
SCIEX QTRAP® 5500 system
3. Review Data to Update Retention Times
3.1. Using Analyst® Software
®
Build a new quantitation method in Analyst software. Analyte
names, MRM transitions, and retention times will be populated
automatically (Figure 5).
Figure 3. Paste parameters into Excel (top), add a header row and
remove empty and duplicate columns
2. Run Standard Mix
Run a mix of all standards using the original acquisition method
(Figure 4). The concentration must be high enough to provide
sufficient signal. The mix should be dissolved in aqueous mobile
phase to avoid distorted peak shape of early eluting compounds.
Figure 5. Build a new quantitation method
Note: when the target list is very extensive it might be helpful to
also run sub-mixes separately to reduce isobaric interferences.
For reliable integration the following default settings are
recommended: MQ3 algorithm with ‘Noise Percentage’ 80%,
‘Peak-Splitting Factor’ 1, ‘Report Largest Peak’ off, ‘Minimum
Peak Height’ 100 cps, ‘Minimum Peak Width’ 3 sec, and
‘Smoothing Width’ 3 points.
p2
Create a result table using the built quantitation method using
the ‘Quantitation Wizard’. Review all peaks. It is recommended
to review MRM transitions in pairs. Update integration if needed
by (1) highlighting the peak, (2) clicking the ‘Select Peak’ icon,
and (3) clicking ‘Accept’ (Figure 6).
Figure 8. Chart comparing original and updated retention times to identify
possible integration errors
Figure 6. Review all peaks and update retention times if needed
Replace the original retention times with updated retention times
in the Excel worksheet once all review is completed (Figure 9).
Copy and paste the retention time column into the Excel
worksheet after completing the peak review (Figure 7).
Figure 9. Replace original retention times with updated retention times
3.2. Using MultiQuant™ Software
Create a new quantitation method and result table in
MultiQuant™ software. Analyte names, MRM transitions, and
retention times will be populated automatically. Group names
should be added for easier data review (Figure 10).
Figure 7. Copy and paste updated retention times into Excel
Plotting original and updated retention times is useful to identify
possible integration errors (Figure 8).
Figure 10. Build a new quantitation method
p3
For reliable integration the following default settings are
recommended: MQ4 algorithm with ‘Gaussian Smooth Width’ 1.0
points, ‘Report Largest Peak’ off, ‘Min. Peak Width’ 3 sec, ‘Min.
Peak Height’ 100 cps, ‘Noise Percentage’ 80%, and ‘Peak
Splitting’ 1.
Copy and paste the retention time column into the Excel
worksheet after completing the peak review (Figure 12).
Review all peaks. It is recommended to review MRM transitions
in pairs. Defining group names allows to overlay MRM pairs.
Update integration if needed by simply highlighting the peak
(Figure 11).
Replace the original retention times with updated retention times
in the Excel worksheet once all review is completed (Figure 9).
Plotting original and updated retention times is useful to identify
possible integration errors (Figure 8).
4. Update Acquisition Method
Activate all compound dependent parameters in the acquisition
method before pasting by right-click on the method table and
checking all 4 parameters (Figure 12).
Figure 12. Activate all compound dependent parameters in the
acquisition method by right-click on the table
Figure 11. Review all peaks and update retention times if needed
Copy and paste the complete MRM table with updated retention
®
times from Excel into Analyst software (Figures 13 and 14).
Figure 13. Copy and paste updated method table into Analyst® software
Figure 12. Copy and paste updated retention times into Excel
p4
5. Adjust Scheduled MRM™ Parameters and
Save Updated Acquisition Method
Adjust the ‘MRM detection window’ and ‘Target scan time’
depending on chromatographic peak shape (Figure 14).
The ‘MRM detection window’ is an estimate of the LC peak width
and chromatographic reproducibility. It should be large enough to
contain the entire LC peak plus any shifts of retention time.
The ‘Target scan time’ defines how often the chromatographic
peak should be sampled. This is determined from the peak width
at the base. The best accuracy and reproducibility is between
10-15 points across the LC peak.
Figure 14. Adjust Scheduled MRM™ parameters in the updated
acquisition method
After updating the acquisition method save the .dam file using a
new name.
For Research Use Only. Not for use in diagnostic procedures.
© 2011 AB SCIEX. The trademarks mentioned herein are the property of AB Sciex Pte. Ltd. or their respective owners. AB SCIEX™ is being used under license.
Publication number: 4610211-01
353 Hatch Drive Foster City CA
Headquarters
500 Old Connecticut Path, Framingham, MA 01701 USA
Phone 508-383-7700
www.absciex.com
International Sales
For our office locations please call the division
headquarters or refer to our website at
www.absciex.com/offices


© Copyright 2026