
Annual Health Sector Performance Report Financial Year 2010/2011 THE REPUBLIC OF UGANDA
THE REPUBLIC OF UGANDA Annual Health Sector Performance Report Financial Year 2010/2011 Foreword The Annual Health Sector Performance Report for 2010 - 11 provides progress of the annual workplan as well as the overall health sector performance against the set targets for the Financial Year 2010/11. The 2010/11 annual report also marks the beginning of the Health Sector Strategic and Investment Plan 2010/11 – 2014/15. It also reports on implementation progress against the sector priorities set at the 7th National Health Assembly and the 16th Joint Review Mission. The Government of Uganda recognizes the contribution of Health Development Partners, Civil Society, the Private Sector and all Ugandans in the achievement of the progress reported in the sector performance. The sector is committed to refocusing priorities to interventions aimed at making positive progress towards achieving the National Development Plan targets and Millennium Development Goals. This report coincides with the launching of the Monitoring and Evaluation Plan for the HSSIP 2010/11 – 2014/15. The Monitoring and Evaluation Plan has been aligned to the Monitoring and Evaluation Strategy of the National Development Plan to regularly and systematically track progress of implementation of priority initiatives of the HSSIP and assess performance at all levels in accordance with the agreed objectives and performance indicators. The sector will continue to prioritize interventions deÀned in the Uganda National Minimum Health Care Package under a Sector-Wide Approach arrangement, so as to maximize gains from invested resources. This will further be supported by the International Health Partnerships, the Paris Declaration on Harmonization and Alignment and the Accra Agenda for Action and related initiatives. I wish to thank the Technical Working Groups, the Task force and Partners that compiled this report. For God and My Country Hon. Dr. Ondoa D.J Christine MINISTER OF HEALTH A n n u a l H e a l t h S e c t o r P e r f o r m a n c e R e p o r t 2 0 1 0 / 11 iii iv A n n u a l H e a l t h S e c t o r P e r f o r m a n c e R e p o r t 2 0 1 0 / 11 Dr. ChrisƟne Ondoa Minister of Health Dr. Richard Nduhura Minister of State (General DuƟes) A n n u a l H e a l t h S e c t o r P e r f o r m a n c e R e p o r t 2 0 1 0 / 11 v Dr. Asuman Lukwago Ag: Permanent Secretary Dr. Ruth Aceng Director General Health Service Dr. Nathan Kenya- Mugisha Director Health Services Clinical and Community Health vi Dr. Isaac EzaƟ Director Health Services Planning and Development A n n u a l H e a l t h S e c t o r P e r f o r m a n c e R e p o r t 2 0 1 0 / 11 Table of Contents Foreword....................................................................................................................................................... iii List of Tables ................................................................................................................................................. xi List of Figures .............................................................................................................................................. xiii Acronyms .................................................................................................................................................... xiv ExecuƟve Summary..................................................................................................................................... xviii 1 CHAPTER ONE INTRODUCTION ........................................................................................................... 1 1.1 Background ................................................................................................................ ................. 1 1.2 Vision, Mission, Goal and Strategic ObjecƟves during the HSSIP 2010/11 – 2014/15 ............... 1 1.2.1 Vision................................................................................................................................... 1 1.2.2 Mission ................................................................................................................................ 1 1.2.3 Goal ..................................................................................................................................... 1 1.2.4 Strategic ObjecƟves ............................................................................................................ 1 1.3 Projected Demographics for 2010 .............................................................................................. 2 1.4 The framework for achieving Millennium Development Goals (MDGs), NaƟonal Development Goals and HSSIP 2010/11 – 2014/15 ...................................................................................................... 2 1.5 2 The Annual Health Sector Performance Report FY 2010/11 ...................................................... 3 1.5.1 The draŌing process ........................................................................................................... 3 1.5.2 Sources of InformaƟon ....................................................................................................... 4 1.5.3 Overview of the report outline ........................................................................................... 4 OVERALL PROGRESS AND PERFORMANCE ......................................................................................... 6 2.1 Overall Summary of Progress towards NDP Indicators .............................................................. 6 2.1 Overall Summary Progress towards MDG, JAF and HSSIP 2010/11 – 2014/15 Indicators ......... 8 2.1.1 Health Impact Indicators..................................................................................................... 8 2.1.2 Morbidity: Level and Trends ............................................................................................... 11 2.1.3 Performance against lead indicators for HIV/AIDS, Malaria and TB................................... 12 A n n u a l H e a l t h S e c t o r P e r f o r m a n c e R e p o r t 2 0 1 0 / 11 vii 2.2 Health Services Coverage............................................................................................................ 15 2.3 Coverage with Other Health Determinants ................................................................................ 16 2.4 Health Quality and Outputs ........................................................................................................ 17 2.5 Health Investments ..................................................................................................................... 19 2.6 Benchmarking Uganda's progress relaƟve to 11 peer countries ................................................ 23 2.7 Summary of the Financial Report 2010/11 FY ............................................................................ 25 2.7.1 Trends of the health sector funding (2000/01-2010/11).................................................... 26 2.7.2 Financial Performance for Local Governments (LGs).......................................................... 27 2.8 Summary Assessment of the Health System / Health Sector Support System........................... 32 2.9 Global Fund (GF) Supported IntervenƟons 2010/11 .................................................................. 33 2.10 Global Alliance for Vaccines and ImmunisaƟon (GAVI) Progress 2010/11................................. 34 2.11 Health Partnerships Performance............................................................................................... 34 2.1 Decentralized Responses ............................................................................................................ 35 2.1.1 Progress made towards achieving internaƟonal resoluƟons and obligaƟons e.g. WHO, ECSA, IHP+ ........................................................................................................................................... 38 2.2 Local Government Performance ................................................................................................. 41 2.2.1 2.3 District League Table Performance ..................................................................................... 41 Service Delivery ........................................................................................................................... 48 2.3.1 Hospital Performance ......................................................................................................... 48 2.3.2 Regional Referral Hospitals ................................................................................................. 49 2.3.3 General Hospitals ................................................................................................................ 56 2.3.4 FuncƟonality of HC IVs ........................................................................................................ 58 2.4 Assessment of Village Health Team (VHT) FuncƟonality ............................................................ 62 2.5 Conclusion ................................................................................................................ ................... 64 viii A n n u a l H e a l t h S e c t o r P e r f o r m a n c e R e p o r t 2 0 1 0 / 11 3 ANNEX ....................................................................................................................... .......................... 65 3.1 Assessment of Performance against Planned Key Outputs in the MPS 2010/11 ....................... 65 3.2 The Compact for implementaƟon of the HSSIP 2010/11 – 2014/15 .......................................... 77 3.3 Delivery of the Uganda NaƟonal Minimum Health Care Package (UNMHCP) ......................... 80 3.3.1 Cluster 1: Health promoƟon, disease prevenƟon, and community health iniƟaƟves ...... 80 3.3.2 Cluster 2: Maternal and Child Health ................................................................................. 91 3.3.3 PrevenƟon and Control of Communicable Diseases ......................................................... 104 3.3.4 Diseases Targeted for EliminaƟon .................................................................................... 111 3.3.5 PrevenƟon and Control of Non-communicable CondiƟons.............................................. 116 3.4 Integrated Health Sector Support Systems ............................................................................... 132 3.4.1 Human Resources for Health ............................................................................................ 132 3.4.2 Health Infrastructure Development and Management .................................................... 133 3.4.3 Management of EssenƟal Medicines and Supplies........................................................... 135 3.4.4 NaƟonal Drug Authority .................................................................................................... 137 3.4.5 InformaƟon for Decision Making ...................................................................................... 138 3.4.6 Quality of Care .................................................................................................................. 140 3.4.7 Health Policy, Planning and Support Services ................................................................... 142 3.4.8 Legal and Regulatory Framework ..................................................................................... 147 3.4.9 Research ............................................................................................................................ 152 3.4.10 Uganda NaƟonal Health Research OrganisaƟon .............................................................. 152 3.4.11 Natural ChemotherapeuƟcs Research InsƟtute (NCRI) .................................................... 153 3.4.12 Uganda Virus Research InsƟtute (UVRI) ........................................................................... 155 3.4.13 Public Private Partnership for Health ............................................................................... 156 3.4.14 Health Services and Health Status in Recovery Areas ...................................................... 158 3.5 Monitoring and EvaluaƟon of ImplementaƟon of the HSSIP 2010/11 – 2014/15 ................... 163 3.6 Data Quality report ................................................................................................................... 165 A n n u a l H e a l t h S e c t o r P e r f o r m a n c e R e p o r t 2 0 1 0 / 11 ix 3.7 Progress on ImplementaƟon of the Priority AcƟons of the 16 th Joint Review Mission ............ 173 3.8 Progress on ImplementaƟon of the RecommendaƟons of the 7 th Annual Health Assembly ... 183 3.9 Annual Epidemics Update July 2010 to June 2011 .................................................................. 192 3.10 Development Partner Support Areas ....................................................................................... 198 3.11 District League Table 2010/11 .................................................................................................. 212 x A n n u a l H e a l t h S e c t o r P e r f o r m a n c e R e p o r t 2 0 1 0 / 11 List of Tables Table 1: Demographic Information ..............................................................................................................2 Table 2: Performance against the 8 NDP indicators for the HSSIP 2010/11 -2014/15 Period .........6 Table 3: Top ten causes of hospital based mortality for all ages in 2010/11 FY ...................................9 Table 4: Top ten causes of morbidity among all ages from 2009/10 to 2010/11 FY ...........................12 Table 5: Performance against selected HIV/AIDS Programme lead indicators ....................................13 Table 6: Performance against selected Malaria Control Programme lead indicators .............................14 Table 7: Performance against the TB Programme Lead Indicators .........................................................14 Table 8: Performance for health services core indicators ..........................................................................15 Table 9: Performance for coverage for other health determinants and risk factors indicators during 2010/11 FY .............................................................................................................................................17 Table 10: Performance for health system output (availability, access, quality, safety) indicators ........18 Table 11: Performance for coverage for health investments and governance indicators .....................20 Table 12: Staffing Levels in the public sector filled by trained health personnel - October 2010 .......21 Table 13: Cadre: Population Ratio ................................................................................................................22 Table 14: Rank for key health indicators for 12 countries, including Uganda (WHO, 2011) ..............24 Table 15: Government allocation to the Health Sector 2000/01 to 2010/11 ........................................26 Table 16: Primary Health Care Grants FY 2000/2001-2010/11 in billions of Ug. Shillings ...............27 Table 17: Government of Uganda health sector budget performance for FY 2010/11 (excluding donor projects) ........................................................................................................................................28 Table 18: Local Government Grant Performance for FY 2010/11 ........................................................29 Table 19: Financial Performance for Central Institutions and Referral Hospitals for FY 2010/11 (UGX Billion) ..........................................................................................................................................29 Table 20: Summary of performance by Vote Function .............................................................................32 Table 21: Summary Matrix for monitoring progress of implementation of the Compact ...................34 Table 22: HPAC Institutional representatives’ attendance Jul 2010 – Jun 2011 ....................................35 Table 23: Project Support to Local Governments ......................................................................................36 Table 24: Top 15 performing districts ..........................................................................................................42 Table 25: Bottom 15 performing districts ...................................................................................................42 Table 26: District ranking for the top new districts ..................................................................................42 Table 27: District ranking for the bottom new districts ...........................................................................42 Table 28: District ranking for districts with regional/national referral hospitals ...................................43 Table 29: District ranking for hard-to-reach districts .................................................................................44 Table 30: District ranking for Peace Recovery and Development Plan (PRDP) districts ....................44 Table 31: District ranking by district population ........................................................................................45 Table 32: Staffing levels for top ten districts Table 33: Staffing Levels for Bottom ten districts .47 Table 34: Financial Performance for RRHs for FY 2010/11 (UGX Billions) .......................................49 Table 35: Positions filled in Regional Referral Hospitals ...........................................................................50 Table 36: Overall performance for Regional Referral and Large PNFP Hospitals ...............................51 Table 37: Key Hospital Outputs in RRHs and Large PNFP Hospitals...................................................53 Table 38: Selected Efficiency Parameters RRHs and Large PNFP hospitals 2010/11 .........................54 Table 39: Summary of Efficiency Parameters RRHs and Large PNFP hospitals 2010/11 ..................55 A n n u a l H e a l t h S e c t o r P e r f o r m a n c e R e p o r t 2 0 1 0 / 11 xi Table 40: Outputs from the General Hospitals FY 2010/11 ....................................................................56 Table 41: Selected efficiency parameters for General Hospitals ...............................................................57 Table 42: HC IVs with 11 of the 11 functionality indicators ....................................................................59 Table 43: Provision of selected key health services by HC IVS ...............................................................60 Table 44: Progress in implementation of the Country Compact 2010/11 – 2014/15 during 2010/11 FY..............................................................................................................................................................77 Table 45: NUSAF2 support to Health Sector 2010-11 ........................................................................... 158 Table 46: District monthly reporting completeness rate and districts with poor completeness rate 166 Table 47: Facility reporting completeness rate and districts with poor completeness rate ................ 167 Table 48: Extreme and moderate outliers among data points for 2008/09 and 2010/11 for 4 indicators ............................................................................................................................................... 168 Table 49: Percentage difference between monthly data and end-of-year data at the national level, and districts with a large discrepancy ....................................................................................................... 168 Table 50: Consistency ratio for ANC1 at national level, and districts with very low and very high consistency ratios ................................................................................................................................. 170 Table 51: Comparison of coverage rates from surveys and from facility reports ............................... 170 Table 52: Top 15 and bottom 15 scoring districts based on ranking using adjusted district populations. .......................................................................................................................................... 172 xii A n n u a l H e a l t h S e c t o r P e r f o r m a n c e R e p o r t 2 0 1 0 / 11 List of Figures Figure 1: Under 5 Mortality trends in Uganda.............................................................................................8 Figure 2: Trends in IP Mortality 2009 – 2011 .............................................................................................10 Figure 3: MMR Trends in Uganda ................................................................................................................11 Figure 4: Health facility-based maternal deaths in FY 2009/10 and 2010/11........................................11 Figure 5: The Density of Health Personnel GOU and PNFP ..................................................................21 Figure 6: Uganda's progress benchmarked relative to the peer countries over time for the period 1990 to 2010. ...........................................................................................................................................24 Figure 7: Trends in PHC Grant Allocations 2000/01 – 2010/11 ............................................................28 Figure 8: District population vs. total score .................................................................................................45 Figure 9: Filled staff positions in RRHs .......................................................................................................50 Figure 10: Volume of Outputs Regional Referral and Large PNFP hospitals .......................................51 Figure 11: Trends in Caesarean Section and Blood transfusion ...............................................................60 Figure 12: Reported number of Stillbirths by month .............................................................................. 94 Figure 13: Vitamin A Supplementation among under fives ................................................................... 103 Figure 14: Total average district league scores districts for Uganda and Karamoja region ............... 161 Figure 15: District league scores Karamoja ............................................................................................. 162 Figure 16: National health facility data quality assessment: summary of results ................................. 165 Figure 17: Trend in DTP3 coverage under 1 year of age (%), Uganda 2000-2010 ............................. 171 Figure 18: Comparison of HMIS and DHS coverage rates for institutional deliveries and ANC four or more visits................................................................................................................................ 171 Figure 19: DPT3 Coverage by district FY2010/11............................................................................... 208 Figure 20: Deliveries in Government and PNFP facilities by district FY2010/11 .......................... 208 Figure 21: OPD utilization by district FY 2010/11 ............................................................................. 209 Figure 22: HIV testing in infants born of HIV positive women by district FY 2010/11.............. 209 Figure 23: Latrine coverage in households by districts FY 2010/11 ................................................... 210 Figure 24: Pregnant women receiving 2nd dose of Fansidar for IPT by district FY 2010/11 ........ 210 Figure 25: Pregnant women attending ANC 4th visit by district FY 2010/11.....................................211 Figure 26: Approved posts that are filled by district FY 2010/11..........................................................211 A n n u a l H e a l t h S e c t o r P e r f o r m a n c e R e p o r t 2 0 1 0 / 11 xiii Acronyms ACT AHSPR AIDS ANC ART ARVs BFHI CAO CB-DOTS CCM CDC CDD CDP CDR CEmoC CPR CPT CSO CYP DHO DHMT DLT DOTS DPs DPT EAC ECSA-HC EID EMHS EmOC FP FY GAVI GBV GF GH GoU HAART HC HCI USAID xiv Artemisinin Combination Therapies Annual Health Sector Performance Report Acquired Immuno-Deficiency Syndrome Ante Natal Care Anti-retroviral Therapy Antiretroviral Drugs Baby Friendly Health Initiative Chief Administrative Officer Community Based TB Directly Observed Treatment Country Coordinating Mechanism Centres for Disease Control Control of Diarrhoeal Diseases Child Days Plus Case Detection Rate Comprehensive Emergency Obstetric Care Contraceptive Prevalence Rate Cotrimoxazole Prophylaxis Civil Society Organization Couple Years of Protection District Health Officer District Health Management Team District League Table Directly Observed Treatment, short course (for TB) Development Partners Diphtheria, Pertussis (whooping cough) and Tetanus vaccine East African Community East Central and Southern Africa - Health Community Early Infant Diagnosis Essential Medicines and Health Supplies Emergency Obstetric Care Family Planning Financial Year Global Alliance for vaccines and Immunization Gender Based Violence Global Fund General Hospital Government of Uganda Highly Active Anti-Retroviral Therapy Health Centre Health Care Improvement Project A n n u a l H e a l t h S e c t o r P e r f o r m a n c e R e p o r t 2 0 1 0 / 11 HCT HDP HIV HMBF HMIS HPAC HRH HSD HSSIP HSSP ICU IDSR IEC IMAM IMCI IPT IRS ITNs JAF JBSF JICA JMS JRM KDS LG LLINs MCH MDGs MDR MMR MOFPED MoGLSD MOH MOLG MOPS MOPS MOU MTEF NCD NCRI HIV/AIDS Counselling and Testing Health Development Partners Human Immuno-Deficiency Virus Home Based Management of Fever Health Management Information System Health Policy Advisory Committee Human Resources for Health Health Sub-Districts Health Sector Strategic Investment Plan Health Sector Strategic Plan Intensive Care Unit Integrated Disease Surveillance and Response Information Education and Communication Integrated Management of Acute Malnutrition Integrated Management of Childhood Illness Intermittent Presumptive Treatment for malaria Indoor Residual Spraying Insecticide Treated Nets Joint Assessment Framework Joint Budget Support Framework Japan International Cooperation Agency Joint Medical Stores Joint Review Mission Kampala Declaration on Sanitation Local Government Long Lasting Insecticide Treated Nets Maternal and Child Health Millennium Development Goals Multi-drug Resistant Maternal Mortality Ratio Ministry of Finance, Planning and Economic Development Ministry of Gender, Labour and Social Development Ministry Of Health Ministry of Local Government Ministry of Planning and Survey Ministry of Public Service Memorandum of Understanding Medium Term Expenditure Framework Non Communicable Diseases National Chemotherapeutic Research Institute A n n u a l H e a l t h S e c t o r P e r f o r m a n c e R e p o r t 2 0 1 0 / 11 xv NDA NGOs NHA NHP NMCP NMS NTDs NTLP OPD OPM OPV ORS ORT PHA PHAST PHC PLWHA PMTCT PNFP PPPH PRDP RH RRH RUTF SHSSPP SLD SMC SMER SP STI SUO SWAP TB TMC TSR TT TWG UACP UBOS UBTS UCI xvi National Drug Authority Non-Governmental Organisations National Health Assembly National Health Policy National Malaria Control Programme National Medical Stores Neglected Tropical Diseases National Tuberculosis and Leprosy Control Program Out Patients Department Office of the Prime Minister Oral Polio Vaccine Oral Rehydration Salt Oral Rehydration Therapy People with HIV/AIDS Participatory Hygiene and Sanitation Transformation Primary Health Care People with HIV/AIDS Prevention of Mother to Child Transmission Private Not for Profit Public Private Partnership for Health Peace Recovery and Development Plan Reproductive Health Regional Referral Hospital Ready to Use Foods Support to the Health Sector Strategic Plan Project Second Line Drugs Senior Management Committee Supervision, Monitoring, Evaluation and Research Sulfadoxine/Pyrimethamine Sexually Transmitted Infection Standard unit of Output Sector-Wide Approach Tuberculosis Top Management Committee Treatment Success Rate Tetanus Toxoid Technical Working Group Uganda Aids Control Program Uganda Bureau of Statistics Uganda Blood Transfusion Services Uganda Cancer Institute A n n u a l H e a l t h S e c t o r P e r f o r m a n c e R e p o r t 2 0 1 0 / 11 UDHS UGFATM UHSSP UHI UNEPI UNFPA UNHRO UNICEF UNMHCP UVRI VHT WHO Uganda Demographic and Health Survey Uganda Global Fund for AIDS, TB and Malaria Uganda Health Systems Strengthening Project Uganda Heart Institute Uganda Expanded Programme on Immunization United Nations Fund for Population Activities Uganda National Health Research Organisation United Nations Children’s Fund Uganda National Minimum Health Care Package Uganda Virus Research Institute Village Health Teams World Health Organisation A n n u a l H e a l t h S e c t o r P e r f o r m a n c e R e p o r t 2 0 1 0 / 11 xvii Executive Summary This Annual Health Sector Performance Report marks the beginning the Health Sector Strategic and Investment Plan (HSSIP) 2010/11 -2014/15. The report mainly focuses on the progress of the annual workplan as well as overall sector performance against the targets set for the FY 2010/11, the first year of the HSSIP 2010/11 -2014/15 but also provides progress in relation to performance of the previous years. The development process of the AHSPR 2010/11 was widely consultative with stakeholders from all departments of the Ministry of Health (MoH), Development Partners (DPs) and Implementing Partners. The overall coordination and technical support was provided by a MoH Task Force (TF). Background This Annual Health Sector Performance Report is the first report for the Health Sector Strategic and Investment Plan (HSSIP) 2010/11 -2014/15. The delivery of the Uganda National Minimum Health Care Package is central to the implementation of the HSSIP and the attainment of the sector goals and objectives. This report focuses on the progress of the annual workplan, as well as the overall sector performance against the targets set for the FY 2010/11, the first year of the HSSIP 2010/11 -2014/15. The development process of the AHSPR 2010/11 was widely consultative with involvement from all departments of the Ministry of Health (MoH), Development Partners (DPs) and Implementing Partners. The overall coordination and technical support was provided by a MoH Task Force. Data The report focuses on the core indicators of the monitoring and evaluation plan of HSSIP, which are linked with the monitoring of the National Development Plan and international initiatives such as the MDG. The report is based on the health facility and district reports gathered as part of the HMIS, administrative sources and programme data, including both quantitative and qualitative data. A thorough analysis of the quality of the HMIS data shows that overall reporting can be considered fairly reliable, but that there is considerable variation between districts which affects the league tables. Coverage estimates based on the HMIS data use population projections to estimate the target populations and should be considered as only indicative as the last census was conducted in 2002. No new household survey data were available for this performance report. No separate verification of data quality and facility service readiness (e.g. medicines availability) was conducted. National progress and performance Inputs and processes: money, policies and workforce The total public health expenditure per capita decreased from UGX 24,423 (US$11.1) in 2009/10 to UGX 20,765 (US$ 9.4) in 2010/11, mainly because of a decrease in externally contributions which only constituted 14% of total public health expenditure in 2010/11, xviii A n n u a l H e a l t h S e c t o r P e r f o r m a n c e R e p o r t 2 0 1 0 / 11 compared with 39% in the three preceding years. The government expenditure on health as a percent of total government expenditure remained around 9%, as it has been for the last decade, well off from the Abuja target of 15% but on target for HSSIP 2010/11 (8.8%). The amount spent on health, however, increased because of economic growth. Limiting the large fluctuations in external funding for health and ways to increase the government contribution should be priority areas for planning. There was a remarkable increase in the proportion of villages/wards with trained village health teams (VHTs), according to a survey in 2010, in line with the expansion to a further 18 districts. Medical professionals however are well below the WHO minimum target of 23 health workers per 10,000 population: Uganda had 15 health workers per 10,000, including 0.36 doctors, 0.71 clinical officers, 2.8 nurses and 1.4 midwives. The health sector efforts in ensuring attainment and maintenance of an adequately sized, equitably distributed and appropriately skilled workforce were hampered by the ban on recruitment as a result of a limited wage will. Overall, 56% of public sector positions were filled, short of the 60% target for 2010/11 FY. The shortfall is greatest in district health units where 52% of 27,180 positions were filled. There is need to advocate for increasing staffing levels for the entire critical cadre for effective and efficient utilisation of health investments. Among the central level vote functions, the Support to Health Sector Strategic Plan Project performed best against planned outputs in the MPS (score 80%), followed by pharmaceutical and other supplies (75%) and sector monitoring and quality assurance (60%). The majority of the vote functions had performance moderate performance (40 – 80%) and the major challenges were related to procurement for infrastructure development projects, inadequate funding and delayed release of funds for other operational activities. The Country Compact 2010/11 – 2014/15, signed by MoH, HDPs, CSOs and the private sector, has 14 key planned outputs in the areas of planning and budgeting, monitoring programme implementation and performance, and policy guidance and monitoring. Overall, only 4 of the 14 outputs received good marks (>80% implementation), 4 moderate (40-80%) and 6 were rated as poor (<40%). The performance was poorest in planning and budgeting and adequate in policy guidance and monitoring. There is need to establish an efficient M&E system for the Compact and Senior Management Structures. Considerable progress made towards achieving international resolutions and obligations specifically East Central and Southern Africa Health Community. With the recruitment of a Global Desk Officer, the sector expects better monitoring and documentation. Service outputs Drug availability improved signiĮcantly, with 43% of faciliƟes reporƟng no stock out of the six tracer drugs in the Įrst and last quarters of 2010/11, up from 21% in the preceding year. The proporƟon of Health Centre IV to provide comprehensive emergency obstetric care (blood transfusion and Caesarian secƟon) remained low: 24% compared with 23% in the year before. TB treatment success rates, an indicator of the quality of care, increased slightly from 66% to A n n u a l H e a l t h S e c t o r P e r f o r m a n c e R e p o r t 2 0 1 0 / 11 xix 69%, but fell short of the 75% target of FY 2010/11. Access to HIV counseling and testing services remained the same (38% of 4,980 facilities), but the percent of facilities offering PMTCT services increased from 23% in FY 2009/10 to 32% in FY 2010/11. Outpatient department (OPD) service utilization is an indicator of accessibility of the services. There were 34.9 million OPD visits in FY 2010/11, compared with 36.8 million in the year before. The average was 1.1 OPD visit per person per year (target 1.0 visit). The top three diagnoses for OPD visits are malaria (36% of all visits), common cold or cough (19%) and intestinal worms (5%), which was very similar to the years before. Service coverage and determinants There was varied performance in the health services coverage indicators, but overall trends were positive. More women delivered in health facilities (39%, up from 33% in 2009/10), but fewer pregnant women made four antenatal care visits (32%, down from 47%) and received IPT2 for malaria risk reduction (43%, down from 47%). There is need to investigate the reversal or stagnation of trends in the maternal health services. Immunization coverage with pentavalent vaccine was 90%, up from 76% in the preceding year, and so was measles (85%, up from 72%), most likely due to vaccination campaigns in many districts and strengthening of the delivery system. Contraceptive use, measured by Couple Years of Protection and the UBOS panel survey, also increased to 33% in 2010. No reliable facility data were available to ascertain trends in coverage of HIV services, except that almost all HIV positive people were initiated on co-trimoxazole (95%). TB case notifications increased from 43,335 in FY 2009/10 to 45,546 in FY 2010/11, but it was estimated that case detection rate remained low at 54%. The proportion of TB patients tested for HIV increased from 72% to 81% and the percent HIV-TB patients started on CPT increased from 86% to 90%, and both indicators were on FY 2010/11 target. Performance assessment for coverage for other health determinants and risk factors is not conclusive for the year under review. Information is available for only one (% of household with latrine which improved from 69.7% to 71%) out of four indicators. Health impact There are no new child and maternal mortality data available until the UDHS 2011 results are out. The maternal mortality reporting system is currently inadequate, but figures suggest indicate that maternal mortality in hospitals and health centres, where 39% of deliveries take place, is at least 200 per 100,000 live births, and national rates should be considerably higher. Figures from the many hospitals are currently high and it should be a priority to develop a high quality maternal mortality surveillance and response system. Malaria is the leading cause of mortality among all ages in hospitals, causing 27% of 5,331 deaths, followed by anaemia (12%) and pneumonia (11%). A comparison with 11 peer countries in the African region shows that Uganda's performance on coverage and health outcome indicators is about average for the group. Uganda does better xx A n n u a l H e a l t h S e c t o r P e r f o r m a n c e R e p o r t 2 0 1 0 / 11 than average on inputs (money, health workers), less than average on coverage of MCH interventions, and about average on mortality. In terms of progress during 1990-2009 Uganda made average or slightly better than average progress on most indicators. Local government performance Local Government performance assessment was done using an improved set of 12 indicators (three management and nine access/quality/coverage indicators) for the 112 districts. In general, there is better performance for the coverage indicators compared to the management indicators. Kampala remains the top ranking district this year, followed by Bushenyi and Kabarole. Bulambuli, a new district, is at the bottom of the league table. The national score for the league table index is 58%; 3rd dose Pentavalent vaccine coverage 90%, OPD utilization 1.0; HIV testing in infants born to HIV positive mothers 30%; latrine coverage 71%; IPT2 43%; 4th ANC visit 32%; TB cure rate 77%; approved posts filled 52%; HMIS reporting 77%, completeness 94%, timeliness 84%; planned DHMT meetings held 10%; medicines orders submitted timely 47%. The 32 new districts had lower performance scores compared to existing districts, with Kyegegwa being the highest scoring new district ranked at 48th (out of 111). All new districts scored lower than the national average. Hospital and HC IV performance There are 13 Regional Referral Hospitals and 4 large PNFP hospitals. Masaka and Mbarara RRH data were not available for analysis. Overall, 76% of the posiƟons were Įlled. The lowest rates were for pharmacists (40%) and doctors (44%). Funds were released by the government to the hospitals according to the budget (104%), with the excepƟon of Moroto RRH (66%). Most measures indicate high uƟlizaƟon: 86% average bed occupancy (93% in 2009/10), 5.0 days average length of stay and 1,802 standard units of output (SUO, an index of workload) per staī among the regional referral and large PNFP hospitals. The SUO per staī ranges from 742 in Mengo RRH to 2,280 in SoroƟ RRH. The 78 reporting general hospitals also received government funds in accordance with the budget (98%). Reporting of staffing was poor but in a sample of 26 public general hospitals on average only 55% of the norm of 190 positions were filled. Bed occupancy rates were 69%, down from 74% in 2009/10, while the average length of stay increased from 4.6 to 5.0 days. The SUO per staff increased from 1,487 to 1,577, slightly lower than the RRHs. From the information the average for three outputs are down compared to last year (2009/10), inpatient, antenatal and immunization, while the outpatients, deliveries and major operations, including cesarean sections have gone up. Of deliveries, 24% were done by Cesarean section. The average outputs from each HC IV for outpatient, inpatient, deliveries and ART services, were 21,028; 1,864; 1,996 and 292 respectively. Compared to 2009/10 many service utilization indicators went down in 2010/11 except, deliveries, HIV counseling and testing, PMTCT and Dental service utilization. The bed occupancy rate in 2010/11 declined compared to the year before – down from 43% to 38%, in addition there was a reduction in average length of stay A n n u a l H e a l t h S e c t o r P e r f o r m a n c e R e p o r t 2 0 1 0 / 11 xxi from 3 days in 2009/10 to 2.3 days. There were on average of 1,864 admissions in 2010/11. The case fatality rate remained the same as the year before, 0.7%. Only 24% of the HC IVs were ‘functional’ in 2010/11 – an increase from 23% found in 2009/10. Overall, the larger health faciliƟes - hospitals and health centres IV - play a key role in the provision of health services in Uganda. The faciliƟes received resources according to budget but are understaīed. The performance of the larger health faciliƟes appears adequate in terms of eĸciency (bed occupancy, length of stay, SUO/staī) but there are important diīerences between hospitals and HC IVs that need to be taken into account in allocaƟng resources. No data on the quality of care were available, and it will be important to complement the access and eĸciency data with such data in the coming years. In addiƟon, reporƟng needs to be improved urgently, starƟng with maternal mortality. xxii A n n u a l H e a l t h S e c t o r P e r f o r m a n c e R e p o r t 2 0 1 0 / 11 1 CHAPTER ONE INTRODUCTION 1.1 Background The Ministry of Health (MOH) has been producing an Annual Health Sector Performance Report (AHSPR) since 2000. The annual report is an institutional requirement produced to highlight progress, challenges, lessons learnt and propose way of moving the health sector forward”. This AHSPR for the Financial Year (FY) 2010/11 marks the beginning of the Health Sector Strategic and Investment Plan (HSSIP) 2010/11 -2014/15. The report mainly focuses on the progress of the annual workplan as well as overall health sector performance against the targets set for the FY 2010/11, the first year of the HSSIP 2010/11 -2014/15. It takes into consideration the annual performance in terms of 1) The effectiveness, responsiveness and equity in the health care delivery system 2) How well the integrated support systems have been strengthened as well as the status of programme implementation and overall development mechanisms. The sector performance will be deliberated upon at the 17th Joint Review Mission (JRM) in October 2011. 1.2 Vision, Mission, Goal and Strategic Objectives during the HSSIP 2010/11 – 2014/15 1.2.1 Vision A healthy and productive population that contributes to socio-economic growth and national development. 1.2.2 Mission To provide the highest possible level of health services to all people in Uganda through delivery of promotive, preventive, curative, palliative and rehabilitative health services at all levels. 1.2.3 Goal The overall goal for the Health Sector during HSSIP 2010/11 – 2014/15 is “To attain a good standard of health for all people in Uganda in order to promote a healthy and productive life” 1.2.4 Strategic Objectives To achieve this goal, the health sector shall focus on achieving universal coverage with quality health, and health related services through addressing the following strategic objectives. 1. Scale up critical interventions for health, and health related services, with emphasis on vulnerable populations. 2. Improve the levels, and equity in access and demand to defined services needed for health. 3. Accelerate quality and safety improvements for health and health services through implementation of identified interventions. A n n u a l H e a l t h S e c t o r P e r f o r m a n c e R e p o r t 2 0 1 0 / 11 1 4. Improve on the efficiency, and effectiveness of resource management for service delivery in the sector. 5. Deepen stewardship of the health agenda, by the Ministry of Health. 1.3 Projected Demographics for 2010 The projected population demographics for the period under review are based on the population census of 2002 and annual projections by Uganda Bureau of Statistics (UBOS). Table 1: Demographic Information Demographic Variables Proportion Population Total Population 100% 31,784,600 Children below 18 years 56% 17,799,376 Adolescents (10 – 24 years) 34.7% 11,029,256 Orphans (for children below 18 years) 10.9% 1,940,132 Infants below one year 4.3% 1,366,738 Children below 5 years 19.5% 6,197,997 Women of child bearing age (15 – 49 years) 23% 7,310,458 Women expected to become pregnant 5% 1,589,230 UBOS 2010 Midyear Projection 1.4 The framework for achieving Millennium Development Goals (MDGs), National Development Goals and HSSIP 2010/11 – 2014/15 The delivery of the Uganda National Minimum Health Care Package (UNMHCP) is central to the implementation of the HSSIP 2010/11 – 2014/15 and the attainment of the sector goals and objectives. The NMHCP is aligned to the Second National Health Policy (NHP II) and National Development Plan (NDP) 2010/11 – 2014/15, the overarching national policy and strategic framework governing the health sector in Uganda. Additionally, the UNMHCP core strategies are aligned to the Millennium Development Goals (MDGs), to which Uganda is a signatory. The NDP (through sector plans) and the HSSIP 2010/11 – 2014/15 are being implemented in a sector-wide approach (SWAp), which addresses the health sector as a whole in planning and management, and in resource mobilization and allocation. The AHSPR 2010/11 is therefore one of the major SWAp management tools that assess sector progress in achieving the HSSIP 2010/11 – 2014/15 outputs and outcomes. 2 A n n u a l H e a l t h S e c t o r P e r f o r m a n c e R e p o r t 2 0 1 0 / 11 1.5 The Annual Health Sector Performance Report FY 2010/11 The objective of the AHSPR 2010/11 is to review the performance of the sector for the FY 2010/11 against targets, actions and indicators set out in the Ministerial Policy Statement (MPS) 2010/11 FY, MoH Activity Workplan 2010/11 FY, Joint Assessment Framework (JAF) under the Joint Budget Support Framework (JBSF) and against the HSSIP 2010/11 – 2014/15 core indicators. Thus, the report provides progress on: i) Sector performance and annual trends for the NDP, JAF indicators and HSSIP 2010/11 – 2014/15 indicators; ii) Financial Report for the FY 2010/11 including a donor-expenditure analysis; iii) Overall health service coverage levels iv) Status of implementation of the Integrated Health Sector Support Systems and governance at central level v) Local Government (District) performance using the League Table vi) The individual and collective contribution of the National, Regional Referral and General Hospitals as well as the PNFP hospitals at similar levels; vii) Implementation progress on the delivery of the UNMHCP and health support systems basing on planned outputs in the MPS 2010/11 viii) Monitoring implementation of the HSSIP 2010/11 – 2014/15 ix) Progress made towards the 7th National Health Assembly Resolutions and 16th Joint Review Mission priorities. The report also addresses the data quality issues in terms of completeness, accuracy, external comparison and adjustments. 1.5.1 The drafting process The development process of the AHSPR 2010/11 was widely consultative /with stakeholders from all departments of the MoH, Development Partners (DPs) and Implementing Partners. The overall coordination and technical support was provided by a MoH Task Force (TF). The composition of the TF was drawn from all departments of the MoH and included chairpersons and secretaries of the seven Technical Working Groups (TWGs). The TF had representation from districts, Referral Hospitals, the Civil Society and Health Development Partners. A secretariat of staff from the Health Planning and Quality Assurance Departments, and WHO provided overall leadership of the preparation process in close collaboration with the TF and sub-committees. The WHO – Uganda Country office facilitated the process of acquiring Consultants from WHO – Geneva who provided technical support in reviewing the AHSPR report format. This was through a development process which included a data analysis workshop. A Consultant was recruited and provided support in the report compilation, formatting and collating process in close collaboration with the Secretariat and TF. Meetings were held weekly, to assess progress of development of the AHSPR and provide feed-back on the drafts. Draft submissions were made by secretaries of TWGs/heads of Divisions and sections. Gaps identified were rectified by the relevant submitting authority. The draft was presented to Senior Management Committee A n n u a l H e a l t h S e c t o r P e r f o r m a n c e R e p o r t 2 0 1 0 / 11 3 (SMC), Health Policy Advisory Committee (HPAC) and Senior Top Management (STM) for comments and approval. 1.5.2 Sources of Information The information used in compiling the AHSPR 2010/11 is both quantitative and qualitative. As it is stipulated in the HSSIP 2010/11 monitoring and evaluation framework, the Health Management Information System (HMIS) under the Resource Centre is the main source of statistical data. In order to maintain consistency with previous reporting periods, this AHSPR uses the HMIS aggregated monthly reports for the entire financial year. Population figures were based on the 2010 midterm population projections from the UBOS statistical abstract. Several indicators do not have new data, as they rely on household surveys, especially DHS. The most important components of the HMIS are the health facility monthly and annual reports. These reports are, like any source of data, prone to errors associated with incomplete or inaccurate reporting. In order to maximize the quality of the statistics for the performance indicators, a major effort was made to gather as much facility and district information as possible, and assess for possible errors. A detailed report of the data quality assessment is presented in an annex (section 6). Other key sources of information included: i. HSSIP 2010/11 – 2014/15 ii. Ministerial Policy Statement (MPS) 2010/11 iii. MoH activity plan 2010/11 iv. FY 2010/11 quarterly sector performance review reports v. MoH programmes and other central level institutions reports vi. MoH submissions from the Output Budgeting Tool (OBT) to the Ministry of Finance, Planning and Economic Development (MoFPED) vii. Previous AHSPR for the FY 2006/07, 2008/09 and 2009/10 viii. The HIV/AIDS Epidemiological Surveillance report 2010 ix. Medicines availability study 2010 x. Malaria Indicator Survey 2010 xi. Uganda Demographic Health Survey (UDHS) reports xii. Millennium Development Goal Report for Uganda 2010 xiii. Additional sources of information are included in the reference list 1.5.3 Overview of the report outline The AHSPR 2010/11 is divided into three sections as follows; Section 1 is an introduction that covers the background to the AHSPR 2010/11 FY in relation to the framework for achieving the MDGs, NDP and HSSIP 2010/11 – 2014/15 goals, drafting process and sources of information. 4 A n n u a l H e a l t h S e c t o r P e r f o r m a n c e R e p o r t 2 0 1 0 / 11 Section 2 provides an overview of the sector performance for FY 2010/11 and includes the overall performance of the sector against the HSSIP 2010/11 – 2014/15 indicators, JAF 3 indicators and; an assessment of central level performance against planned key outputs from the MPS 2010/11; comparison of district performance using the District League Table; and comparison of hospital performance using the Standard Unit Output (SUO). Section 3 Annex detailing progress in implementation of priority activities under the; 1. Uganda National Minimum Health Care Package (UNMHCP). 2. Integrated Health Sector Support Systems. 3. Monitoring and Evaluation of the HSSIP 2010/11 – 2014/15. A n n u a l H e a l t h S e c t o r P e r f o r m a n c e R e p o r t 2 0 1 0 / 11 5 2 OVERALL PROGRESS AND PERFORMANCE This chapter presents an overview of the overall progress and health sector performance for FY 2010/11. It therefore includes an assessment of performance of the sector using the HSSIP 2010/11 – 2014/15 core indicators marking progress towards achievement of the MDGs, NDP 2010/11 – 2014/15, JAF 3, MPS 2010/11 and Activity Plan 2010/11 targets. 2.1 Overall Summary of Progress towards NDP Indicators Twenty six core indicators were identified to monitor progress in implementation of the HSSIP 2010/11 – 2-124/15. Of these, eight (8) indicators are used to monitor progress of the health sector towards NDP targets. Table 1 summarizes the performance in the first year of the NDP and the HSSIP 20/10 – 2014/15 for the NDP indicators. Table 2: Performance against the 8 NDP indicators for the HSSIP 2010/11 -2014/15 Period Baseline, (year) Indicator NDP Target 2009/10 Annualized HSSIP Target 2010/2011 Performance Trend from HSSIP Baseline Achievement 2010/2011 % pregnant women attending 4 ANC sessions 47 60% 50% 32% Reversal % deliveries in health facilities 33 35% 40% 39% Improving but below target % children under one year immunized with 3rd dose Pentavalent vaccine (m/f) 76 90% 80% 90% Positive % U5 children with weight /age below lower line (wasting) (m/f) 16%# 15% 15% NA No current information Contraceptive Prevalence Rate (CPR) 33% 34% 34% NA To be updated by the UDHS-5 % of health facilities without stock outs of any of the six tracer medicines in the previous 6 months 21 28% 50% 43% Positive % of approved posts filled by trained health workers 56 56% 60% 56% Static % Annual reduction in absenteeism rate 46 28% 20% NA Awaiting Panel Survey findings # 2006 data 6 A n n u a l H e a l t h S e c t o r P e r f o r m a n c e R e p o r t 2 0 1 0 / 11 Assessment of the eight indicators revealed two having improved; one improved but not on target; one static; one reversing; and there being no data for the other three, as the panel survey findings and conduction of the UDHS are still awaited. The proportion of deliveries in health facilities improved from 33% (2009/10) to 39% (2010/11); proportion of under one year immunized with 3rd dose pentavalent vaccine from 76% (2009/10) to 90% (2010/11); and proportion of health facilities without stock outs of any of the six tracer medicines in the previous 6 months increased from 41% (09/10) to 47% (2010/11). The improvement in proportion of deliveries could be attributed to the increased supply mama kits through the essential medicines kit as districts including hospitals no longer have to pay for mama kits at the NMS, as well as availability of other medicines and health supplies including misoprostol. The marked increase in under one year immunized with 3rd dose pentavalent vaccine could be attributed to the recent review of child days implementation and focus on poorly performing districts, which included catch up immunization services; House - to - House SIAs in 48 districts and, stimulation of districts to work towards improved performance; where districts are prompted to do specific district assessment and come up with innovative ways to improve routine immunization. In addition, monthly feedback was provided to all the 112 districts regarding their performance; and improvement was also registered in district supply of vaccines and injection materials from the centre. The shift from ‘pull’ to a ‘push’ system and reintroduction of the essential medicines kit contributed to the reduction in stock out of tracer medicines in the previous year. Further improvements have been realized in 2010/11 due to increased allocations to Vote 116 and tracking of medicine distribution. The last mile delivery introduced in May 2011 is anticipated to result in further improvements in medicines availability. The sector recorded a reversal in trends in proportion of pregnant women attending 4 ANC sessions from 47% (09/10) to 32% (10/11). This is in contrast to the increase in deliveries at the health facilities, and is probably due to the relative effort and campaign on facility deliveries compared to ANC. In addition, failure to appreciate the importance of ANC by the mothers remains a challenge. Another possible reason is the recent national mass distribution of ITNs in the community; some mothers previously sought ANC services in anticipation of a net. Even then, further investigations need to be carried out to establish the cause of the reversal in trends to almost half of the expected target. The level of staffing with trained health workers was static at 56% and this is attributed to no recruitments taking place in the Local Governments during the year under review as directed by the MoLG. The three indicators not documented for the year under review are got from data sources outside the MoH and not collected on an annual basis. The ongoing UDHS-5 will provide the current levels for these three indicators which include % of U5 children with weight / age below lower line (wasting); CPR. Information of the % of annual reduction in absenteeism rate will be obtained from the annual panel survey conducted by UBOS. A n n u a l H e a l t h S e c t o r P e r f o r m a n c e R e p o r t 2 0 1 0 / 11 7 2.1 Overall Summary Progress towards MDG, JAF and HSSIP 2010/11 – 2014/15 Indicators 2.1.1 Health Impact Indicators Five impact indicators are used to assess the analysis of impact of health service delivery. Four measure the distribution of health across different life cohorts and these are; Maternal Mortality Ratio (MMR), Neonatal Mortality Rate (NMR), Infant Mortality Rate (IMR), and Under 5 Mortality Rate. The fifth, proportion of household experiencing catastrophic payments, measures financial risk (protection). Indicators for maternal, neonatal, infant and child mortality are collected every five years during the UDHS carried out by UBOS. For the year under review the UDHS 2006 indicators will still be applied as the UDHS -5 was started at the end of the financial year 2010/11. x Maternal Mortality Ratio (1997 - 2006) 435 per 100,000 live births x Neonatal Mortality rate (2002 - 06) 29 per 1,000 live births x Infant Mortality Rate (2002 - 06) 76 per 1,000 live births x Under 5 mortality rate (2002 - 06) 137 per 1,000 live births Three of the impact indicators (Maternal Mortality Ratio, Infant Mortality Rate, and Under 5 Mortality Rate) are monitored among the MDG targets. MDG 4: Reduce Child Mortality Target 4.A: Reduce, by two thirds, between 1990 and 2015, the under five mortality rate. Figure 1: Under 5 Mortality trends in Uganda Figure 1: Under 5 Mortality trends in Uganda The MDG report for Uganda 2010 indicates slow progress towards achievement of the set target. Hospital based mortality data indicates that malaria is the top most (27.2%) cause of under five mortality followed by anaemia (12.1%), pneumonia (11.4%), perinatal conditions (7.8%) and septicaemia (5.0%). Most of the deaths occur early during admission due to the delayed presentation of most of these conditions at the hospital and shortages of blood for transfusion in some facilities, as well as high chronic malnutrition and micronutrient deficiencies in the populations. More than one third of the deaths in the first year of life occur in newborns 0-28 8 A n n u a l H e a l t h S e c t o r P e r f o r m a n c e R e p o r t 2 0 1 0 / 11 days, mostly in the immediate period after birth and are due to perinatal conditions like birth asphyxia, pre term birth and infection Hospital Based Mortality for all Ages A total of 13,761 hospital deaths were reported during 2010/11 FY. Malaria was the top (20.9%) cause of mortality followed by AIDS (9.4%), pneumonia (7.8%), anaemia (7.6%) and tuberculosis (3.9%) among the top five. The highest number of mortality was among males above 5 years (36.1%) followed by male under 5 (20.2%), females above 5 years (25.1%) and female under 5 (18.5%). (See Table 3) Among children under 5 years malaria is the highest (27.2%) cause of mortality followed by anaemia (12.1%), pneumonia (11.4%), Perinatal conditions (7.8%) and septicaemia (5.0%) among the top five causes of mortality. This trend remains the same from 2009 to 2010 (see Figure 2). Table 3: Top ten causes of hospital based mortality for all ages in 2010/11 FY IPD Diagnosis < 5 years Deaths Male 1. Malaria Above 5 years Deaths Male Female Female Total % 762 686 883 549 2,880 20.9% 67 72 651 501 1,291 9.4% Pneumonia 333 273 312 158 1,076 7.8% Anaemia 358 287 192 208 1,045 7.6% 17 31 318 166 532 3.9% Perinatal conditions (in New borns 0 to 28 days) 218 197 - - 415 3.0% Septicaemia 165 101 60 60 386 2.8% Other Types of Meningitis 26 25 128 74 253 1.8% Respiratory Infections (Other) 60 85 69 37 251 1.8% Injuries - Road Traffic Accidents 18 8 172 43 241 1.8% 754 788 2,189 1,660 5,391 39.2% 2,778 2,553 4,974 3,456 13,761 100.0% 2. AIDS 3. 4. 5. Tuberculosis 6. 7. 8. 9. 10. 11. All Others Total Source: HMIS 2010/11 Among adults malaria and AIDS are the top most causes of mortality a three year period. Conclusions cannot be deduced now on the top ten causes of death in 2011 because available data was for the first 6 months. A n n u a l H e a l t h S e c t o r P e r f o r m a n c e R e p o r t 2 0 1 0 / 11 9 Figure 2: Trends in IP Mortality 2009 – 2011 MDG 5: Improve Maternal Health Target 5.A: Reduce by three quarters, between 1990 and 2015, the Maternal Mortality Ratio. Target 5.B: Achieve, by 2015, universal access to reproductive health care 10 A n n u a l H e a l t h S e c t o r P e r f o r m a n c e R e p o r t 2 0 1 0 / 11 Figure 3: MMR Trends in Uganda The MDG report for Uganda 2010 indicates although there has been a reduction in MMR, the attainment of target 5A has been slow. The HMIS indicates that on average countrywide there has been a slight reduction in hospital based maternal deaths from 1,143 maternal deaths reported in the health facilities in 2009/10 to 1,015 that occurred in 2010/11. With over 500,000 deliveries occurring in health facilities, this corresponds with a hospital maternal mortality ratio of almost 200 per 100,000 live births. It must be noted however that the quality of reporting of maternal deaths is variable between institutions. The figures cannot be considered more than indicative and more work is urgently needed to improve the quality of reporting and statistics. Figure 4: Health facility-based maternal deaths in FY 2009/10 and 2010/11 140 120 100 80 2009/2010 60 2010/2011 40 20 0 Source: MoH HMIS 2.1.2 Morbidity: Level and Trends There was decline in the number of reported new outpatient attendances for all ages (34,853,345) compared to the previous FY where reported new outpatient attendances were 36,808,680. Overall, this implies an average of 1.0 OPD visit per person per year. Communicable diseases are still the leading causes of morbidity with malaria ranking highest (36%) among all age groups, followed by no pneumonia – cough or cold 19% and intestinal worms 5%. (See Table 4) A n n u a l H e a l t h S e c t o r P e r f o r m a n c e R e p o r t 2 0 1 0 / 11 11 Table 4: Top ten causes of morbidity among all ages from 2009/10 to 2010/11 FY 2008/09 2009/10 2010/11 Diagnosis New cases % New cases % New cases % 1. Malaria 11,748,978 37% 14,164,008 38% 12,614,609 36% No Pneumonia- Cough or Cold 5,794,516 18% 6,851,602 19% 6,712,597 19% Intestinal Worms 1,767,586 6% 1,866,559 5% 1,826,240 5% Skin Diseases 1,117,313 4% 1,101,113 3% 1,118,221 3% Diarrhoea-Acute 965,145 3% 1,031,914 3% 1,029,615 3% Eye Conditions 748,997 2% 751,508 2% 935,445 3% Gastro-Intestinal Disorders (Noninfective) 726,862 2% 817,146 2% 825,338 2% Pneumonia 887,917 3% 912,263 2% 819,180 2% Urinary Tract Infections 646,326 2% 1,297,733 4% 747,354 2% Injuries = (Trauma due to Other Causes) 627,412 2% 641,987 2% 657,542 2% 6,830,314 21% 7,372,847 20% 7,567,204 22% 2. 3. 4. 5. 6. 7. 8. 9. 10. 11. All Others Total 31,861,366 100% 36,808,680 100% 34,853,345 100% Source: MoH HMIS 2008/09 to 2010/11 (Expected reports received 89% 2008/09; 91% 2009/10; 93% 2010/11) 2.1.3 Performance against lead indicators for HIV/AIDS, Malaria and TB During the year under review malaria, Tuberculosis (TB) and HIV/AIDS prevention, control and management interventions were among the key sector priorities. These three diseases are of focus under MDG 6 and therefore need to actively monitor progress towards achieving the MDG targets. Performance during the year 2010/11 shows positive but slow progress for most of the program lead indicators and reversal in some indicators for example; % of household sprayed with insecticides (99% in 2009/10 (in six districts) to 96% (in ten districts) in 2010/11) we need to report this correctly, one might think this is a national l average yet it data for only 6 – 10 out of 112 districts, this should be stated here, better even to be quiet about because the two figures are not comparable!, % of RBM partnership review meetings (75% in 2009/10 to 50% in 2010/11), TB Case Detection Rate (56% in 2009/10 to 54% in 2010/11) , even though the number of notified cases went up) and TB treatment success rate (75% in 2008/09, 67% in 2009/10 and 69% in 2010/11). Overall there is marked improvement in TB program lead indicators compared to HIV/AIDS and malaria. MDG 6: Combat HIV/AIDS, Malaria and Other Diseases 12 A n n u a l H e a l t h S e c t o r P e r f o r m a n c e R e p o r t 2 0 1 0 / 11 Target Progress Target 6.A: Have halted by 2010 and begun to reverse the spread of HIV/AIDS Reversal in progress Target 6.B: Achieve, by 2010, universal access to treatment for HIV/AIDS for all who need it. On track Target 6.C: Have halted by 2015 and begun to reverse the incidence of malaria and other major diseases. Slow Source: Uganda MDG Report 2010 Table 5: Performance against selected HIV/AIDS Programme lead indicators Indicator 2009/10 2010/11 Proportion of health facilities with HCT services 37% (1,840/4,980) 38% (1,904/4,980) Minimal scale up of HCT services up to HC II level. Progress slow due to inadequate supply of kits and availability of trained personnel Proportion of health facilities with PMTCT services 23% (1,150/4,980) 32% (1,589/4,980) There is an increase in the number of facilities providing PMTCT services Proportion of pregnant women accessing HCT in ANC 83% at 90% reporting 82% at 70% reporting Not able to deduce actual performance due to poor reporting. Need to strengthen M&E component Number of males circumcised Not known as the intervention was very new Not known as Most circumcision is done by partners and not captured in the HMIS. Need to include safe male circumcision in the HMIS. M= 999,728 M=833,393 F= 1,992,665 F=1,413,127 There is a big discrepancy between the number of people counseled and tested and the laboratory tests done (8,338,860). T= 2,992,393 T= 2,246,520* NA NA NA NA NA NA NA NA No. people counseled and tested for HIV (m, f) Number of HIV positives enrolled in care Number of HIV positives eligible for ART Number of eligible clients initiated on ART Number of HIV positives screened for TB Source: UACP Database Comments * HMIS data however 8,338,860 lab tests were done No reliable facility data were available to ascertain trends in coverage of HIV services, except that almost all HIV positive people were initiated on co-trimoxazole (95%). A n n u a l H e a l t h S e c t o r P e r f o r m a n c e R e p o r t 2 0 1 0 / 11 13 The performance indicators for the MCP and NTLP show slow progress towards halting the incidence of malaria and TB. Table 6: Performance against selected Malaria Control Programme lead indicators Indicator % of under-fives with fever who receive malaria treatment within 24 hours from a VHT % of pregnant women who have completed IPT2 uptake % of households sprayed with insecticide in the last 12 months Case fatality rate (%) among malaria in-patients under five % of public and PNFP health facilities without any stock outs of first line antimalarial medicines % of planned RBM partnership review meetings held 2009/10 2010/11 13.7 (UMIS) No data 47 (HMIS) 43 (HMIS) 99 96.7 1.4 (HMIS) 1.2 (HMIS) No national data 39 75 50 Comment Roll out of ACTs to community level still awaiting release of AMFm and GF Round 10 grant currently delayed but under negotiation. VHTs in at least 27 districts are distributing ACTs (procured by partners) as part of the iCCM, which targets U5 children with malaria, pneumonia and diarrhea. Reduction. Need for new thoughts & approached on improving performance 2009/10 results were from 6 districts while 2010/11 results are from 10 districts but still in the same geographical area Data yet to be validated and adjusted for the more representative figures Results from support supervision in 128 out of a total of 363 health facilities in 34 Districts Modalities for engagement with partners currently under review including recent appointment of partnership coordinator Table 7: Performance against the TB Programme Lead Indicators Indicator 2008/09 2009/10 2010/11 HSSIP Target 2010/11 FY Case Detection Rate (CDR) 57% 56% 54% 60% Treatment Success Rate (TSR) 75% 67% 70% 75% Cure Rate in % 31% 28% 40% NA % TB patients tested for HIV 63% 72% 81% 80% % HIV +TB patients started on CPT 71% 86% 90% 90% 43,862 43,335 45,546 NA Total number of TB cases notified 14 A n n u a l H e a l t h S e c t o r P e r f o r m a n c e R e p o r t 2 0 1 0 / 11 2.2 Health Services Coverage There are eight core health service coverage indicators for monitoring the HSSIP 2010/11 – 2014/15 implementation. The routine HMIS is the major source of data for these indicators and therefore progress reported monthly is aggregated for the annual performance report. Table 8 summarizes the sector performance in relation to the core HSSIP 2010/11 – 2014/15 health service coverage indicators. Table 8: Performance for health services core indicators Indicator Source Baseline, (year) 2010/11 NDP Target JAF 3 Target HSSIP Target Achievement Performance Trend from HSSIP Baseline % pregnant women attending 4 ANC sessions HMIS 47 (09/10) 60% N/A 50% 32% Reversal % deliveries in health facilities HMIS 33 (09/10) 35% 40% 40% 39% Positive % children under one year immunized with 3rd dose Pentavalent vaccine (m/f) HMIS 76 (09/10) 90% 88% 80% 90% Positive % one year old children immunized against measles HMIS 72 (09/10) N/A N/A 75% 85% Positive % pregnant women who have completed IPT2 HMIS 47 (09/10) N/A N/A 50 43% Reversal % of children exposed to HIV from their mothers accessing HIV testing within 12 months EID database 29 (08/09) N/A N/A 35 30% Minimal improvement % U5s with fever receiving malaria treatment within 24 hours from VHT (m/f) NA 13.7 (09/10) N/A N/A 20 No data No national figure information – CBHMIS not yet established % eligible persons receiving ARV therapy (m/f) UACP database 53 (2009) N/A N/A 55 NA No data (m/f) (m/f) N/A: these are not NDP and or JAF 3 indicators respectively Coverage for immunization services improved with proportion of under one year immunized with third dose of pentavalent vaccine increasing from 76% in 2009/10 FY to 90% in 2010/11 FY. A n n u a l H e a l t h S e c t o r P e r f o r m a n c e R e p o r t 2 0 1 0 / 11 15 There was also remarkable improvement in the proportion of one year old children immunized against measles from 72% to 85% achieving the HSSIP 2010/11 – 14/15 target of 75%. The proportion of deliveries in health facilities increased from 33% to 39% above the NDP (35%), but below the JAF 3 and HSSIP annualized targets (40%). There was a marked reversal in trends for the proportion of women attending the 4 ANC sessions from 47% in 2009/10 to 32% in 2010/11 FY. This is well below the NDP (60%) and HSSIP (50%) targets. The proportion of pregnant women who completed second dose of suphadoxine/pyrimethamine for Intermittent Presumptive Treatment (IPT) for malaria declined from 47% in 2009/10 to 43% in 2010/11. There was a marked increase of Total Couple Year Protection (CYP) from 447,713 in 2009/10 to 787,390.43 in 2010/11. This increase was also reflected in the Panel Survey of 2010 that indicated an increase of Contraceptive Prevalence Rate to 33%. The proportion of children exposed to HIV from their mothers accessing HIV testing within 12 months was only 30% compared to 29% in 2009/10. This is very minimal progress and much below the HSSIP target of 35% for the year under review. The proportion of children under five years receiving malaria treatment within 24 hours from VHT was not assessed due to lack of information. It is expected that this information will be captured after rolling out of the HMIS 2010 which has a Community Information System component. Information on the proportion of eligible persons receiving ARV treatment therapy was not available. Overall there was varied performance in the health services coverage indicators with remarkable improvement in immunization coverage indicators above the HSSIP annual targets and reversal in progress in proportion of pregnant women attending 4 ANC sessions and receiving IPT2. There is need to investigate the reversal or stagnation of trends in the maternal health services. 2.3 Coverage with Other Health Determinants Four core HSSIP 2010/11 – 2014/15 indicators provide information on the overall contribution of coverage by services addressing other health determinants are having on the health status. Only one indicator on coverage of other health determinants and risk factors has been assessed in this report. This is because the source of information for the remaining indicators is not from the routine HMIS or program databases. The proportion of households with latrines increased from 69.7% in 2009/10 to 71% in 2010/11. This is a positive trend and is above the HSSIP 2010/11 – 2014/15 annual target (68.5%). Information on household latrine coverage is generated from the annual environmental health data collection tool. 16 A n n u a l H e a l t h S e c t o r P e r f o r m a n c e R e p o r t 2 0 1 0 / 11 Current estimates for indicators on nutritional status for under fives will be obtained from the ongoing UDHS – 5. Preliminary results from the UNPS conducted by UBOS in 2009/10 indicate an increase of Contraceptive Prevalence Rate (CPR) to 33%. The ongoing UDHS – 5 survey, will also further provide an update on the status of CPR. Table 9: Performance for coverage for other health determinants and risk factors indicators during 2010/11 FY Indicator Source % of households with latrine Baseline, (year) 2010/11 NDP Target JAF 3 Target HSSIP Target Achievement Performance Trend from HSSIP Baseline EHD Data tool 69.7 % (09/10) N/A N/A 68.5% 71% On track % U5 children with height /age below lower line (stunting) (m/f) UDHS 38% (2006) N/A N/A 36% No data No information % U5 children with weight /age below lower line (wasting) (m/f) UDHS 16% (2006) 15% N/A 15% No data No information Contraceptive Prevalence Rate Uganda National Panel Survey / UDHS 33% (09/10) 34% 34% 34% No data Will further be updated by the UDHS 2011/12 Performance assessment for coverage for other health determinants and risk factors is not conclusive for the year under review. Information is available for only one (% of household with latrine which improved from 69.7% to 71%) out of four indicators. If a similar trend is sustained for all indicators in this category throughout the HSSIP there should be improvement in health status particularly of children under five. 2.4 Health Quality and Outputs Health quality and output indicators provide information on the direct output from investments made in health services. They are a measure of improvements made in access, quality, and safety of health services provided. A n n u a l H e a l t h S e c t o r P e r f o r m a n c e R e p o r t 2 0 1 0 / 11 17 Table 10: Performance for health system output (availability, access, quality, safety) indicators Indicator Source Baseline, (year) 2010/11 NDP Target JAF 3 Target HSSIP Target Achievem ent Performance Trend from HSSIP Baseline % of new TB smear + cases notified compared to expected ( TB case detection rate) (m/f) NTLP Database 56 (09/10) N/A N/A 60 53.9% Reversal – awaiting data from Mualgo for update Per capita OPD utilization rate (m/f) HMIS 0.9 (09/10) N/A N/A 1.0 1.0 On track % clients expressing satisfaction with health services (waiting time) Survey 46 (2008) N/A N/A 50 No data No current information. Survey to be conducted 2011/12 Drug availability study 2011 21% (09/10) 28% 60% 50% 43% Improving HMIS 23 (09/10) % of health facilities without stock outs of any of the six tracer medicines in the previous 6 months (1st line antimalarials, Depoprovera, S/P, measles vaccine, ORS, Cotrimoxazole) % of functional Health Centre IVs (providing EMOC) 47% excluding ACTs (41% when ACT are excluded) N/A N/A 28 24% Slight improvement / h d d l N/A: these are not NDP and or JAF 3 indicators respectively The proportion of new TB smear positive cases notified compared to expected (TB case detection rate) has declined from 56% in 2009/10 to 54% in 2010/11. A number of factors including uncertainty on magnitude of TB problem, the tendency for smear negative and EP TB to increase disproportionately in areas with high HIV prevalence and HIV-TB co-infected rate settings, poor R&R. Some districts also reported stock outs of laboratory reagents and supply of poor quality laboratory reagents, this could have negatively impacted on the case detection. Per capita Out Patients Department (OPD) utilization rate improved from 0.9 in 2009/10 to 1.0 2010/11 achieving the HSSIP annual target. There is no national level information on the current status of client satisfaction (waiting time). The National client satisfaction survey will be carried out during 2011/12 FY. Facility based client satisfaction surveys were carried out by sites implementing 5S and findings indicated 18 A n n u a l H e a l t h S e c t o r P e r f o r m a n c e R e p o r t 2 0 1 0 / 11 improvement in client satisfaction after introduction of 5S. About 80% of patients at Gombe GH appreciated improvements on cleanliness and staff attitude, and 55% of them on waiting hours. About 90 % of patients at Entebbe GH recognized the improvement on cleanliness, 60% of them on staff attitude, and 30% of them on waiting time. (Monitoring Report of the JICA 5S Project in Uganda, March 2011) A survey conducted by UNHCO in 8 districts showed that 61.4% of the people interviewed in these districts are satisfied with the MCH services provided by the health facilities. The medicines availability study conducted in August 2011, shows that 43% of health facilities did not have any stock out of the tracer medicines in the 1st and 4th quarters of FY 2010/11 and 47% when excluding ACTs. It is worth noting that facilities without stock out considering ACTs were 21% in 2009/10. In the period under review, the country experienced some stock out period of Cotrimoxazole tablets for HIV/AIDs prophylaxis, thereby creating an increased pressure on what had been procured for routine treatment. As a result, the stock status was this time round affected by stock out of Cotrimoxazole tablets. Only 24% of the HC IVs were ‘functional’ in 2010/11 – a minimal increase from 23% found in 2009/10. HC IV functionality is being able to provide intervention in case of complications during delivery, which includes the ability to provide a Caesarean Section and Blood Transfusion; HC IVs have been judged “functional” if they have been able to carry out at least one Caesarean Section. The level of utilization of health services has improved as evidenced by the OPD utilization with the highest utilization rate among females above 5 years (63%) compared to 37% among males above 5 years. Utilization rate among females and males under five years is 51% and 48% respectively. Overall there is improvement in performance for most of the health systems output indicators with the exception of TB case detection rate and client satisfaction where there is no current data. The improvement in performance is an indication that availability, access and quality of services are likely to have improved. Other studies like national client satisfaction survey and Service Availability Readiness Assessment should be carried out to verify this. A n n u a l H e a l t h S e c t o r P e r f o r m a n c e R e p o r t 2 0 1 0 / 11 19 2.5 Health Investments Indicators on health investments provide information on the amount of investments available for health services. Village Health Teams: According to a survey conducted by MoH / UNICEF, there was remarkable increase in the proportion of villages / wards with trained VHTs from 31% in 2009/10 to 72% in 2010/11. Again here we should mention that this is only for few districts where iCCM is implemented. Health Financing: Allocation to health as a percentage of total government budget reduced from 9.6% in 2009/10 to 8.9% but in line with the MTEF target. Table 11: Performance for coverage for health investments and governance indicators Indicator Source Baseline, (year) 2010/11 NDP Target JAF 3 Target HSSIP Target Achievement Performance Trend from HSSIP Baseline % of approved posts filled by trained health workers HRIS 56 (09/10) 56% 59% 60% 56% Static % Annual reduction in absenteeism rate UNPS 46 (09/10) 28% 20% 20% No data Awaiting Panel Survey findings (37% absenteeism) (Actual Absenteeism rate) % of villages / wards with trained VHTs VHT Situation Analysis Report 2010 31 (09/10) NA NA 50 72% MoH/ UNICEF Survey General Government allocation for health as % of total government budget MTEF 9.6 (09/10) NA NA 8.8 8.9 On track N/A: these are not NDP and or JAF 3 indicators respectively Human Resources for Health The proportion of approved posts filled by trained health workers stagnated at 56%. Annual reduction in absenteeism rate is expected at 20% of the baseline which is 46% absenteeism rate. Performance for this indicator is to be obtained in November from the annual UNPS conducted by UBOS. At the national level including all the hospitals, MoH institutions and LGs, the proportion of filled positions by trained health workers stands at 56%. This calculation excludes those health 20 A n n u a l H e a l t h S e c t o r P e r f o r m a n c e R e p o r t 2 0 1 0 / 11 workers who are not registered by health professional councils such as nutritionists, administrators, nursing assistants and drivers. Furthermore, the calculation also does not include administrative and support staff such as the accountants and secretaries. For this indicator, there has been a fall from 75% in FY 2005/06 to 56% in FY 2010/2011 which can be attributed to the increased number of health facilities and thereby increasing the overall denominator. Furthermore, staffing norms were revised and increased in line with the workload at the different levels of care. The staffing levels are better in referral hospitals than in district health units, where only 52% of the posts are filled. Table 12: Staffing Levels in the public sector filled by trained health personnel - October 2010 Cadre of Staff Mulago Butabika RRHs Districts Health Units DHOs Total Norms Total Filled % filled Norms Filled Norms Filled Norms Filled Norms Filled Norms Filled Doctors 241 203 26 15 520 204 80 63 824 306 1,691 791 47% Clinical Officers 45 56 12 14 395 261 0 5 2,598 1,678 3,050 2,014 66% Nurses 940 846 154 127 1,371 1,102 80 10 9,098 4,721 11,643 6,806 58% Midwives 121 95 0 0 701 477 0 0 4,536 3,002 5,358 3,574 67% Pharmacists 8 4 2 2 36 13 0 2 40 3 86 24 28% Dispensers 34 26 5 5 80 36 0 0 244 78 363 145 40% Lab. Scientists 63 55 6 6 180 108 0 1 2,236 958 2,485 1,128 45% Radiographers 33 28 2 3 53 35 0 0 80 22 168 88 52% Health Assistants 0 0 0 0 0 0 0 0 2,573 1,570 2,573 1,570 61% Other Medical Related Staff 252 168 87 92 356 173 320 210 4,951 1,816 5,966 2,459 41% Grand Total 1,737 1,481 294 264 3,692 2,409 480 291 27,180 14,154 33,383 18,599 56% Percent filled 85.3 89.8 65.2 60.6 52.1 56 Source: Uganda Human Resources for Health Biannual Report October 2010 to March 2011 8,978 9,000 8,000 F 7,000 6,000 i 5,000 4,000 g 3,000 u 2,000 1,000 r 0 8,072 6,371 4,535 2,272 1,148 1,481 4,309 202 e 5: The Density of Health Personnel GOU and PNFP A n n u a l H e a l t h S e c t o r P e r f o r m a n c e R e p o r t 2 0 1 0 / 11 21 Analysis of HRH data for both the public and PNFP sub-sectors put together indicated that the country has 37,368 health workers. Out of these 8,978 (24%) are nurses and 4,535 (12%) are midwives and 1,148 (3%) are doctors. The data also indicates that the nursing assistants still form a big number of the health workers 6,371 (17%). This implies that more effort is needed to recruit and retain the qualified health staff particularly at HC II, HC III and HC IV levels. The density of health personnel is Uganda is still very low as shown by the health worker population ratio in Table 13. Overall, there are 1.49 core health workers per 1,000 population, still well below the WHO recommended minimum of 2.3 per 1,000. Table 13: Cadre: Population Ratio Health Worker H/W : Population ratio Density per 1,000 population Doctors 1 : 27,687 0.036 / 1,000 Clinical Officers 1 : 13,990 0.071/ 1,000 Nurses 1 : 3,540 0.28 / 1,000 Midwives 1 : 7,009 0.14 / 1,000 Diagnostic Staff 1 : 21,462 0.047 / 1,000 Main challenges x Poor attraction and retention of staff across the country remains critical. The situation gets even worse for cadres like-; Doctors, Midwives, Anesthetic staff, Radiographers Pharmacists and Dispensers. x Limited funding for recruitment, salaries and wages has resulted into high vacancy levels. x Inequitable distribution of Health Workers to districts due to peculiar disadvantages of such districts has resulted into some districts not having the minimum staffing levels. x The remuneration of health workers still remains a challenge. The needs of health workers are much more than the monthly payments across all cadres. Another challenge results from poor health worker attitudes. What make people efficient are their attitudes and this stems from personal attributes of maturity. x Observation of most health workers reveals reduced commitment which results into little attention to professional standards. Some of the negative consequences have been increased late coming and absenteeism of staff. In some cases, the public has lost confidence in health workers. 22 A n n u a l H e a l t h S e c t o r P e r f o r m a n c e R e p o r t 2 0 1 0 / 11 x x x x Poor attitude of health staff has a correlation with the selection procedures of student health workers coming for training. Selection of students is done based on the academics only without subjecting the would-be health workers to an entry interview for most of the cadres. Students do not know what they are going in for. They are in most cases poorly informed of what they need to do on qualifying. The sector has also registered shortages of role models for various health professionals. The health sector also faces poor and unsupportive work environment resulting into dissatisfaction of health cadres. There is generally constricted career structure with implications on promotions and new appointments of health staff. This limitation is more marked at the district level. There is lack of recognition of health workers by communities and political leaders. This together with poor management and leadership in some cases within health facilities has negated the positive gains reached in the health sector. Recommendations for annual plan 2012/13 x Improve funding to the sector especially wage bill provisions to enhance both the numbers and remuneration levels. x Improve working conditions (Equipment and accommodation) x Strengthen Management and supervision of health workers at all levels. Apart from the remarkable increase in the proportion of villages / wards with trained VHTs there is no improvement in the amount of health investments expected for delivery of quality health services. The health sector efforts in ensuring attainment and maintenance of an adequately sized, equitably distributed and appropriately skilled workforce (60% target for 2010/11 FY) were hampered by the ban on recruitment as a result of a limited wage will. There is need to advocate for increasing staffing levels for the entire critical cadre for effective and efficient utilisation of health investments. 2.6 Benchmarking Uganda's progress relative to 11 peer countries Benchmarking performance helps to put national progress into perspective. There are many issues that limit the comparability of the current situation and trends between countries, but international statistics are useful to provide a rough idea. Table 14 using data from the WHO World Health Statistics, compares the current situation in Uganda with 11 peer countries: Burundi, DR Congo, Ethiopia, Ghana, Kenya, Malawi, Mozambique, Rwanda, Tanzania, Zambia and Zimbabwe. These countries are similar in terms of socio-economic development, epidemiological situation and geographic location. Uganda scores high on the health inputs (average rank of 3 out 12 for the 3 health input indicators), but poorer on the coverage (average rank of 10 out of 12 for the 3 coverage A n n u a l H e a l t h S e c t o r P e r f o r m a n c e R e p o r t 2 0 1 0 / 11 23 indicators) and health outcome indicators (average rank of 7 out 12 for the 3 outcome indicators). Note that most data pertain to 2009 and 2010, and do not include the recent 2010/11 figures in this report, such as pentavalent /DTP3 coverage. Table 14: Rank for key health indicators for 12 countries, including Uganda (WHO, 2011) BEST RANK 1 POOREST 2 3 4 6 7 8 9 10 11 12 UG GNI per capita (PPP int.$) (2008) UG PER CAPITA TOTAL EXPENDITURE (PPP int. $) (2009) INPUT 5 UG GOVERNMENT EXPENDITURE ON HEALTH (% TOTAL GOVERNMENT EXPENDITURE) (2009) UG COVERAGE BIRTHS ATTENDED BY SKILLED HEALTH PERSONNEL (%) (2009) OUTCOME CORE HEALTH WORKER DENSITY (2000-2010) MATERNAL MORTALITY RATIO (2008) UG UG DTP3 IMMUNIZATION COVERAGE AMONG 1-YEAR-OLDS (%) (2009) UG CONTRACEPTIVE PREVALENCE RATE (2001-2010) UG UG UNDER FIVE MORTALITY RATE (2008) UG TOTAL FERTILITY RATE (2009) Figure 6 examines the progress that Uganda has made during 1990 - 2009 compared to the average progress of its peer countries. Economic growth was 1.6 faster in Uganda than the average, but expenditure on health was much slower than in peer countries (70% slower). Overall, the coverage and health outcome indicators indicate the progress in Uganda has been slower than in the peer countries during 1990 - 2009. Although Uganda is ranked 12 out of 12 for 3rd dose pentavalent vaccine coverage, the increase over this period was nearly 1.5 times greater than peer countries. Figure 6: Uganda's progress benchmarked relative to the peer countries over time for the period 1990 to 2010. General government expenditure on health -0.7 Per capita total exp. (PPP int.$) 1.6 Births attended by skilled health personnel (%) -0.1 DTP3 immunization coverage among 1year-olds (%) 1.4 Maternal mortality ratio 0.4 Under five child mortality 0.1 -0.5 Total fertility rate -1 -0.5 0 0.5 1 1.5 2 2.5 3 Figure 2: Uganda's progress benchmarked relative to the peer countries. The progress of the peer countries has been standardized at 0. The progress of the peer countries has been standardized at 0. (GGE= General government expenditure on health as a percentage of total government expenditure, U5= Under five mortality; SBA= Births attended by skilled health personnel; TFR= Total Fertility rate). (Source WHO 2011) 24 A n n u a l H e a l t h S e c t o r P e r f o r m a n c e R e p o r t 2 0 1 0 / 11 2.7 Summary of the Financial Report 2010/11 FY Health service delivery is financed by the government, private sources and development assistance under the sector wide arrangement. Of the Government of Uganda expenditure on health for the FY 2010/11, capital expenditure accounted for 17% of health sector public expenditure while recurrent expenditure such as wages, utilities and other operational costs accounted for 83%. Donor funding is mainly for development items. The GoU funds are channeled through the MOH, LGs and the OPM. Therefore, the ability of a health system to protect the poor against unaffordable health care need and avoid impoverishment resulting from excessive health care costs (catastrophic expenses) is the core of health care financing. This can be achieved through; i. ii. Increasing government per capita expenditure on health and Raising the proportion of household financing mobilized through prepayments The Health Financing Review 2009/2010 points out that there has been significant increase in the expenditure, from 16 US$ per person in 1999 - 2000, to the current total expenditure on health of over US$ 27 per person per year (representing a 69% increase in total health expenditure). However, this is less than US$ 44 per person per year the WHO World Health Report 2010 defined as the current estimates needs for provision of an appropriate basic package of services in low income settings. A n n u a l H e a l t h S e c t o r P e r f o r m a n c e R e p o r t 2 0 1 0 / 11 25 2.7.1 Trends of the health sector funding (2000/01-2010/11) The trend in allocation of funds to the health sector shows that there has been a steady increase in budget allocation over the past 10 years as illustrated in the table below. Table 15: Government allocation to the Health Sector 2000/01 to 2010/11 Year GoU Funding (Ushs bns) Donor Projects and GHIs (Ushs bns) Total (Ushs bns) Per capita public health exp (UGX) Per capita public health exp (US $)) GoU health expenditure as % of total government expenditure 2000/01 2001/02 2002/03 2003/04 2004/05 2005/06 2006/07 2007/08 2008/09 2009/10 2010/11 124.23 169.79 195.96 207.80 219.56 229.86 242.63 277.36 375.46 435.8 569.56 114.77 144.07 141.96 175.27 146.74 268.38 139.23 141.12 253.00 301.8 90.44 239.00 313.86 337.92 383.07 366.30 498.24 381.86 418.48 628.46 737.6 660 10,349 13,128 13,654 14,969 13,843 26,935 13,518 14,275 20,810 24,423 20,765 5.9 7.5 7.3 7.7 8.0 14.8 7.8 8.4 10.4 11.1 9.4 7.5 8.9 9.4 9.6 9.7 8.9 9.3 9.0 8.3 9.6 8.9 Analysis of the table above reveals the following; i. The GoU allocation to the health sector has been rising steadily over the last ten years, owing to economic growth, but the proportion of the budget spent on health did not increase. ii. The donor project component reduced significantly in FY 2010/11. The decline is on account of the exit of some Development Partners, like DANIDA, from the sector. p The proportion of the total Government budget to health still averages at 9% which is short of the Abuja target of 15% iii. 26 A n n u a l H e a l t h S e c t o r P e r f o r m a n c e R e p o r t 2 0 1 0 / 11 2.7.2 Financial Performance for Local Governments (LGs) The overall PHC budget performance for financial year 2010/11 for LGs was Shs. 221.2 billion out of an approved budget of Shs. 207.8 billion representing 106% budget out turn. This funding excludes project funds and funds meant for medicines and health supplies. There was over budget performance under PHC wages due to supplementary budget releases for health workers salaries amounting to Shs 18.5 billion. The supplementary budget provision was due to inadequate provision of funds for PHC wages for staff in post in financial year 2010/11. The supplementary budget provision led to the over performance of the budget. The worst budget performance for grants to LGs was under PHC development grant where Shs. 40.1 billion was released out of the approved budget of Shs 44.5 billion representing 90% budget out turn. General hospitals and NGO health facilities budget out turn was 98% and 97% respectively. However some general hospitals and NGO hospitals did not receive the 4th quarter funds in financial year 2010/11 due to non compliancy of the LGs in reporting to MoFPED on the health facility inventories. Key issues under LG Financing i. Low per capita allocation for Health services especially at health centre levels. ii. Prevalence of Off- Budget/project funding which necessarily do not address key sector priorities. iii. Inefficiencies in procurement of services and works. Table 16: Primary Health Care Grants FY 2000/2001-2010/11 in billions of Ug. Shillings FY 2000/01 2001/02 2002/03 2003/04 2004/05 2005/06 2006/07 2007/08 2008/09 2009/10 2010/11 PHC PHC (NON- PHC NGOs ( GENERAL PHC ( DEV'T (WAGES) WAGE) PNFP) HOSPITALS GRANT) TOTAL 9.6 8.8 6.7 6.3 10 41.4 35 14.9 11.6 8.9 11 81.4 43.9 19.7 16.7 8.7 7.6 96.6 44.7 23.2 17.7 10.4 9.2 105.2 68 23.2 17.7 10.4 6.1 125.4 72 22.4 17.7 10.4 5.9 128.4 74.6 22.9 17.7 10.6 6.1 131.9 85.1 22.9 17.7 10.6 6.3 142.6 85.1 28.7 17.7 10.6 15.3 157.4 107.5 28.7 17.7 10.2 15.3 179.4 124.5 17.4 17.7 5.9 15.3 180.8 Source: Approved Budget Estimates of Revenue and Expenditure- MOFPED. A n n u a l H e a l t h S e c t o r P e r f o r m a n c e R e p o r t 2 0 1 0 / 11 27 Figure 7 shows that there has been steady increase in PHC wages over the last ten years, with no increase in the remaining components of the PHC grant. In FY 2010/11, there was a 39% decrease in the PHC Non-wage despite the increase in the number of districts. This severely affected delivery of services including management services like support supervision at LG level. Figure 7: Trends in PHC Grant Allocations 2000/01 – 2010/11 140 120 100 PHC( WAGES) 80 PHC (NON- WAGE) 60 PHC NGOs( PNFP) 40 GENERAL HOSPITALS 20 PHC( DEV'T GRANT) 0 Table 17: Government of Uganda health sector budget performance for FY 2010/11 (excluding donor projects) Item Approved Budget (Ushs bns) Budget performance (%) Outturn (Ushs bns) Wage 178.07 195.94 110.04 Non-Wage 293.28 272.12 92.78 98.21 91.35 93.02 Development 28 Remarks The difference was on account of a supplementary budget passed to cover wage shortfalls The performance can be attributed to general cuts across Government during the financial year A n n u a l H e a l t h S e c t o r P e r f o r m a n c e R e p o r t 2 0 1 0 / 11 As illustrated in Table 17, the amount released to cover wages was higher than the approved budget. This is because the sector experienced wage shortfalls which resulted in a supplementary budget allocation of Ushs. 17.86bn. The non-wage and development budgets performed at an average of 92%. LGs performed at an average of 106% as illustrated in table 18. Table 18: Local Government Grant Performance for FY 2010/11 Item Budget( 000') PHC Wages Actual Release (000') % 124,823,442 143,340,468 115 PHC Non-wages 14,355,550 14,229,320 99 PHC NGOs 16,848,318 16,352,712 97 General Hospitals 6,107,088 5,997,141 98 PHC Development 44,564,550 40,192,230 90 1,159,329 1,157,251 100 207,858,277 221,269,122 106 NGO Wage Subvention Total Table 19: Financial Performance for Central Institutions and Referral Hospitals for FY 2010/11 (UGX Billion) INSTITUTION WAGE NON WAGE DEVELOPMENT TOTAL Approved Released Approved Released Approved Released Approved Released Performance Budget Budget Budget Budget (%) MoH 4.27 4.327 26.42 25.85 75.86 15.119 106.55 45.30 42.51 UCI 0.4 0.439 0.62 0.535 3 3 4.02 3.974 98.86 UHI 0.4 0.411 0.04 0.038 1.5 3 1.94 3.449 177.78 NMS 0 0 201.73 181.23 0 0 201.73 181.23 89.84 HSC 0.73 0.569 1.71 1.647 0.35 0.347 2.79 2.563 91.86 UBTS 1.46 1.48 1.79 1.79 0.07 0.038 3.32 3.308 99.64 Mulago 18 15.603 9.82 12.321 5.02 5.02 32.84 32.944 100.32 Butabika 2.24 2.371 3.15 3.148 27.19 RRHs 24.812 26.246 8.34 8.978 17.004 17.004 50.152 52.223 Total 52.312 51.445 253.621 235.538 129.989 51.158 435.922 425.391 Grant Performance (%) 98.34 92.87 32.58 39.36 97.6 100.40 100.40 104.00 97.6 Most institutions that had releases over and above the approved budget were on account of the Wage grant that had been under provided in the budget. This necessitated passing a A n n u a l H e a l t h S e c t o r P e r f o r m a n c e R e p o r t 2 0 1 0 / 11 29 supplementary budget and therefore a greater than 100% performance of the approved budget. Main achievements x A study on the efficiency of hospitals and HC IVs was conducted and findings will be used to inform resource allocation and utilization. x A new resource allocation formula for the sector was developed and is now awaiting the input of the private not for profit sub-sector. This is expected to further improve equity and efficiency in resource allocation. x The sector undertook a PNFP Hospital value for money audit. x The sector also continued to lobby for and mobilize resources both locally and internationally. x A concept note on the Health Financing Strategy has been developed. Major Challenges x Inadequate funding for sector activities for example, the conditional grants to Local Governments and PNFPs have not significantly changed yet population, administrative units and prices have increased significantly x Rising costs of goods and services distorted set plans x Unplanned and unbudgeted for activities. Unforeseen and unbudgeted for but catastrophic and urgent emergencies such as Ebola and Yellow Fever exerted pressure on operational resources thus constraining other important activities. x Off-budget sector funding: A number of health improving activities are funded outside the sector wide mechanism that was established to align funding to sector priorities. This leads to efficiency losses associated with funding activities that may be duplicative or outside the priorities identified to achieve health outcomes. x Weaknesses in the LG capacity in areas of financial reporting, leadership and financial management Recommendations x Expedite plans with the International Finance Co-operation to finalize a financing agreement to enable private health providers’ access affordable funds to improve on health service delivery. x Lobby for more funds to finance sector activities. x Implement the revised resource allocation formula for the sector x Conduct the national health accounts and disseminate its findings among policy makers x Finalise the new Health Financing Strategy and implement strategies therein x Analysis and review of the quarterly budget performance reports (BPR) and following up on recommendations. x Enhance periodic supervision, reporting to ensure efficient budget monitoring and performance. 30 A n n u a l H e a l t h S e c t o r P e r f o r m a n c e R e p o r t 2 0 1 0 / 11 x x Reduce off budget funding by ensuring that all projects and donor inflows are aligned to HSSIP and reflected in the budget. Reduce out–of-pocket funding for health care by introducing prepayment systems like health insurance. Despite the very modest increment in general government allocation for health, efforts were made to establish mechanisms for securing and allocating available resources e.g. new resource allocation formula for the sector and PNFPs and development of the National Financing Strategy. The last published National Health Accounts (NHA) study for Uganda, covering financial years 1998/1999 to 2010/11; out of pocket expenditure was between 40% and 42% of overall expenditure on health. Government per capita expenditure on health was USD 8.31. Given that mobilization of prepaid resources health care financing has not progressed, it implies that the financial burden on households between 2000/01 and 2010/11 has increased. The fiscal space study (World Bank 2009), showed a twofold increase in out of pocket expenditure on health between 2002/03 and 2004/05 from US$7 to US$14 per utilization. A n n u a l H e a l t h S e c t o r P e r f o r m a n c e R e p o r t 2 0 1 0 / 11 31 2.8 Summary Assessment of the Health System / Health Sector Support System The central level’s main roles are coordination and provide support functions like planning, supervision, resource mobilization and development of the sector. This section analyses progress in performance for the central level institutions which include the MoH headquarters, departments, priority programs, projects, referral hospitals and semi-autonomous institutions. The assessment is based on planned activities in the MPS FY 2010/11 (See section 3.1). Among the central level vote functions the Support to Health Sector Strategic Plan Project (SHSSPP) had the best level of performance (80%), against planned outputs, followed by pharmaceutical and other supplies (75%), then sector monitoring and quality assurance (60%). Achievement of planned key outputs under the various vote functions supporting health care service delivery varied as summarized in the matrix below. Table 20: Summary of performance by Vote Function No. of key planned outputs 40% >40% - 80% >80% Comment Health Systems Development 7 3/7 (43%) 2/7 (29%) 2/7 (29%) Poor SHSSPP 5 0/5 (0%) 1/5 (20%) 4/5 (80%) Good Clinical and Public Health 6 3/6 (50%) 3/6 (50%) 0/5 (0%) Moderate Uganda Cancer Institute 2 0/2 (0%) 1/2 (50%) 1/2 (50%) Moderate Uganda Heart Institute 2 0/2 (0%) 1/2 (50%) 1/2 (50%) Moderate Uganda Blood Transfusion Services 6 1/6 (17%) 3/6 (50%) 2/6 (33%) Moderate National Referral Hospitals – Mulago and Butabika 4 0/4 (0%) 2/4(50%) 2/4 (50%) Moderate Sector Monitoring and Quality Assurance 5 0/5 (0%) 2/5 (40%) 3/5 (60%) Good Health Research 3 0/3 (0%) 2/3 (67%) 1/3 (33%) Moderate Pharmaceutical and Other Supplies 8 0/8 (0%) 2/8 (25%) 6/8 (75%) Good Policy, Planning & Support Services 15 2/15 (13%) 7/15 (47%) 6/15 (40%) Moderate Human Resources for Health 6 0/6 (0%) 3/6 (50%) 3/6 (50%) Moderate Vote Function 32 A n n u a l H e a l t h S e c t o r P e r f o r m a n c e R e p o r t 2 0 1 0 / 11 2.9 Global Fund (GF) Supported Interventions 2010/11 The GF supported interventions in this financial year contributed towards the attainment of the MDGs 4, 5, and 6 in relation to improving MCH as well as national and international health goals. During the reporting period, the GF disbursed $28,562,216.30 which was utilized on procurement of ARVs, cotrimoxazole, HIV test kits, laboratory reagents, trainings for service providers and printing of Information Education Communication (IEC) materials. This facilitated the procurement of 70,443 doses of Cotrimoxazole, 172,000 doses of ARVs, 200,000 HIV tests, 10 CD4 count machines and their laboratory reagents. The balance of is $3,600,000 yet to be spent on procurement of condoms. An additional USD 4M was in turn disbursed to subrecipients to conduct trainings and IEC activities. The disbursement under the malaria grant worth USD 40,885,477 targeted providing Long Lasting Nets for pregnant women and children under-5. It was used for procurement of 7,295,850 LNs through Voluntary Pooled Procurement (VPP). Additionally, USD 6,297,305 was disbursed directly to the country for mostly Civil Society Organisation (CSO) implemented activities of training, IEC/ BCC, registration, M&E, actual distribution and post distribution activities. Phase 1 distribution was successfully completed in Central, Western and Northern and Eastern Regions. Additionally Uganda signed an agreement with the GF under the Affordable Medicines Facility for Malaria (AMFm), where the GF subsidized ACTs by 95%. Under this grant 10 million doses of ACTs have already been delivered into the country. The GOU supported the TB program to purchase 180 microscopes and conduct training of 1,126 health workers in 38 districts. The country developed and submitted a country proposal for R10 HIV, Malaria, TB and HSS, which was approved by the GF board worth a total of USD 190M for five years. The country also submitted Round 7 phase two which has been approved worth USD $ 130 million for three years. Following the 2008 recommendation by the Inspector General of the GF, a Focal Coordination Office (FCO) was created. With GOU and GF, recruitment took place in October 2010 and the team came fully on board in February 2011. A n n u a l H e a l t h S e c t o r P e r f o r m a n c e R e p o r t 2 0 1 0 / 11 33 2.10 Global Alliance for Vaccines and Immunisation (GAVI) Progress 2010/11 During the year under review Uganda received pentavalent vaccines worth USD $ 6,261,080 for the Expanded Program for Immunization. The GAVI secretariat had a mission in country in May 2011 and an MOU has been drafted and has been cleared by the Solicitor General. As soon as the GAVI secretariat signs the MOU then the Immunization Systems strengthening and Health Systems Strengthening funds will become available for the EPI program to implement the planned activities. 2.11 Health Partnerships Performance 2.11.1.1 The Compact for implementation of the HSSIP 2010/11 – 2014/15 At the beginning of HSSIP 2010/11 – 2014/15 a Country Compact was signed by MoH, HDPs, CSOs and the private sector. This section assesses progress in implementation of the Compact as well as the decentralized responses (partners’ technical and financial support for health). The HPAC serves as the overall oversight and steering body for monitoring the implementation of the Compact. The main areas of focus during the year under review are extracted from the list of indicators for monitoring the Compact 2010/11 – 2014/15 (See section 3.2). Table 21: Summary Matrix for monitoring progress of implementation of the Compact No. of key planned outputs Area of Focus 40% >40% - 80% >80% Comment Planning and Budgeting 5 4/5 (80%) 0/5 (0%) 1/5 (20%) Poor Monitoring programme implementation and performance 6 2/6 (33%) 3/6 (50%) 1/6 (17%) Moderate Policy guidance and monitoring 3 0/3 (0%) 1/3 (33%) 2/3 (67%) Good 34 A n n u a l H e a l t h S e c t o r P e r f o r m a n c e R e p o r t 2 0 1 0 / 11 Table 22: HPAC Institutional representatives’ attendance Jul 2010 – Jun 2011 Month Jul Aug Sep Oct Nov Dec Jan Feb Mar Apr May Jun MOH (11) HDP (4) 36% 73% 55% 55% 45% 64% 55% 36% 9% 45% 0% 64% CSO (4) 125% 100% 125% 75% 100% 75% 75% 100% 100% 100% 0% 75% 100% 75% 75% 50% 0% 25% 50% 0% 75% 75% 0% 50% NMS (1) 0% 0% 0% 100% 200% 100% 100% 0% 100% 100% 0% 0% District (1) NRH (2) 0% 0% 0% 0% 100% 0% 100% 0% 0% 0% 0% 0% 0% 0% 0% 0% 0% 0% 0% 0% 0% 0% 0% 0% RRH (1) 0% 0% 0% 0% 0% 0% 0% 0% 0% 0% 0% 0% Line Ministries (5) 0% 0% 0% 0% 0% 0% 0% 0% 0% 0% 0% 0% 2.1 Decentralized Responses Project Support to LGs is mainly towards the HIV/AIDS program activities with the highest number of projects in the central region followed by the eastern and western. The SURE project supporting access to essential medicines has a national level coverage. Future assessments will analyse project support in relation to district performance for supported interventions, however, there is need to note that despite the high level of project support in the area of HIV/AIDS, there is slow progress in the programme indicators e.g. number of exposed infants tested for HIV and number of eligible clients initiated on ART. Only one project STRIDES is focusing on RH in particular FP service provision however there has been tremendous improvement in the CYP from 582,804 in 2009/10 to 787,390 in 2010/11. A n n u a l H e a l t h S e c t o r P e r f o r m a n c e R e p o r t 2 0 1 0 / 11 35 Table 23: Project Support to Local Governments Project Area of Support Region Central East Central Eastern Karamoja Northern South West West Nile Western X X X X X X X X SURE Medicines STAR-SW HIV/AIDS SUSTAIN HIV/AIDS X IRCU HIV/AIDS X STAR-E HIV/AIDS NUMAT HIV/AIDS STAR-EC HIV/AIDS WORLD BANK Infrastructure Development X X X STRIDES RH X X X SDS Strengthening Decentralization X X X MALARIA CONSORTIUM Malaria X STOP MALARIA Malaria X UNFPA RH X BAYLOR HIV/AIDS IDI HIV/AIDS X MILDMAY HIV/AIDS X WALTER REED PROJECT HIV/AIDS X Total Projects 36 X X X X X X X X X X X X X X X X X X X X 12/17 X X X X X X X X X X X X X X X X X X X X X 8/17 11/17 4/17 5/17 8/17 A n n u a l H e a l t h S e c t o r P e r f o r m a n c e R e p o r t 2 0 1 0 / 11 7/17 11/17 A n n u a l H e a l t h S e c t o r P e r f o r m a n c e R e p o r t 2 0 1 0 / 11 37 2.1.1 Progress made towards achieving international resolutions and obligations e.g. WHO, ECSA, IHP+ During the period under review, the MoH participated in several Regional and International fora where important decisions and commitments were made. Here below is a summary of the progress of implementation of the resolutions. Progress towards achieving the East African Community (EAC) recommendations of the forum for Ministers responsible for Social development The second meeting of the Forum for Ministers responsible for Social Development was held in Burundi from 2nd to 7th October 2010. The meetings reviewed the proposed priority areas of regional cooperation and made a number of important recommendations under the health sector. Since then progress has been achieved as indicated in the table below. Recommendation / Action Achievement Remarks Partner states to make collective x The East Africa Public Health Laboratories efforts in addressing issues such as project has been operationalized to communicable diseases, address communicable diseases and pharmaceutical products and country consultations have been carried medicines. out for pooled procurement of medicines. x Partner states to establish ‘’health x services charters’’ at national level. x EAC partner states to develop and x harmonize electronic early warning and rapid response systems for communicable disease outbreaks and fast track the establishment of the proposed’’ EAC Regional x Integrated e-Health Information system. x 38 Project approved and Uganda is a beneficiary The patients’ Charter spells out patients’ rights and responsibilities and the responsibility of The MOH together with the Ministry responsible for Public Service developed a health workers Clients’ Charter for the Health Sector to the patients. which highlights the commitments of the health ministry to its clients. There is a draft e-health policy and strategic plan in place awaiting technical assistance from the Commonwealth Secretariat. The EAC Medicines Registration Regulatory Harmonization project was drafted with strong participation of Uganda. MoH together with Health Consumer Organizations developed the Patients’ Charter which was launched in November 2010 and has been disseminated to all districts of the country. The DHIS 2 has been adopted by all stakeholders in the health sector The EAC Secretariat is strengthening the East African Integrated Disease Surveillance Network (EADSNET) in order A n n u a l H e a l t h S e c t o r P e r f o r m a n c e R e p o r t 2 0 1 0 / 11 EAC partner states to promote multi x sectoral collaboration in the implementation of social and reproductive health and rights projects and programmes at both national and regional levels in order to enhance the reduction of x maternal, neonatal and infant mortality rates. EAC partner states to integrate the x regulation and practice of traditional, herbal, Complementary and alternative medicine under the national ministries responsible for x health. EAC Sectoral council of Ministers of x Health to fast-track the EAC Regional Study on Harmonization of ‘’National Social Health Insurance System’’ and to include the Terms of Reference on recommendations and mechanisms for the establishment of ‘’Community Based Social Health Insurance Schemes’’ at national level, where feasible. to enhance timely communication and sharing of information on disease outbreaks. Following the assessment of the status of MDGs, a multi sectoral framework was developed to address bottlenecks in the attainment of MDG 4 & 5 on Child and Maternal Health, respectively. Developed and reviewed the cost of the operational plan on the roadmap to accelerate reduction of maternal and neonatal morbidity and mortality. Government approved the principles for enacting indigenous and complementary medicine practice bill/act. The Public Private Partnership for Health (PPPH) policy was finalized and is in cabinet for approval. The NHIS act is undergoing stakeholder consultations. EAST, CENTRAL AND SOUTHERN AFRICA-HEALTH COMMUNITY (ECSA-HC) The MOH participated in the ECSA-HC 52nd Health Ministers Conference which was held on 25th29th October, 2010 in Harare Zimbabwe under the theme Moving from knowledge to Action: Harnessing Evidence to Transform Healthcare. Resolutions were made on Evidence based policy making, Universal Health Coverage, MCH/RH/Family Planning (FP), Gender Based Violence (GBV) and Child Sexual Abuse; HRH Leadership and Management for Quality Health Services, Prioritizing Nutrition interventions, Strengthening Monitoring and Evaluation systems, Strengthening response to MDR and XDR and Strengthening Partnerships for Health. The MOH has responded to the different thematic areas of the resolutions. For instance the health sector follows the use of evidence for policy formulation and decision making; in addition the Uganda National Health Research Organization (UNHRO) has been established to A n n u a l H e a l t h S e c t o r P e r f o r m a n c e R e p o r t 2 0 1 0 / 11 39 coordinate all health related research and facilitate dissemination and use; a National Health Insurance scheme to address the issue of universal Health coverage is undergoing stakeholders’ consultations. The ECSA regional policy on GBV and child sexual abuse is being adopted by the country, a motivation and retention strategy to address HRH issues was developed and is undergoing costing; Plan to develop a holistic communication strategy to address human nutrition habits and life styles is underway, and a nutrition hand book for the general public and VHTs has been developed. A Non Communicable Diseases (NCDs) survey is underway. A comprehensive Monitoring and Evaluation framework has been finalized. 40 A n n u a l H e a l t h S e c t o r P e r f o r m a n c e R e p o r t 2 0 1 0 / 11 2.2 Local Government Performance 2.2.1 District League Table Performance The objective of the district league tables is to assess the performance of the district given its available resources. Eleven indicators were selected to evaluate and rank district performance: 8 coverage and quality of care indicators, given a collective weight of 75%; and 4 management indicators, accounting for the remaining 25%. The indicators were selected for consistency with the 26 core HSSIP 2010/11 – 2014/15 indicators, reliability of the data source, and frequency of data collection. Routine HMIS data from the Resource Centre were the primary data source for a majority of the indicators (Pentavalent Vaccine 3rd Dose coverage, institutional deliveries, outpatient visits, Sulfadoxine / Pyrimethamine (SP) 2nd dose for IPT, 4th ANC visits, HMIS timeliness and completeness of reporting, and District Health Management Team (DHMT) meetings held); some of the indicator data were provided by MoH programmes such as HIV/AIDS, TB, human resources and environmental health. There were a number of issues pertaining to quality of the final data set, such as missing data, outliers, and inconsistencies between monthly reports and end-of-year totals for HMIS data. Despite efforts by the Resource Centre to follow up with districts, there were four districts that failed to submit an annual report to the national level. These districts were given a score of zero for some of the coverage indicators that were computed based on numbers from the annual report. A few districts showed an uncommonly large discrepancy between the monthly reports submitted by the district and the end-of-year total reported in the district annual report. These were flagged and targeted for follow-up. One district, Alebtong, was removed from the league table ranking due to large inconsistencies in the data over multiple indicators. Finally, district population projections for 2011 provided by UBOS may contain inaccuracies as they are based on 2002 census data. These issues are addressed in greater detail in the Data Quality Annex. Due to the different set of indicators used to assess district performance and the addition of 32 new districts, a direct comparison cannot be made with the rankings in district league tables from previous years. The actual rankings have to be interpreted with caution. Not only can the quality of reporting be variable and cause errors in the performance rankings, also the population denominators can be a source of error. First, they are based on a national average growth rate projection of the 2002 census and some districts have had markedly different growth rates. Second, clients do not stick to district boundaries and may seek services in other districts which then get higher coverage and better rankings. However, Kampala remains the top ranking district this year, and Kaabong remains among the bottom 10 districts. Table 22 shows the top and bottom 15 performing districts with their ranks and total scores. The full district league tables can be seen in the Annex. The national average score was 58.4. A n n u a l H e a l t h S e c t o r P e r f o r m a n c e R e p o r t 2 0 1 0 / 11 41 Table 24: Top 15 performing districts Total District Score KAMPALA 77.5 BUSHENYI 74.2 KABAROLE 73.1 MBARARA 70.3 GULU 69.0 BUTALEJA 68.0 LYANTONDE 67.7 BULIISA 67.0 JINJA 66.7 KATAKWI 66.4 ABIM 66.4 RUKUNGIRI 65.8 MUKONO 65.3 KABERAMAIDO 65.2 SIRONKO 65.1 Table 25: Bottom 15 performing districts Total District Score ADJUMANI 42.7 LWENGO 41.8 LUUKA 41.6 NAPAK 41.6 GOMBA 41.2 MOYO 40.7 KOLE 40.4 BUHWEJU 40.1 NAMAYINGO 39.7 KAABONG 37.0 SERERE 30.1 AMUDAT 23.2 NTOROKO 22.9 KWEEN 17.8 BULAMBULI 17.8 Rank 1 2 3 4 5 6 7 8 9 10 11 12 13 14 15 Rank 97 98 99 100 101 102 103 104 105 106 107 108 109 110 111 The 32 new districts showed lower performance compared to existing districts (see Table 24), with Kyegegwa being the highest scoring new district ranked at 48th (out of 111). All new districts scored lower than the national average. New districts tended to have less reliable reporting and lost many points due to incomplete and missing reports. Four of the bottom five performing districts failed to submit an annual district report, and thus could not be assigned scores for some of the core coverage indicators such as Pentavalent 3rd dose coverage and institutional deliveries. In addition, new districts were much more likely to have missing data on HIV testing of infants, DHMT meetings and timeliness of medicine orders. Table 26: District ranking gfor the top new districts Total District Score KYEGEGWA 56.2 BUTAMBALA 55.8 NWOYA 55.2 BUYENDE 54.8 ZOMBO 54.8 AGAGO 54.2 KALUNGU 53.8 RUBIRIZI 53.7 SHEEMA 52.5 KIBUKU 51.5 NGORA 50.8 BUVUMA 50.7 BUKOMANSIMBI 50.2 LAMWO 47.7 BUIKWE 46.2 KYANKWANZI 46.1 42 Rank 1 2 3 4 5 6 7 8 9 10 11 12 13 14 15 16 National Rank 48 51 53 54 55 57 60 61 68 70 76 77 78 87 90 91 Table 27: District ranking for bottom new districts Total District Score OTUKE 45.8 MITOOMA 44.7 KIRYANDONGO 42.9 LWENGO 41.8 LUUKA 41.6 NAPAK 41.6 GOMBA 41.2 KOLE 40.4 BUHWEJU 40.1 NAMAYINGO 39.7 SERERE 30.1 AMUDAT 23.2 NTOROKO 22.9 KWEEN 17.8 BULAMBULI 17.8 A n n u a l H e a l t h S e c t o r P e r f o r m a n c e R e p o r t 2 0 1 0 / 11 Rank 17 18 19 20 21 22 23 24 25 26 27 28 29 30 31 National Rank 92 94 96 98 99 100 101 103 104 105 107 108 109 110 111 Districts with RRHs were generally found to have a higher score than those that did not (see Table 26). Large facilities and hospitals can attract clients from neighbouring districts, confounding district coverage estimates. This is particularly true for more specialized services such as HIV testing of infants born to women with HIV. Of the 14 districts with regional/national referral hospitals, five were ranked in the top 10 highest scoring districts: Kampala, Kabarole, Mbarara, Gulu, and Jinja. Table 28: District ranking for districts with regional/national referral hospitals Total District Score KAMPALA 77.5 KABAROLE 73.1 MBARARA 70.3 GULU 69.0 JINJA 66.7 MBALE 64.4 LIRA 64.2 MASAKA 63.0 KABALE 59.9 SOROTI 53.7 ARUA 52.7 HOIMA 48.9 MUBENDE 47.1 MOROTO 43.0 National Rank Rank 1 1 2 3 3 4 4 5 5 9 6 16 7 17 8 21 9 33 10 62 11 66 12 84 13 88 14 95 Below national average of 58.4 Three-quarters of hard-to-reach districts scored below the national average (see Table 27). This indicates that being hard-to-reach could have an impact on district performance. Nonetheless, four hard-to-reach districts ranked among the top 20 highest scoring districts: Gulu, Abim, Mukono, and Kisoro. Eleven of the 25 hard-to-reach districts are also Peace Recovery and Development Plan (PRDP) districts. Approximately half of PRDP districts score above the national average (see Table 28), indicating that the PRDP infrastructure development funds may be aiding in increasing scores for these districts. A n n u a l H e a l t h S e c t o r P e r f o r m a n c e R e p o r t 2 0 1 0 / 11 43 Table 29: District ranking for hard-to-reach Table 30: District ranking for Peace Recovery and districts Development Plan (PRDP) districts Total National Total National District Score Rank Rank District Score Rank Rank GULU 69.0 1 5 GULU 69.0 1 5 ABIM 66.4 2 11 BULIISA 67.0 2 8 MUKONO 65.3 3 13 KATAKWI 66.4 3 10 KISORO 63.9 4 19 ABIM 66.4 4 11 BUKWO 58.9 5 37 KABERAMAIDO 65.2 5 14 KANUNGU 58.8 6 38 SIRONKO 65.1 6 15 Below AMURU 57.6 7 42 MBALE 64.4 7 16 national KITGUM 57.2 8 44 LIRA 64.2 8 17 average KAPCHORWA MAYUGE 56.1 9 49 63.6 9 20 of 58.4 NEBBI NWOYA 55.2 10 53 62.6 10 23 AGAGO 54.2 11 57 KUMI 61.8 11 25 PADER 53.8 12 59 PALLISA 61.5 12 26 BUNDIBUGYO 52.7 13 67 BUDAKA 61.3 13 27 KALANGALA 51.5 14 72 BUKWO 58.9 14 37 BUVUMA 50.7 15 77 DOKOLO 58.3 15 40 Below KOTIDO 49.5 16 80 AMURU 57.6 16 42 national NAKAPIRIPIRIT 49.1 17 82 KITGUM 57.2 17 44 average of 58.4 LAMWO 47.7 18 87 OYAM 56.5 18 46 MOROTO 43.0 19 95 BUKEDEA 56.0 19 50 ADJUMANI 42.7 20 97 APAC 55.3 20 52 NAPAK 41.6 21 100 MASINDI 54.4 21 56 NAMAYINGO 39.7 22 105 PADER 53.8 22 59 KAABONG 37.0 23 106 SOROTI 53.7 23 62 AMUDAT 23.2 24 108 ARUA 52.7 24 66 NTOROKO 22.9 25 109 KOTIDO 49.5 25 80 KOBOKO 49.4 26 81 NAKAPIRIPIRIT 49.1 27 82 YUMBE 47.9 28 86 MOROTO 43.0 29 95 ADJUMANI 42.7 30 97 MOYO 40.7 31 102 KAABONG 37.0 32 106 The lowest scoring districts tended to have a small population (below 200,000), and the highest scoring district Kampala also had the largest population. Beyond this, however, there did not appear to be a strong relationship between the total score and the population size of the district. Smaller districts may have lower rankings because the people seek services outside of the district. 44 A n n u a l H e a l t h S e c t o r P e r f o r m a n c e R e p o r t 2 0 1 0 / 11 Figure 8: District population vs. total score Table 31: District ranking by district population Population under 100,000 District LYANTONDE BULIISA ABIM BUKWO BUTAMBALA NWOYA KALANGALA BUVUMA OTUKE BUHWEJU NTOROKO KWEEN Total Score 67.7 67.0 66.4 58.9 55.8 55.2 51.5 50.7 45.8 40.1 22.9 17.8 National Rank Rank 1 7 2 8 3 11 4 37 5 51 6 53 7 72 8 77 9 92 10 104 11 109 12 110 A n n u a l H e a l t h S e c t o r P e r f o r m a n c e R e p o r t 2 0 1 0 / 11 45 Population from 100,000 to 250,000 Population from 250,000 to 500,000 Total District Score BUSHENYI 74.2 BUTALEJA 68.0 KATAKWI 66.4 KABERAMAIDO 65.2 SIRONKO 65.1 KISORO 63.9 KAPCHORWA 63.6 MASAKA 63.0 BUDUDA 62.7 MPIGI 62.1 KUMI 61.8 BUDAKA 61.3 NAMUTUMBA 59.4 KANUNGU 58.8 DOKOLO 58.3 AMURU 57.6 NAKASONGOLA 57.0 NAKASEKE 56.2 KYEGEGWA 56.2 BUKEDEA 56.0 BUYENDE 54.8 ZOMBO 54.8 IBANDA 54.2 PADER 53.8 KALUNGU 53.8 RUBIRIZI 53.7 BUNDIBUGYO 52.7 SHEEMA 52.5 MARACHA 52.2 KIBUKU 51.5 SEMBABULE 51.5 KIBOGA 51.5 AMOLATAR 51.3 NGORA 50.8 BUKOMANSIMBI 50.2 KOTIDO 49.5 KOBOKO 49.4 NAKAPIRIPIRIT 49.1 KALIRO 48.0 LAMWO 47.7 KYANKWANZI 46.1 MITOOMA 44.7 MOROTO 43.0 LUUKA 41.6 NAPAK 41.6 GOMBA 41.2 KOLE 40.4 NAMAYINGO 39.7 SERERE 30.1 AMUDAT 23.2 BULAMBULI 17.8 Total District Score KABAROLE 73.1 MBARARA 70.3 GULU 69.0 JINJA 66.7 RUKUNGIRI 65.8 MBALE 64.4 LIRA 64.2 RAKAI 64.0 NEBBI 62.6 PALLISA 61.5 KAMWENGE 61.2 KAMULI 60.9 TORORO 60.9 ISINGIRO 60.2 IGANGA 59.9 KABALE 59.9 NTUNGAMO 59.4 MANAFWA 59.1 MITYANA 58.8 KAYUNGA 58.3 KITGUM 57.2 OYAM 56.5 MAYUGE 56.1 APAC 55.3 MASINDI 54.4 AGAGO 54.2 SOROTI 53.7 KYENJOJO 53.2 BUGIRI 52.8 LUWERO 49.6 KIRUHURA 48.9 HOIMA 48.9 YUMBE 47.9 AMURIA 47.0 BUIKWE 46.2 BUSIA 44.7 KIRYANDONGO 42.9 ADJUMANI 42.7 LWENGO 41.8 MOYO 40.7 KAABONG 37.0 Rank 1 2 4 5 6 7 8 9 10 11 12 13 14 15 16 17 18 19 20 21 22 23 24 25 26 27 28 29 30 31 32 33 34 35 36 37 38 39 40 41 42 43 44 45 46 47 48 49 50 51 52 National Rank 2 6 10 14 15 19 20 21 22 24 25 27 34 38 40 42 45 47 48 50 54 55 58 59 60 61 67 68 69 70 71 73 74 76 78 80 81 82 85 87 91 94 95 99 100 101 103 105 107 108 111 National Rank Rank 1 3 2 4 3 5 4 9 5 12 6 16 7 17 8 18 9 23 10 26 11 28 12 29 13 30 14 31 15 32 16 33 17 35 18 36 19 39 20 41 21 44 22 46 23 49 24 52 25 56 26 57 27 62 28 63 29 65 30 79 31 83 32 84 33 86 34 89 35 90 36 93 37 96 38 97 39 98 40 102 41 106 There appears to be a slightly positive relationship between district staffing levels (% of approved posts that are filled) and the overall score. However this is partly to be expected as staffing levels are one of the indicators included in the calculation of the overall score. 46 A n n u a l H e a l t h S e c t o r P e r f o r m a n c e R e p o r t 2 0 1 0 / 11 Table 32: Staffing levels for top ten districts District KAMPALA BUSHENYI KABAROLE MBARARA GULU BUTALEJA LYANTONDE BULIISA JINJA KATAKWI Staffing National level Rank 123% 1 53% 2 79% 3 35% 4 73% 5 38% 6 38% 7 74% 8 57% 9 71% 10 Table 33: Staffing Levels for Bottom ten districts District MOYO KOLE BUHWEJU NAMAYINGO KAABONG SERERE AMUDAT NTOROKO KWEEN BULAMBULI A n n u a l H e a l t h S e c t o r P e r f o r m a n c e R e p o r t 2 0 1 0 / 11 Staffing National level Rank 51% 102 30% 103 25% 104 20% 105 42% 106 44% 107 33% 108 39% 109 64% 110 52% 111 47 2.3 Service Delivery 2.3.1 Hospital Performance Essential Clinical Care is a key component of the UNMHCP. Hospitals are major contributors to the outputs in essential clinical care and the community sees hospital functionality as a sign of a working health system. Many problems of hospitals Number quickly come in to public knowledge and concern as has Hospital been evidenced in recent press reports. Public 66 According to the health facility inventory of January 2011 PNFP 61 there are 143 hospitals; the number of hospitals has been increasing especially those belonging to the private PHP 16 sector. There is a very wide spread of hospital size and 143 out puts, and according to the minimum definition1 Total criteria of hospitals according to the hospital policy many hospitals especially private health practitioner hospitals do not satisfy the criteria of a hospital but are nonetheless registered as hospitals. For example bed sizes vary from 18 to 355 for general hospitals and from 120 to 482 for regional referral hospitals and large PNFP hospitals. The assessment of hospitals within the annual health sector performance report is now in its seventh year; there has been effort to analyze the functioning of hospitals. This analysis largely looks at outputs of hospitals and relates inputs to outputs and outcomes. In order to have uniform comparison of outputs of hospitals we will continue to use the Standard Unit of Output (SUO).2 The SUO is a composite measure of outputs that allows for a fair comparison of volumes of output of hospitals that have varying capacities in providing the different types of patient care services. Basic efficiency indicators for resource use are generated and tables comparing hospitals generated. Emphasis is on general and RRHs, however we recognize that a suitable performance assessment for national referral hospitals is lacking and the current assessment is not very appropriate for RRHs as well. There is need to develop a robust hospital performance assessment methodology for all levels of hospitals and an accreditation scheme that ensures basic standards and performance of a health unit that should be classified as a hospital. 1 A hospital is defined as “A registered health care facility, public or private organisation, profit or not for profit, devoted to providing curative, preventive, promotive and rehabilitative care, through outpatient, inpatient, and community health services. It should have at least 60 beds, a high level of skilled medical personnel including doctors, and be able to carry out major surgery and advanced investigative procedures including X-ray. It should serve a population of at least 200,000 people”. 2 SUO stands for standard unit of output an output measure converting all outputs in to outpatient equivalents. SUO total = 6(IP*15 + OP*1 + Del.*5 + Imm.*0.2 + ANC/MCH/FP*0.5) based on earlier work of cost comparisons. 48 A n n u a l H e a l t h S e c t o r P e r f o r m a n c e R e p o r t 2 0 1 0 / 11 For the year 2010/2011, reports have been received from 85 general hospitals of which; only 78 had information that allows for fair analysis. The eleven RRHs and four large PNFP hospitals (Nsambya, Rubaga, Mengo and Lacor) as previously will be analyzed in their own group. In this group, 15 hospitals submitted data that would allow a fair analysis. 1.1.1 Regional Referral Hospitals There are 13 RRHs in the country, but for the annual reporƟng exercise 4 large PNFP hospitals (Nsambya, Rubaga, Mengo, and Lacor) with the scale and scope of RRHs are included in the group. The full set should then be 17 hospitals. Reports were received from 15 out of the 17 hospitals some of them incomplete. a) Inputs Finance The total approved budget for RRHs was 50,152 Billion Shs. and actual release was 52,223 Billion Shs. The additional funding was mainly towards wage subvention. Overall budget performance was 104%. Table 34: Financial Performance for RRHs for FY 2010/11 (UGX Billions) INSTITUTION WAGE (,000,000) NON WAGE (,000,000) DEVELOPMENT (,000,000) TOTAL (,000,000) Performance (%) Approved Released Approved Released Approved Released Approved Released Budget Budget Budget Budget Arua Fort Portal Gulu Hoima Jinja Kabale Masaka Mbale Soroti Lira Mbarara Mubende Moroto Total 2.285 1.806 2.04 1.459 2.955 1.43 2.067 2.674 1.827 1.835 2.088 1.173 1.173 24.812 2.481 2.2 2.317 1.46 3.153 1.43 2.271 2.961 2.076 2.141 2.379 0.958 0.419 26.246 0.561 0.616 0.623 0.50 0.709 0.602 0.563 0.932 0.569 0.58 0.787 0.663 0.635 8.34 0.561 0.616 0.623 0.50 0.709 0.602 0.563 0.932 0.569 0.58 1.425 0.663 0.635 8.978 1.442 1.494 1.3 1.17 1.601 1.603 1.602 1.352 1.2 2.4 1 0.42 0.42 17.004 1.442 1.495 1.3 1.17 1.601 1.603 1.602 1.352 1.2 2.4 1 0.42 0.419 17.004 4.288 3.916 3.963 3.125 5.265 3.635 4.232 4.958 3.596 4.815 3.875 2.256 2.228 50.152 4.484 4.311 4.24 3.125 5.463 3.635 4.436 5.245 3.845 5.121 4.804 2.041 1.473 52.223 104.57 110.09 106.99 100.00 103.76 100.00 104.82 105.79 106.92 106.36 123.97 90.47 66.11 104% The total number of staff in the 13 hospitals that provided the information is 3,859, on average the number of staff per hospital is 297 (243 for RRHs only) but with a wide range from 117 to A n n u a l H e a l t h S e c t o r P e r f o r m a n c e R e p o r t 2 0 1 0 / 11 49 555. Among the RRHs an analysis of positions filled against establishment was made. Table 33 shows variation among different cadres. Clearly, medical doctors and pharmacy staff are in most shortage. Among hospitals the newly elevated hospitals – Moroto and Mubende are worst affected with filled positions of 45% and 50% respectively as seen in Figure 9. Table 35: Positions filled in Regional Referral Hospitals Medical Doctors Nursing Clinical Officers Pharmacy Dispensers Laboratory Anaesthesia All Medical staff Average positions filled 44% 88% 77% 40% 49% 68% 68% 76% Minimum positions filled 13% 56% 41% 0% 20% 42% 31% 45% Maximum positions filled 72% 161% 125% 100% 120% 116% 140% 120% Source: Hospital submissions for AHSPR 2010/11 Figure 9: Filled staff positions in RRHs RRH All Medical Staff Filled Positions RRH All Medical Staff Filled %120 % 140% 120% 120% 88% 120% 83% 80% 86% 83% 71% 76% 77% 100% 88% 140% 86% 83% 71% 83% 77% 70% 80% 76% 120% 80% 57% 70% 100% 50%57% 50% 45% 60% 80% 45% 60% 40% 40% 20% 20% 0% 0% Positions % b) Outputs The outputs of the 11 regional RRHs and 4 large PNFP hospitals have been analyzed here below. The 15 hospitals attended to 313,021 inpatients, 1,633,149 outpatients and 77,158 deliveries among other outputs. On average each hospital attends to 20,868 inpatients, 108,877 outpatients. St. Mary Lacor hospital a large PNFP hospital has the highest SUO among the RRHs and large PNFP hospitals. Masaka and Mbarara RRH data was not available for analysis. The average SUO per staff for all hospitals combined was 1802. Soroti RRH and Kabale RRH had the highest (2,280 and 2,112 respectively), while Gulu and Mengo RRH had the lowest (977 and 774 respectively). 50 A n n u a l H e a l t h S e c t o r P e r f o r m a n c e R e p o r t 2 0 1 0 / 11 Major Operations (N = 15) Patient Days (N = 15) 435,007 46,406 4,738 313,021 1,458,422 42,114 6,254,510 108,877 9,283 5,144 29,000 3,094 316 20,868 97,228 2,808 416,967 Min 36,748 1,806 462 6,129 71 120 9,110 42,185 78 216,630 Max 206,090 23,064 7,885 93,771 9,810 482 60,145 168,493 10,572 574,841 Average SUO (N = 15) 77,158 Admissions (N = 15) Beds (N = 15) 139,244 Total ANC (N = 15) 1,633,149 Hospital Name FP visits (N = 14) Immunizations (N = 15) Deliveries (N = 15) OPD attendances (N = 15) Table 36: Overall performance for Regional Referral and Large PNFP Hospitals NB: Catholic-faith based institutions do not provide conventional FP methods. A comparison of volume of outputs based on the SUO has been made and is shown in figure 10. Figure 10: Volume of Outputs Regional Referral and Large PNFP hospitals 600000 500000 SUO 400000 300000 200000 100000 St. Mary Lacor Arua Jinja Rubaga Nsambya Fort Portal Kabale Soroti Average Lira Mbale Gulu Mengo Hoima Mubende Moroto Mbarara Masaka 0 a) Quality assessment There was not sufficient information to make a more elaborate assessment of quality of care. Hospital based deaths especially maternal deaths are an indicator of quality of care. The total maternal deaths reported in 14 RRHs and large PNFP hospitals was 479 giving a mean death of 34 mothers per hospital per year with a minimum of zero (Moroto) and maximum of 183 (Hoima). Hoima certainly looks an outlier an audit to verify the truth of the data and/or the causes of such a high number of maternal deaths are necessary. If correct, this would mean an A n n u a l H e a l t h S e c t o r P e r f o r m a n c e R e p o r t 2 0 1 0 / 11 51 unlikely high MMR. The maternal mortality reporting system needs to be improved urgently. Overall, hospital case fatality rate was 4.1% (deaths over admissions), with one outlier: Rubaga hospital has 17.9% case fatality. b) Efficiency of use of services Regarding the scale of operation the mean hospital in this group is 316 beds, admits 20,868 patients and has a staff of 297. Generally the RRHs and the PNFP hospitals analyzed have a high rate of utilization – Average bed occupancy is 86% compared to last year (2009/10) when it was 93%. Staff productivity is 1,534 SUO/Staff less than that for GHs (1,577). This is due to a more complex case mix and higher skill mix of staff in RRHs compared to the GHs. The average length of stay of 5.0 is the same as in GHs. 52 A n n u a l H e a l t h S e c t o r P e r f o r m a n c e R e p o r t 2 0 1 0 / 11 A n n u a l H e a l t h S e c t o r P e r f o r m a n c e R e p o r t 2 0 1 0 / 11 53 Fort Portal 2,178 351 23,028 130,513 2,486 478,096 6,736 362 20,814 109,060 1,738 568,558 Admissions Patient Days Major Operations 350,783 1,067 80,433 15,896 359 334,916 1,976 78,329 14,415 244 2,270 93,771 3,687 6,478 77,128 Hoima Source: Hospital submissions for AHSPR 2010/11 SUO Beds FP Visits 2,196 44,939 9,405 Immunization 43,413 6,429 77,128 4,383 6,413 92,974 Gulu 6,705 5,335 23,064 ANC Deliveries 206,090 Arua OPD Jinja 547,058 2,405 119,051 25,456 432 5,803 10,009 6,009 7,547 126,496 Lira 368,638 10,572 112,971 14,941 340 2,863 16,783 4,548 7,804 113,093 355,234 3,508 150,128 60,145 460 6,733 13,249 7,885 5,876 107,250 Mbale Table 37: Key Hospital Outputs in RRHs and Large PNFP Hospitals Moroto 193,149 78 42,185 9,338 150 631 6,129 462 1,806 48,325 Mubende 216,630 1,150 57,777 9,110 120 1,382 9,873 2,755 7,081 59,999 Kabale 475,246 3,275 97,881 18,504 280 9,810 14,376 5,754 10,206 156,033 Nsambya 490,419 3,101 80,915 17,567 319 71 48,074 7,621 15,642 171,488 St. Mary Lacor 574,841 3,455 168,493 26,396 482 - 23,240 3,564 6,933 152,966 Mengo 336,684 2,943 69,966 16,844 301 1,318 41,976 6,130 15,144 36,748 Rubaga 508,289 2,279 62,959 18,839 271 969 44,799 7,669 14,300 107,765 Soroti 455,969 2,081 97,761 21,728 267 3,446 14,971 4,651 4,821 99,666 6,254,510 42,114 1,458,422 313,021 4,738 46,406 435,007 77,158 139,544 1,633,149 Total A n n u a l H e a l t h S e c t o r P e r f o r m a n c e R e p o r t 2 0 1 0 / 11 773 130,513 5.7 102% 2,486 478,096 855 109,060 5.2 83% 1,738 568,558 Deaths Patient Days Average Length of Stay Bed Occupancy Rate Major Operations Gulu 977 350,783 1,067 61% 5.1 80,433 424 15,896 359 359 244 184 1,820 334,916 1,976 88% 5.4 78,329 535 14,415 Hoima Source: Hospital submissions for AHSPR 2010/11 SUO / Staff SUO 1,799 23,028 Admissions Beds 20,814 Arua 351 316 Fort Portal 362 Staffing Positions by Hospital Jinja 1,392 547,058 2,405 76% 4.7 119,051 1,165 25,456 432 393 Lira 1,423 368,638 10,572 91% 7.6 112,971 726 14,941 340 259 1,211 60,145 460 1,057,804 3,508 89% 2.5 150,128 Mbale 1,400 193,149 78 77% 4.5 42,185 136 9,338 150 138 Table 38: Selected Efficiency Parameters RRHs and Large PNFP hospitals 2010/11 Moroto 54 Mubende 1,852 216,630 1,150 132% 6.3 57,777 427 9,110 120 117 Kabale 2,112 475,246 3,275 96% 5.3 97,881 627 18,504 280 225 Nsambya 1,790 490,419 3,101 69% 4.6 80,915 520 17,567 319 274 St. Mary Lacor 1,036 574,841 3,455 96% 6.4 168,493 1,086 26,396 482 555 Mengo 742 336,684 2,943 64% 4.2 69,966 176 16,844 301 454 Rubaga 1,320 508,289 2,279 64% 3.3 62,959 3,372 18,839 271 385 Soroti 2,280 455,969 2,081 100% 4.5 97,761 668 21,728 267 200 4,738 3,859 1,534 6,957,080 42,114 86% 5.0 1,458,422 12,701 313,021 Total A n n u a l H e a l t h S e c t o r P e r f o r m a n c e R e p o r t 2 0 1 0 / 11 55 316 120 482 117 555 Min Max Staffing Positions by Hospital (n= 13) 297 Beds (N = 15) Average Admissions(N = 15) 60,145 9,110 20,868 Deaths (N = 15) 3,372 136 847 168,493 42,185 97,228 Patient Days Table 39: Summary of Efficiency Parameters RRHs and Large PNFP hospitals 2010/11 7.6 2.5 5.0 Bed Occupancy Rate (N = 15) 132% 61% 86% Major Operations (N = 15) 10,572 78 2,808 SUO (N = 15) 1,057,804 193,149 409,240 2,280 742 1,534 SUO/Staff (N = 13) Average Length Of Stay (N = 15) 2.3.3 General Hospitals a) Inputs Finance Government release to GHs during 2010/11 FY was 5,997,141,000 Ug. Sh. vs a budget of 6,107,088,000. This total to 98% of the budget estimate. Human Resource There is a very wide range of staff numbers in hospitals. According to the new staffing norms a standard public GH should have 190 staff. PNFP and private hospitals with varying bed capacities and workloads reported varying staff sizes and compositions. The staff numbers in GHs ranged from 7 to 318 with an average of 116 staff per hospital. Human resource shortage in hospitals remains a major challenge to service delivery. . In a sample of 26 public general hospitals, the proportion of positions filled ranged/varied from 14 - 79% with a mean of 55%. Outputs As in the previous years, 5 main outputs have been used as indicators for volume of activity by the hospitals, these are: Admissions, Outpatient visits, Deliveries, ANC and immunization. Table 40: Outputs from the General Hospitals FY 2010/11 Number reporting Minimum Maximum Average 2010/11 Average 2009/10 Average 2008/09 Average 2007/08 9,801 74 18 355 132 142 123 130 546,540 74 398 19,201 7,386 8,472 7,271 3,194 Inpatient days 2,453,304 73 1,106 120,846 33,607 38,722 Out patients 3,495,844 76 1,891 581,154 45,998 42,455 32,197 33,185 108,046 70 43 4,808 1,544 1,419 1,389 1,465 44,518 73 1,873 610 561 555 617 245,268 78 15,542 3,144 3,568 12,197 14,329 24,543 73 1,307 336 299 1,063 911 636,066 75 1,043 35,771 8,481 8,730 13,009 13,323 12,526,623 78 1,504 581,764 160,598 178,777 439,848 453,348 Total Beds In patients Deliveries Major operations ANC Cesarean Section Immunization SUO Source: Hospital submissions for AHSPR 2010/11. Note that figures for previous years are from Resource Centre 56 A n n u a l H e a l t h S e c t o r P e r f o r m a n c e R e p o r t 2 0 1 0 / 11 Hospital output indicators have been summed up in composite units – the SUO. With this measure we can compare the volume of output or activity basing derived from the 5 main indicators. The top ten hospitals with the highest outputs are: Iganga, Mityana, Bududa, Busolwe, Tororo, Bwera, Kitgum St. Joseph, St. Kizito Matany, Kamuli Mission and Ishaka. From the information the average for three outputs are down compared to last year (2009/10), these are: inpatient, antenatal and immunization. While the outpatients, deliveries and major operations, including cesarean sections have gone up. Decrease in admissions may be attributable to stock outs and shortage of staff. Some hospitals notably Amudat and Gulu Military Hospital were not able to do cesarean sections. By the time of writing this report however, Amudat hospital started to do cesarean sections following efforts of Doctors with Africa CUAMM and Italian Cooperation to train staff, rehabilitate the theatre and support the hospital to recruit a Medical Officer. Notable is that 24% of all deliveries in the general hospitals were done by Cesarean Section. b) Efficiency of use of services There isn’t a significant difference in efficiency indicators in the year 2010/11 compared to the year before. There was a reduction in bed occupancy rate from 74% to 69%, on the contrary there was an increase in SUO per staff in 2010, indicating activities other than the inpatient have had a sizable increase. Again, it has not been possible to analyze efficiency for use of funds because of lack of complete or reliable financial reports. In FY 2010/11, an average hospital had the following indicators compared to the year before (in brackets): Average length of stay 5 (4.6) days; bed occupancy rate 69% (74%); one staff on average was producing 1,577. Although some core activities like inpatient, ANC and immunization decreased, these were compensated the increase in outpatient and deliveries, leading to a net increase in staff productivity overall 1,577 SUO/staff compared to 1,487 the year in 2009/10. Table 41: Selected efficiency parameters for General Hospitals Total Min Max Average 2010/11 Average 2009/10 Staffing Positions by Hospital (N = 71) 8,254 7 318 116 120 Total Number of Beds (N = 74) 9,801 18 355 132 142 546,540 398 19,201 7,386 8,472 355 2 34 5 4.6 Total Min Max Average 2010/11 Average 2009/10 50% 16% 148% 69% 74% 111,976 213 8,876 1,577 1,487 Total Admissions (N = 74) Average Length of Stay (N = 73) Bed Occupancy Rate (N = 73) SUO / Staff (N = 71) Source: Hospital Submissions for AHSPR 2010/11 A n n u a l H e a l t h S e c t o r P e r f o r m a n c e R e p o r t 2 0 1 0 / 11 57 c) Quality of care The information available could not allow an elaborate measurement and comparison of quality of care among hospitals. Hospital based deaths especially maternal deaths are an indicator of quality of care. The total maternal deaths reported in 70 general hospitals were 1,015 giving a mean death of 14.5 mothers per hospital per year with a minimum of zero and maximum of 288. The top outliers need to be audited to verify the truth of the data and the causes of such a high number of maternal deaths. These hospitals and the maternal deaths involved are: Amai 288, Kambuga 190, Nyapea 90, Iganga 43, Naggalama 30 and Mityana 23. 2.3.4 Functionality of HC IVs A central feature of a health sub-district in Uganda is a health centre level IV, where there is no hospital to serve a supervisor role. The key feature of the HSD Strategy was that each HSD of approximately 100,000 people would have a Hospital or a Health Centre IV with the capacity to provide basic promotive, preventive and curative services, including Emergency Surgical and Obstetric Services and to supervise and support planning and implementation of services by the lower health units in the zone. Extensive access to such services has been demonstrated to lead to a big improvement in health status indicators even in poorer countries compared to the much wealthier ones. Being a key strategy of the sector, the functionality of Health Centre IVs has been reviewed every year in the last 5 AHSPRs. a) Methodology The District Annual Reports included information on HC IVs with input, management, output and even outcome information. 88 HC IVs from 112 districts provided information of varying degrees of completeness. Functionality was determined by outputs from selected components of the minimum service standards i.e. Maternity (deliveries), Inpatient Blood Transfusion, Theatre (caesarean section, Major and Minor surgery), HCT, PMTCT, ART, Long Term Contraception and Outpatient services. This is similar to the analysis done in the previous financial years. 58 A n n u a l H e a l t h S e c t o r P e r f o r m a n c e R e p o r t 2 0 1 0 / 11 b) Level of HC IV Functionality Data for 11 of the 12 functionality indicators was available. There was no data for long term FP methods. Based on the 11 indicators 18 HC IVs scored 100%. Table 42: HC IVs with 11 of the 11 functionality indicators Number HC IV DISTRICT 1. NAMAYUMBA WAKISO 2. BUKASA KALANGALA 3. KALANGALA KALANGALA 4. BUFUMBO MBALE 5. MWERA MITYANA 6. KYABUGIMBI BUSHENYI 7. SSEKANYONYI MITYANA 8. MUKONO.CO.U MUKONO 9. KIGOROBYA HOIMA 10. NABILATUK NAKAPIRIPIRIT 11. BUKWO BUKWO 12. MANJIYA BUDUDA 13. MPIGI MPIGI 14. KOTIDO KOTIDO 15. MIDIGO YUMBE 16. RUGAZI RUBIRIZI 17. KATAKWI KATAKWI 18. KIWANGALA LWENGO Outpatient, HIV Counseling and testing were available in all the HC IVs that submitted information on the services available. Key primary reasons for establishing HC IV were to provide cesarean section and blood transfusion; despite these being cardinal services in the definition of a functional HC IV they are available in only 24% and 26% of the HC IVs respectively. The trend in the last 3 years however is upward for each of these cardinal services as shown in the figure 11. A n n u a l H e a l t h S e c t o r P e r f o r m a n c e R e p o r t 2 0 1 0 / 11 59 Figure 11: Trends in Caesarean Section and Blood transfusion 30% Trend in Caesarean Section and Blood Transfusion in HC IV 28% 25% % providing 20% 15% 24% 23% 19% 17% 14% 26% 24% 19% 15% 10% Caesarea… 5% 0% 2006/07 2007/08 2008/09 2009/10 2010/11 For outpatient, inpatient, deliveries and ART services, the average outputs from each HC IV were 21,028; 1,864; 1,996 and 292 respectively. Note that the number of units reporting for 2010/11 was considerably smaller than in previous years. Compared to 2009/10 many service utilization indicators went down in 2010/11 except, deliveries, HIV counseling and testing, PMTCT and Dental service utilization. Table 42 shows these comparisons. Table 43: Provision of selected key health services by HC IVS 2010/11 # offering services 2009/10 2008/09 2007/08 Average Outputs 10/11 % of reports # offering services Average Outputs 09/10 % of reports # offering services Average Outputs 08/09 % of reports # offering services % of reports OPD 52 21,028 100% 117 28,833 98% 134 28,438 100% 93 100% Deliveries 80 1,996 92% 115 557 97% 114 566 85% 86 92% HCT 45 4,156 100% 110 3,434 92% 116 2,746 87% 81 87% PMTCT 77 1,092 100% 112 908 94% 116 1,068 87% 85 91% Dental 41 1,007 82% 86 18 72% 87 887 65% 66 71% IPD 76 2,077 99% 80 2,894 67% 90 3,194 67% 65 70% ART 40 292 83% 94 635 79% 96 214 72% 70 75% Minor Operations 49 282 64% 74 384 62% 68 429 51% 58 62% 60 A n n u a l H e a l t h S e c t o r P e r f o r m a n c e R e p o r t 2 0 1 0 / 11 2010/11 # offering services 2009/10 Average Outputs 10/11 % of reports LTFP 2008/09 2007/08 # offering services Average Outputs 09/10 % of reports # offering services Average Outputs 08/09 % of reports # offering services % of reports 57 98 48% 63 105 47% 38 41% Major Surgery 19 27 26% 40 71 34% 20 54 15% 28 30% C/S 18 13 24% 27 28 23% 20 44 15% 26 28% Blood Transfusion 19 37 26% 28 207 24% 25 150 19% 16 17% 111 - 93% 134 - 100% 93 92% Laboratory - Since the main objective of setting up HC IVs was to provide Comprehensive Emergency Obstetric Care (CEmoC) – that is being able to provide intervention in case of complications during delivery, which includes the ability to provide a Caesarean Section and Blood Transfusion, HC IVs have been judged “functional” if they have been able to carry out at least one Caesarean Section. Using these criteria, 24% of the HC IVs were ‘functional’ in 2010/11 – an increase from 23% found in 2009/10. c) Factors affecting HC IV Functionality Just like the previous 3 FYs, there are a number of key issues that are associated with HC IV functionality. These include: presence of appropriate infrastructure and equipment; presence of qualified health workers especially medical officers; and LG management capacity and interest in HC IV functionality. Infrastructure and Equipment There was no sufficient information to analyze infrastructure and equipment components of functionality of HC IVs. Service performance and outcomes A n n u a l H e a l t h S e c t o r P e r f o r m a n c e R e p o r t 2 0 1 0 / 11 61 Service performance and outcomes The bed occupancy rate in 2010/11 declined compared to the year before – down from 43% to 38%, in addition there was a reduction in average length of stay form 3 days in 2009/10 to 2.3 days. There was an average of 1,864 admissions in 2010/11. The death rate remained the same as the year before, 0.7%. d) Recommendations The HC IVs are a key mechanism for increasing access to referral facility services and ensuring that the lower units in the health sub-district do perform to their expectation as such HC IVs greatly contribute to universal access to the UNMHCP elements that will directly impact health outcomes. In the year 24% of the HC IVs can be considered ‘functional’. The sector needs to devise mechanisms for ensuring that adequate resources and improvements in management capacity are directed towards HC IVs if we are to achieve the maternal & child health MDGs. i) ii) iii) iv) Efforts must be put in place to enable comprehensive assessment of HC IV functionality. The year 2010/11 has had many gaps in information making it impossible to assess all aspects of HC IV. All HC IVs should regularly submit their monthly and quarterly reports to the districts and then to the Ministry of Health to ease the writing up of the annual report. There is need to increase resources for health centre IV particularly, drugs and supplies and human resource since these are the key determinants of effective utilization of services. Differential budgets based on the utilization volumes have to be adopted. The budget for a HC IV fast becomes insufficient once the centre is fully functional. Shortage of critical staff like medical officers, anesthetists, midwives continue to hinder functionality of HC IVs, there is need to address motivational factors like staff housing and other incentives to encourage staff to go and work in the HC IVs. Health care quality indicators in line with those of hospitals need to be developed for HC IVs. 2.4 Assessment of Village Health Team (VHT) Functionality The VHT Strategy represents the commitment of Government of Uganda to promote Primary Health Care in the communities in line with the 1978 WHO Alma Ata Declaration. VHTs are local people who volunteer to serve their communities by carrying out a range of disease prevention and health promotion activities. As of June 2010, the number of districts that had fully implemented (to 100%) the VHT Strategy stood at 51/93 (55%) districts. Additional thirty-nine districts were at different levels of implementation of the VHT Strategy and 3 districts (Kibaale, Mubende and Sheema) had not 62 A n n u a l H e a l t h S e c t o r P e r f o r m a n c e R e p o r t 2 0 1 0 / 11 started the implementation at all. During the year under review (2010/11), VHT Strategy was established in 18 additional districts of: Lyantonde, Bullisa, Budaka, Namutumba, Moroto, Kotido, Kaabong, Amudat, Nakapiripirit, Napak, Wakiso, Butambala, Gomba, Mpigi, Kalungu, Masaka, Bukomansimbi and Lwengo. The country now has a total of 69/112 (62%) districts that have fully implemented the VHT Strategy. Functionality of the VHTs Only districts with a proper register of trained VHTs, good coordination and monitoring mechanism are able to state the number of active VHTs as well as those that had abandoned the job. According to information available (2009/10 FY), only 30 districts had registers of functional VHTs as defined by the numbers of VHTs who actively carry-out all, or part of their roles and are regularly report on them to the nearest health facility. Estimates of VHT attrition rates range from 0 - 50% with the lowest rates reported in districts that have regular refreshers, supportive supervision, and provide incentives. Current information on functionality of VHTs is expected to be routinely obtained through HMIS 2020 due to be rolled out in 2011/12 FY. Challenges in VHT Strategy Implementation Implementation of the VHT Strategy is costly and many districts may not be able to afford given the present level of funding from government. Some districts have many partners supporting VHTs while others have almost none, making it nearly impossible for them to start/expand VHT implementation. There is therefore need to increase funding for VHT implementation. Not all the districts have an up-to-date register of the VHTs trained and therefore cannot precisely assess the proportion of the VHTs who are actively working or those who have fallen out. Printing of the different tools that the VHTs need to use requires huge sums of money which has not been forthcoming. This particular challenge has direct implication to the functionality of VHTs. Experience gained from the implementation of the VHT strategy affirms that there are many ways of motivating VHTs; monetary and non-monetary packages. However a unified approach to motivation of VHTs has remained elusive and the investment in the same is minimal. A n n u a l H e a l t h S e c t o r P e r f o r m a n c e R e p o r t 2 0 1 0 / 11 63 Recommendations The impact of VHTs could be more pronounced if activities were better planned and focused on evidence-based interventions and epidemiological situation of each district. Effective implementation of the VHT strategy requires a strong linkage with mentoring by the health workers from the nearest health facilities. Different partners need to support the VHT Strategy and not to set up parallel and conflicting structures for short term interest. They should also support districts to motivate VHTs, using appropriate methods. 2.5 Conclusion Measured against the monitoring indicators, the health sector has performed considerably well in view of the shortfalls in the required health system inputs which have remained static. Most of the indicators showed an upward trend. This is particularly noted with proportion of health facility deliveries, children under one year receiving 3rd dose pentavalent vaccine, percentage of households with latrines, per capita OPD utilization and medicines availability. The most notable shortcomings in health system inputs are chronic low under-funding to the sector which affects the procurement of essential health commodities, timely implementation of planned activities and maintenance of an effective work force. 64 A n n u a l H e a l t h S e c t o r P e r f o r m a n c e R e p o r t 2 0 1 0 / 11 3 ANNEX This section gives details of progress in implementation of priority activities under the; 1. Planned key outputs by vote function in the MPS 2010/11 2. Uganda National Minimum Health Care Package (UNMHCP) 3. Integrated Health Sector Support Systems 4. Monitoring and Evaluation of the HSSIP 2010/11 – 2014/15 3.1 Assessment of Performance against Planned Key Outputs in the MPS 2010/11 The planned key outputs and key achievements for FY 2010/11 are outlined under respective vote functions in the tables below. Ranking achievement ч40% Red >40% - 80% Yellow >80% Green 1. Infrastructure Development Planned Outputs Key Achievements Health Systems Development i. Theatre equipment installed in 10 HC IVs. Rating Equipment installed in 4/10 Comments Late payment of GOU contribution Preinstall works done and equipment shipped for 6/10 ii. Office extension completed at MoH headquarters. iii. Solar packages installed in Adjumani, Moroto, Mubende, Mityana, Kabale and Kibaale. 95% completed save for ground floor burglar proofing & fixing shelf shutters Equipment installed in 4/6 while contract for 2/6 signed in March 2011 60% completed in Rukungiri, Kanungu, Luwero & Nakaseke. Procurement delays stalled progress. Procurement delays stalled progress. Work completed in 4 (Kabale, Mubende, Mityana & Kibaale)out of 6 districts. Commenced evaluation for Units in Moyo, Buliisa, Gulu, Pader, Soroti & Amolatar. iv. General rehabilitation carried out in Yumbe hospital. No work done Procurement initiated but not progressed. v. Medical wards constructed in Rushere hospital No work done Procurement initiated but not progressed. A n n u a l H e a l t h S e c t o r P e r f o r m a n c e R e p o r t 2 0 1 0 / 11 65 Planned Outputs Key Achievements Health Systems Development vi. Construction and equipping of HC IVs in Kisozi and Buyiga. No work done vii. Under the Health Systems Strengthening Project supported by the World Bank, 2 RRHs, 17 GHs and 27 HC IVs rehabilitated. These include: RRHs:- Mubende and Moroto. General Hospitals:- Nakaseke, Mityana, Itojo, Apac, Kiryandongo, Masindi, Kitgum, Anaka, Moyo, Nebbi, Kitgum, Kawolo, Entebbe, Buwenge, Bugiri, Iganga, Moyo, Nebbo, Pallisa and Bukwo. HC IVs: Kasanda, Kiganda, Ngoma, Mwera, Kyantingo, Kikamulo, Kabuyanda and Mwizi. 80% revision of standard designs for HC II – RRH progressing; Rating Comments Procurement delays. nd Contracts signed on 2 June 2011. Construction works planned for second half 2011/12 Site surveys by Consultants at beneficiary facilities completed; Tenders for procurement of medical equipment submitted to IDA as scheduled; Evaluation of bids for procurement of vehicles completed Regional Referral Hospitals i. Finalise development plans for RRHs ii. Functionalise Mubende and Moroto hospitals as RRHs iii. Construction of residential houses in 6 hospitals ¾ Gulu 80% Information not available Mubende and Moroto hospitals functionalized as RRH ¾ Gulu stalled on ground floor Partial information ¾ Fort Portal at 60% progress iv. Construction of roads and walk ways in 9 hospitals Information not available v. Construction of incinerators and VIP latrines in 6 hospitals Information not available vi. Completion of on-going construction and rehabilitation in 11 hospitals vii. Procurement of machinery, equipment, furniture and fixtures undertaken in 12 66 ¾ Lira hospital on schedule Ultrasound units, Mobile X-ray, Floroscopy unit, protective screen, CR system supplied and Information not available Partial information A n n u a l H e a l t h S e c t o r P e r f o r m a n c e R e p o r t 2 0 1 0 / 11 Planned Outputs Key Achievements Health Systems Development Comments installed in Fort Portal, Lira, Mubende and Hoima RRHs hospitals viii. Rating ¾ Staff shuttle for Lira Vehicles procured in 12 hospitals Information not available Activities under the Support to the Health Sector Strategic Project (SHSSP) SHSSP is a five year project, worth 33million dollars commenced in FY 2007/08 and during the Financial Year under review, the project was in its 4th year of implementation. i. Finalization of redevelopment of Mbarara Referral Hospital (phase 1) By end of FY, Mbarara hospital re-development which is scheduled to be completed by 1 Nov. 2011 was about 78% complete. Work is progressing on schedule. ii. Construction and rehabilitation of 39 HCs in the 9 districts of South Western Uganda (Mbarara, Isingiro, Ibanda, Kiruhura, Bushenyi, Rukungiri, Kanungu, Ntungamo and Kabale) Completion status for rehabilitation of the 39 HC by the end of the FY was as follows: The causes included: o 20 HC completed handed over (51%); o 11 HC were over 80% complete (28%) and, o 8 HC were between 60 – 80% complete (21%). iii. Completion of construction of 7 Mental Health Units at Regional Referral Hospitals delay x Delay in clearing payment of VAT for contractors had a negative effect on the progress of work. x Contractors’ weak financial capacity x Bad sand from local quarries leading to re-doing cracked floors in 8 facilities; x Long haulage distances of materials under difficult and mountainous terrains and bad road network especially in Kabale, Kanungu and Rukungiri. and The 19 HC are therefore behind schedule for reasons given in the comments column. The contract completion date for the HCs is 1 October 2011. of Construction of the 7 mental health units was completed and commissioned during the FY and A n n u a l H e a l t h S e c t o r P e r f o r m a n c e R e p o r t 2 0 1 0 / 11 67 Planned Outputs Key Achievements Health Systems Development Rating Comments all the units are in use (100%). iv. Equipment of all newly constructed and rehabilitated HCs Medical equipment and furniture for constructed / rehabilitated facilities was procured on schedule, delivered and commissioned. Where the HC rehabilitation was not yet complete, the HCs however, were advised to use the new equipment in the old / existing HCs as they await completion of the rehabilitation works. v. Train staff in RH and Mental Health skills to improve their capacities to manage common conditions All planned and on-going programs training programs funded by the Project (Inservices, Basic and Post Graduate) were carried out as planned This was mainly possible because of regular releases of funds from GOU / MOFPED (counterpart funding) and from the ADB. There was varied performance in the various health infrastructure development projects. Notably projects directly funded by GoU registered much slower progress than development projects funded under SHSSPP and Uganda Health Systems Strengthening Project (UHSSP). If better performance is to be registered in this and other areas in future, procurement planning and delays experienced during the procurement processes need to be anticipated and measures put in place to address them. 2. Health Care Service Delivery Clinical and Public Health i. 68 Planned Outputs Achievements Indoor residual spraying carried out in 53 districts IRS was done in 10 / 53 districts in Northern Uganda (Apac, Oyam, Kole, Pader, Agago, Kitgum, Lamwo, Gulu, Amuru and Nwoya) with good results. Rating Comments A total of 869,861 / 899,716 (96.7%) houses were sprayed with a total population of 2,673,427 / 2,756,339 (97.0%) being protected. A n n u a l H e a l t h S e c t o r P e r f o r m a n c e R e p o r t 2 0 1 0 / 11 Planned Outputs Achievements Rating Comments ii. Distribution of 10.39 million LLINs Over 7.25 million LLINs were procured through the Voluntary Pooled Procurement (VPP) mechanism of the Global Fund and distributed to sub-county level Delayed reporting on the phase 1 distribution and irregular/prolonged procurement procedures. iii. The child survival strategy and road map for reproductive and maternal health rolled out to 40 districts. Roadmap was rolled out to 20/40 districts. Note that all districts are implementing activities that contribute to the targets specified in the roadmap. iv. VHTs established in 40 additional districts. VHTs established in 18 additional districts. Districts with 100% coverage are 55 (49%). Inadequate funding has restricted establishing new VHTs. Inadequate funds to scale up training of VHTs v. The Kampala Declaration on Sanitation scaled up in 40 districts. Scaled up in 7/40 districts Inadequate funds vi. The results of the NCD survey disseminated at national and district level. Not done No funds allocated Performance against the key outputs under the for the Clinical and Public Health vote function was overall below 80% with worst performance for IRS, scaling up of the KDS and NCD where the survey has planned but not been conducted for 2 consecutive years now. A n n u a l H e a l t h S e c t o r P e r f o r m a n c e R e p o r t 2 0 1 0 / 11 69 Cancer Services – Uganda Cancer Institute i. Planned Outputs Achievements Rating 15,000 cancer patients treated Effecting diagnosis of 31,566 Successful outreach and supported patients Cancer awareness programs boosted patient numbers. Effecting investigation of 31,566 patients and providing support to 31,566 patients by year end ii. Completion of re-modeling cancer administrative block and medical ward Comments Completion of Cancer ward in current FY. On-going remodeling of Cancer Administrative Block and Medical Ward and New 6-level Ward. UCI was able to attend to more clients than planned however, was not able to complete remodeling of the administrative block and medical ward as planned. Heart Services – Uganda Heart Institute Planned Outputs Achievements Rating Comments i. 80 open heart, 100 closed heart and thoracic surgeries, 10,000 echocardiograms, 10,000 ECGs, 50 stress tests and 80 endoscopy exams performed. 30 (37.5%) open heart surgery, 163 (163%) closed heart surgery, 5,800 (58%) ECHO, 5,075 (50%) ECGs, 25 (50%) stress tests, 28 (35%) endoscopies performed. Higher utilization by pediatric patients was responsible for high performance of the closed heart surgery and on the other hand limited funding and equipment breakdown was responsible for underperformance. ii. 180 ICU/CCU patients admitted. ICU 146, CCU 236 Need increase in specialized staffs and funding to cater for high costs of consumables. Uganda Heart Institute performed fairly but limited by frequent breakdown of equipment and lack of specialized staff compounded by inadequate funding for the high cost of consumables. 70 A n n u a l H e a l t h S e c t o r P e r f o r m a n c e R e p o r t 2 0 1 0 / 11 Uganda Blood Transfusion Services Planned Outputs Achievements Rating Comments i. Collection, testing and distributing 200,000 units of blood 187,828 units of blood collected; ii. 6,000 blood collecting sessions 4,511 blood collection sessions iii. 250,000 blood bags procured 150,000 procured Stock outs experienced due to inadequate funding iv. Construction of blood banks in Gulu and Fort Portal Not done Inadequate funding v. Quarterly support supervision visits to Regional Blood Banks 4 supervision visits conducted to the 7 Regional Blood Banks There was no support supervision due to lack of funding. vi. Mobilization and recruitment of new blood donor groups Mobilization in schools and community High fuel costs leading to scaling down of activities; the prevailing food crisis; the negative publicity by the media of the walk to donate exercise. National Referral Hospitals – Mulago and Butabika Planned Outputs Achievements i. Conduct 46 general outreaches and attend to 2,400 patients ii. Conduct 51 forensic outreach clinics 46 outreach clinics conducted, 2,396 patients attended to by Butabika Hospital Forensic outreaches conducted 629 patients were resettled to their homes iii. Construction of 4 staff units ¾ staff units were constructed iv. Finalisation of the strategic and development plan Strategic and Development plan for Mulago finalized Rating A n n u a l H e a l t h S e c t o r P e r f o r m a n c e R e p o r t 2 0 1 0 / 11 Comments Inadequate funding 71 3. Monitoring and Evaluation Planned Outputs Achievements Rating Comments Sector Monitoring and Quality Assurance i. Quarterly sector performance reviews 3 Quarterly Performance reviews were held. Quarter 1 and 2 reviews held jointly (Mid-year review) due to delayed release of funds ii. Coordinate Senior Management (SMC) Committee meetings 9/12 SMC meetings held Observed improved attendance of SMC meetings iii. Quality assurance activities – standards and guidelines developed and disseminated x iv. Support supervision visits to Local Governments v. Inspection of health facilities 72 Among the policy issues discussed and forwarded to HPAC and Top management for approval included; the JAF 4 targets and action points, restructuring the basic package TWG into separate 4 separate TWGs to improve their effectiveness, the revised HMIS tools and the UNEPI annual performance report that was endorsed and forwarded to GAVI secretariat. Launched the Uganda Clinical Guidelines (UCG) 2010; disseminated 9,000 copies to all 112 districts. x Draft HSSIP 2010/11 -14/15 M&E Plan developed x Draft Quality Improvement Framework and Strategic Plan developed. 4 Area Team visits conducted in all 13 RRHs and the 112 Local Governments. Conducted in 59 districts as planned. Feedback to the district leadership, MoH SMC, th HPAC and STM. 4 quarter visit funded by the ICB project Noted improvement in duty attendance by qualified staff A n n u a l H e a l t h S e c t o r P e r f o r m a n c e R e p o r t 2 0 1 0 / 11 4. Health Research Planned Outputs Achievements i. Uganda Demographic Health Survey – 5 coordination Coordination meetings conducted UDHS -5 data collection started June 2011 ii. Research in the areas of HIV, malaria, plague, measles and polio. x Report to be completed 2011/12. iii. UNHRO activities Rating National HIV Sero Survey in progress. Data collection completed. x Malaria program review x EPI Program review Comments No research agenda for MoH Three priority issues were addressed: x Access to skilled delivery services by for pregnant women. x Rational treatment of malaria. x Task shifting to address staffing challenges in the sector. 5. Pharmaceutical and Other Supplies i. ii. Planned Outputs Achievements Introduction of essential medicines kit for HC IIs and IIIs. Done Implementation of the MOU for planning and monitoring of medicines procured and supplied Rating New Essential Medicines List of Uganda, Laboratory List and Supplies lists were developed using a consultative process MOU signed in April 2011 A n n u a l H e a l t h S e c t o r P e r f o r m a n c e R e p o r t 2 0 1 0 / 11 Comments Kit reviewed every six months as agreed initially. Lists to be printed 1 quarter of the FY 2011/2012 st There was delay in MoH signing MoU. Monitoring to begin in Quarter 2 of 2011/12 73 Planned Outputs Achievements Rating Comments FY. iii. Monitoring of medicines and health supplies iv. Mentoring of hospitals and health facilities country wide on quantification and ordering of EMHS. v. Periodic review of the “Push Policy” on distribution of EMHS. x Bi monthly stock status reports made at national level. x Annual survey on the tracer items conducted. x Vendors for system development have been evaluated 442 facilities mentored and supervised in the FY 2010/2011 Securing NMS concurrence had to be completed. Review conducted for the period Nov 2010 – April 2011. Kit review includes a detailed look at the strengths and challenges of the policy which is implemented through the kit distribution mechanism See (i) above. Review report (May 2011) available and shared. There was delay in MoH signing MoU with the supporting partners. Support received from other Implementing Partners e.g. over and above GoU budget vi. Preparation of the Uganda Food and Drug Administration Bill and submission to Parliament. Memo submitted to Cabinet in the FY 2010/2011 which referred it to the National Planning Authority to coordinate the various sector consultations NPA report due to be st submitted to cabinet 1 quarter of FY 2011/2012 vii. Medicines and health supplies worth UGX 201.73bn procured and distributed to the national regional and district facilities. Medicines and Health Supplies worth 181.23 (89.8% of projection) billion shillings procured and distributed A total of UGX 20.47 billion was not disbursed/ released by MoFPED. viii. Improve supply chain management for essential medicines, vaccines and other health supplies. NMS introduced the last mile distribution to all health facilities through third party logistics distribution agencies. Supplies getting to health facilities faster than before. 74 A n n u a l H e a l t h S e c t o r P e r f o r m a n c e R e p o r t 2 0 1 0 / 11 6. Policy, Planning and Support Services Planned Outputs Achievements i. Finalization of the Second National Health Policy Completed and launched ii. Finalization of the HSSIP 2010/11 – 2014/15 Completed and operationalised iii. Produce Budget framework paper 2010/11 Completed iv. Produce the Ministerial Policy Statement 2011/12 Completed v. Produce the audit and accountability report Audit reports submitted to PS vi. Produce the health sector performance report 2009/10 Completed vii. Conduct efficiency studies Data collection finalized viii. Review resource allocation criteria Done Review Social Health Insurance Scheme. Technical analyses of the following were done; ix. • • • • x. Policy consultation – 2 quarterly Rating Comments The HSSIP M&E plan has been finalized and is due for launching at the JRM Oct 2011. Delayed accountability by implementers Benefit package, Accreditation criteria, Capacity needs, Status and obstacles and prospects of community health insurance, Reviewed 3 policy documents (Malaria strategic plan, Mental health policy & EPI program review Inadequate facilitation Lengthy development and review processes xi. Training in leadership and management (UHSSP) Curricula developed and Health workers to train identified Training to start 2011/12 xii. Training in leadership and Not done Delays in project A n n u a l H e a l t h S e c t o r P e r f o r m a n c e R e p o r t 2 0 1 0 / 11 75 Planned Outputs Achievements Rating management (ICBP) Comments implementation. xiii. Enhancing Public- Private Partnership PPPH Policy was endorsed by TMC is lined up for endorsement by Cabinet. Process stalled now for 2 years xiv. Enhancing budget monitoring in the sector Done but not as planned Inadequate funding xv. Inter-ministerial collaboration with related sectors such as water and sanitation Cabinet memo has been drafted to be submitted to the cabinet secretariat. Process required wide consultation. 7. Human Resources for Health During the HSSIP 2010/11 – 2014/15 the health sector is committed to attaining and maintaining an adequately sized, equitably distributed, appropriately skilled, motivated and productive workforce in partnership with the private sector, matched to the changing population needs and demands, health care technology and financing. i. Planned Outputs Achievements Recruit 800 health workers Recruited 1,006 health workers 13 Hospital Directors appointed for RRHs Rating Comments Inducted Hospital Directors and Hospital Administrators in all RRHs ii. Carry out validation of health workers in the newly upgraded RRHs of Mubende and Moroto and newly upgraded structures of UCI and UHI. Done Some staff promoted. iii. Launching of the HSC regulations for health workers. Regulations made Not launched due to lack of functional HSC iv. Performance and career enhancement training for members and staff. Had 3 day training. A number of staff sponsored. v. Supervision of 50 districts and 6 RRHs. 25 districts and 4 RRHs supervised Monitoring visits conducted to all PNFP training institutions (Nyakibale, Mutolere, Kisiizi, Kagando, Ngora, Kamuli, Nsambya, Rubaga, Ishaka, Matanyi and Kuluva) vi. Support District Service Commissions. Conducted 6 technical visits Number determined by demand from districts 76 A n n u a l H e a l t h S e c t o r P e r f o r m a n c e R e p o r t 2 0 1 0 / 11 3.2 The Compact for implementation of the HSSIP 2010/11 – 2014/15 Table 44: Progress in implementation of the Country Compact 2010/11 – 2014/15 during 2010/11 FY No Indicator Measurement 1. i. Ranking Planning and Budgeting MoH Annual Workplan reflecting stakeholder contribution (all resources on plan) Annual Workplan Analyzed st and Report submitted to 1 HPAC of FY ii. All new sector investments are appraised by SBWG Reports from SWBG on appraised Projects submitted to HPAC biannually iii. All planned procurements reflected in the Comprehensive Procurement Plan Quarterly assessment of implementation of procurement plan to HPAC iv. Response to the Auditor General’s Report Response to AG’s report presented to HPAC v. Implementation of Harmonized TA Plan Progress towards implementation of agreed TA Plan 2. i. Achievement Although this report was not st produced for the 1 HPAC of FY 2010/11, analyses of record of HPAC discussions show no record of discussion of the MoH annual work plan. Updating the MoH/DP Project Database The following projects were discussed and reports submitted to HPAC for endorsement; x Global fund for sanitation x Italian support for HSSIP x TB laboratory strengthening x GAVI ISS and HSS All were endorsed by HPAC. 4 reports from FY 2010/11 due Analysis of Planned vs Actual procurements was not available due to lack of a comprehensive procurement plan. Although MoH PDU produces monthly reports to PPDA, the quarterly reports were not submitted to HPAC. It is proposed that since the AG’s report is presented at JRM on October, MoH holds internal discussions on the recommendations and presents the action plan to the HPAC of Jan/Feb No follow up Monitoring Programme Implementation and Performance Area Team Visits Quarterly Reports Presentation of reports to HPAC within 30 days after completion of Area Team visits x An assessment of compliance due for FY 2010/11 x Reports were presented to HPAC A n n u a l H e a l t h S e c t o r P e r f o r m a n c e R e p o r t 2 0 1 0 / 11 77 No Indicator Measurement Achievement Visits were made as planned x Propose to include in the future, a report on how the recommendations from the visits have been dealt with th ii. MoH Quarterly Performance Assessment 3 quarterly performance reviews took place The 4 could not take place due the JRM. The plan is to do 3 next FY due the same reason. iii. Technical Review Meeting Present Report from TRM to HPAC by 30 April TRM for FY 2010/11 not held iv. Technical Working Group meetings Target 80% of TWG meetings held v. Annual Health Sector Performance Report Submission of Final Report th by 30 September The performance of TWGS was below average TWG reports were received in 4 out of 11 (36%) SMC meetings In progress Submission of Annual Report to OPM th vi. 3. Submission to OPM by 30 September Process not budgeted for Report submitted on time Policy Guidance and monitoring i. Senior Management Committee Proportion of planned meetings held ii. Health Policy Advisory Committee meetings 92% (11/12) of the scheduled meetings took place iii. Country Coordinating Mechanism (CCM) 5/12 of the meetings occurred on the scheduled dates. 200% performance for CCM meetings Attendance of at least ¾ of meetings by all members 78 x 75% of the scheduled 12 meetings took place Minutes available for verification. Attendance of at least ¾ of meetings by all members HPAC was postponed a couple of times for lack of quorum. There were 8 meetings instead of the originally scheduled 4 meetings but none occurring on the scheduled dates. All extra CCM meetings were related to resource mobilization activities for proposal development. A n n u a l H e a l t h S e c t o r P e r f o r m a n c e R e p o r t 2 0 1 0 / 11 Ranking x Although MoH PDU produces monthly status reports on procurement, the quarterly review reports under finance and administration only captures procurement challenges. x There was no published meeting schedule for TWG meetings and therefore there is no benchmark to compare with the TWGs that met. Some TWGs met more frequently than others. 75% of the scheduled 12 SMC meetings took place with 4 (33.3%) of the 12 meetings taking place on the scheduled dates. Attendance for SMC meetings ranged between 30% and 75% with an average of 55%. 25% of the meetings did not take place due to dates coinciding with Area team visits. Supervision Monitoring Evaluation and Research (SMER), Sector Budget, Maternal and Child Health (MCH), Human Resources for Health (HRH), Medicines and Pharmaceutical supplies and to some extent Private Public Partnership for Health (PPPH) TWGs were more consistent in reporting. There was no report received from Hospitals, Infrastructure TWGs. In May 2011 Basic Package TWG was dissolved into five TWGs: MCH, Environmental Health and Health Promotion, Nutrition, Non Communicable Diseases (NCD) and National Disease Control (NDC). Of these NCD, NDC and MCH submitted once (1 out of 11) 9 % after transforming into individual TWGs. x The MOH attendance in HPAC meetings ranged between 9% to 73% with an average of 48%, while development partner’s attendance ranged between 75% and 100% with an average of 75%. the DHO representative was consistent throughout the period under review. Mulago and Butabika hospitals did not attend any meeting despite regular reminders. The regional referral hospitals and general hospitals did not nominate representatives to HPAC and therefore no attendance was registered. The participation of development partners and civil society can be characterized as high. However when it came to other line ministries, departments and agencies, while the MoFPED showed consistency, the representatives from other line ministries did not attend HPAC and the CCM despite several reminders. The poor attendance is attributed to lack of clear understanding of the mandate and role of these committees. This partly demonstrates the weak intersectoral collaboration. A n n u a l H e a l t h S e c t o r P e r f o r m a n c e R e p o r t 2 0 1 0 / 11 79 3.3 Delivery of the Uganda National Minimum Health Care Package (UNMHCP) Because of the limited resource envelope available for the health sector, the NHP II recommends that a minimum health care package be delivered to all people of Uganda. This package consists of the most cost-effective priority health care interventions and services addressing the high disease burden that is acceptable and affordable within the total resource envelope of the sector. The UNMHCP consists of the following cluster; (i) Health Promotion, Disease Prevention and Community Health Initiatives, including epidemic and disaster preparedness and response; (ii) Maternal and Child Health (iii) Prevention, Management and Control of Communicable Diseases and; (iv) Prevention, Management and Control of Non-communicable Diseases. This section analyses progress in implementation of the UNMHCP under the various clusters in relation to the relevant HSSIP 2010/11 – 2014/15 core indicators, lead programme indicators of focus during 2010/11 FY, annual workplan indicators (process implementation), main achievements, challenges and recommendations. 3.3.1 Cluster 1: Health promotion, disease prevention, and community health initiatives 3.3.1.1 Health promotion and education The key priority for health promotion and education is promoting individual and community responsibility for better health. Lead programme indicators x Standards and guidelines (including criteria for gender sensitivity) for the production and delivery of IEC messages developed and disseminated among institutions by 2011/2012. x The proportion of districts with trained VHTs increased from 31%to 100% by 2014/2015. x The proportion of health facilities with IEC materials maintained at 100%. Annual workplan 2010/11 indicators x Establishment and training of VHTs in 40 additional districts x Motivation of VHTs i.e. Training; Recognition of VHTs; Provision of protective wear; Activity related incentive; transport for VHTs in 40 districts 80 A n n u a l H e a l t h S e c t o r P e r f o r m a n c e R e p o r t 2 0 1 0 / 11 x x Recruitment of full time Public and Media Relations Officer Inventory of VHTs Main achievements x VHTs trained in 18 districts of Lyantonde, Bullisa, Budaka, Namutamba, Moroto, Kotido, Kaabong, Amudat, Nakapiripirit and Napak, Wakiso, Butambala, Gomba, Mpigi, Kanungu, Masaka, Bukomansimbi, Lwengo. x Support supervision and monitoring of VHTs conducted in 40 districts x Distributed 110,000 bicycles to VHTs x Social mobilization to control emergencies and epidemics carried out in 75% of the districts (Cholera, H1N1, Influenza, Yellow Fever outbreak and vaccination, Hepatitis E, Ebola, Nutrition promotion and Child Days). x Developed and disseminated the reviewed VHT training materials, strategy, operational and supervision guidelines. x Implemented MoH media relations programmes (press releases, media coverage, press conferences) Main challenges x Inadequate funding to train VHTs countrywide x Limited public education through the media x Lack of adequate IEC and VHT training materials x Restricted human resource structure for health education staff in the districts Recommendations x Intensify training, supervision and monitoring of VHTs x Develop a mechanism to motivate and make VHTs functional x Secure funding for public awareness and education through the media x Support districts and lower lever social mobilization and advocacy activities. x Intensify technical support supervision and monitoring x Revitalize MoH/HP&E printing unit There has been dismal progress in functionalization of VHTs, though supervision of VHTs was carried out as planned. Social mobilization during outbreaks was adequately covered, this could have been a result of the successful recruitment of a full time Communication Specialist. Other social mobilization activities are hampered by inadequate funding and restricted staffing for health education staff in the districts. A n n u a l H e a l t h S e c t o r P e r f o r m a n c e R e p o r t 2 0 1 0 / 11 81 3.3.1.2 Environmental Health The environmental health component aims at contributing to the attainment of a significant reduction of morbidity and mortality due to environmental health and unhygienic practices and other environmental health related conditions. Core HSSIP Indicator x Latrine coverage (71% 2010/11) Lead programme indicators x Percentage of households with access to safe water. x The proportion of districts implementing water quality surveillance and promotion of safe water chain/consumption increased from 30% to 50% by the year 2015. x The proportion of households with hand washing facilities with soap increased from 22% to 50% by 2015. Annual plan 2010/11 top indicators x Enforcement of Public Health Act x Enacting sanitation ordinances and by-laws x Promotion of hand washing with soap and observance of safe water chain in 10 districts x Implementation Community Led Total Sanitation (CLTS), Kampala Declaration on Sanitation (KDS) scaled up in 40 districts. Main Achievements x National latrine and hand washing coverage to increased from 69.7% to 71% and 22% to 25% respectively. x Advocacy meetings on Kampala Declaration on Sanitation & the use of PHAST tools held for participants from 7 districts of Budaka, Bududa, Bulambuli, Sironko, Butaleja, and Kayunga & Pallisa. x One hundred fifty six (156) district staffs from 13 districts were trained in processes of enactment of ordinances and bye-laws. The staffs were drawn from the districts of Kiboga, Nebbi, Namutumba, Mbale, Kibaale, Kiruhura, Lwengo, Sembabule, Kalungu, Masindi Nakasongola, Luwero and Buikwe. However, only 39 districts are at various stages of passing ordinances and bye-laws. x Support supervision and monitoring carried out in 13 districts focusing on hand washing with soap, sanitation and hygiene new initiatives, Open defecation free villages (ODF), new latrines construction in the districts of Kamuli, Mayuge, Namayingo, Busia, Bugiri and Namutumba Buyende, Kaliro, Iganga, Jinja, Masaka, Rakai and Lyantonde. x The division has had a series of meetings with the Sanitation and Hygiene sub-sector Working Group. This has yielded good results with the creation of a Sanitation and Hygiene budget line in the Ministry of Finance Planning and Economic Development. 82 A n n u a l H e a l t h S e c t o r P e r f o r m a n c e R e p o r t 2 0 1 0 / 11 Main Challenges x Some planned activities like purchase of Public Health Legislation books, water quality testing kits for districts, motor cycles, lactometers, uniforms and protective wear and climate change/health awareness campaigns were not fulfilled due to limited funding. x There are many gaps in environmental health staffing at all levels causing inefficiencies in the areas of environmental health service delivery. Only 10% of the ADHOs in charge of Environmental Health positions have been filled in the districts. x Failure of Local Governments to formulate ordinances and by-laws on environmental health and ensure that they are enforced. Recommendations for 2012/13 x Increase funding to enable implementation of planned activities through the budget line created in the MoFPED. x Procure transport means and other equipment and accessories for the various levels of service delivery x Fast track the process of making and implementation of sanitation ordinances in Local Governments Overall there is minimal improvement in the implementation of environmental health and sanitation interventions at district and community level e.g. rolling out of the Kampala declaration on Sanitation which is long overdue. Local Governments are not effectively playing their role in formulation of ordinances and bye-laws on environmental health. The current inertia will not contribute to the component aim of significant reduction of morbidity and mortality due to environmental health and unhygienic practices and other environmental health related conditions. 3.3.1.3 Control of Diarrheal Diseases Diarrheal diseases including acute watery diarrhea that is not cholera, dysentery and persistent diarrhea are mainly due to poor sanitation, low safe water coverage, poor domestic and personal hygiene practices and mass movement of populations. The main objective of the CDD component is to strengthen initiatives for control and prevention of diarrhea at all levels. Lead programme indicators of CDD x The incidence of annual cases of cholera reduced from 3/100,000 to 1.5/100,000 by 2014/2015. A n n u a l H e a l t h S e c t o r P e r f o r m a n c e R e p o r t 2 0 1 0 / 11 83 x The incidence of annual cases of dysentery reduced from 254/100,000 to 150/100,000 by 2014/2015. x The cholera specific case fatality rate reduced from 2.1% to <1.0% by 2014/2015. x The dysentery specific case fatality rate reduced from 0.08% to 0.01% by 2015. x The acute watery diarrhoea specific case fatality rate reduced from 0.9% to 0.4% by 2015. Annual plan 2010/11 top indicators for CDD x Training and capacity building for service providers; 15 District workshops (one per district). x Policies, laws, guidelines and strategies; updating CDD guidelines. x Technical Support, monitoring and evaluation of service providers and facilities; CDD supervisory visits to all districts at least twice a year. x Coordination; inclusion of zinc and oral rehydration salts (ORS) on the essential medicines list. Main CDD achievements 2010/11 x Training and capacity building for service providers. - Workshops on diarrhoea prevention and treatment were conducted for facility based health workers in two districts (i.e. Mubende and Mityana). - A workshop on quality of care in diarrhoea case management was conducted for facility based health workers in Fort Portal (participants were from the districts of Bundibugyo, Kabarole, Kamwenge, Kasese, Kyegegwa and Kyenjojo) - Workshops on diarrhoea prevention and treatment were conducted for drug shop attendants in five districts (i.e. Jinja, Mukono, Masaka, Kyenjojo and Koboko). x Policies, laws, guidelines and strategies - Draft guidelines on management of diarrhoeal diseases were developed as a guide for health workers; and Guidelines on quality improvement in diarrhoea case management with emphasis on enhancing use of low Osmolar ORS & zinc supplementation were developed. x Technical Support, monitoring and evaluation of service providers and facilities: - Control of Diarrhoeal Diseases (CDD) technical support supervision visits were carried out in 54 out of the 112 districts. Other districts will be prioritised during FY 2011/2012 x Coordination; inclusion of zinc on the national essential medicines list. Low osmolar oral rehydration salts (ORS) and zinc are now on the National Essential Drugs List. They are stocked by the National Medical Stores and Joint Medical Stores and are available for health facilities to requisition and use in the management of diarrhoeal diseases in accordance with the national diarrhoea treatment policy and guidelines. 84 A n n u a l H e a l t h S e c t o r P e r f o r m a n c e R e p o r t 2 0 1 0 / 11 Main challenges 2010/11 x Inadequate knowledge and practices of health workers regarding the current diarrhoea treatment policy and guidelines x Inadequate funding for required supplies and operations x Inadequate access to safe water and low latrine coverage and use Recommendations for annual plan 2012/13 x Capacity building for facility based health workers and VHTs covering all districts. x Technical support supervision covering all districts x Funding for supplies and operations enough for the needs of all districts Most of the planned activities for control of diarrhoeal diseases were carried out. There is need to ensure integration of CDD activities with health promotion and environmental health divisions to sustain the gains. 3.3.1.4 School Health The School Health Programme aims at improving the health status of the school children, their families and teachers and to include appropriate health seeking behavior among this population. It is expected that the school health programme will improve the health of school children, reduce dropout rates and increase school performance. Lead programme indicators x The % of schools in Uganda providing basic health and nutrition services increased to 25 % by 2015. x The % of primary and secondary schools with safe water source within 0.5 km radius of the school increased from 61% and 75% resp. to 80% by 2015. x The % of schools with pupil per latrine stance ratio of 40:1 or better increased from 57% to 70% by 2015. Annual plan 2010/11 top indicators (implementation) x Trainers of Trainers workshops on school health component held in 30 districts x Hold a workshop to discuss Draft School Health Policy x Conduct School Health support supervision in 8 districts Main achievements 2010/11 x In order to revitalize and strengthen the organization and management of the school health program, a Medical Officer was assigned the responsibility to head the unit A n n u a l H e a l t h S e c t o r P e r f o r m a n c e R e p o r t 2 0 1 0 / 11 85 x x x TOT conducted on School Health component conducted in 6 districts in Lango sub region. (Aleptong, Otuke, Kole, Amolatar, Dokolo and Oyam districts) In conjunction with Ministry of Education and Sports (MOES), and with support from United Nations Fund for Population Activities (UNFPA) terms of reference for a consultant to review the draft school health policy and align with NDP, HSSIP and MOES were drafted, shared with MCH cluster and plans to recruit a consultant are underway. Conducted support supervision in 7 Districts of Kiryandongo, Nakasongola, Luwero Pallisa, Bugiri, Budaka & Mbale supervised Main challenges 2010/11 x Understaffing in the school health unit makes it difficult to roll out the program and coordinate implementation x Lack of standards for school health program to guide implementation by districts, development partners and schools x Inadequate reliable local health data on school health makes it difficult to design appropriate interventions. Recommendations for annual plan 2012/13 x Accelerate the recruitment of staff for the school health unit x District capacity for reporting, management and use of school health data for planning and implementation at should be strengthened. x Advocacy for school health programme needs to be stepped up to ensure leadership support and commitment mostly at district level. x Strengthen collaboration between the Ministry of Health and Ministry of Education. Capacity for implementation of the School Health Programme was strengthened through assignment of a Desk Officer. The development of the School Health Policy and guidelines should be expedited to ensure that all stakeholders are equipped with the guidelines and tools for programme implementation. There were dismal activities geared at expanding the school health and nutrition programme and expansion of the provision of clean water and improved sanitation to schools. 3.3.1.5 Epidemic Disaster Prevention, Preparedness and Response The MoH is mandated to play a central role in the control, coordination and management of disease outbreaks. The EDPPR unit is responsible for prevention, early detection and prompt response to health emergencies and other diseases of public health importance. 86 A n n u a l H e a l t h S e c t o r P e r f o r m a n c e R e p o r t 2 0 1 0 / 11 Lead programme indicators x x x x The proportion of suspected disease outbreaks responded to within 48 hours of notification increased from 52% to 80%. The proportion of districts with functional epidemic preparedness and response committees increased from 76% to 100%. The proportion of districts with epidemic preparedness plans increased to 100%. The timeliness and completeness of weekly and monthly surveillance reports maintained at greater than 80%. Annual plan 2010/11 top indicators (implementation) x All districts under surveillance x 30 districts oriented to prevent and control epidemics and other public health emergencies x Number of technical supervision visits conducted x Number of guidelines on prevention and control of epidemic and public health emergencies disseminated x Timeliness and completeness of weekly surveillance reports Main achievements 2010/11 x During the period, July 2010 to June 2011, the MoH supported LGs to timely and effectively respond to 100% of the 12 major outbreaks. Most commendable was the response to the Ebola epidemic. x Revised Standard Case Definition x Built Epidemic Preparedness and Response capacity in 30 districts x IDSR was carried out and the timeliness of weekly reporting is 82% and completeness is 86% Main challenges 2010/11 x Weak laboratory network x Inadequate human resource and lack of substantive district surveillance officers x Weak communication channels intra-district and district to centre Recommendations for annual plan 2012/13 x Merge surveillance and response for better coordination x Focus on gaps for IHR compliance by working with partners x Provide feedback on surveillance data to districts through print media x Set up a revolving fund for immediate access in case of a reported outbreak for prompt response and avoid spread of the disease During the period, the majority of the reported outbreaks were due to Yellow Fever 41.7% (5/12) displacing cholera which accounted for 50% (20/40) of the outbreaks reported in 2008/ 2009. Yellow Fever re-emerged after four (4) decades without cases being reported in the country. The other outbreaks reported during the period included: cholera 25% (3/12); Ebola A n n u a l H e a l t h S e c t o r P e r f o r m a n c e R e p o r t 2 0 1 0 / 11 87 8.3% (1/12); Polio 8.3% (1/12); Nodding disease 25% (3/12), rabies, hepatitis E virus, and protein energy malnutrition (See details in Annex 3.9) Of the 12 outbreaks reported during July 2010/ June 2011, 41.7% (5/12) of the outbreaks are currently ongoing and these include: (a) Rabies in Bundibugyo, (b) Nodding disease in Kitgum, Pader and Lamwo, and (c) Hepatitis E Virus in Kaabong. Yellow Fever Yellow Fever was the most frequent outbreak reported during July 2010/ June 2011. It accounted for 41.7% (5/12) of the outbreaks reported during the period. A total of 273 suspect Yellow Fever cases including 58 deaths (Case Fatality Rate 21.3%) were reported from 14 districts in Northern Uganda. A total of 13 cases were confirmed to have Yellow Fever from the five the districts of Abim, Agago, Pader, Kitgum and Lamwo. A vaccination campaign was conducted during the last week of January 2011 targeting all persons aged 6 months and above in the districts of Abim, Agago, Kitgum, Lamwo and Pader. The overall Yellow Fever immunization coverage in the five districts was 80%. A countrywide Yellow Fever risk assessment is underway to inform the Yellow Fever vaccination policy in Uganda. Yellow Fever case based laboratory backed surveillance is also being revitalized in the country. Polio This outbreak started on September 20, 2011 with a total of four (4) cases being confirmed from Bugiri district. Before the outbreak, Uganda had been polio free since May 20, 2009 and had been removed from the active polio outbreak list in December 2009. The cases originated from Nawansonga village in Kithodha Parish of Bulesa Sub County. Wild Polio Virus (WPV) Type 1 genetically linked (97.46%) to the WPV isolated in Turkana region, North West Kenya on 3rd February 2009 was isolated. Supplemental Immunization was implemented in 48 high risk districts in North East, East and Northern Uganda using Monovalent OPV (type1). In the long term, control of polio will rely heavily on improved routine coverage. Ebola During the period, suspect viral hemorrhagic fever cases were reported from 11 districts but only one district (Luwero) had an Ebola case confirmed on May 13, 2011. The outbreak started on May 1, 2011 with the index case being confirmed to have Ebola. A total of 25 contacts were identified, followed up and investigated but just one contact (the brother of the deceased) tested positive for Ebola Ig G. The outbreak was declared over on June 17, 2011. Cholera Though three (03) outbreaks were reported during the period only two (2) were confirmed to be cholera. Two small outbreaks of suspected cholera were reported from Hoima in June 2011 88 A n n u a l H e a l t h S e c t o r P e r f o r m a n c e R e p o r t 2 0 1 0 / 11 with 10 cases and no deaths; while the other outbreak was reported from Bundibugyo with 29 cases and 5 deaths. The outbreak in Nakapiripirit was relatively big with 217 case and 10 deaths (CFR 4.6%) CFR is 1% expected in well managed outbreaks. The outbreak spread from the neighboring district of Amudat with the initial cases being reported on October 18, 2011. The affected sub-counties included: Kakomongole, Nakapiripirit Town Council, Namalu, Lorege, and Lolachat. Latrine coverage was estimated at 3% and safe water coverage at 40-60% in the district. Protein Energy Malnutrition (PEM) The cases were reported from Namutumba district starting June 2011 among children less than five years. It was established the hailstones destroyed crops during March 2011 hence there was food scarcity in the district in the subsequent months forcing homes to feed children on alternate days on cassava bread and vegetables. A team from the MoH supported the district to set up therapeutic treatment centres where assessments and treatment is being undertaken. Head Nodding Disease This is an emerging epileptic disorder that causes atonic seizures of the neck and upper limb muscles following the sight of food. A survey undertaken during August 2010 by the MoH in 26 sub-counties in Kitgum, Pader, and Lamwo identified 1,876 cases. The etiology is still being investigated but a response plan has been developed to manage the associated conditions including: seizures, malnutrition, and onchocerciasis. Funds however need to be mobilized to implement the plan. Hepatitis E Virus The outbreak started on August 18, 2009. The initial cases were linked to the consumption of contaminated kwete (local brew) in Kaabong Town Council. Cases have been reported from Sidok, Karenga and Kaabong sub-counties. Latrine coverage is low (1%) and a factor in the spread of the disease. There was an upsurge in cases following the onset of rains in March 2011 that is currently being responded to by GoU and partners. However in the long term, control of the outbreak will require investments in improving access to safe water and sanitation facilities (latrines) in the district. Despite the unusually high incidence of epidemic, disease outbreaks and disasters in 2010/11, the response by health sector EDPPR teams was timely notably for the Ebola epidemic whereby only one case was confirmed. Other responses were mainly hampered by inadequate logistics and lack of epidemic preparedness plans and funds at all levels. The OPM should support strengthening of intersectoral coordination mechanisms within the country and inter-country level on management of epidemics. A n n u a l H e a l t h S e c t o r P e r f o r m a n c e R e p o r t 2 0 1 0 / 11 89 3.3.1.6 Occupational Health and Safety Programme Due to the current increased industrial, agricultural (especially horticulture) development in Uganda, threats from emerging and re-emerging diseases, there is need to scale up interventions in Occupational Health. There is a need to promote Occupational Health services and practices in workplaces with special emphasis on the high risk sectors. Lead Programme Indicators x Number of districts with functional Occupational health and safety committees. Main achievements x Occupational health and safety committees established and trained in 8 districts (Kamuli, Busia, Namutumba, Mityana, Oyam, Kabarole, Mubende and Amolatar). Occupational Health and Safety Programme in the sector is not well stipulated in the HSSIP 2010/11 2014/15 and not reflected in the MPS 2010/11. There is urgent need to strengthen the coordination mechanism, planning and implementation of Occupational Health and Safety in the MoH. 90 A n n u a l H e a l t h S e c t o r P e r f o r m a n c e R e p o r t 2 0 1 0 / 11 3.3.2 Cluster 2: Maternal and Child Health MCH cluster is composed of five elements; Sexual and Reproductive Health (SRH), Newborn care, Common childhood illnesses, Immunization and Nutrition. This emphasizes the link between maternal and child health and the cumulative nature of health problems through the entire lifecycle. 3.3.2.1 Sexual and Reproductive Health and Rights The aim of the sexual and reproductive health and rights element is to reduce mortality and morbidity relating to sexual and reproductive health, and rights. The right to sexual and reproductive health rights programme is important as it aims at reducing maternal mortality ratio, under five mortality, and total fertility rate, and improve sexual and reproductive health of the people which are all key elements for achieving the MDGs 4, 5 and 6. Core Indicators x Maternal Mortality Ratio (maternal deaths per 100,000 live birth) x % pregnant women attending 4 ANC sessions x % deliveries in health facilities x % pregnant women who have completed IPT2 x Contraceptive Prevalence Rate x Number of stillbirths Lead Programme Indicators x The proportion of health facilities with no stock-outs of essential RH medicines and health supplies increased from 35% to 70% by 2015. x The proportion of health facilities that are adolescent-friendly increased from 10% to 75% by 2015. x The % of health facilities with Basic and those with Comprehensive emergency obstetric care increased from 10% to 50% by 2015. x The proportion of pregnant women accessing comprehensive PMTCT package increased from 25% to 80%. x The unmet need for family planning reduced from 41% to 20% by 2015. x The rate of adolescent pregnancy reduced from 24% to 15% by 2015. Annual plan 2010/11 top indicators x Implementation of the road map for accelerating reduction of maternal and newborn mortality and morbidity in 40 districts x Number of health workers trained in EMOC, MPDR, MIP, ASRH, RH/HIV integration and focused ANC in 60 districts x Number of maternal and perinatal death audits conducted x Policies, laws, guidelines, plans and strategies developed and disseminated A n n u a l H e a l t h S e c t o r P e r f o r m a n c e R e p o r t 2 0 1 0 / 11 91 x x Number of technical supervision, monitoring and evaluation activities Number of coordination meetings held Main achievements x 12 monthly MCH Technical Working Group meetings were conducted. Examples of issues that were handled through this forum included Addendum for Community-Based provision of Injectable Contraceptives; creation of alternative distribution mechanisms for contraceptives to avoid piling up and expiry. Other coordination meetings held included 1 National Coordination meetings for Malaria in Pregnancy; 4 Quarterly National Maternal and Perinatal Death Review (MPDR) committee meetings, 4 Quarterly Reproductive Health Commodity Security (RHCS) meetings held. x Reviewed the Adolescent Health policy, the strategy, job aides and Adolescent Health training curriculum for peer and health workers. Developed the Adolescent-friendly service standards and the Step by Step guide for Health workers. Maternal nutrition guideline was finalized. x Reviewed the Life Saving Skills training manuals and EmONC management Care protocols x Printing and distribution of guidelines and tools o 1,000 Registers on Integrated ANC, Maternity and Postnatal Care were printed. o Printed 100 Maternal death notification booklets, 200 maternal death audit booklets, 200 perinatal death audit booklets and 50 Maternal and Perinatal Death Review (MPDR) guidelines that were distributed in 8 UNFPA focus districts. o Five hundred (500) copies of MPDR strategy were printed and distributed. o Twelve thousand (12, 000) mothers’ passports were also printed and distribution is ongoing. o 1,000 copies of VHT data collection tool, covering maternal health variables were printed. o 10,000 checklists for the WHO Medical Eligibility Criteria for family Planning(IUD, Implants, DMPA, Oral contraceptives) o 20,000family Planning cards o 20,000 FP brochures in 6 different languages( (English, Luo, Ateso, Karamojong, Lugbara and Luganda) o 2000 posters on responsible fatherhood o 200 copies of the Reproductive Health Choices for people living with HIV o x Public awareness building: Commemoration of Safe Motherhood day took place in Mityana District. x Training was carried out in various areas of Reproductive Health including; 30 health workers (on Adolescent Health in Masaka district), 30 HWs (on RH Logistics management in Tororo district), 18 HWs (on EmOC in Kamuli district), 30 HWs (on Malaria in pregnancy in Lira district), 180 HWs and 30 TOTs (on SGBV in the districts of Kiboga, Mpigi, Kotido, Moroto, Katakwi, Kaabong, Hoima, Kapchorwa, Serere, Kaberamaido, Soroti, Mubende, Kanungu, Abim, Oyam). Teams from 4 Regional Referral Hospitals provided hands-on skills 92 A n n u a l H e a l t h S e c t o r P e r f o r m a n c e R e p o r t 2 0 1 0 / 11 x x x x x x x building on goal oriented ANC, Post Abortal Care (PAC), EmONC, MPDR, Family Planning Long Term and Permanent Methods (LTPM), HIV/SRH Integration & SGBV, to 118 health care workers in 10 health facilities in 4 districts of Mubende, Oyam, Kanungu and Katakwi. Under the Fistula Care Project, Kitovu Mission hospital and Kagando Mission hospital conducted 294 fistula repairs, trained 4 surgeons on fistula repair surgery, trained 3 health care providers on Caesarean section, trained 679 health care workers on infection prevention, trained 89 health care providers on quality improvement. Technical support supervision on EmONC, HIV, PMTCT and FP was done in 21 districts. Twenty (20) districts were assessed and guided on implementation of the Roadmap (Kibaale, Hoima, Bulisa, Masindi, Kiryandongo, Nakasongaola,Luwero, Wakiso, Nakaseke, Kiboga, Jinja, Kamuli, Kaliro, Mayuge, Luuka Masaka, Rakai, Lyantonde, Sembabule and Lwengo). Confidential inquiries in MPDR were carried out in Arua, Mityana, Buhinga in Fort Portal and Apac hospitals. Family Planning Quality of Care Assessment was done in order to identify gaps and therefore guide prioritization. Family Planning service provision outreaches were carried out through partnerships with NGOs and professional Associations, and integration of service provision was also encouraged in the health facilities. More funding was mobilized for procurement of RH medicines, equipment and health supplies including contraceptives. Main challenges x Insufficient skills in-service on the use of RH medicines and equipment recently introduced in service delivery, e.g. MVA kits, Misoprostol, Magnesium sulphate, Emergency Contraceptives and the Newborn resuscitation equipment. x Insufficient suture materials in all hospitals leading to poor wound healing, gaping wounds and burst abdomen x Very low use of the Partogram to monitor labour progress at all levels of care leading to late response and poor outcomes even for mothers who are coming early to health facilities x Failure of the HC IVs and many General hospitals in participating in Emergency Obstetrical Care instead of continuously referring obstetrical emergencies to the Regional referral Hospitals, thereby over-loading them and increasing the delay for women in labour in reaching health facilities for Emergency Obstetrical Care. This has partially contributed to some of the maternal deaths owing to the “third delay”. x Insufficient numbers of doctors, midwives and anaesthetists to cover EmOC at HC IV, General Hospitals and Regional Referral Hospitals. x Piling up of RH supplies including contraceptives and Emergency contraceptives at NMS and in some health facilities. x No clear source of equipment for long term and permanent methods of Family planning A n n u a l H e a l t h S e c t o r P e r f o r m a n c e R e p o r t 2 0 1 0 / 11 93 ec x x x x x en a i ns ann al lan Should sensitize Members of Parliament of the need for in-service Continued Medical Education, and Continued Professional Development. There is a need to step up in-service capacity building efforts, including hands-on skills building and technical supervision. There is a need to engage the health training institutions so that they update their tutors in the key RH skills that are being addressed in the in-service training to ensure sustainability Should support the recruitment of core staff for RH, namely, doctors, midwives and anaesthetists to cover EmOC at HC IV, GHs and RRHs. Should strengthen the Public Private Partnerships in improving RH supplies distribution and improving the utilization of services in the health facilities especially provision of the Long Term and Permanent (LTPM) methods of FP. Most of the planned activities at programme level were implemented as planned and output demonstrated by increase in CYP (from 582,804 in 2009/10 to 787,390 in 2010/11), CPR and deliveries in health facilities together with improvement of the Public Private Partnerships. Whereas there is a remarkable increase in the number of deliveries in health facilities, there is a reduction in the proportion of pregnant women attending 4 ANC sessions and the proportion of pregnant women who have completed IPT2 is static at 47%. There is need for continued sensitization on goal oriented ANC and promotion of early ANC attendance. Stock out levels of essential RH medicines and health supplies as evidenced by the 47% stock out levels of EMHS could be contributing to the low IPT2 coverage. As seen from the Figure 14, number of stillbirths in health facilities is high and is a reflection of obstetrical complications during pregnancy and childbirth. Therefore, ANC and skilled care at birth especially EmOC, need to be strengthened; Perinatal Death auditing should also be carried out in order to identify the risk factors so that they are addressed to reduce stillbirths. ig e e e n 1,800 1,600 1,400 1,200 1,000 800 600 400 200 - e ill i hs nh 2009/2010 2010/2011 Source: MoH HMIS 94 A n n u a l H e a l t h S e c t o r P e r f o r m a n c e R e p o r t 2 0 1 0 / 11 3.3.2.2 Human Rights and Gender Mainstreaming This element of the MCH cluster aims at preventing morbidity and mortality linked to human rights violations and gender inequalities. ea ga x x x x e n ica s An integrated strategy to address SGBV in the health sector developed and disseminated. Health service provision for survivors of rape scaled up in all district hospitals and 0 of HC IIIs. PEP Kits available in all district hospitals and 0 of HC IIIs. Health workers trained in clinical management of survivors of rape increased to 2 by 201 . nn al lan in ica s The Human Rights and Gender Team did not have an action plan for 2010/2011 as it was only established in early 2011. Main chie e en s x An officer from MoH was assigned responsibility of Gender Desk Officer x Developed an action plan for mainstreaming Human rights and gender x Held stakeholders meeting to harmonise activities x Developed trainers manual for mainstreaming human rights and gender concerns in health programmes x Several trainings were undertaken on SGBV. x MoH has attended several intersectoral meetings with stakeholders from Ministries of Gender, Internal Affairs and Justice to streamline issues related to the filling in of the police form 3 in case of rape with major positive achievements in that the clinical officers and the midwives will now be recognised as eligible health workers to fill the form and can testify in court. The Police Form has now been separated into PFA for General assault and PF3B for Victims of se ual violence. Pictograms have been introduced and mandatory testing of HIV for offenders of se ual violence ec x x x en a i ns ann al lan For the Human Rights and Gender Team to continue the work of cross sectoral cooperation Capacity building and technical assistance with the aim of promoting and protecting human rights within the health sector. To include structural indicators in upcoming health sector assessments. A n n u a l H e a l t h S e c t o r P e r f o r m a n c e R e p o r t 2 0 1 0 / 11 95 The MoH has made deliberate efforts to streamline health and gender by establishing a Gender Desk and assigned officers (from the Planning Division and Reproductive Health Division). Implementation of some activities has commenced. Further implementation of the action plan will continue in FY 2011/12. 3.3.2.3 Newborn and Integrated Child Survival The newborn and integrated child survival elements of the MCH cluster aim at improving newborn and child health and survival by increasing coverage of high impact evidence based interventions, in order to accelerate the attainment of MDG 4 and scale-up and sustain high, effective coverage of a priority package of cost-effective child survival interventions in order to reduce under five mortality. e x x x x x x in ica s Neonatal Mortality rate (per 1000 live births) Infant Mortality Rate (per 1000 live births) Under mortality rate (per 1000 live births) U children with height /age below lower line (stunting) (m/f) U children with weight /age below lower line (wasting) (m/f) U s with malaria treated correctly within 24 hrs increased from 26 to 60 ea ga e in ica s x The proportion of neonates seen in health facilities with septicaemia/pneumonia disease reduced by 30 x Proportion of mothers of newborns 1-2 weeks practising clean cord and skin care, keeping babies warm, e clusively breast feeding and recognize danger signs, increased by at least 30 from baseline figures x U pneumonia managed with correct antibiotic increased from 17 to 0 x Inde of U s managed in an integrated manner at the facility using IMNCI increased from 30 - 60 x Health workers who are competent in newborn resuscitation upon completing of training nn al lan in ica s x Roll out child survival strategy in 40 districts x Number of health workers trained in micro-planning in Child Days in 32 new districts x Number of district trainers trained on child survival interventions in 40 districts x Number of guidelines in Child Survival Interventions reviewed and printed 96 A n n u a l H e a l t h S e c t o r P e r f o r m a n c e R e p o r t 2 0 1 0 / 11 Main achie e en s x x x x x x x x Child Survival (CS) Strategy was revised and aligned with the HSSIP 2010/11 2014/1 and 200 copies printed. Two national level trainings of Mid-Level Managers on managing child health programs were conducted All districts implemented two rounds of Child Health Days but with varying degrees of performance. Received a donation of de-worming drugs from CWW, World Vision and World Food Programme and Vitamin A from UNICEF. Performance in Child Health Days however deteriorated and actions to strengthen CDP were initiated Developed a standard operations manual for implementing Child Days Plus activities, including revision of the supervision and monitoring tools and targeted technical support was provided to poorly performing districts in form of planning and supervision from the national level An integrated in-service training package “Helping Babies Breathe (HBB) guidelines incorporating newborn resuscitation, e amination of normal newborn care, preterm and sick newborn care were adopted and adapted for Uganda and the first national training for 14 trainers conducted in Masaka. The national multi-disciplinary advisory committee continued to advocate for and coordinate different efforts to improve newborn health including introduction of standards based facility assessment/audit in 8 districts, review and dissemination of newborn/perinatal death audit tools in 32 districts to strengthen the reduction of avoidable deaths at the facility Post-natal home visits by VHT during the first week were introduced in 23 districts through VHT iCCM trainings supported by UNICEF, Malaria consortium and International Rescue Committee etc. Agreement was reached to ensure IMCI standards implemented at facility before introducing iCCM at VHT level. According to the supervision report of the last quarter, districts are beginning to revitalize IMCI. Plans have been initiated to review the pilot of a shorter abridged course for IMCI. The referral/hospital package of IMCI was reviewed based on new evidence from WHO and the pocket book for health-workers is under revision. A training on Emergency Triage and Treatment was conducted in collaboration with the department of paediatrics to improve severe illness case management Main challenges x Challenges for CDP implementation have been mostly in the area of logistics management, monitoring performance and coverage, district ownership of the program, coordination of key players and inadequate long term planning plus political support. x Partners support most activities for newborn health and newborn activities are not well integrated in district plans and other quality improvement activities. In addition whereas audit has been adopted as a key strategy to build capacity and inculcate a culture of continuous quality improvement, peri-natal death audit activities are not implemented widely only 1 districts have initiated this and national death review teams are not A n n u a l H e a l t h S e c t o r P e r f o r m a n c e R e p o r t 2 0 1 0 / 11 97 functional, and even then there are very few national/ regional mentors and supervisors to support districts. Most health facilities still lack needed basic equipment, supplies and skills for newborn health care especially equipment for new borne resuscitation and emergency care. High turnover of staff affects the attainment of a critical mass of trained staff. Irregular technical supervision and monitoring activities affecting institutionalization of IMCI and continued improvement of management of common childhood conditions. Shortages or irregular supply of drugs especially 1st line anti-malarial, de-worming drugs and antibiotics for pneumonia. Implementation of iCCM is highly dependent on e istence of VHT in villages many districts are yet to roll out the VHT strategy. Data on performance of iCCM in early use districts are still limited and affect planning and improvement of implementation. x x x x x ec x x x x en a i ns ann al lan E pand the pool of national and regional newborn clinical audit teams consisting of hospital clinical specialists, district health teams, financial administrators and NGOs to champion and support lower level health facilities and communities in the catchment area to assess newborn health service standard, introduce and maintain quality improvement approaches in these units including regular perinatal death audits and reviews.. Mobilize e isting resources, including a number of hidden resources (local organizations, traditional structures, groups) to integrate or build on newborn activities. Review the IMCI implementation framework to reflect new development and build district management capacity for child health programming in general and implementing IMCI in particular. Districts planning to implement iCCM should also plan to train health facility staff to manage referred patients and supervise VHTs. There is a 10% reduction in the number of children seen in health facilities with pneumonia and 30% reduction in the number of children seen with septicaemia. Diagnosis Pneumonia Perinatal conditions (in New borns 0 to 28 days) 2008/09 No. of cases % No. of cases 887,917 2009/10 % No. of cases 2010/11 % 3% 912,263 2% 819,180 2% 12,125 0.04% 16,102 0.04% 11,707 0.03% There is need to scale up peri-natal death audits, provide the necessary equipment and adequate medical supplies. Staff attrition and low staffing levels also affect service delivery. These gaps are likely to be contributing to the slow progress in improvement of the programme indicators. 98 A n n u a l H e a l t h S e c t o r P e r f o r m a n c e R e p o r t 2 0 1 0 / 11 3.3.2.4 Expanded Programme for Immunisation The mission of UNEPI is to contribute to the reduction of morbidity and mortality due to childhood diseases to levels where they are no longer of public health importance. The programme objective therefore is to ensure that all children are fully immunized against the vaccine preventable diseases before their first birthday and all babies are born protected against neonatal tetanus. e x x in ica children under one year immunized with 3rd dose Pentavalent vaccine (m/f) (90 ) one year old children immunized against measles (m/f) (8 ) ea ga e in ica s x Neonatal tetanus rates reduced and maintained at zero x DPT-3/Pentavalent coverage for under 1 s increased from 74 - 80 in 2010/11 x Measles vaccination coverage by 12 months increased from 7 to 8 in 2010/11 nn al lan in ica s x Delivery of vaccines, injection materials and other immunization supplies x EPI cold chain supervision in all districts x Technical support supervision to districts x Health workers trained on post certification interventions Main achie e en s x Received 1,422 fridges (287 solar fridges and 1,13 Electric and /or gas refrigerators), 1 refrigerated truck and 1 open caged truck with support from JICA for rehabilitation of the cold chain systems and support vaccine delivery to districts. The fridges have been distributed to the districts and used for setting District Vaccine Stores for new districts. x Capacity building Refresher training of 726 Operational Level (OPL) Health Workers in 26 districts, 181 Mid Level Managers (MLM) from 34 districts, 30 Cold Chain Assistants for new districts and tutors from 27 medical training institutions x Maintained certification level surveillance for polio eradication and measles control. x Application to GAVI for support to introduce Pneumococcal Vaccine into the routine immunization programme was approved. x Interrupted transmission of the wild polio virus in eastern Uganda by implementing 4 rounds of house-to house polio campaigns in 48 high risk districts with coverage above 9 in all rounds. In the 48 districts where House - to - House SIAs were done, emphasis was A n n u a l H e a l t h S e c t o r P e r f o r m a n c e R e p o r t 2 0 1 0 / 11 99 made on need to improve routine immunization and districts prompted to do specific district assessment and come up with innovative ways to improve routine immunization. Due to the polio response activities carried out supervision in the 3rd and 4th quarters of the F to 26 poorly performing districts instead of all districts. Improvement in the supply of vaccines, injection materials from the centre to the districts Support supervision towards improving routine immunization (RED STRATEG ). The regional IDSR support supervisors provide regular on job support supervision to the districts Monthly feedback is given to districts indicating performance of all the 112 districts, which stimulates districts to work towards better performance There has been regular support to districts through national and international Stop Transmission of Polio (STOP) teams that contribute to enhancement and and strengthening of surveillance activities The UNEPI with support from WHO supports districts to conduct continuous active search for polio and measles x x x x x x Main challenges x Inadequate and irregular release of funds particularly PHC funds that has resulted in irregularity of outreaches in almost all districts causing dropouts, irregular supply of logistics to health facilities and lack of support supervision. x Inadequate transport at district level for delivery of supplies to the lower levels, for going to outreaches and carrying out support supervision. x The threat of importation of the wild poliovirus from neighbouring countries where it is still circulating. x Advocacy/communication/mobilization activities primarily promote immunization by periodic events, such as CHDs and NIDS, not use of routine health services ec x x x en a i ns ann al lan Advocacy for increased funding for national, districts and health facilities to facilitate better implementation of immunization activities at these levels. The threat for wild polio virus importation from neighbouring countries still e ists (section on EDPPR suggests the threat is real) and there is need to strengthen routine immunization and surveillance activities at all levels. Mass polio vaccination may have to be carried out in districts that are high risk whenever recommended. Introduce new vaccines that will reduce infant morbidity and mortality from targeted diseases. The EPI programme was strengthened through acquisition of cold chain equipment including 2 trucks. District Vaccine Stores were set up in the districts, refresher training of OPL health workers and technical support supervision conducted at all levels. Intensified capacity remarkable improvement in coverage for Pentavalent 3rd dose coverage from 76% in 2009/10 100 A n n u a l H e a l t h S e c t o r P e r f o r m a n c e R e p o r t 2 0 1 0 / 11 to 90% in 2010, above the 80% HSSIP target for the year under review. Under one year old immunization coverage for measles improved slightly from 72% to 85%, achieving the 85% HSSIP target for the year. A total of 1,628 Measles cases were investigated and 326 were confirmed in FY 2010/2011. During 2011 UNICEF has given some additional funding to 26 districts to reduce large numbers of un-immunized children. The additional funds were given for 2 quarters ranging from 15 - 20 million per quarter. Some districts like Mukono, Maracha, Mayuge, Kamuli, Buvuma - has shown remarkable improvement. A total of 125 suspected cases of neonatal tetanus were reported (HMIS 2010/11) and of these 101 were confirmed. There is need for increased for increased community mobilization to utilize the available services and strengthening capacity of districts to conduct supervision and diseases surveillance. 3.3.2.5 Nutrition Implementation of nutrition interventions to scale up delivery of nutrition services involves the MoH and other stakeholders. Core HSSIP indicator x % U5 children with height /age below lower line (stunting) (m/f) x % U5 children with weight /age below lower line (wasting) (m/f) Lead programme indicators x Maternal Infant and Young Child Feeding practices improved (Exclusive breastfeeding, Timely introduction of complementary feeds) x Accessibility to appropriate and gender sensitive nutrition information and knowledge increased x Vitamin A Supplementation coverage among children 6 - 59 months x Households consuming fortified foods(Salt, cooking oil, wheat flour) increased x Nutrition services to health units and the community scaled up Annual plan 2010/11 top indicators x Baby Friendly Initiative Assessment (BFHI) conducted in 4 districts x Develop service standards for what is expected in nutrition at all levels on health care including VHT. x Integrate and harmonise strategies and guidelines on micronutrients x Design nutrition interventions using data for advocacy purposes A n n u a l H e a l t h S e c t o r P e r f o r m a n c e R e p o r t 2 0 1 0 / 11 101 Main achievements x Health facilities supported to support, protect and promote breastfeeding through the Baby Friendly Health Facility Initiative (BFHI) with support from partners (IBFAN) x A nutrition training package for VHTs developed; Community Nutrition strategy concept developed; Population nutrition handbook finalized; Maternal Nutrition and the Integrated Management of Acute Malnutrition (IMAN) guidelines finalised; Consensus on the development of an integrated micronutrient strategy and policy framework developed and Concept and draft 0 developed. x Support supervision for the implementation of Bi-annual supervision of Child days plus done x Training of health care providers in positive deviance hearth (best practices) with support from World Vision and Strides for Family Health x Training of health care providers in Emergency Nutrition Assessment for Standard Methodologies for Relief and Transition (ENA for SMART) Main challenges x Lack of adequate funds for support supervision funding, government funds not enough to support BFHI scaling- up. x Blockage of financial support by UNICEF limited implementation (Child Days Plus, Launching of IMAM guidelines, Nutrition Information systems) x Not able to incorporate improved methods of assessing micronutrient bio-markers in UDHS5 Recommendations for annual plan 2012/13 x Improving Maternal Infant and Young Child Feeding Practices (Exclusive breastfeeding at 6 months increased from 60% to 80%., Timely complementary feeding increased from 73% to 80%) x Scaling up the implementation of child days Plus nutrition related activities x Improving consumption and access to micronutrient fortified foods The nutrition program implemented planned activities which were mainly geared at strengthening the national program policy and strategies and capacity building at district level. Information on the impact of these interventions will be availed by the UDHS – 5 conducted in 2011. 102 A n n u a l H e a l t h S e c t o r P e r f o r m a n c e R e p o r t 2 0 1 0 / 11 Figure 13: Vitamin A Supplementation among under fives There was a decrease in the number of children 6 – 59 months receiving 1st and 2nd doses of Vitamin A supplementation from 1,415,155 first dose and 1,238,683 in 2009/10 to 1,370,353 1st dose and 1,064,899 second dose in 2010/11 FY. 1,600,000 1,400,000 1,200,000 1,000,000 800,000 600,000 400,000 200,000 0 1st Dose 2nd Dose The number of reported cases of malnutrition among the under five OPD new attendances is at 0.24% of all OPD diagnoses and the proportion has remained constant over the last 3 years. 2008/09 2009/10 2010/11 No. of % cases Diagnosis No. of cases No. of % cases Severe Malnutrition (Marasmus, Kwashiorkor, Marasmic-kwash) 37,878 0.12% 43,927 0.12% 41,840 0.12% Low Weight For Age 38,326 0.12% 44,350 0.12% 40,994 0.12% 76,204 0.24% 88,277 0.24% 82,834 0.24% Total Source: MoH HMIS % Malnutrition is still a major problem in Uganda. During the year under review an upsurge of malnutrition cases was reported in Namutumba district. Presently the biggest gap is to empower and support mothers to improve child feeding, hygiene and care seeking. The ministry should review the adequacy and reach of child feeding messages, capacity of providers in counselling mothers to improve community IMCI family care practices and design approached to mitigate this situation. A n n u a l H e a l t h S e c t o r P e r f o r m a n c e R e p o r t 2 0 1 0 / 11 103 3.3.3 Prevention and Control of Communicable Diseases The priority health care interventions in the cluster of prevention and control of communicable diseases include; prevention and control of STI/HIV/AIDS; prevention and control of malaria; prevention and control of tuberculosis and elimination and or eradication of some particular diseases such as Leprosy, guinea worm, onchocerciasis, trachoma, lymphatic filariasis, trypanosomiasis, soil transmitted helminthes and schistosomiasis. The overall objective for the communicable cluster is to reduce the prevalence and incidence of communicable diseases by at least 50% and thus contribute towards achieving the health related MDGs. 3.3.3.1 Prevention and Control of STI/HIV/AIDS The aim of the STI/HIV/AIDS component of the HSSIP 2010/11 – 2014/15 is to prevent STI/HIV/TB transmission and mitigate the medical and personal effects of the epidemic. Core HSSIP indicators x % of children exposed to HIV from their mothers access HIV testing within 12 months increased from 29% to 75% (m/f) x % eligible persons receiving ARV therapy (m/f) Lead programme indicators x The proportion of people who know their HIV status increased from 38% to 70%. x The proportion of people who are on ARVs increased from 53% in 2009 to 75% by 2015 among adults and from 10% to 50% in children less that 15 years of age. x HCT services available in all health facilities including HC IIs, and at community level (Proportion of health facilities with HCT services; Proportion of community structures with HCT services) x PMTCT services available in all health facilities up to HC III’s and 20% of HC IIs (Proportion of health facilities with PMTCT services; Proportion of HC IIs with PMTCT services). x ART services available in all health facilities up to HC IV and 20% of HC III by 2015. (Proportion of health facilities with ART services; Proportion of HC IIs with ART services). x Reduce the HIV prevalence from 6.7% to 5.5% in the general adult population (15 - 49 years). Annual plan 2010/11 top indicators x Increase ART accredited facilities from 340 to 400 x Initiate 48,000 people on ART x Initiate PMTCT services in 30% of HC IIs x Review and launch Safe Medical Circumcision (SMC), HCT, PMTCT policies and start circumcision for about 1 million young people aged 15 – 35 yrs 104 A n n u a l H e a l t h S e c t o r P e r f o r m a n c e R e p o r t 2 0 1 0 / 11 Main achievements 2010/11 x Health Sector HIV strategic Plan launched x AIDS Indicator Survey (AIS) conducted and near completion x 68,000 HIV patients initiated on ART, ~ 10,000 children & ART sites increased by 100 x MTCT of HIV reduced to 5% from 7% in over 1,200 health facilities; New state of the art EID lab established at CPHL and > 15,000 exposed babies accessed EID services x Over 5 million accessed HIV counselling and Testing Main challenges 2010/11 x Low human resources for health both in quality and quantity and weak leadership at district level x Inadequate resources and weak community health systems x Poor data management Recommendations for annual plan 2012/13 x Train in Leadership for health services especially DHOs x Change re-training of existing HRH to mentoring x Scale up all HIV prevention services despite challenges A new HIV/AIDS strategic plan was launched and the AIDS indicator survey is near completion. This will provide information on the current HIV/AIDS situation in the community. Over the years, significant gains were made in the control of HIV/AIDS and in the mid 2000s there was a reversal of trends from 6% antenatal HIV prevalence in 2005 to 9.7% in 2006. However, of recent, antenatal clinic prevalence from sentinel sites have indicated a decreasing trend from 9.7% in 2006 to 7% in 2009. (The HIV/AIDS Epidemiological Surveillance Report 2010). 3.3.3.2 Tuberculosis Tuberculosis remains a major public health problem in Uganda. This is compounded by the emerging multi drug resistant Tuberculosis (MDR TB) problem. The high prevalence of HIV (6.4% in the general population and over 50% among TB patients) is contributory to fuelling the epidemic and TB still remains a leading cause of mortality amongst people living with HIV/AIDS. The aim of the TB program is to reduce the morbidity, mortality and transmission of tuberculosis. A n n u a l H e a l t h S e c t o r P e r f o r m a n c e R e p o r t 2 0 1 0 / 11 105 Core HSSIP indicators x % new smear positive cases notified compared to expected - target 60% in 2010/11 and 70% by 2015 Lead programme indicators x Case Detection Rate (CDR) % - target 60% in 2010/11 and 70% by 2014/15 x Treatment Success Rate (TSR) % - target 75% in 2010/11 and 85% by 2014/15 x Cure Rate in % x % TB patients tested for HIV – target 80% in 2010/11 and 100% by 2014/15 x % HIV + TB patients started on CPT – target 90% in 2010/11 and 100% in 2014/15 Annual plan 2010/11 top indicators (implementation) x Programmatic Management of Drug Resistant TB (PMDT) initiated; in line with this: o PMDT guidelines and tools developed, printed and disseminated o 52 HWs (4/regional hospital) trained on MDRTB management (see bullet 3 for SLDs) o Routine surveillance of drug resistant TB strengthened: 61 HWs trained on TB Sputum Specimen o Referral System (TSRS); samples from high risk TB patients routinely referred to NTRL for drug susceptibility testing for routinely identifying drug resistant TB o MDR – TB Ward modelled and renovated x Standard NTLP R&R tools printed and distributed to districts x Anti TB Drugs procured: for drug susceptible TB (first line drugs) with donor (GF) funds and for drug resistant TB (second line drugs) with government and donor (GF) funds x Anti-TB drugs and reagents distributed to TB zones and from TB zones to districts once every 2 months x Coordination and planning o Quarterly program management, planning and review meetings held at national and zonal levels. Zonal meetings in 3 zones (North West, Eastern and Kampala) supported with government funds and the rest of zones with donor (GF, GLRA, WHO and USAID) funds o Quarterly National TB/HIV Coordination meetings held o Annual program review and planning meetings held x Technical Support supervision: o Supportive supervisions carried out from National to each Zone once every six months o Quarterly supportive supervision from Zonal level held to 25% of the districts in the zone per quarter o DTLS and SCHWs supported to hold monthly SS (planned under donors mainly GF funding) x National TB Reference Laboratory renovated and refurbished with CDC support x 106 National Commemoration of World TB and Leprosy Days held A n n u a l H e a l t h S e c t o r P e r f o r m a n c e R e p o r t 2 0 1 0 / 11 Main achievements 2010/11 x Programmatic Management of Multi-Drug Resistant TB (PMDT) - PMDT guidelines were developed and printed - 24 out of 52 HWs were trained on MDRTB management - 56 HWs were trained on TSRS and 1,623 out of expected 2,764 samples referred for routine drug susceptibility (MDRTB) testing. Of these, 93 were identified to have MDRTB in addition to those already on the national MDR-TB register x Procured 25,463 blisters of first line anti-TB drugs; and distributed to districts through zones every 2 months as planned x Coordination and planning meetings held o Held 3 out of 4 planned quarterly program planning & review meetings at national level; however zonal level meetings held ranged from 50% in some zones to 100% in others o Held 75% of the quarterly x Performance in Technical Support Supervision: - 50% (i.e. one round) of planned Central level support supervision was held to each zone - Monthly District SS by DTLS conducted x NTRL was renovated and refurbished with support from Centers for Disease Control (CDC) and is now executing all its role In respect of the lead program indicators, the following achievements were realised in the year: x 81% of the TB patients were tested for HIV compared to 72% the previous year, x 90% of the HIV positive TB patients were on Co-trimoxazole Prophylaxis (CPT) compared to 81 % the previous year x However, there was under performance in CDR, TSR and ART coverage with CDR declining from 57% to 54%, TSR from 70% to 67% while ART coverage stagnated at around a quarter (24%) Main challenges 2010/11 x x Lack of funds for procurement of Second Line Drugs (SLDs) has constrained the initiation of PMDT in the country. Other preparatory steps such as an MDRTB Focal Person, a Green Light Committee approval to procure SLDs, HWs training on MDRTB, admission facilities etc are already in place. Moreover, a backlog of 172 MDRTB patients is on the national register awaiting SLDs! Underperformance in key program indicators: decline in case detection and treatment success rates to 53.9% and 67.3% respectively due to a number of factors including: uncertainty on the actual magnitude of TB problem in the country, unfavourable treatment outcomes as a result of deaths, poor recording and reporting leading to unknown outcomes and high defaulter rates in some districts A n n u a l H e a l t h S e c t o r P e r f o r m a n c e R e p o r t 2 0 1 0 / 11 107 x x Inadequate GoU funding plus heavy reliance on Donor support and the complexities including irregular flows associated with some of the donor funds such as GF resulted in limited technical support supervision. This support is necessary to guide peripheral health workers to implement quality TB/HIV care. Lack of a dedicated GoU budget line for anti-TB especially second line drugs Recommendations for annual plan 2012/13 x Government (MOH/MOFPED) should establish a dedicated budget line for TB drugs and procure SLDs in order to enable the NTLP enrol the backlog of MDRTB patients on treatment. This would minimise amplification of MDRTB and decrease mortality among MDRTB cases as well as decrease spread of drug resistant TB within the communities x Government (MOH/MOFPED) should set aside a complementary budget line to facilitate the conduct of a population based national TB Disease prevalence survey aimed at establishing the magnitude of TB disease and to act as a baseline for monitoring progress towards MDG targets x GoU should provide adequate and regular funding to enable NTLP and District Health Teams to intensify support supervision, to mentor Health Workers with a view to improving the quality of TB/HIV services including the R&R provided. The NTBLP focused on the emerging problem of MDT, developed the PMDT guidelines and established structures for management of MDT, however a backlog of 178 MDRTB registered patients await SLDs to be enrolled on treatment. Coordination and supervision activities were not fully implemented at all levels due to inadequate funding. In respect of the NTLP lead program indicators, there was increase in TSR from 67% to 70%, the number of TB patients tested for HIV from 72% in 2009/10 to 81% in 2010/11; and 90% of the HIV positive TB patients were on Cotrimoxazole Prophylaxis (CPT) compared to 81% the previous year. However, the performance on CDR and ARTs was not as impressive: CDR declined from 56% to 54%, while ART coverage stagnated at around a quarter (24%). Some of the factors for the apparent decline in CDR could be: uncertainty on the true magnitude of TB burden in the country (estimated cases are only but an estimate hence the need to carry out a TB Disease Prevalence Survey to establish the exact magnitude); an altered picture with a tendency for HIV positive TB cases to be smear negative rather than smear positive (the proportion of EP also tends to increase in high HIV prevalence and high TB and HIV coinfection settings like Uganda); repeated stock outs and/or NMS supplying poor quality laboratory reagents reported by some districts also negatively impacts on CDR. Low cure rate (40%) could be due to unfavourable treatment outcomes as a result of deaths, poor recording and reporting leading to unknown outcomes and high defaulter rates in high TB burden Urban setting – Kampala, Masaka, Mbarara and Jinja. 108 A n n u a l H e a l t h S e c t o r P e r f o r m a n c e R e p o r t 2 0 1 0 / 11 3.3.3.3 Malaria Malaria contributes to a significant cause of morbidity and mortality in Uganda especially in the under fives and pregnant women. The aim of the National Malaria Control Program (NMCP) is to reduce the morbidity and mortality rate due to malaria in all age groups. The mainstay of intervention strategies are; prompt case management using artemisinin combination therapy (ACT), Long Lasting Insecticide Treated Mosquito Nets (LLINs), Indoor Residual Spraying (IRS) using efficacious insecticides and IPT in pregnant women. Epidemic preparedness and response IEC/BCC and monitoring and evaluation and research and health systems strengthening are part and parcel of the strategy. Core Indicators x The proportion of pregnant women who have completed IPT2 uptake increased from 47% to 50% by June 2011. x The proportion of under-fives with fever who receive malaria treatment within 24 hours from a VHT increased from 13.7% to 20% by June 2011. Programme Indicators 2010/11 FY x Reduce the prevalence of malaria among under fives x Proportion of households with at least one ITN increased x Proportion of households sprayed with insecticide in the last 12 months increased x The case fatality rate among malaria in-patients under five reduced x The percentage of public and PNFP health facilities without any stock outs of first line antimalarial medicines increased x Malaria studies conducted Main achievements x A total of 7,289,921 LLINs were distributed to beneficiaries x The proportion of registered U5 who received GFATM LLINs was 92% (6,302,890 LLINS out of 6,913,872); 91% (825,449 out of 909,607 registered PWA received LLINs; and 161,582 out of 176,517 village officials involved in the registration and distribution exercises countrywide x A total of 869,861 out of 899,716 (or 96.7%) houses in the 10 districts of Amuru, Nwoya, Gulu, Oyam, Kole, Apac, Lamwo, Kitgum, Agago and Pader were sprayed during the year under review. In addition to houses sprayed in the previous FY a total of 2,673,427 out of 2,756,339 (97.0%) were protected with IRS during the period under review. A n n u a l H e a l t h S e c t o r P e r f o r m a n c e R e p o r t 2 0 1 0 / 11 109 x x x x x 20 million ACT treatments provided through GoU, PMI, DFID and Global Fund leading to reduction in ACT stock outs from over 50% to 20% 21 districts trained and effectively using RDTs for malaria diagnosis. 2.4million RDT tests provided under Global Fund and PMI Last FY year the NMCP held 50% (2 out of 4) of the planned RBM partnership coordination meetings Malaria program review conducted A draft Larviciding protocol, work plan and the budget for the four Larvicides (Aquatain AMF, Bti, SAFE and Abate) submitted to NDA and other regulatory bodies, for approval Main Challenges x Lack of ACTs for rolling out HBMF to the community level x Delayed disbursements by GF led to serious consequences at all levels of the distribution system. x Insecticide resistance to Pyrethroids coupled with some communities and environmentalists’ resisting use of DDT left the program with a more expensive chemical, Bendiocarp, which could not be sprayed to all the 53 targeted districts due to budgetary constraints. Recommendations for annual plan 2012/13 x The NMCP should ensure that macro-planning is strengthened through earlier engagement of stakeholders and preparation of relevant plans and materials way ahead of anticipated net arrival. x MoH should set clear timelines for tracking LLIN movement from the manufacturers to central warehouses to facilitate timely communication to NDA and UNBS. x Because of the increasing and spreading resistance of malaria vectors to pyrethroids, IRS using non-pyrethroid insecticides should be fully supported if the effectiveness of LLINs is to be maintained because all nets are currently being treated with pyrethroids. x GoU should increase funding for IRS in order to drastically reduce malaria transmission in the country and maintaining the low transmission rates using LLINs. x All funds for IRS should be released at ago to enable IRS to be implemented, not piecemeal on a quarterly basis as the case is now! There was progress in implementation of the mainstay interventions for control and prevention of malaria during the year under review through increased access to ACTs, distribution of LITNs, and IRS. IEC/BCC activities were not emphasized in the planned activities and not reported if carried out. A malaria program review was carried out and this will provide information for strategic program planning. There was a decline in the proportion of women who completed two doses of IPT from 47% in 2009/10 to 43% in 2010/11. It was not possible to establish the proportion of under fives with 110 A n n u a l H e a l t h S e c t o r P e r f o r m a n c e R e p o r t 2 0 1 0 / 11 fever who receive malaria treatment within 24 hours from VHT because of lack of a reporting mechanism. The use of IRS, distribution of ITNs and availability of antimalarials are expected to reduce the prevalence of malaria among under fives and case fatality among malaria in patients. 3.3.4 Diseases Targeted for Elimination The diseases targeted for elimination and/or eradication include: poliomyelitis, guinea worm, onchocerciasis, measles, leprosy, trachoma lymphatic filariasis, trypanosomiasis and schistosomiasis. The overall objective for this cluster is to achieve national and global targets for elimination or eradication of targeted diseases. 3.3.4.1 Onchocerciasis The aim of the onchocerciasis program is to eradicate onchocerciasis and its vector in all endemic districts in Uganda Lead Program indicators x Simulium nivae eliminated in all endemic districts in Uganda. x At least 75% therapeutic coverage in all affected communities and 100% geographic coverage achieved in endemic districts x CDTI activities integrated within their district health plans in all endemic districts to sustain integration. Annual plan 2010/11 top indicators x Number of supervisory visits x Number of health workers and community distributors trained. x Number of advocacy on onchocerciasis conducted. x Number of adult Simulium flies caught in a monitoring site per month/yr x Coverage for mass treatment Main achievements 2010/11 x Transmission of onchocerciasis has been interrupted in Wadelai, Itwara and Elgon foci covering seven districts (Nebbi Mbale, Manafwa, Bududa, Sironko, Kabarole, Kyenjojo). x 2,239,900 people from 4,775 communities were treated for onchocerciasis with geographical of 95.7% and therapeutic coverage of 78% in 2010. x Onchocerciasis vector eliminated in three foci (Itwara, Mpamba-Nkusi, Elgon). x The development of draft Guidelines for Certification of onchocerciasis elimination in Uganda. A n n u a l H e a l t h S e c t o r P e r f o r m a n c e R e p o r t 2 0 1 0 / 11 111 x Initiation of mass treatment with ivermectin in the control of onchocerciasis involving community participation in post-conflict district of Kitgum, Pader and Lamwo. Main challenges 2010/11 x Maintaining the high geographic and therapeutic coverage in endemic districts. x Demand for incentives by Community Medicine Distributors. x Delay in release of operation funds at district level. Recommendations for annual plan 2012/13 x The District Onchocerciasis Coordinators should ensure the attainment of high geographical and therapeutic coverage in the affected communities. x The Ministry should extend the training of VHTs to cover all the districts so as to minimize the demand for incentives among the CMDs. x The district Chief Administrative officers should ensure timely release of operational funds. The onchocerciasis program has successfully eliminated the simulium vector in three foci and interrupted transmission in seven districts. A total of 8,410 cases of onchocerciasis were reported in the OPD attendances in 2010/11, 8,404 reported in 2009/10 and 10,132 in 2008/10. There is need for sustained efforts to attain high geographical and therapeutic coverage in affected communities as the sector works towards certification of onchocerciasis elimination in Uganda. 3.3.4.2 Lymphatic Filariasis The aim of the lymphatic Filariasis program is to reduce and ultimately interrupt transmission of the disease in all endemic communities through the use of chemotherapy with Ivermectin and albendazole. Lead Program indicators for Lymphatic Filariasis x Therapeutic coverage for the affected people with single annual dose of Invermectin and Albendazole maintained. x Geographical coverage for the affected communities with single annual dose of Invermectin and Albendazole. x Mapping of areas with lymphatic filariasis in all endemic districts completed by 2011/12. x Morbidity and disability associated with lymphatic filariasis reduced Annual plan 2010/11 indicators x Number of tablets for each drug supplied and consumed during Mass Drug distribution (MDA). 112 A n n u a l H e a l t h S e c t o r P e r f o r m a n c e R e p o r t 2 0 1 0 / 11 x x x x Proportion of eligible population taking antifilarial medicines annually (>65%) and targeted communities (100%). Microfilariae prevalence in sentinel and spot check sites Districts with antigenaemia rate above 1% Hydrocelectomies done at district and national levels ,and Districts reporting lymphoedema management Main achievements 2010/11 x 20,553,500 and 12,561,500 tablets of Invermectin and Albendazole respectively procured and distributed. x All target districts received antifilarial medicines ( Awaiting districts reports to establish the eligible population which received treatment) x Sites in districts which have undergone 4-5 MDA rounds surveyed for microfilariae prevalence x Lymphatic filariasis map refined in 14 districts in central, Western and south western Uganda x 25 districts support supervised specifically for lymphatic filariasis with focus on morbidity management (hydrocelectomy and lymphoedema management). Main challenges 2010/11 x Delay in submission of reports from the districts x Failure to include hydrocelectomy as a routine surgical activity x Reports on non-filarial elephantiasis. Recommendations for annual plan 2012/13 x The Neglected Tropical Disease Control program Secretariat should ensure that planning is strengthened through engagement of stakeholders and preparation of relevant plans and materials made prior to implementation. x Government of Uganda should increase funding to address morbidity management (hydrocelectomy at health centres and lymphoedema management at community level). x Ministry of Health should provide transport to ease program supervision especially monitoring and evaluation of program sentinel and spot–check sites. The Lymphatic Filariasis program has sustained efforts in maintaining the therapeutic coverage with single annual dose of ivermectin and biannual dose of albendazole. Delay in submission of district and prevalence survey reports prevents effective program monitoring. Vector elimination activities not prioritised. 3.3.4.3 Veterinary Public Health The mandate of VPH unit is to prevent and mitigate the impact of zoonotic diseases thereby improving the health of the population of Uganda. The most notable are; Highly Pathogenic A n n u a l H e a l t h S e c t o r P e r f o r m a n c e R e p o r t 2 0 1 0 / 11 113 Avian influenza (H5N1), pandemic influenza H1N1, Severe Acute Respiratory Syndrome (SARS), Bovine Spongiform Encephalopathy / variant-Creutzfeld-Jakob Disease (Mad Cow Disease). In Uganda, outbreaks of Ebola Heamorrhagic fever (HF) and Marburg HF have occurred with increasing frequency in the last five years. There has also been a re-emergency of anthrax, mange and plague which occur sporadically in wildlife and domestic animals and they occasionally spill over and spread into the human populations. At the same time long established zoonotic diseases such as rabies, bovine TB, brucellosis, cysticercosis and hydatidosis have remained endemic among the population in most developing countries including Uganda. Lead programme indicators x Zoonotic diseases technical guidelines, developed and disseminated by 2011/2013. x The proportion of General Hospitals and RRH conducting proper laboratory diagnosis of brucellosis increased by 20% and 50% by 2015 respectively Annual plan 2010/11 top indicators x Train health staff on emerging, re-emerging and endemic zoonotic diseases investigations, prevention & control x Develop, print & disseminate IEC materials on rabies x Conduct technical support supervision to districts Main achievements 2010/11 x Technical support supervision undertaken in 15 Districts of Apac, Soroti, Oyam, Dokolo, Lira, Nakasongola, Luwero, Hoima, Masindi, Zombo, Nebbi, Arua, Bundibugyo, Mubende and Mityana x Developed, & translated rabies health education (IEC) materials in Ateso in the districts of Kaberamaido, Soroti, Bukedea, Ngora and Kumi. x Undertook an assessment on availability, quality, type and location of IEC materials on zoonotic diseases in districts and health units in districts of Mityana, Kyegegwa, Kyenjojo, Kabarole and Ntoroko x Conducted training on rabies post exposure treatment and case management for health workers in 5 regional referral hospitals of Jinja, Mbale, Soroti, Lira and Gulu x Sensitized teachers and school children in 4 districts of Alebtong, Otuke, Kaberamaido and Dokolo on prevention and response to influenza and other zoonotic diseases of public health importance Main challenges 2010/11 x Insufficient funds allocated for planned activities x Under staffing of the division (one established post for one technical officer and two technical assistants on short term contracts) x 114 Stock out of anti-rabies vaccine A n n u a l H e a l t h S e c t o r P e r f o r m a n c e R e p o r t 2 0 1 0 / 11 Recommendations for annual plan 2012/13 x Streamline the availability of human rabies vaccine and treatment regimen for rabies post exposure prophylaxis. x Zoonotic diseases technical guidelines developed and disseminated x The proportion of General hospitals and RRH conducting proper laboratory diagnosis of brucellosis increased by 20% and 50% by 2015 respectively. The VPH unit built capacity for collaboration, investigation and management of zoonotic diseases in a few districts. According to the MoH HMIS report, the number of reported cases of animal/snake bites increased from 41,802 in 2009/10 to 42, 529 in 2010/11; and the number of suspected rabies reduced from 200 IN 2009/10 to 145 in 2010/11. Diagnosis 2008/09 Animal/ Snake Bite Suspected Rabies 2009/10 20101/11 37,184 41,802 42,529 205 200 145 There is increased reporting and demand for post-exposure vaccination for rabies, which was not readily available to districts for most of the year under review. A n n u a l H e a l t h S e c t o r P e r f o r m a n c e R e p o r t 2 0 1 0 / 11 115 3.3.5 Prevention and Control of Non-communicable Conditions Uganda is currently experiencing dual epidemics of communicable and non communicable diseases. The changing life styles have resulted in an increase in the prevalence of non communicable diseases like Diabetes mellitus, cardiovascular diseases, chronic respiratory diseases and cancer. It is an opportune moment for the ministry to give relevant attention to non communicable diseases. The diseases/conditions addressed by the cluster on Prevention and Control of NonCommunicable Diseases/Conditions include; Cardiovascular Diseases, cancers, Diabetes, Chronic Obstructive Pulmonary Diseases and sickle cell disease. 3.3.5.1 Prevention and Control of NCD The non communicable disease programme was established in 2006/07 Financial year to plan, implement and coordinate actions aimed at preventing and controlling NCDs in Uganda. The increasing urbanization and changing lifestyles is exposing most of the population to unhealthy life styles and this is immensely contributing to the rising incidence of NCDs. The aim of the NCD programme is to reduce morbidity and mortality attributable to NCDs through appropriate interventions. Lead programme indicators x NCD survey carried out to determine; o Prevalence of diabetes among >25 yr olds o Prevalence of raised BP among >25 yr olds o Prevalence of current daily tobacco smoking among >15 year olds o Percentage of Health facilities with the capacity to provide adequate NCD prevention and management services x Coverage of cervical cancer screening Annual plan 2010/11 top indicators (implementation) x Report of the Uganda NCD Survey x Coverage of cervical cancer screening Main achievements 2010/11 x Uganda NCD Survey planning completed x Draft 0 Uganda NCD policy developed x Draft 0 of the Uganda cancer strategy developed x MOU for establishing specialized services for management of Type 1 diabetes signed x The Cervical cancer screening was costed although not yet funded. 116 A n n u a l H e a l t h S e c t o r P e r f o r m a n c e R e p o r t 2 0 1 0 / 11 Main challenges 2010/11 x x x x x x x Lack of reliable baseline data on the prevalence of NCDs and their risk factors. This is delaying formulation of evidence based NCD policies as well as developing comprehensive and integrated interventions against NCDs Insufficient community awareness on NCDs, leading to high prevalence of NCD risk factors, late presentation of patients to health facilities for proper treatment and poor treatment outcomes Inadequate capacity of the existing health system to provide quality NCD services, specifically there is an insufficient number of adequately trained health workers and lack of appropriate NCD screening, diagnostic and monitoring equipment at appropriate levels of health care. Unavailability/High cost of medicines and supplies for effective management of NCDs, particularly at lower level health facilities. Understaffing of the NCD Programme Lack of funds to scale up screening for cervical cancer Lack of funds to support operational activities for mass vaccination of HPV, yet free vaccines were donated by MERCK. Recommendations for annual plan 2012/13 x Implement the Action plan of the 2008 - 2013 Global Strategy for the prevention and control of Non communicable diseases. x Empower the NCD programme with more staff and required resources to enable it to fulfil its mandate. x Promote partnerships with Development Partners, the Academia, Civil Society Organisations and others to strengthen the Ministry’s financial and technical capacity to implement NCD prevention and control interventions x Commence implementation of the cervical cancer strategy, beginning with scaling up of cervical cancer screening and mass HPV vaccination. Available data from the HMIS shows that the number of new patients attending OPD with hypertension and diabetes is increasing annually. Diagnosis 2008/09 2009/10 2010/11 % of total % of total % of total OPD OPD OPD Number attendance Number attendance Number attendance Hypertension Diabetes Mellitus 185,864 0.6% 190,065 0.5% 200,221 0.6% 81,420 0.3% 75,066 0.2% 86,010 0.2% Source: MoH, HMIS A n n u a l H e a l t h S e c t o r P e r f o r m a n c e R e p o r t 2 0 1 0 / 11 117 The continued lack of community based data has delayed the formulation of evidence based national NCD policies and strategies as well as the development of a comprehensive and integrated action plan against NCDs in our population. There were limited public awareness activities for prevention and control of NCDs. 3.3.5.2 Injuries, Disabilities and Rehabilitative Health The element of injuries, disabilities and rehabilitative health aims at decreasing the morbidity and mortality due to injuries, common emergencies and disabilities from visual, hearing and age-related impairments. This can be due to damage or harm done to or suffered by a person before or after birth. Such deprivation or loss of competency includes conditions like: deafness, blindness, physical disability and learning disability. Lead Programme Indicators x Visual impairment reduced from an estimated level at 0.8% to 0.7% x Hearing impairment reduced from 8% to 0.6% x Provision of assistive devices to PWDs who need x Reach 80% of the population with messages on disability prevention and rehabilitation. x All Trachoma endemic districts reached with mass distribution of Azithromycin and Tetracycline during Child Days Plus activities. x Trachoma prevalence studies conducted in all suspected trachoma endemic districts. x Increase provision of eye lid rotation surgical services to patients with Trachoma trichiasis from 10% to 30%. Annual Workplan Indicators x Advocacy plan on disability prevention in place x No and type of IEC materials produced x No. of International Days commemorated x No. of H/workers trained x No. of Policies, Standard Guidelines and Strategic plans developed. Main Achievements during 2010/201 x Low Vision guidelines produced and disseminated x NTDs five year integrated strategic plan developed. x 362 wheelchairs donated by the Church of the Later Day Saints distributed to PWDs. x In collaboration with partners involved in Road Safety Campaign launched A Decade of Action on Road Safety – 2010 – 2020 at Malaba. x 32 health workers trained in wheelchair assessment and fitting. x Twelve (12) OCOs trained in Low Vision assessment and refraction. x In collaboration with ICRC Mbale orthopedic workshop re-activated for production of assistive devices. 118 A n n u a l H e a l t h S e c t o r P e r f o r m a n c e R e p o r t 2 0 1 0 / 11 Main Challenges x Understaffing x Inadequate support to orthopedic workshops x Low priority accorded to disability programmes at all levels. x Coordination of many stakeholders with varying interests. Injuries and disabilities are an increasing problem as a result of road traffic accidents. Many of the road traffic accident victims end up with permanent disabilities. Trauma due to other causes is among the top ten causes of morbidity in Uganda. 2008/09 % of total OPD Number attendance Diagnosis Injuries = (Trauma due to Other Causes) Injuries - Road Traffic Accidents Source: MoH HMIS 2009/10 % of total OPD Number attendance 2010/11 % of total OPD Number attendance 627,412 2% 641,987 2% 657,542 2% 122,559 0.4% 124,727 0.3% 131,323 0.4% CSOs have been actively involved in rehabilitation and provision of assistive devices. The proportion of the population reached with messages on disability prevention and rehabilitation has increased in trachoma endemic areas with support from Sight Saver International. 3.3.5.3 Mental Health The mandate of the mental health program is policy formulation, planning, resource mobilization, setting standards, capacity building, coordination of interventions that address the high burden of mental health problems in Uganda, which stands at about 13% of the burden of diseases. The program aims at ensuring increased access to primary and referral services for mental health, prevention and management of substance abuse problems, psychosocial disorders and common neurological disorders such as epilepsy. Programme indicators x Mental Health Law enacted by 2011/12 x Mental Health Policy finalized and operationalized by 2010/11 x Operationalise mental health units in all RRHs by 2010/11 x Community access to mental health services increased from 60% to 80% x A community strategy for prevention of mental health problems developed by 2013/14 A n n u a l H e a l t h S e c t o r P e r f o r m a n c e R e p o r t 2 0 1 0 / 11 119 Planned output 2010/11 x Commemoration of World Mental Health Day, World No Tobacco Day and the International Day against Alcohol and Drug Abuse. x Develop IEC materials for mental health, tobacco control and alcohol abuse control x Orientation of Health Workers in use of the WHO ASSIST Tool for assessment of substance abuse; and training of Regional Trainers in mental health service delivery x Finalize drafting of the Mental Health Bill for presentation to Cabinet x Development of a Communication Strategy for Mental Health community education x Supervision of mental health services at 8 Regional Mental Health Units Main achievements x Mental Health Bill Drafted and ready for presentation to Cabinet x Training of Regional Trainers in mental health with support of SHSSP Project x Draft Communication Strategy for mental health education to the community developed x Mental Health Policy Drafted and ready for presentation to Top Management Main challenges x Gross underfunding of the programme in relation to the mandates x Lack of progress due to multi sectoral nature of activities e.g. Mental Health Bill drafting x Programme is understaffed. Recommendations for annual plan 2012/13 x Increase funding to the programme in order to complete consultation process for Mental Health Policy, Tobacco Control Policy, Alcohol Control Policy and Drug Control Master Plan x Strengthen inter sectoral collaboration through consultative meetings to hasten process of policy development and implementation x Implement the proposed restructuring to increase staff in the Mental Health Programme A number of interventions were implemented to address the high burden of mental health problems in Uganda. According to the MoH HMIS, reported new mental health problems accounted for almost 1% of all new cases with epilepsy as the most common mental health problem. Diagnosis Epilepsy 120 2008/09 % of total OPD Number attendance Number 176,851 185,709 0.6% 2009/10 2010/11 % of total OPD attendance Number 0.5% 194,018 A n n u a l H e a l t h S e c t o r P e r f o r m a n c e R e p o r t 2 0 1 0 / 11 0.6% Other Forms of Mental Illness Anxiety Disorders 24,257 0.08% 29,147 0.08% 32,578 0.09% 20,456 0.06% 21,448 0.06% 23,693 0.07% Depression 18,774 0.06% 20,523 0.06% 22,069 0.06% Mania 13,591 0.04% 12,546 0.03% 17,290 0.05% 10,272 0.03% 9,429 0.03% 13,722 0.04% 9,508 273,709 0.03% 0.9% 8,632 287,434 0.02% 0.78% 12,361 315,731 0.04% 0.95% Schizophrenia Alcohol and Drug Abuse Total Source: MoH HMIS Community access to mental health services has been increased by the construction of mental health units at Regional level and provision of essential mental health and anti-epilepsy drugs. There is need for strengthening the program through increased community awareness and strengthening the legal and policy environment for mental health service provision. 3.3.5.4 Oral Health The aim of the oral health program is to improve the oral health of the people of Uganda by promoting oral health and preventing, appropriately treating, monitoring and evaluating oral diseases. Lead programme indicators x Oral health policy implementation guidelines developed and disseminated. x The proportion of HC IVs with well equipped and functional dental units increased x The proportion of the population with access to primary oral health care increased Annual plan 2010/11 top indicators (implementation) x Oral health care guidelines developed x Sensitisation materials prepared x Oral health education and screening for oral diseases Main achievements x Health workers have been trained on oral health care x School teachers’ guide on oral health care developed x School oral health education conducted. A n n u a l H e a l t h S e c t o r P e r f o r m a n c e R e p o r t 2 0 1 0 / 11 121 Main challenges x Inadequate equipment in most hospitals and HC IVs. x Lack of dental supplies infrastructure in the most districts. x No recruitment of dentists in districts and dental oral health education coverage is still very low due to low funding and under staffing. Recommendations for annual plan 2012/13 x Integration of oral health into maternal and child health, nutrition, HIV/AIDS and school health programmes. x Procurement of dental materials and equipment for RRHs and GHs x Equitable deployment of oral health workers in the districts. The oral health policy implementation guidelines were not developed due to inadequate resources. The number of new OPD attendances due to oral diseases and conditions was 535,650 in 2010/11, 551,810 reported in 2009/10 and 518,861 in 2008/09. The quality of services offered to this high number of patients is affected by the lack of functional dental units and inadequate oral health professionals at lower levels. There is need to prioritize procurement of dental equipment and deployment of oral health workers in the districts. 3.3.5.5 Palliative Care The aim of palliative care is to improve the quality of life of patients and their families facing the problem associated with disease not responsive to cure, through the prevention and relief of suffering by means of early identification, assessment and treatment of pain and other symptoms, physical, psychological and spiritual. Lead programme indicators x Guidelines and standards for palliative care developed. x All hospitals and HC IVs providing palliative care. x Adequate stocks of appropriate medication and supplies at palliative care centers are available. Annual plan 2010/11 top indicators x Roll out palliative care to Hospitals and lower level health facilities in central region x Train village health teams in palliative care x Ensure adequate stocks of oral morphine in NMS for use by palliative care centres in Uganda x Integrate palliative care in to health training school syllabus 122 A n n u a l H e a l t h S e c t o r P e r f o r m a n c e R e p o r t 2 0 1 0 / 11 Main achievements 2010/11 x Palliative care centres functionalised in Namutumba and Mayuge districts x VHTs trained and successfully integrated into palliative care activities in Namutumba and Mayuge districts x Oral morphine is available at National Medical Stores for order by accredited centres x Palliative care has been successfully introduced in syllabus of health training institutions. Main challenges 2010/11 x There is still limited appreciation of Palliative Care among most health facility managers, the public and policy makers. x Inadequate funding to meet the training needs for the health workers. x There has been slow scale up of Palliative Care services to districts. Recommendations for annual plan 2012/13 x Intensify on awareness creation amongst health workers, facility managers and policy makers on palliative care x Strengthen partnerships with development partners for further action and resource mobilisation x Increase the number of health workers with skills in palliative care The Palliative care pilot model implemented in Namutumba and Mayuge district has demonstrated the capacity of lower levels units in providing quality palliative care services thus increasing access to palliative care. Lessons learnt should be used to scale up palliative care services in other districts. 3.3.5.6 Nursing The nursing profession provides the largest workforce in the health sector in a diverse environment thus participating in a wide spectrum of service delivery. The department of Nursing is responsible for promoting collaboration and coordination of nursing and midwifery activities amongst stakeholders nationally and internationally while ensuring adherence to ethics and standards. Annual plan 2010/11 top indicators (implementation) x Proportion of planned technical support supervision visits to identified health facilities conducted x Proportion of planned capacity building workshops (leadership, management and skills building in clinical area) for nurses and midwives conducted x Draft policy guidelines for nurses and midwives in place x Collaboration and coordination meetings attended/conducted A n n u a l H e a l t h S e c t o r P e r f o r m a n c e R e p o r t 2 0 1 0 / 11 123 Main achievements x Conducted 8 Technical Support supervision visits and mentored nurses and midwives in 2NRHs, 6 RRHs, 8GHs and 6 HC 1Vs; and carried out integrated interdepartmental support supervision between the nursing departments, Reproductive Health Division to the 7 UNFPA supported districts (Masindi, Kanungu, Kabong, Katakwi, Yumbe, Moroto and Amuria) x Conducted Capacity building workshop for 25 nurse leaders in leadership and management skills x Drafted the Nurses and Midwives policy guidelines, started on the development (Nurses and midwives strategic plan) of the implementation framework for HSSIP 2010/11 – 2014/15 for nurses and midwives, finalized the scheme of service for nurses and midwives to incorporate new cadres e.g. comprehensive nurses, degree nurses; and developed a proposal on the “Development and implementation for scope of practice for Nurses and Midwives”. x Conducted 3 coordination meetings to streamline and harmonize of nursing activities both nationally and internationally; attended ECSACON scientific conference in Zambia. Main challenges x Inadequate resources for the implementation of planned activities x Lack of orientation of newly posted nurse leaders at various levels in management and taking up their tasks x Lack of routine coordination meetings to harmonize nursing activities at various levels x Unreliable transport for coordination and supervision Recommendations for annual plan 2012/13 x Scale up technical support supervision visits and mentorship to enhance the provision of quality nursing care x Strengthen leadership and management skills for nurse leaders through capacity building x Strengthen coordination and collaboration of nursing activities with key stakeholders nationally and internationally. Nurses and midwives cadre are among the critical cadre on demand in the health sector. High attrition rate coupled with low staffing has made the few available overworked and less motivated. There is need to review the staffing norms and implementation of the motivation strategy in order to uplift the quality of services and reduce on absenteeism. 124 A n n u a l H e a l t h S e c t o r P e r f o r m a n c e R e p o r t 2 0 1 0 / 11 3.3.5.7 Integrated Essential Clinical Care The intervention of providing integrated essential clinical care aims at improving access to equitable and quality clinical services at all levels in both the public and private health institutions through:x Strengthening the capacity of hospitals to provide integrated care x Increasing the range of health services provided by hospitals Lead programme indicators x The functionality of the HC IVs increased from 5% to 50% by 2014/15. x Standards for best practice in hospitals established by 2012. x Blood Transfusion Centres set up in all RRHs (2 each year) x ICU/CCU established in 40% of the RRHs (1 ICU in RRH each year) by 2014/15 Annual plan 2010/11 top indicators (implementation) x Professional mentorship from National and Regional Referral hospitals to general hospitals and HC IVs x Number of policies, laws, guidelines, plans and strategies developed (Internship policy developed; national fistula strategy finalized; guidelines for Community Health Department Developed; guidelines for infection control committees, human organ transplant bill) x Number of integrated and technical support supervision visits to all RRHs and 126 general hospitals x Supervision of 5S-CQI-TQM in Tororo, Mbale, Busolwe, Kapchorwa, Entebbe and Masafu hospitals. x Quarterly supervision visits to Community Health Departments in hospitals x Number of health workers trained (universal precautions and infection control; hospital management) x Number of meetings held (hospital managers, Medical Board, National Internship Committee) Main achievements x The National Obstetric fistula strategy was finalized and is in print x Guidelines for infection control committees is in final phases of development x Guidelines for Health facility management committees/boards were revised x All the 13 RRHS were supervised at least once during the year x Some general hospitals received emergency supervision to Kitgum, Bududa, Apac, Kisiizi, Mutolere, Nyakibale, Atutur, Gombe, Yumbe, Nebbi and Kamuli. x 5S-CQI-TQM sites in Tororo, Mbale, Busolwe, Kapchorwa, Masafu, Gombe and Entebbe hospitals were supervised in all the quarters. x Health workers in health facilities in Masaka RRH were trained in universal precaution and infection prevention and control A n n u a l H e a l t h S e c t o r P e r f o r m a n c e R e p o r t 2 0 1 0 / 11 125 x Hospital managers meeting was held in Lira RRH, 4 National Internship Committee meetings were held, 16 medical board meetings were held, 49 people were referred for treatment abroad and 42 were retired on medical grounds. Main challenges x Lack of funding for the Professional mentorship from National and Regional Referral hospitals to general hospitals and HC IVs program hampered implementation. x Delayed and inadequate funding x Lack of fund for referring retired and local citizen for treatment abroad x Understaffing in the integrated curative division Recommendations for annual plan 2012/13 x Solicit funding for the specialist outreach program from National to Regional, District and HC IVs x Networking with relevant departments x Better staffing for the division x More funding for the Medical Board activities 3.3.5.8 National Referral Hospitals There are two national referral hospitals, Mulago and Butabika offering a range of specialized care services. Mulago Hospital Mulago Hospital is the National Referral Hospital for those who require specialized and superspecialized care. Its official bed capacity is 1,643 beds. The average bed occupancy for FY 10/11 was 95%. Annual plan 2010/11 top indicators Target Number of outpatient services to 700,000 Number of inpatients (New Admissions) 140,000 Number of patients requiring emergency services attended to 60,000 Number of patients who received specialized services 180,000 Number of Laboratory tests carried out 1,800,000 Number of radiological imaging carried out 60,000 126 A n n u a l H e a l t h S e c t o r P e r f o r m a n c e R e p o r t 2 0 1 0 / 11 Main achievements 2010/11 Number of specialized outpatients attended to 120,201 Number of general outpatients attended to 730,012 Number of inpatients attended to 145,241 Number of emergency cases attended to 52,103 Number of Laboratory tests 1,202,259 Number of patients Imaged 63,552 Main challenges 2010/11 x Understaffing x Under funding especially for recurrent expenditure like on food for patients x High patient turn up x Poor infrastructure especially for staff accommodation. Recommendations for annual plan 2012/13 x Continue to work with MOH and KCCA to fast tract the decongestion of Mulago Hospital. x Rehabilitate and construct staff houses. x Advocate for increase of the budget. Butabika Hospital Butabika Hospital is the National referral hospital for Mental Health. It has 550 beds capacity and bed occupancy was 126% in 2010/11 Lead Programme Indicators x Number of inpatients x Number of outpatients x Number of outreach visits conducted. x Number of support supervision visits registered. x Number of staff houses constructed. Annual Plan 2010/2011 Top Indicators (Implementation) x 28,000 mental patients and 50,000 medical outpatients attended to. A n n u a l H e a l t h S e c t o r P e r f o r m a n c e R e p o r t 2 0 1 0 / 11 127 x x x 46 outreach clinics conducted, 2600 patients attended to. 4 staff houses constructed. 6,000 patients admitted, investigated and treated. Main Achievements 2010/11 x Provided inpatient mental health services to 2,248 and 3,874 patients on first visit and readmission respectively x Mental health outreach clinics where 2,396 patients were treated. x Provided Mental Health Training to 471 students from various institutions of higher learning x 629 patients were resettled to their homes. x Provided general outpatient and PHC services to 28,131 in the specialized mental health clinic and to 50,390 patients with general medical conditions x Three staff houses constructed Main Challenges 2010/11 x Inadequate funding x High patient numbers vis – a - vis the available facilities. x Understaffing Recommendations for Annual Plan 2012/13 x Increase budget by 50% x Operationalise the referral system for Mental Health Care. x Approve proposed staffing structure and accordingly fill the vacant positions. 3.3.5.9 Diagnostic and Blood Transfusion Services 1. Uganda Blood Transfusion Services The main goal of Uganda Blood Transfusion Services is to collect, process, provide safe and adequate blood and blood products and promote safe blood transfusion practice. This is through seven regional blood banks located in Mbarara, Mbale, Gulu, Fortportal, Kitovu, Arua and Nakasero and six blood collection centers in Jinja, Soroti, Lira, Hoima, Rukungiri and Kabale. In addition, it oversees a national blood donor education and recruitment programme as well as handling education and training in blood safety. In playing these roles, Uganda Blood Transfusion Services plays a central role in prevention of HIV/AIDS transmission and other blood borne diseases e.g. Hepatis B, syphilis. 128 A n n u a l H e a l t h S e c t o r P e r f o r m a n c e R e p o r t 2 0 1 0 / 11 Lead programme indicators x Total number of blood units collected form voluntary non-remunerated donors x % of donated blood screened in a quality controlled manner x No. Of blood units discarded after screening x Proportion of health units receiving 100% of blood units used for transfusion from UBTS x Number of blood donors counselled for any TTI. Annual plan 2010/11 top indicators (implementation) x Number of blood donor mobilisation sessions x Total number of units of blood collected and processed x Number of regional blood banks constructed x No of supervision visits carried out Main achievements 2010/11 x 4,511 blood collection sessions held x 187,828 out of 200,000 planned blood units collected from VNRBD x Expansion of Nakasero Regional Blood Bank completed x 227 health care facilities received blood x 4 supervision visits undertaken Main challenges 2010/11 x Inadequate funding x Inadequate infrastructure x Inadequate outreach to potential donors Recommendations for annual plan 2012/13 x Increase funding for Blood transfusion activities – GOU/ Donors x Construct RBBs for each regional Referral hospital x Improve clinical interface for appropriate blood use The UBTS is facing increasing demand for safe blood provision in respect to the growing population and increasing access to services by functionalizing the HC IVs. Construction of the Regional Blood Banks and procurement of consumables needs to be prioritized to enable the UBTS provide adequate supplies of safe blood. 2. LABORATORY SERVICES Lead programme indicators x Percentage of health facilities with laboratory services fully supporting UNMHCP x Percentage of laboratories that are successfully participating in EQA schemes A n n u a l H e a l t h S e c t o r P e r f o r m a n c e R e p o r t 2 0 1 0 / 11 129 x x Percentage of outbrea s with laboratory confirmation Percentage laboratories certifie an accre ite by international an national agencies Ann a p an 2 top indicators x Number of gui elines policies evelope an implemente x aboratories accre itation x Percentage of laboratories successfully participating in e ternal uality assessment x x x x x ain ac ie ements 2 evelope an starte implementing a year strategic plan for laboratory services evelope a laboratory testing menu EN classifie list of laboratory supplies stan ar list of laboratory e uipment an laboratory physical infrastructure stan ar s for ifferent levels of care nitiate the preparation of laboratories inclu ing national reference national referral hospital regional hospital an general hospital for accre itation A ministere proficiency panels to laboratories with about registering satisfactory performance Confirme out of of outbrea s investigate ain c a enges 2 nappropriate management structure of laboratory services in the country ac of regional role in the coor ination of laboratory uality assurance at lower level facilities x na e uate national laboratory information management systems x x Recommendations or ann a p an 2 2 x E pe ite the restructuring process so as to improve on the laboratory services management x trengthen the role of regional hospital laboratories in coor ination of laboratory uality assurance in lower level laboratories The process of strengthening laboratory services in Uganda was started by developing a 5 year strategic plan for laboratory services. there is need to operationalise this strategy by putting in place the relevant management structures, carry out accreditation and ensure provision of adequate laboratory supplies. . RA IOLO Y SERVICES Lead programme indicators x o provi e a wi e range of uality iagnostic an imaging services x o con uct a research x o provi e support supervision to regional an istrict hospitals 130 A n n u a l H e a l t h S e c t o r P e r f o r m a n c e R e p o r t 2 0 1 0 / 11 Ann a p an 2 top indicators imp ementation x Number of mo ern ra iological e uipment procure in all hospitals x Percentage of the e uipment properly maintenance throughout the year x Number of support supervision carrie out to the upcountry hospitals to ascertain the service elivery ain ac ie ements 2 x upplie imaging e uipment to HC an Hospitals x perational research was con ucte an publications ma e x Continuing professional evelopment through wor shops an conferences by the various associations that bring together a iation or ers were carrie out ain c a enges 2 x api echnology a vances re uire that we eep up ating our e uipments listless we fail to get spare parts on the mar et x re uent brea owns an elaye repairs ue to lac of service contracts he service contracts cannot be finance by the current bu getary allocations x ac of consumable for the ra iological services Recommendations or ann a p an 2 2 x Ensure that there are service contracts to enable repair the available e uipment in all hospitals x Procure mo ern ra iological e uipments as recommen e by NACME for hospitals country wi e x treamline the supply of consumables for the ra iology services in hospitals A limited range of radiology and imaging services are mainly provided by referral and general hospitals and specialized diagnostic centres in the country. Imaging equipment was installed in some HC IVs and hospitals and users trained. Most of the x-rays in hospitals are very old requiring replacement. There is need to revamp the entire radiology and imaging services by ensuring availability of functional equipment, trained personnel and provision of adequate supplies. The new guidelines should be disseminated and operationalized. A n n u a l H e a l t h S e c t o r P e r f o r m a n c e R e p o r t 2 0 1 0 / 11 131 3.4 Integrated Health Sector Support Systems uring H P the sector will focus on putting in place the necessary inputs that are nee e to ensure there is improve access to health services hese inputs relate to the human resources infrastructure inclu ing e uipment C an transport an me ical pro ucts 3.4.1 Human Resources for Health he health sector is committe to attainment an maintenance of an a e uately si e e uitably istribute appropriately s ille motivate an pro uctive wor force in partnership with the private sector matche to the changing population nee s an eman s health care technology an financing Core SSI indicator x of posts fille by s ille Health wor ers x Annual re uction in absenteeism rate Lead programme indicators x Number of istricts with functional Human esource nformation ystem H x Number of Human esource for Health managers traine in ea ership an Management x Number of H traine in esults riente Management x Percentage of health managers in H with signe Performance Agreements x x x x x x an 2 top indicators imp ementation Human resource au it report in istricts an Hs Number of newly recruite staff appointe eploye an in ucte raining in lea ership an management egional eferral Payroll Monitoring report Number of PN P health training institutions monitore cale up the H H to istricts ain ac ie ements x H training was con ucte in an a itional istricts an software installe x Au it con ucte in all istricts iannual eports pro uce supporte by Ugan a Capacity Programme x raining for trainers was one by e ternal trainers from Capacity plus in ashington uring November ecember he H H lea ers receive a training in lea ership an management hese will champion the training of other H lea ers at both central an istrict levels in the subse uent years 132 A n n u a l H e a l t h S e c t o r P e r f o r m a n c e R e p o r t 2 0 1 0 / 11 x x x x x x x x he first training course of H lea ers from s was con ucte at HM C Mbale for Eastern egion he istricts traine inclu e Mbale utale a usia Amolatar Namutumba o olo an amuli A total of health wor ers were traine in mentoring ut of these were from National egional eneral an Military Hospitals an were from abale chool of ECN abale egional Hospital an Health Centres he mentors will mentor stu ents uring practicum training Progress has been ma e on institutionali ation of H lea ers at hospital level A position of hospital irector for regional referral hospitals was create an the first batch of hospital irectors was provi e with appointment letters or to refine the performance management strategy was initiate with broa consultation with sta ehol ers inclu ing the esults riente Management M unit of the M P he raft strategy was presente to H H sta ehol ers in the Human esource echnical or ing group for their input he strategy is being finali e by the ey sta ehol ers ain c a enges na e uate resources to in uct all new staff High attrition of health wor ers especially in istricts ow wage bill ow morale an high absenteeism Recommendations or ann a p an 2 2 x mprove fun ing to the sector especially wage bill provisions to enhance both the numbers an pay levels x mprove wor ing con itions E uipment an accommo ation x trengthen Management an supervision of health wor ers at all levels A range of planned activities were implemented towards improving the health workforce however, significant improvements may not be achieved without addressing the issue of numbers. The MoH should advocate for recruitment, remuneration and motivation of the health workforce. 3.4.2 Health Infrastructure Development and Management he health sector continues ensuring access to uality services through provision an maintenance of functional efficient safe environmentally frien ly an sustainable health infrastructure inclu ing laboratories an waste management facilities for the effective elivery of the UNMHCP with priority being given to consoli ation of e isting facilities A n n u a l H e a l t h S e c t o r P e r f o r m a n c e R e p o r t 2 0 1 0 / 11 133 At the beginning of H P the proportion of househol s living within wal ing istance to health facilities is estimate at Most facilities are in a state of isrepair o not have the re uire facilities for them to function effectively e g staff housing water an energy theatres e uipment stores etc an re uire C an relate infrastructure hese ten to compromise the efficiency uality an access of these services Lead programme indicators x he proportion of the population of Ugan a living within m of a health facility increase from to by x he number of health facilities increase by by x he proportion of HC s an HC s with complete basic e uipment an supplies for a ressing EmoNC increase to x he proportion of HC s an hospitals with functional ambulances for referral increase to x i ty percent of me ical e uipment are in goo con ition an maintaine Ann a p an 2 top indicators x Hospitals an health centres constructe an rehabilitate x Hospitals an health centres e uippe x Motor vehicles an other transport e uipment procure x Capital wor s monitore supervise an appraise ain ac ie ements x n sche ule rehabilitation of hospitals an supply of me ical e uipment in the Central egion Masa a an Muben e Hs x Health acilities nventory list prepare an rea y for printing x outine servicing an repair of solar energy pac ages an imaging e uipment an theatre e uipment in Health facilities un er the Energy for ural ransformation E an the Country i e maging upply an nstallation E Pro ects across the country x Procurement of Consultants an contractors for construction of clinical laboratories at ulu abale in a an ort Portal Hs an loo an s at ulu an ort Portal x upport to referral hospitals e ternally fun e pro ects istricts an the entire Health ector in Health nfrastructure evelopment ain c a enges x nefficiencies in the procurement process both within an outsi e the Ministry process of getting Contracts Committee awar s an approvals from olicitor eneral x na e uate fun ing for the uantum of re uirements x ate release by Mo PE as well as late payment to ervice provi ers lea ing to elaye completion an payment of interest 134 A n n u a l H e a l t h S e c t o r P e r f o r m a n c e R e p o r t 2 0 1 0 / 11 Recommendations or ann a p an 2 2 x he entire procurement process within an without the ministry to be ma e more efficient for timely e ecution of wor s x ufficient fun s to be vote towar s improvement of infrastructure throughout the country inclu ing ring fence fun s for me ical e uipment maintenance x Prompt payment of service provi ers to ensure timely completion an avoi ance of interest on elaye payments Progress in consolidating and renovating existing facilities as well as equipping facilities was rather slow and therefore there was minimal increase in access to quality services. Facility and inventory records were not updated and therefore difficult to monitor status. Local Governments and central institutions should submit regular inventory reports so that the sector can keep track of availability and functionality of the infrastructure and equipments. 3.4.3 Management of Essential Medicines and Supplies ver the perio of the H P essential efficacious safe goo all times priority will be given to increasing access to uality an affor able me icines an other health supplies at Core Indicators x he percentage of health units without monthly stoc outs of any in icator me icines (43 % of health facilities did not have stock out of any of the six tracer medicines in the FY 2010/2011 – first line antimalarials, Depoprovera, SP, measles vaccine, ORS, Cotrimoxazole). Lead programme indicators x he fun s in the M H bu get for procurement of EMH increase x he service level of NM for all EMH increase x he of N A bu get irectly finance by oU consoli ate fun s increase x ui elines for onate me icines evelope by Ann a p an 2 top indicators x Hol an UM AC meetings to up ate EMH an aboratory supplies lists an two regional wor shops with the regional pharmaceutical persons x evelop integrate training materials in me icine an health supply logistic management Establish a uantification procurement an planning unit QPPU x Con uct support supervision in units an provi e on ob training on Me icine ogistics Management in lower level health facilities x Procure motor cycles to support strengthening of supply chain of EMH in istricts x Procure wo servers for MoH Hea uarters A n n u a l H e a l t h S e c t o r P e r f o r m a n c e R e p o r t 2 0 1 0 / 11 135 x x x x x x ain ac ie ements Con ucte eight meetings three UM AC meetings an three wor shops to up ate Health supplies lists he EMH an aboratory supplies lists are rea y for printing ne regional meeting was hel for the regional pharmaceutical personnel evelope integrate training materials for me icine an health supply logistic management Establishe a uantification procurement an planning unit QPPU Con ucte support supervision in health units with a itional support from mplementing Partners U E A EC an U A N motor cycles procure with support from U E for Central an Eastern regions to support the supervision of the supply chain for Essential Me icines an Health upplies wo servers procure with support from U E to facilitate coor ination of the upply Chain Management ystem between NM MoH an istricts an the establishment of the National Pharmaceutical nformation Portal A new stores an ispensing soft ware programme was pilote in three hospitals Masa a utabi a an ayunga with a plan to roll out uring the ain c a enges x ate processing of fun s lea ing to late e ecution of activities x Persistent na e uate Human esources that affect the planning an Me icines an Health upplies at all levels of care x irect bu get support to N A from overnment was not achieve management of Recommendations or ann a p an 2 2 x Continue capacity buil ing of the supply chain for essential me icines an health supplies x Monitoring an support supervision of the me icines an health supplies management in the sector x trengthening hospital planning an management of EMH There is a positive trend in improving access to essential medicines and health supplies as shown by the reduced level of stock outs from 41% in 2009/10 to 47% in 2010/11. Systems strengthening interventions by the SURE project and increased funding for medicines from government with last mile delivery need to be acknowledged and scaled up for even better achievements. 136 A n n u a l H e a l t h S e c t o r P e r f o r m a n c e R e p o r t 2 0 1 0 / 11 3.4.4 National Drug Authority National rug Authority N A was establishe by the National rug Policy an Authority N P A Act Cap aws of Ugan a evise e ition to promote use of safe efficacious an goo uality me icines Ann a p an 2 top indicators imp ementation x nspection an licensing of rug outlets pharmacies rug shops x nspection an licensing of local manufacturers c MP au it an follow up inspections per factory x Post Mar et urveillance upport upervision con ucte in istricts x estruction of rugs tonnes per region per year x esting of samples rugs con oms me ical gloves an Ns rug samples con om samples gloves x etting of promotional materials applications x Pharmacovigilance activities x x x x x x x ain ac ie ements 2 icense pharmacies an rug shops an of planne respectively All the local pharmaceutical facilities were inspecte for renewal of annual license even of them have so far been license while others are awaiting follow up inspections to review their corrective actions prior to consi eration for licensing upport supervision was con ucte in istricts at regional level an istricts for the eterinary unit A total of samples of pro ucts from ports of entry an the mar et were pic e for analysis out of which passe faile an are pen ing outcome of analysis ut of the faile samples pro uct recalls were carrie out were pre mar et samples from ene n ustries t an these were eventually estroye while the rest were counterfeit me icines unearthe uring operational Mamba that too place in uly trips were ma e to uwero in ustries in Na asongola in which tonnes of e pire rugs were estroye hese inclu e tonnes of e pire pharmaceuticals from overnment of Ugan a NM an tonnes of e pire pharmaceuticals from N A hea uarters an some of those aban one at the ports of entry A total of me icine samples were teste out of which passe the tests an samples faile the tests A total of batches of male late con oms batches of me ical gloves an samples from overseas shipment containers recor e as batches of ong asting nsectici e treate mos uito nets N were teste hile nine batches of me ical gloves faile the tests one all samples of male late con oms an samples from the containers of Ns passe the tests one eceive applications for vetting promotional materials a Applications were approve b were re ecte rote show cause letters to herbalists who put inappropriate a verts in the me ia but they refuse to receive them claiming that they are not regulate by N A A n n u a l H e a l t h S e c t o r P e r f o r m a n c e R e p o r t 2 0 1 0 / 11 137 x x x x x x x x x x x upport supervision was con ucte in Pharmacovigilance egional Centres in which technical assistance in igiflow was given an review meetings hel on the progress of Pharmacovigilance activities wo egional Pharmacovigilance Centres were establishe in aramo a an Muben e egional eferral Hospitals health facilities an health training institutions were visite health wor ers an stu ents were sensiti e A s were receive at the National Pharmacovigilance Centre an first assessment of the reports was one istrict eterinary Professionals both private an public were sensiti e on monitoring an reporting A verse rug events A Es in the istricts of ata wi oroti Mbale u ungiri Ntungamo ban a iruhura asese an Mbarara ain c a enges in Y 2 2 na e uate fun ing has affecte N A s activities aps in the N P A Act a he Act oes not e plicitly provi e for regulation of cosmetics me ical an veterinary evices health care pro ucts public health pro ucts chemicals for public health use vaccines bloo an biological pro ucts b he Act oes not provi e for effective enforcement an eterrent penalties N A oes not have sufficient powers to effectively control illegal practices an counterfeits he penalties are not sufficiently eterrent an this has partly encourage recurrent breach of the law nfiltration into the country of unauthori e me icinal pro ucts through the numerous unregulate bor er points N A is unable to esignate nspectors of rugs at all bor er points into Ugan a ue to ina e uate staffing iberali ation of the me ia in ustry an abuse by herbalists is rampant Conflicting an overlapping man ates of health professional bo ies have been e ploite by some players in the pharmaceutical sector to violate the N P A Act e g rug outlets being license by other health professional bo ies 3.4.5 Information for Decision Making he health sector re uires reliable an accurate information to enable evi ence base ecision ma ing sector learning an improvement Monitoring an evaluation aims at informing policy ma ers about progress towar s achieving targets as set in the annual health sector plans an the H P an to help provi e managers with a basis in ma ing ecisions Core SSI indicators re e ant to program x imeliness of istrict HM reporting to the esource Centre ivision x Completeness of istrict HM reporting to the esource Centre ivision 138 A n n u a l H e a l t h S e c t o r P e r f o r m a n c e R e p o r t 2 0 1 0 / 11 Lead programme indicators x he proportion of implementing partners N s C s Private sector contributing to perio ic reports x Community base H establishe an lin e to HM by x he proportion of uarterly HM reports submitte x Proportion of planne vali ation stu ies that are carrie out x he proportion of sub national entities istricts health facilities that have reporte on the ey in icators as planne Ann a p an 2 top indicators imp ementation x National HM ta ehol er coor ination meetings hel x raining of all istrict iostatisticians an HM focal persons in the revise ntegrate HM tools x mprovement of the M H internet ban wi th from M to M x e esigning of the M H website to allow for faster navigation an up ate information access a ress www health go ug x inalisation of the e health policy an National H x Proportion of technical support supervisions carrie out to encourage mentoring an s ill transfer to istricts an health facility staff in ata management ain ac ie ements 2 x Hel an nternational ata Use wor shop for all ata pro ucers an users an National HM ta ehol er coor ination meetings x raine all istrict iostatisticians an HM focal persons from lower level health facilities in istricts health wor ers in the revise ntegrate HM tools x Ac uire a server for H an HM ata management x mprove the MoH internet ban wi th from M to M with e tension of nternet connectivity to remote sites of the MoH Chemotherapy an eprosy programmes x e esigne of the MoH website to allow for faster navigation an up ate information access a ress www health go ug ain c a enges 2 x Un er staffing both in number an s ills mi given the increasing eman on the esource Centre H PP M H ata warehouse Enterprise Architecture tan ar s Co es etc x Un er fun ing to implement all activities relate to the man ate x na e uate provision of Health ata capture tools for HM x nability to capture health ata in the HM from private practitioners x ac of a Corporate Anti irus to safe guar all Ministry e uipment A n n u a l H e a l t h S e c t o r P e r f o r m a n c e R e p o r t 2 0 1 0 / 11 139 Recommendations or ann a p an 2 2 x ncrease fun ing to a ress the challenges towar s a successful implementation as outline above the carrying out ata uality assessments continuous mentoring an s ill improvement in ata han ling an management etc x aster restructuring process to review the numbers of staff an s ills mi re uire given the increase wor loa an e pectations of the esource Centre as it is a cross cutting ivision supporting the entire sector x Provision of a Corporate Anti irus to safe guar all Ministry e uipment Quality and timely data is essential for knowledge management. The sector revised the HMIS and trained Health Information Assistants. There is need to increase access to IT services to all districts so that timely data is submitted and feedback given. Use of data is still a problem and therefore health workers at all levels need to be trained in use of information for decision making. 3.4.6 Quality of Care he H P emphasi es the provision of high uality health services by all his is ensure through regular supervision inspection mentoring uality improvement interventions an establishment of ynamic interactions between health care provi ers an consumers of health care with the view to improving the uality an responsiveness inclu ing gen er responsiveness of health services provi e Core SSI indicator x clients e pressing satisfaction with health services waiting time Lead programme indicators x Appropriate stan ar s gui elines an tools evelope an isseminate x Proportion of planne support supervision visits that are carrie out x National Quality mprovement ramewor an trategic Plan operational x Mechanism for client right hol ers re ress establishe an operational Ann x x x 140 a p an 2 top indicators tan ar s an gui elines evelope tan ar s an gui elines isseminate upport supervision provi e to ocal overnments an referral hospitals A n n u a l H e a l t h S e c t o r P e r f o r m a n c e R e p o r t 2 0 1 0 / 11 Ac ie ements x aunche the Ugan a Clinical ui elines UC an Patient Charter an isseminate an copies respectively to all istricts x n process of finalising the nfection Control an Prevention gui elines an the a iation an maging gui elines x Area eam visits con ucte covering all egional eferral Hospitals an the ocal overnments focusing on the H s public an private general hospitals an HC s x inali e raft for the National uality improvement framewor an trategic Plan x evelope concept notes for evelopment a national hospital accre itation system an evelopment of a comprehensive supervision monitoring an inspection system an submitte for procurement of consultancy services x evelope terms of reference for client satisfaction survey an procurement of consultant initiate un er the UH P x tu y on Quality mprovement in Palliative Care in Mayuge an Namutumba istricts New orn Care in Masa a an uwero istricts Patient nvolvement in yen o o asese ibale Hoima yan wan i Masin i yegegwa an abarole istricts Pilot stu y con ucte on Chronic Care Mo el in ui we ongoing with support from U A Health Care mprovement Pro ect x ai en QM strengthening supporte by CA implemente in istricts with focus on improvement of the wor place environment ain c a enges x na e uate late release of fun s at all levels of health service x ac of logistics e g soun means of transport fuel etc an a e uate number of personnel in local government to con uct effective support supervision an monitoring x Un er staffing in the health sector Recommendations or ann a p an 2 2 x Mo PE to increase fun ing for the health services x MoH to provi e logistical support for support supervision x mprove staffing at all levels A national client satisfaction survey was not carried out to determine the level of satisfaction with health care service. The revised Uganda Clinical Guidelines were distributed in both soft and hard copies to ensure provision of expected essential clinical care services especially at primary health care level patient charter disseminated in all districts. Quarterly support supervision visits were carried out to all LGs focusing on the DHOs, hospitals and HC IVs. Observed improvement in areas of focus during follow up visits and impromptu inspection visits. Staff attendance of duty is noted to have improved. Due to inadequate funding, lack of supervision guidelines and skills, LGs are not carrying out regular supervision of lower level health facilities. The MoH should build capacity of LGs to carry out effective supervision. A n n u a l H e a l t h S e c t o r P e r f o r m a n c e R e p o r t 2 0 1 0 / 11 141 Development Partners are supporting implementation of quality improvement initiatives in most of the districts and QAD developed the National Quality Improvement Framework and Strategic Plan aiming at harmonization and institutionalisation of quality improvement. 3.4.7 Health Policy, Planning and Support Services eview an evelop relevant Policies Acts an regulations governing health which are gen er responsive an human rights compliant an to ensure their enforcement Currently there are several obsolete laws an regulations in the sector that re uire revision in or er to better ensure the en oyment of the rights they are suppose to support E amples inclu e the Public Health Act the oo afety Act an the Mental Health Act he Policy Analysis Unit in the MoH an Health Professional Councils are responsible for strengthening the legal an policy environment con ucive for the elivery of the minimum health care 3.4.7.1 Policy Analysis Lead programme indicators x Number of policies reviewe an evelope Ann a p an 2 top indicators imp ementation x Policy review meetings hel x Health relate policies an regulations reviewe x Emerging health issues con itions an therapeutic interventions that re uire new legislation an policies i entifie ain ac ie ements 2 x A report complete NH x policy ocument PPPH rea y for submission to Cabinet x eviewe the Mental Health ill x eviewe the Malaria strategic plan ain c a enges x Un erstaffing x ac of official communication e uipment mechanisms x low No fee bac on presente papers ransport telephone Recommendations or ann a or p an 2 2 x eview of obsolete policies health laws x Capacity for activity costing built 142 A n n u a l H e a l t h S e c t o r P e r f o r m a n c e R e p o r t 2 0 1 0 / 11 The degree of contribution of the Policy Analysis unit to the health sector policy review and development was minimal. The plan was to review at least 2 policies quarterly but only 3 out of 8 were reviewed. The Policy Analysis Unit needs to identify the obsolete laws and regulations in the sector and develop a plan for review. The Policy Analysis unit needs to facilitate coordination of policy development in MoH and other related sectors to ensure harmonization and mainstreaming of health issues. 3.4.7.2 Planning he aim of planning is to ensure efficiency in resource allocation management an utili ation Core Indicators x eneral overnment allocation for health as of total government bu get Lead rogramme Indicators x evelopment of a health financing strategy by une x overnment per capita e pen iture on health increase to by Ann a p an 2 top indicators imp ementation x Annual wor plan evelope x Annual performance report x oint review report x PPPHC report x perationalise the NH x Capacity buil ing for all istricts in health services planning an management x inali ation of the National Health nsurance operationali ation frame wor bill x echnical review report x Efficiency stu ies con ucte x x x x ain ac ie ements 2 Con ucte an launche the NHP an H P Annual report pro uce Con ucte the oint eview Mission uilt the Capacity of the secretariat an as ermany an ra il orce in health insurance in outh orea A n n u a l H e a l t h S e c t o r P e r f o r m a n c e R e p o r t 2 0 1 0 / 11 143 x x x x x x x x echnical analysis an review of the esign of the scheme by the as orce sta ehol ers an other collaborating partners P H orl an H overnments of ermany wit erlan an rance egional sensiti ation on the NH was carrie out in the East with istrict representatives of the istricts in eso egion ororo egion an ugisu egion Efficiency stu y con ucte ain c a enges 2 he sectoral coor ination role by the planning ivision is not matche with the resources inclu ing the time available E pansion on the number of istricts not matching the resources an technical support for planning ectoral policies an strategies which are not evi ence base an researche especially in the conte t of eterminants of health imite capacity of local institutions to han le the eman an supply si es of NH Abolition of user fees in publicly owne health centres an general wings of hospitals poor uality of care pose both policy an operational ilemmas Recommendations or ann a p an 2 2 x Establish a regional tier of a ministration an management for health services as a strategy to strengthen oversight planning an management functions x oll out of the Health Economics an ystems nstitute policy x Carry out further technical stu ies especially in the area of human resources an NH All planned workplans and reports were produced by all levels. Regional planning meetings were conducted as planned. Other planned activities like the Technical Review Mission and operationalisation of the NHIS were not achieved due to inadequate resources including time. The increasing number of districts neutralizes all efforts in increasing funding to local governments because of the increasing administrative costs and also stretched the central level in their oversight role. Establishment of a regional tier of administration and management for health services should be prioritized. 3.4.7.3 Finance and Administration Services he epartment of finance an a ministration is compose of a Minister s ffices b enior op Management P H irectors offices c A ministration ivision Accounts ivision e Personnel ivision f Procurement an isposal Unit g nternal Au it h C Unit 144 A n n u a l H e a l t h S e c t o r P e r f o r m a n c e R e p o r t 2 0 1 0 / 11 esponsible for provi ing political irection giving policy gui ance an ren ering support services to enable the Ministry fulfil its man ate of provi ing uality an e uitable preventive an curative health services to public 3.4.7.4 Ministerial and Top Management Ann a p an 2 indicators x ssue wee ly press statements to isseminate the ministry s strategies to improve Health Care Management x nspect the elivery of health services in Hs an eneral Hospitals x Hol monthly press conferences to up ate the public on the efforts of the ministry to improve health service elivery x Monitor me icines istribution storage allocation recor s an ispensation system in istricts x upervision of PHC activities in istricts uarterly x Monitor the functionality of HC s an HC s in istricts uarterly x upport supervision of H s in istricts uarterly x x x x x x x x ain ac ie ements 2 ssue press statements on the outbrea of Ebola Hepatitis outbrea in asese an the crac own on illegal Private Health institutions nspecte service elivery in Hs an eneral Hospitals Hel press conferences to up ate the public on the Ebola outbrea orl Mi wifery ay orl Malaria ay an epro uctive Health nspecte the management of me ical supplies in several istricts upervise PHC activities in several istricts Monitore the functionality of HC s an s in the istricts i support supervision of H activities in all the regions Manage to re furbish the Hon Minister s office Ministerial and Top Management was actively involved in providing political direction, giving policy guidance and monitoring service delivery. A n n u a l H e a l t h S e c t o r P e r f o r m a n c e R e p o r t 2 0 1 0 / 11 145 3.4.7.5 Administration and support services Ann a p an 2 indicators x Prepare an submit activity an financial reports for all the uarters st n r an th to M PE x Prepare an submit to PAC responses to all ueries raise on the accounts of the ministry for financial year an x nspect the utili ation an accountability for PHC rants in the istricts x nspect the utili ation of the evelopment u get in Hs x Ensure all the outstan ing financial a vances are accounte for x nspect an assess the stan ar s of financial boo eeping maintenance of accounting recor s an a herence to financial regulations an proce ures in the istricts x nspect the utili ation of salaries for interns in Hs x Pay all staff emoluments in time x Enter rame or Contracts with provi ers for procurement of vehicle repair services tyres as well as clearing an forwar ing services x Coor inate the organi ation of public events observances that fall within the uarter for e ample orl Health ay orl e Cross ay nternational Nurses ay an orl Chil ren s ay x Payroll monitoring in Hs x Complete an submit Cabinet Memoran a x x x x x x x x x x x x x x ain ac ie ements 2 r an th uarter prepare an submitte to Activity an financial reports for the st n M PE esponses to ueries raise in Au it eports for an the Management letter of the Au itor eneral prepare an submitte to PAC an Au itor eneral respectively nspecte utili ation of an accountability for PHC rants in all the regions nspecte utili ation of the evelopment bu get in Hs All staff salaries for the months fully pai in time rame wor contracts for procurement of stationery tonner an news papers approve MCC while those for motor repairs will be rea y in the first uarter of orl Health ay orl e Cross ay nternational Nurses ay an orl Chil ren s ay orl Environment ay orl No obacco ay were observe Manage to install the CC cameras for security eamwor greatly improve in the P U he P E is up to ate with most of the PP A reports nitiation of the health sector procurement forum Complete a number of framewor contracts e g stationery toners hotels a vertising Pilote a mini procurement trac ing system egistere goo rating in the Procurement Performance Measurement ystem by PP A 146 A n n u a l H e a l t h S e c t o r P e r f o r m a n c e R e p o r t 2 0 1 0 / 11 x x x x x x x x x x x x x he P E has not lost a single A ministrative review eplace the van ali e computers on the th floor a or c a enges Unforeseen unbu gete but important an urgent e pen itures ac of access to the M by staff who are ey in the processing of payments ncomplete an irregular financial re uisitions from staff Poor an elaye accountability from staff rresponsible han ling of ueries raise by oversight an accountability agencies of overnment elays in submission of procurement plans an performance reports by user epartments re uent interruptions an brea own of the M User epartments o not a here to Procurement Plans an PP A egulations ate initiation of procurements elaye procurement evaluation processes na e uate office space The Administration and Support Services units rendered services to enable the Ministry fulfil its mandate however delays in some areas like procurement affected implementation of planned activities especially in capital development projects. The lack of space led to delay in settling in of new officers and affects coordination within departments. There is urgent need to reorganise and reallocate office space to improve efficiency in service delivery. 3.4.8 Legal and Regulatory Framework Appropriate legislation an its enforcement provi e an enabling environment for operationali ation of the policy an the H P an are essential for an effective health service elivery system he Health Professionals Councils are responsible for x trengthening the legal an policy environment con ucive for the elivery of the minimum health care pac age x Promoting enforcement observance an a herence to professional stan ar s co es of con uct an ethics Lead rogram Indicators x Number of relevant international legal instruments on health that have been omesticate x Number of law enforcers traine in new legislation an policies to ensure implementation of legislation an policies x An effective regulatory environment an mechanism evelope x An a e uate an functional staffing structure of Professional councils establishe over the ne t five years x A oint Professional Council with ecentrali e supervisory authorities establishe an operationali e over the ne t five years A n n u a l H e a l t h S e c t o r P e r f o r m a n c e R e p o r t 2 0 1 0 / 11 147 3.4.8.1 Uganda Medical and Dental Practitioners’ Council Ann a an or 2 2 x o register an license ualifie practitioners an all private health units that meet the re uirements of the Council x o con uct regular inspection of private clinics in ampala area an up country x o evelop gui elines for CP for practitioners with a view to ma ing CP more accessible x o con uct uarterly istrict supervision x o investigate all reporte cases of allege professional miscon uct an ta e appropriate isciplinary measures x x x x x x x a or Ac ie ements nspecte Health units in ampala area nspecte Health units upcountry his was one in collaboration with other Professional Health Councils orme an ensiti e the istrict upervisory Authorities in istricts in Northern an Eastern egions his was one in collaboration with other Professional Health Councils he Council has establishe a functional Me ical icensure an E aminations oar which has con ucte two roun s of e amination for oreign traine octors he Council has an establishe web site www um pc com an publishe the egister of Practitioners with Annual icenses in Newspapers Complete oint inspection an accre itation of all East African Me ical an ental chools together with other East African Me ical an ental Councils Complete the raft proposal on establishment of National Health Professions Authority an the report submitte to the Permanent ecretary orme an riente the nterim CP Accre itation Committee a or C a enges x na e uate staffing at the Council especially the nspectorate x na e uate transport Council has very ol vehicles x oophole in the law to enforce Council ecisions Recommendations or ann a p an 2 2 x Council must review the Act so as to enable it implement its man ate effectively x Ministry of Health shoul assist the Council ac uire see money to buil its Hea uarters x Ministry of Health shoul secon ey staff to Council to enable it operate fully 148 A n n u a l H e a l t h S e c t o r P e r f o r m a n c e R e p o r t 2 0 1 0 / 11 3.4.8.2 Uganda Nurses and Midwives Council Ann a p an 2 top indicators Imp ementation x egistration an enrolment of nurses an mi wives x echnical support supervision of health facilities an health training institutions x nspection an approval of the new schools for nursing an mi wifery x Con ucting continuous professional evelopment CP programmes x ensiti ation of the Nursing Mi wifery on ethical co e of con uct ain ac ie ements x evelope a ive year trategic Plan x trengthene the registration enrolment of Nurses an Mi wives who successfully complete their courses of stu y x nspecte Health acilities H s an Health raining nstitutions H s x x x x ain c a enges na e uate resources finance staff e uipments an transport Many mushrooming illegal Nursing Mi wifery schools orgery of aca emic an professional certificates imite office space Recommendations or ann a p an 2 2 x nspect chools Universities inten ing to open up Nursing an Mi wifery training programmes x nspect practicum areas for the training of nurses mi wives to assess suitability x trengthen the Enroll an egister Nurses Mi wives traine within an outsi e the country x Con uct a nationwi e inspection of health facilities to assess their legality an capacity x trengthen collaboration with various sta e hol ers both within an outsi e the country x Establish istrict upervisory Authorities A in selecte istricts x ecentrali e some of the council services through the establishment of regional centres x Complete the review of the UNMC Act x rgani e a sta ehol ers meeting to streamline issues relate to regulation x trengthen communication an information sharing through the establishment of a web 3.4.8.3 Uganda Allied Health Professionals Council Lead programme Indicators x All legible Allie Health Professionals registere x All reporte cases of Malpractice investigate an isciplinary action ta en x All Allie Health Professionals issue with annual practicing licenses A n n u a l H e a l t h S e c t o r P e r f o r m a n c e R e p o r t 2 0 1 0 / 11 149 Ann a p an 2 top indicators x Number of Allie Health professionals registere x Number of Allie Health units license x Number of Annual practicing licenses issue x Number of health facilities an training schools inspecte to access uality service x Number of cases of unprofessional con uct investigate x Minutes of Council an Committee meetings con ucte x eports of monthly uarterly an annual performance submitte x Number of CP meetings con ucte x Number of upport supervision visits con ucte x Number of regional offices establishe x Number of istrict an regional supervisors appointe x x x x x ain Ac ie ements 2 egistere professionals renewe Annual Practicing licenses an license clinics nspecte new Allie Health raining nstitutions nspecte private health facilities in central an western regions Establishe istrict supervisory Authorities in Eastern an Northern regions ensiti e Chief A ministrative fficers CA s istrict Health fficers H s an Me ical uperinten ents on renewal of Annual practicing licenses in central an Eastern regions ain c x Un x ac x na a enges 2 erstaffing of soun vehicles to carry out inspection in all health units e uate office space Recommendations or ann a p an 2 2 x Establishment of Allie Health Professionals egional ffices x E pan ing the ecretariat by appointing egional upervisors Accountant A ministrative officer x enting an office outsi e Ministry of health Hea uarters to accommo ate the new officers 3.4.8.4 Pharmacy Council Lead rogram Indicators x Number of pharmacy stan ar s enforcement visits an oint HPCs activities inspections carrie out 150 A n n u a l H e a l t h S e c t o r P e r f o r m a n c e R e p o r t 2 0 1 0 / 11 x x x x Numbers of newly ualifie pharmacists egistere eturn of the Pharmacy Profession an Pharmacy Practice ill to Parliament a ette registere Pharmacists Coor ination of internship training for pharmacists Ann a an 2 imp ementation Indicators x Number of practice units visite an supporte technically x Number of pharmacists registere ga ette or e ga ette x Number of internship meetings an activities participate in or coor inate x Number of meetings hel to fine tune the Pharmacy Profession an Practice ill Ac ie ements x ne University training pharmacy stu ents visite x Pharmacy oar members appointe x ogether with other Health professional Councils establishe the istrict Health supervisory authorities in Mbale ulu ira Amolatar o olo amuli ororo an ganga istricts an ointly evelope a proposal for the Establishment of the NHP A x egistere newly ualifie pharmacists uring the perio x Carrie out oint Health professional Councils inspection of private health facilities an refle ology units in ampala ain C a enges x ragmente an wea regulatory frame wor ¾ elays in Enacting the Pharmacy Profession an Pharmacy Practice ill ¾ ifficulty in implementing the provisions of the Pharmacy an rugs Act x na e uate esources ¾ inances ransport an other logistics ¾ Human esource shortages x imite numbers of internship training centers an supervisors hin ering the inta e an the training of intern pharmacists yet the numbers of interns are increasing yearly as the private public schools release them into the mar et Recommendations x Ministry of Health to e pe ite the return of the pharmacy bill to parliament x More fun s be allocate for Pharmacy Council activities for improve uality of pharmaceutical care x here is nee for affirmative action in the training an eployment of Pharmacists an nterns x MoH shoul e pe ite the process of establishing the propose NHP A which will offer a itional fun ing opportunities A n n u a l H e a l t h S e c t o r P e r f o r m a n c e R e p o r t 2 0 1 0 / 11 151 During the year under review all Professional Councils were vibrant and worked towards streamlining enforcement and providing an enabling environment for effective health service delivery. The Councils were able to jointly form and sensitize the District Supervisory Authorities in 20 Districts in Northern and Eastern Regions; and submitted a proposal for establishment of a National Professions Authority. The Councils need to be strengthened in terms of human resource to cater for the big workforce. 3.4.9 Research 3.4.10 Uganda National Health Research Organisation he health sector aims at creating a culture in which health research plays a significant role in gui ing policy formulation an action to improve the health an evelopment of the people of Ugan a he UNH is responsible for coor inating all the health relate research in Ugan a Lead programme indicators x A policy an legal framewor for effective coor ination alignment an harmoni ation of research activities evelope by x A prioriti e national research agen a evelope by x nstitutions involve in con ucting research i entifie by Ann a p an 2 top indicators imp ementation x National research priorities coor inate an evelope x esearch aligne an harmonise x Consultative meetings carrie out in selecte istricts x nventory of research researchers an research institutions evelope x evelop the strategic plan an stan ar operating manuals ain ac ie ements 2 x nventory of esearch nstitutions being collate together with in ivi ual researchers inventories ongoing x raft report on research priorities for health available for further iscussion x or shop with Parliamentarians iscusse policy options for increasing access to s ille atten ance for chil elivery hel in une hree options were iscusse a e pan ing elivery services to HC b use of nursing assistants an c promoting waiting homes near hospitals 152 A n n u a l H e a l t h S e c t o r P e r f o r m a n c e R e p o r t 2 0 1 0 / 11 x x research articles cleare an permission given for their publication nception report for strategic plan only evelope ain c a enges 2 x iscussions are continuing with the sta ehol ers on fun ing to operationali e the Act No fun ing yet has been allocate to Act During 2010/11 FY UNHRO started the process of developing an inventory of research, researchers and research institutions. An inception report for the UNHRO strategic plan and standard operating manuals are under development and is expected to guide the alignment and harmonisation of research activities in future. Funds should be allocated for operationalizing the UNHRO Act. 3.4.11 Natural Chemotherapeutics Research Institute (NCRI) he NC formerly Natural Chemotherapeutics esearch aboratory is a research an evelopment centre un er the UNH create by an act of parliament the UNH Act he institution is man ate to carry out research on natural pro ucts plants animal parts an minerals an the use of tra itional metho s in the management of human isease he institute un erta es the research an evelopment of uality natural pro ucts an services for improve health care elivery by applying both in igenous an mo ern scientific technologies Ann a p an 2 top indicators imp ementation x Ethno botanical an ethno pharmacological ata collection x evelopment of stan ar s for oo agricultural Practices Practices MP for me icinal plants an herbal me icines x raining x aboratory an fiel evaluation of selecte herbal formulae x Hol th African ra itional Me icine ay AP an oo Manufacturing ain ac ie ements in Y 2 2 x Ethno botanical an ethno pharmacological ata on selecte me icinal plants collecte an authenticate from abale an o olo istricts he selecte plants were a e to the establishe me icinal plants gar ens in the respective istricts tu ies to optimi e the use of Natural pro ucts in the management of priority iseases initiate tan ar i ation of herbal formulae baseline stu ies on the effects of a formula evelope for elimination of iggers carrie out in selecte areas in ganga istrict families participate in the semi fiel trials Partnerships with tertiary institutions establishe preliminary plans to etermine re uirements for establishing a me icinal plants gar en for arham University carrie out x evelopment of stan ar s for oo Agricultural Practices AP an oo Manufacturing Practices MP for me icinal plants an herbal me icines was one through support to A n n u a l H e a l t h S e c t o r P e r f o r m a n c e R e p o r t 2 0 1 0 / 11 153 x x x ra itional Health Practitioners HP s who un ertoo the initiative after un ergoing training by the institute raining staff un erwent training in professional evelopment staff members traine in pro ect management staff traine in customer care staff traine in recor s management staff traine in report an minutes writing staff traine in bioinformatics staff in pharmaceutical an rational rug use staff traine in ra itional Chinese me icine techni ues an applications stu ents from tertiary institutions inclu ing Ma erere University Mbarara University of cience an echnology an yambogo University traine in laboratory investigative techni ues aboratory an fiel evaluation of selecte herbal formulae phytochemical analyses of formulae me icinal plants carrie out pharmacological an to icological evaluation of herbal formulations carrie out stan ar i ation of Herbal anti ote for poisons is ongoing an authentication of ata on me icinal plants collecte is ongoing he th African ra itional Me icine A M ay was hel in o olo istrict preparatory meetings symposium publicity on local M station an publication of a news supplement in the Monitor News paper were one as part of mar ing the ay ain c a enges in Y 2 2 x he very lengthy procurement process has ren ere most of the planne research wor ifficult to complete on time Procurement of speciali e research re uirements li e reagents an bio specimens has also hin ere wor because of the rules for pre ualification an the volumes of supplies being sometimes small for suppliers to honour x elaye release of fun s to implement the planne outputs has resulte in late wor an sometimes not in the efine uarters resource flow nee s to be streamline to enable timely implementation of planne out puts x he available space at the institute is ina e uate for all the research activities the institution un erta es here is nee for e pansion of the facilities Recommendations or ann a p an 2 2 2 x ormali e partnerships collaborations with sta ehol ers iome ical wor ers HPs patients stu ents tra ers in herbal me icines an other sta ehol ers x evelop a ra itional Me icines programme o operationali e e isting tra itional me icine centers upgra ing of NC infrastructure support networ buil ing in the process chain evelopment of herbal me icines an Natural pro ucts x trengthen collaboration with international sta ehol ers in Natural pro ucts research NAP ECCA A NAP an E A AMA x ptimi e use of Natural pro ucts an tra itional health systems in management of priority iseases The NCRI implemented most of the planned activities despite challenges of lengthy procurement processes and delayed release of funds resulting in late implementation. There is need to develop an IEC program for promotion of the use of natural products and traditional health systems as complementary to the conventional health systems. 154 A n n u a l H e a l t h S e c t o r P e r f o r m a n c e R e p o r t 2 0 1 0 / 11 3.4.12 Uganda Virus Research Institute (UVRI) U is a semi autonomous un er UNH he nstitute s broa mission is to carry out scientific investigations concerning communicable iseases especially viral iseases of public health importance an to a vise government on strategies for their control an prevention Lead programme indicators x Number of iseases monitore x Number of outbrea s investigate x Number of interventions evelope Ann a p an 2 top indicators imp ementation x aboratory surveillance of measles A P influen a illnesses H an syphilis carrie out x HCs an homes monitore an surveillance carrie out for plague an vectors x Number of interventions un er stu y x Number traine to buil capacity in vector biology x x x x x x x x x x x x x ain ac ie ements 2 aboratory surveillance of measles A P H an syphilis carrie out HCs an homes monitore an surveillance carrie out for plague an vectors health facilities in est Nile monitore for influen a illnesses ata analysis is ongoing to etermine prevalence of H an syphilis in ANC samples Provector evice place in oors to ill Anopheles mos uitoes in ran omly selecte houses in ombe an Mwaalo villages Msc stu ents traine to buil capacity in vector biology entification of larvici es to control malaria ver isolations ma e rant application submitte for baseline entomological surveys on the islan s of a e ictoria in preparation of release of MM in Ugan a grant applications evelope an submitte Characteri ation of larval pathogens an eveloping molecular tools for stu ying the population biology of mos uitoes of genus Mansonia a vector of arboviruses ain c a enges 2 ac of fun s to carry out fiel activities No fun s were provi e for office supplies with outstan ing bills for utilities elying heavily on grants an cooperate agreements o motivate all staff to embrace the culture of research A n n u a l H e a l t h S e c t o r P e r f o r m a n c e R e p o r t 2 0 1 0 / 11 155 Disease monitoring, surveillance, investigation of outbreaks and interventions are carried out periodically despite the inadequate government funding to UVRI. Research is heavily reliant on grants and cooperative agreements and this is unsustainable. Government should motivate all staff to embrace the culture of research by first adequately supporting existing research institutions to carry out their mandate. 3.4.13 Public Private Partnership for Health he MoH encourages an institutionali e the involvement of the private sector in the provision of preventive promotive an curative health care to all Ugan ans through the public private partnership approach he PPPH effectively buil s an utili es the full potential of the public an private partnerships in the health sector Lead programme indicators x he National Policy on PPPH is approve by the Cabinet by x Number of istricts which have evelope a oint public private istrict Health Plan x Number of istricts in which PHP sub sector contributes to the HM Ann a p an 2 top indicators imp ementation x Number of PPPH ecisions implemente x Number of istricts pro ucing integrate health wor plans with private sector sta ehol ers x Proportion of bu gete U subsi y to private sector that is a vance to PN Ps x x x x x ain ac ie ements 2 he raft policy ocument has been finalise one year ago but with the failure of approval of the national Policy on PPPH the Partnership stagnate ive egional or shops to isseminate the National Policy at istrict level has been con ucte An orientation wor shop was organi e for the twenty Pilot istricts t was atten e by H s istrict es fficers for PPPH iocesan Health Coor inators an relevant representatives of the public an private sector at central an istrict level wenty pilot istricts receive furniture an computer e uipment by the talian Cooperation an the Health nitiative for Private ector U A which provi e to strengthen the PPPH istrict es fficers A number of planning sessions were con ucte in five pilot istricts he sessions consiste in the formation an orientation of the PN P an PHP Coor ination Committee for the in a Moroto Mbarara ort Portal ulu Mbale Mpigi Mityana yen o o asese Na asongola 156 a iso a ai Hoima Arua A n n u a l H e a l t h S e c t o r P e r f o r m a n c e R e p o r t 2 0 1 0 / 11 x x x x x x istrict an a Public Private istrict planning e ercise to formulate a oint integrate istrict plan involving private sector sta ehol ers he on PPPH has improve its efficiency an the number of meetings con ucte uring the year he is now chaire by the irector of Health ervices P who has provi e his a itional competences an technical input to the or ing roup he on PPPH has iscusse important aspects of the Partnership with the ob ective to finali e the submission of the raft National Policy on PPPH to the Cabinet an evelop a MoU governing the Partnership between the public an private sectors two ma or actions liste among the th M resolutions he has finali e a new list of beneficiaries for the PN P facilities which will access a cre it line for rugs ma e available by AN A Criteria for up ating the list every year were iscusse an agree while the iscussion is still ongoing on the criteria for inclusion of PHP facilities an N PN P he starte wor ing on the allocation formula for the government subsi ies ain c a enges 2 ecuring a certificate of financial implications for the national Policy on PPPH too an abnormally long time affecting timely approval of the policy ac of an e plicit formal contractual arrangement between PN Ps an U poses continue allegations on misuse of public subsi ies by PN Ps Continue with hol ing of U subsi y to PN Ps by istrict officials an estimate billion shillings was not passe on to PN Ps by istricts imite progress on securing the million ollar private sector financing facility from the nternational finance Corporation ue to absence of an approve PPPH policy framewor Recommendations or ann a p an 2 2 x Cabinet shoul e pe ite approval of the National Policy on PPPH to boost resource mobili ation for PPPH x inali e the raft mplementation ui elines for the National Policy on PPPH an roll out the policy framewor countrywi e x raft an sign an e plicit formal contractual agreement between the U an recipients of public subsi ies for health care The prolonged process (over two years now) of approving the PPPH policy has derailed the momentum the sector had gained towards institutionalization of the PPPH. Nevertheless the MoH has established good collaboration arrangements with the PNFP providers and needs to extend to the PHP sub-sector especially in providing information through the HMIS. A n n u a l H e a l t h S e c t o r P e r f o r m a n c e R e p o r t 2 0 1 0 / 11 157 3.4.14 Health Services and Health Status in Recovery Areas 3.4.14.1 Northern Uganda Action Fund (NUSAF2) support to Health Sector ain ac ie ements 2 he NU A for Community nfrastructure ehabilitation C approve an fun e pro ects un er the Health ector in of the istricts in the region he total approve pro ect amount is M an out of this M has been release to the istricts he ma or beneficiary istricts are u wo an Nebbi with an subpro ects respectively he pro ects cover construction of staff houses an P latrines u wo is constructing staff houses Nebbi staff houses ata wi an yam staff house each an Apac an umbe P latrine each Ta e SA 2 s pport to ea t Sector 2 istrict No of ubpro ects otal u get U Amount U st rance Apac u wo ata wi Nebbi yam umbe A 2 Note able summarise from NU A ector C approve an fun e pro ects un er the Health ain c a enges 2 he upta e of NU A investment in the Health sector has been very minimal compare to other sectors as e hibite by only istricts benefiting out of istricts entitle NU A an P P resources are community eman riven t has been reporte that the Health sector has not create a e uate eman 158 A n n u a l H e a l t h S e c t o r P e r f o r m a n c e R e p o r t 2 0 1 0 / 11 Recommendations for annual plan 2012/13 Un er NU A the health sector still has opportunities to access health financing for most of the nee e infrastructure evelopment especially staff housing construction o achieve this there is nee to imme iately revitalise the lin ages between the NU A an Health ector at the national an ocal overnment levels A rapi infrastructure gap analysis with a view of i entifying the most critical areas of support shoul be con ucte to fee into proposals for NU A support 3.4.14.2 Karamoja Region Bac gro nd to aramo a Region aramo a region is locate in the North Eastern part of Ugan a an is home to the following ma or ethnic groups the ie o ora o oth Matheni o an the hur he region s population of ust over people mainly practices agro pastoralism he region is compose of seven istricts namely Moroto Napa Amu at Na apiripirit oti o aabong an Abim or eca es aramo a region suffere generali e inter communal violence insecurity fuele by cattle rai ing proliferation of small arms lac of water for animals an recurrent foo insecurity ecause of these bac groun characteristics the region remains the remotest an least evelope in the country with high levels of househol poverty illiteracy low access to uality social services an high levels of morbi ity an mortality Un er five mortality in aramo a is higher than the national average of live births while maternal mortality ratio is higher than the national average of live births U The Health System in Karamoja Region The health system in Karamoja is comprised of 101 formal health facilities, about 2,987 VHTs of which 99% have been trained, 10 Health Sub Districts, 7 District Health Offices and a host of development partners. There is 1 Regional Referral Hospital, 4 General hospitals, 4 Health Center IV’s, 33 Health Centre III’s and 59 Health Centre II’s. The recent past has seen increased interest by the central government and development partners to revamp the region’s development. Districts have benefited in the following key areas; human resources for health, infrastructure, health information systems, equipments and service delivery. Sectoral governance and stewardship is also being strengthened to enhance planning, implementation, supervision, monitoring and evaluation of services. Some of the key development partners involved in strengthening the health sector in Karamoja are but not limited to; WHO, UNICEF, Italian Cooperation, Doctors with Africa CUAMM, International Rescue Committee, Faith Based Organizations, Action Contre La Faim, MSF and CESVI. In 2010, regional partners working under the auspices of the “ALIVE” partnership of UNICEF commissioned a study titled “Comprehensive health facility functionality assessment for Karamoja”. This assessment was carried out by CUAMM with contributions from all the key A n n u a l H e a l t h S e c t o r P e r f o r m a n c e R e p o r t 2 0 1 0 / 11 159 stakeholders at all stages. It covered key input, process and result areas of all the six, WHO proposed, health systems building blocks. The study results show that; 94% of the units had management committees of which 99% had “expired”, 66% of the facilities had not done any single staff meeting in a quarter and 50% of them had no copies of their own annual work plans, only 14% and 29% of midwifery positions at HCII, and HCIII levels were filled. All-type cadre absenteeism rate was 22.5% although this rate was as high as 45% among HCII’s in Abim. Stock out rate for the 6 tracer medicines was registered at 77%. Close to half of all vaccine “containing” facilities never updated temperature control charts for the week prior to the survey. About 40% of the facilities failed to submit monthly HMIS reports timely to the HSD. Majority of the in charges could not readily estimate or identify the facility’s total income and expenditure for the previous financial year-no clear records. The referral system is impeded in decreasing order by lack of transport and communication capabilities (90.8%), financial constraints (5%), difficulties in making definitive diagnosis (2%) and insecurity (2%). 10% of the HCIIs were able to provide between 4 to 6 of the basic EMOC signals functions while only 15% of the HCIIIs could provide all the 7. A number of HCIIs registered more than 3 deliveries per month. 2 of the 4 HCIVs do not provide the complete package of comprehensive EMOC signal functions. Health sector interventions in Karamoja region Health sector partners in Karamoja are increasingly making deliberate attempts to improve health systems performance through investing in infrastructure, human resources, health information systems, governance and service delivery. Such investments and expected results thereof are being followed up through regular regional and district level review meetings. These quarterly meetings (besides the monthly districts level health sector working group meetings) are meant to help partners compare notes, share lessons and collectively identify areas of continued need. Apart from providing technical support to District Health Teams in all the 7 districts, CUAMM is passionate about making these fora ever meaningful. Some of the key systems strengthening interventions in the region include; 1. Strengthening health systems governance through meaningful and regular planning and review meetings among stakeholders and collaborative supervision of service delivery. 2. Building of a reliable health information system with demonstrable improvement in information collection, reliability, storage, retrieval, analysis, reporting and use. 3. Development of human resources for health; training and recruitment of staff. For example, CUAMM recruited 24 health workers for hard to reach facilities including 3 medical doctors and 21 nurses most of whom demonstrated good skills in midwifery. Most of these personnel have since been absorbed into the district pay rolls. CUAMM is currently supporting Matany nurse training school in various areas and implementing a UNICEF supported scholarship program that is meant to generate 90 personnel annually. 160 A n n u a l H e a l t h S e c t o r P e r f o r m a n c e R e p o r t 2 0 1 0 / 11 4. Infrastructure development; building and rehabilitation of staff houses, theatres, drug stores, maternity rooms, and water systems. 1 district drug store built in Kotido and a 2 in 1 staff house constructed in Kaabong in the Ik land of Morungole. 5. Research; operational research was carried out on the functionality of health facilities, nutrition assessment and disease surveillance. 6. Service delivery; planning, implementation and supervision of both static and outreach services. Hard to reach areas were served through integrated outreaches whose package included Immunization, ANC plus (includes PMTCT) and general clinical care. 7. Establishment, training and tooling of VHTs-UNICEF, WHO, IRC and CUAMM are taking the lead in this process. 100% coverage of villages with trained VHTs already attained. Results of interventions Districts in Karamoja registered an overall 15% improvement in district league posiƟons over the period 2006/7 to 2009-10 (annual health sector performance reports). Figure 14 shows that the region registered a steeper increase in total district league scores than the naƟonal average while Įgure 15 shows that Abim, KoƟdo and Moroto contributed greatest to this regional trend. Figure 14: Total average district league scores districts for Uganda and Karamoja region A n n u a l H e a l t h S e c t o r P e r f o r m a n c e R e p o r t 2 0 1 0 / 11 161 Figure 15: istrict league scores Karamoja Positive changes were registered in the following district league indicators; DPT3 coverage rose by an average of 3% per annum, OPD utilization increased by about 6% per annum, the trend in institutional deliveries has been increasing more steeply than the national rate, timeliness in submission of OPD reports rose from 49% in 2005/06 to 82% in 2009/10. Utilization of PHC funds also increased from 56% to 100% during the same period of time. In the year 2010/2011, the region continued to register positive changes in some of these areas. Figure 3 below shows trends in selected interventions over the past 3 years. OPD utilization in 2010/11 dropped by a 12 percentage points from that of 2009/10 while DPT3 coverage, first ANC visits, 4th ANC visits, dropped by 1%, 3% and 3% respectively. On the other hand the proportion of pregnant women tested for HIV remained at 89% and institutional deliveries increased from 12% to 14%. The results demonstrate that, although progress is seen and is possible it remains fragile owing to extra-systemic constraints beyond the control of local governments and their partners. 162 A n n u a l H e a l t h S e c t o r P e r f o r m a n c e R e p o r t 2 0 1 0 / 11 3.5 Monitoring and Evaluation of Implementation of the HSSIP 2010/11 – 2014/15 Monitoring and evaluation (M E) of implementation of the HSSIP 2010/11 2014/15 is based on periodic reporting and periodic reviews of information generated by the HMIS and other official data sources like surveys. M E aims at informing policy makers about progress towards achieving targets as set in the annual health sector plans and the HSSP and to help provide managers with a basis in making decisions. ead programme indicators x The proportion of implementing partners (NGOs, CSOs, Private sector) contributing to periodic reports x Community based HIS established and linked to HMIS x The proportion of planned periodic review that are carried x Timeliness of reporting x Completeness of reporting x Proportion of planned validation studies that are carried out x The proportion of sub national entities (districts, health facilities) that have reported as planned x Selected data disaggregated by age sex with concomitant gender analysis Annual plan 2010/11 top indicators x Number of sector performance review meetings held x HSSIP 2010/11 2014/15 M E plan finalised x Proportion of data validation exercises carried out x The proportion of sub national entities (districts, health facilities) that have reported as planned x Timeliness of reporting x Completeness of reporting x Monitoring and evaluation studies carried out Achievements x Three health sector quarterly performance reviews were held with participation from all departments and autonomous institutions. x Finalized the HSSIP 2010/11 2014/15 M E Plan. x Period progress reports submitted to OPM and MoFPED x Participated in the UDHS -5 coordination committee meetings. Data collection carried out by UBOS. x SMER TWG supported the School of Public Health in protocol, progress and draft report review for the Health System Assessment Survey. x HIV Epidemiological surveillance report 2010 produced and disseminated by UACP x HIV/AIDS indicator survey conducted. Data compilation ongoing by UACP x PMTCT Data validation study conducted and disseminated by PMTCT program x Tracer medicines availability study 2010, conducted and disseminated by Pharmacy Division A n n u a l H e a l t h S e c t o r P e r f o r m a n c e R e p o r t 2 0 1 0 / 11 163 valuation Studies x Malaria Programme Review 2011 conducted by UMCP. A binding MoU stipulating the way forward was reviewed, adopted and signed by all in-country RBM partners on May 27, 2011 and disseminated. The finding to be used for developing a new malaria program strategic plan. x EPI Programme Review conducted by UNEPI and disseminated findings to key stakeholders. The findings are being used to develop costed Multi-year plan for EPI that will be used for resource mobilization. Main challenges x Structure for implementation of new roles and responsibilities for sector M E not defined. x Performance review not conducted at sub national levels x Annual oint Review Mission activities not budgeted for under the GoU budget Recommendations for annual plan 2012/13 x Formalise M E implementation structure with clear roles and responsibilities. x Clear budget allocations for operationalization of the HSSIP 2010/11 2014/15 M E plan including funding for the oint Review Mission x Support sub national levels to conduct regular performance review meetings M&E activities were implemented though in an uncoordinated manner due to lack of an established institutional structure for overall sector M&E. The HMIS component (Resource Centre) implemented planned activities as planned focusing on data management. The QAD also implemented activities related to sector performance review (quarterly); development of performance indicators for the HSSIP and JAF; reporting to the OPM and MoFPED (OBT); and coordination of the SME&R TWG activities. The QAD also took the central role in the development of the HSSIP 2010/11 – 2014/15 M&E plan which when operationalized will guide the Country-led M&E system. 164 A n n u a l H e a l t h S e c t o r P e r f o r m a n c e R e p o r t 2 0 1 0 / 11 3.6 Data Quality report Figure 16: National health facility data uality assessment: summary of results Area ndicator National Score 200 1 2 3 4 5 6 Completeness of district reporting Completeness of facility reporting Accuracy of event reporting (zero/missing values) Accuracy of event reporting (extreme outliers) Accuracy of event reporting (moderate outliers) Accuracy of event reporting (discrepancy between monthly reports and end-of-year report) External data verification 2011 istricts ith lo score 200 2011 % of monthly district reports received 98% 94% 3% 1 9% 1 % of expected monthly facility reports received % of monthly district reports that are zero/missing values (average for 4 indicators) % of district values that are extreme outliers ( /-3 SD) (average for 4 indicators) % of district values that are moderate outliers ( /- 2SD) (average for 4 indicators) % difference between monthly reports and end-of-year report (average for 5 indicators) 92% 85% 9% 2 33% 2 3% 12% 4% 3 18% 3 0.3% 0.2% 8% 4 7% 4 4% 3% 35% 5 19% 5 NA 25% 9% 6 NA NA % of agreement between data in sampled Assessment not done (last one facility records and national records for the same facilities for 3 core indicators 2008) 8 Accuracy of population Estimated number of live births from 104 NA projection country projections divided by number derived from UN population projections 8 8 101 101 21% 9 Accuracy of population Projected population divided by the 22% 7 projection expected population 10 External comparison: Coverage from facility reports divided by 107 114 NA DTP3 survey for the most recent comparable year (2007) 11 External comparison: Coverage from facility reports divided by 83 95 NA Institutional deliveries survey for the most recent comparable year (2005) 1 % of districts with less than 80% completeness of monthly reporting 2 % of districts with monthly facility reporting rates below 80% 3 % of districts with more than 20% zero values 4 Number (%) of districts in which at least one of the monthly district values are extreme outliers in any of the four indicators ( /-3 standard deviations from the district mean) 5 Number (%) of districts in which more than 5% of the values are moderate or worse outliers ( /-2 standard deviations); 6 % of districts which are more than 33% difference between district monthly reported values and end-of-year totals 7 The expected population is computed based on the first visit antenatal coverage rate; 8 Percent of districts which are more than 33% off the expected population; 7 A n n u a l H e a l t h S e c t o r P e r f o r m a n c e R e p o r t 2 0 1 0 / 11 165 ntroduction Almost no health data can be considered perfect. Data quality assessment is needed to understand how much confidence can be put in the health data presented. Population-based surveys employ standard well-accepted methods to assess and make adjustments for data quality, with documentation of changes made and rigorous quality control mechanisms. Administrative and health facility data are the basis for annual monitoring and also need to be assessed in a systematic manner. uality data on health sector performance should be available on a regular, preferably annual basis. Population-based surveys are conducted only periodically, usually once every 3-5 years, and as such do not always reflect current health realities. Health facility data are collected and aggregated on a continuing basis and thus could present a timelier picture. Such data have a number of limitations related to quality, such as missing values, bias, and computation errors. Furthermore, to obtain population coverage rates, assumptions need to be made about the denominators, the target population, which is prone to errors. This annex aims to describe the data quality assessment and adjustment procedures for health facility data to meet the demand for annual reporting on key indicators. Reporting completeness rate 1. The Uganda Ministry of Health Resource Centre receives monthly outpatient and inpatient reports from all districts. In addition, the districts report the totals once a year to the Resource Centre. There is an element of timeliness in the completeness rate: all reports need to be received before the 28th of the following month. Table 45 shows the monthly reporting completeness for 2008/09 and 2010/11, as well as the districts with poor reporting. District reporting completeness is slightly higher in 2009 (98%) compared to 2011 (94%). The reporting completeness for 2011 may increase slightly as late submissions are sent from districts and processed. All districts with poor reporting completeness in 2011 were new districts, with the exception of Busia. In addition, while 108 of 112 districts submitted an annual report (96%), the 4 districts that failed to submit one were new districts. The district reporting completeness rate is computed as the total number of monthly district reports received divided by the total expected number of reports. New districts from 2011 are shown in bold. Table 46: istrict monthly reporting completeness rate and districts ith poor completeness rate National district monthly reporting completeness rate Number (%) of districts with completeness rate below 80% 166 2008-200 80 districts 2010-2011 112 districts 98% 94% 2 (3%) 10 (9%) A n n u a l H e a l t h S e c t o r P e r f o r m a n c e R e p o r t 2 0 1 0 / 11 Districts with completeness rate below 80% Buliisa, Kabarole Alebtong; Busia, Kole, uu a, engo, Mitooma, Ngora, Ntoro o, N oya, Sheema 2. All public and private-not-for-profit facilities are expected to report to the district every month. The facility reporting completeness is defined as the total number of monthly facility OPD reports received over the total expected number of monthly facility reports received x 100%. Table 46 shows the facility reporting completeness for 2008/09 and 2010/11, as well as the districts with low completeness rates. Facility reporting completeness is higher for 2009 (92%) compared to 2011 (85%), although the latter may not fully account for late submissions. As for district reporting completeness, many of the districts with poor reporting are new districts. New districts from 2011 are shown in bold. Table 47: Facility reporting completeness rate and districts ith poor completeness rate National facility reporting completeness rate Number (%) of districts with completeness rate below 80% Districts with completeness rate below 80% 2008-200 80 districts 2010-2011 112 districts 92% 85% 7 (9%) 37 (33%) Amuria, Arua, Bugiri, Iganga, Kabarole, Kamuli, Mayuge Alebtong, Amuria, Budaka, uh eju, ulambuli, Buliisa, Busia, utambala, uvuma, uyende, Isingiro, Kaliro, Kalungu, Kanungu, Kasese, Kibu u, Kiryandongo, Kitgum, Kole, uu a, engo, Masaka Mbarara, Mitooma, Moroto, Namayingo, Nebbi, Ngora, Ntoro o, Ntungamo, N oya, Rubiri i, Sembabule, Serere, Sheema, Sironko, Soroti Missing data and outliers 3. Missing data should be clearly differentiated from zero values in facility reports. However, missing entries are often assigned a value of 0, making it impossible to distinguish between a true zero value (zero events occurred that month) from a missing one (events occurred but were not reported). The 2008-2009 monthly HMIS data had blank entries for missing monthly reports, whereas the 2010-2011 data filled missing entries with 0. There were 22 districts in 2009 (28%) that had at least one missing/zero value in their monthly reports, compared to 68 districts (61%) in 2011. Four percent of districts in 2009 were missing 20% or more of their values, compared to 18% in 2011. 4 5. The number of services provided may vary from month to month. Large fluctuations in the numbers are however less probable. It is important to identify missing data and outliers, as these can severely distort coverage rates, particularly at the district level. A large number of A n n u a l H e a l t h S e c t o r P e r f o r m a n c e R e p o r t 2 0 1 0 / 11 167 outliers is indicative of poorer data quality. Table 47 shows the number of extreme and moderate outliers for 4 indicators. The percent of data points that were outliers showed little variation between 2008/09 and 2010/11. Table 48: treme and moderate outliers among data points for 2008/0 and 2010/11 for 4 indicators Number of e treme outliers Moderate/e treme outliers outside outside 3S of mean1 of data 2S of mean1 of data points points 2008-2009 2010-2011 2008-2009 2010-2011 ANC1 2 (0.2%) 3 (0.2%) 44 (5%) 38 (3%) DTP3 1 (0.1%) 2 (0.1%) 32 (3%) 40 (3%) Institutional deliveries 3 (0.3%) 2 (0.1%) 41 (4%) 40 (3%) OPD 4 (0.4%) 4 (0.3%) 45 (5%) 46 (3%) Total 10 (0.3%) 11 (0.2%) 162 (4%) 164 (3%) 1 ero values and missing data were excluded from the calculation of the means and standard deviations. They were not included in the counts in the table. Accuracy of reporting 6. Inaccurate reporting is harder to detect than incomplete reporting. This includes unintentional and intentional errors. The Resource Centre conducts annual comparisons between the data compiled from the district monthly reports and the totals reported by the districts at the end of every year. The latter report may include more late reports than the monthly reports, and may also be more prone to data entry errors. Table X compares monthly data with end-ofyear totals for 2010/11 for 5 indicators. There were a number of districts that showed a large discrepancy between the two. Districts with a percentage difference greater than 33% between these two values are shown in the table below. Table 4 : ercentage difference bet een monthly data and end-of-year data at the national level, and districts ith a large discrepancy ifference Number of districts bet een monthly istricts ith discrepancy 33 and end-of-year data1 Bukwo; Busia; Kiryandongo; Lyantonde; Manafwa; Masaka; Masindi; Mayuge; ANC1 74% 18 (16%) Mbale; Mbarara; Mityana; Moroto; Moyo; Mpigi; Mubende; Mukono; Namayingo; Sembabule Alebtong; Kapchorwa; Kiryandongo; DTP3 10% 9 (8%) Lyantonde; Mitooma; Otuke; Sheema; Sironko; Soroti Institutional 12% 7 (6%) Alebtong; Buhweju; Kiryandongo; 168 A n n u a l H e a l t h S e c t o r P e r f o r m a n c e R e p o r t 2 0 1 0 / 11 deliveries 1 OPD 16% 9 (8%) IPT2 12% 8 (7%) Total 25% 51 (9%) Mbale; Sembabule; Sheema; Soroti Alebtong; Amolatar; Busia; Kiboga; Kiryandongo; Masaka; Mitooma; Ntungamo; Sembabule Alebtong; Buhweju; Busia; Kiryandongo; Mitooma; Mubende; Sembabule; Soroti Between the mean of the non-zero monthly reports and the end-of-year total divided by 12. 7. No data verification exercise was conducted for 2010/11. The most recent data verification exercise was conducted in 2008 by the Resource Centre5. A comparison was conducted between the national level and facility data in all 80 districts for 3 monthly reports during the preceding year. The data validation exercise established that the national level coverage rates were too high for both IPT2 (ratio facility / national data was .95) and DPT3 (.92) and too low for deliveries in health units (1.04). Overall, however, these errors are relatively small and indicate good reporting. opulation denominator accuracy There are quite a few districts with coverage rates over 100% for indicators such as DTP3, which is indicative of an inaccurate denominator. District populations in Uganda are based on projections from the 2002 census, and may not sufficiently account for migration between districts. Also district health services may attract clients from other districts and serve a catchment population which is larger than the one living within the district boundaries. The accuracy of the national population projection can be checked by comparing denominators from the UBOS population projection with denominators derived from alternative sources. The higher the level of consistency between denominators from different (reliable) sources, the more confidence can be had in the accuracy of the population projections. 8. Alternative source for number of live births: An alternative estimate for the number of live births can be computed using the most recent CBR estimate from the UN Population Division. UBOS estimates live births to be 4.85% of the total population; CBR from the UNPD for 20052010 is 46.3 per 1000. Consistency ratio (Estimated number of live births from UBOS)/(Estimated number of live births using UNPD CBR) 1.04 9. Alternative population estimates (national and district) can be computed if the following data are available: (1) accurate data on a numerator of an indicator (2) reliable population estimates of coverage from surveys. Uganda has had a high rate of first visit antenatal care (ANC1) coverage (over 90%) over many years (same rate in DHS2001 and DHS2006), with little 5 Ministry of Health. Report of the data validation exercise. Kampala. October 2008. A n n u a l H e a l t h S e c t o r P e r f o r m a n c e R e p o r t 2 0 1 0 / 11 169 variation across all nine regions (90-99%). Assuming that the ANC1 numerator from the facility reports is correct (after data validation) and assuming a constant ANC1 coverage of 94% for all districts, it is possible to assess the accuracy of the population projection at national and subnational levels. An alternative estimate of the population is obtained by multiplying the official population by the consistency ratio, the population coverage of the intervention based on the facility reports divided by the assumed true population coverage based on the survey data. The consistency ratio gives an idea of how close the intervention coverage from facility reports is to the coverage obtained from survey data: the closer this ratio is to 1( 100%), the higher the consistency. ANC1 coverage computed from facility reports is 95% for both 2008/09 and 2010/11, which yields a consistency ratio of 101% for the national population projection. This suggests that the national population is approximately correct. The number of districts that have a consistency ratio less than .67 (i.e. official population figure is too high, resulting in ANC1 coverage that is too low) is 14 in 2011 (13% of districts). This is approximately the same percentage as in 2009 (10%). In addition, the number of districts that have a consistency ratio above 1.33 (i.e. the official population figure is too low, resulting in ANC1 coverage that is too high) is 11 in 2011 (10% of districts), compared to 11% in 2009. There was considerable overlap in the districts with under/over-estimated populations between 2009 and 2011. Table 50: onsistency ratio for AN 1 at national level, and districts ith very lo and very high consistency ratios 2008-200 Consistency of national population projection 80 districts 2010-2011 112 districts 101% Districts with consistency ratio under 67% (official population is too high) 8 (10%) Adjumani; Amuria; Buliisa; Kaabong; Luwero; Moyo; Nakapiripirit; Yumbe Districts with consistency ratio over 133% (official population is too low) 9 (11%) Abim; Budaka; Butaleja; Gulu; Iganga; Kaliro; Kampala; Lyantonde; Pallisa 101% 14 (13%) Adjumani; Amudat; Amuria; Kaabong; Kalungu; Kitgum; Kween; Luuka; Lwengo; Moyo; Napak; Ntoroko; Soroti; Yumbe 11 (10%) Abim; Budaka; Buyende; Gulu; inja; Kisoro; Kyegegwa; Lyantonde; Nwoya; Serere; Sheema ternal comparison 10 11. A comparison with population based data obtained from surveys and community research studies is also an important way to assess the quality of estimates generated by health facility data. Table 50 shows a comparison of coverage rates for DTP3 and institutional deliveries from population-based surveys and from facility reports. Table 51: omparison of coverage rates from surveys and from facility reports Most recent survey 1 DTP3 79% 2 Deliveries 41% 1 National Service Delivery Survey 2008. 170 Facility reports HM S 2008-200 2010-2011 84% 34% 91% 39% 2 UDHS 2006. Ratio overage from facility data/coverage from survey 100 2008-200 2010-2011 107% 83% A n n u a l H e a l t h S e c t o r P e r f o r m a n c e R e p o r t 2 0 1 0 / 11 114% 95% Figure 17 shows the DPT3 coverage trend generated from the HMIS reported data for children under 1 year, as well as the results from the UDHS in 2006-07 and of the National Service Delivery Survey 2008 for children 12-23 months (referring to under 1 immunization the year before the survey). There is a large gap between the DHS results and the HMIS in 2005 which suggested over-reporting in the HMIS. In 2007, however, there was no such gap, suggesting good completeness of reporting. The comparison of the results for the indicator on four or more antenatal care visits (ANC4 ) and delivery care between the annual estimates generated by the HMIS and the DHS results for three years preceding the 2005/06 shows good consistency. The correspondence of the ANC 4 coverage rates for the period 20042006 is very good. The institutional delivery rates in the DHS report are higher than those reported by the HMIS. In the UDHS 2006, however, 29.1% of deliveries were in public sector facilities and an additional 12% in private sector facilities. The latter includes notfor-profit and for-profit facilities. The HMIS includes not-for-profit facilities, but not for-profit facilities. Figure 17: Trend in T 3 coverage under 1 year of age , Uganda 2000-2010 Figure 18: omparison of HM S and HS coverage rates for institutional deliveries and AN four or more visits A n n u a l H e a l t h S e c t o r P e r f o r m a n c e R e p o r t 2 0 1 0 / 11 171 Adjusted coverage rates The district league tables can recomputed with the adjusted district populations. Table 51 shows the district league table scores and ranks (adjusted and unadjusted) of the top and bottom 15 scoring districts for 2010/11, based on the ranking using the adjusted district populations. Districts that increased/decreased more than 40 places in the ranking are shown in bold. Table 52: Top 15 and bottom 15 scoring districts based on ran ing using adjusted district populations Adj Adj Unadj Unadj istrict score ran score ran Kampala 72.6 1 77.5 1 Kitgum 71 7 2 57 2 44 Katakwi 71.2 3 66.4 10 Kapchorwa 70.7 4 63.6 20 Masaka 69.3 5 63.0 21 Bushenyi 68.8 6 74.2 2 Moyo 67 8 7 40 7 102 Kabarole 67.7 8 73.1 3 Kumi 66.5 9 61.8 25 Mukono 66.2 10 65.3 13 Amuria 65 7 11 47 0 8 umbe 65 4 12 47 86 Bududa 64.8 13 62.7 22 Soroti 64 7 14 53 7 62 Mbarara 64.1 15 70.3 4 172 Adj Adj Unadj Unadj istrict score ran score ran Kibaale 45.2 98 50.9 75 Busia 45.0 99 44.7 93 Kibuku 44.9 100 51.5 70 Kyegeg a 44 3 101 56 2 48 Kiryandongo 44.0 102 42.9 96 Kole 42.6 103 40.4 103 Alebtong 42 1 104 Moroto 42.1 105 43.0 95 Sheema 42.1 106 52.5 68 uyende 41 6 107 54 8 54 Namayingo 41.4 108 39.7 105 Mubende 40.9 109 47.1 88 Amudat 40.7 110 23.2 108 Buhweju 39.8 111 40.1 104 Mitooma 37.8 112 44.7 94 A n n u a l H e a l t h S e c t o r P e r f o r m a n c e R e p o r t 2 0 1 0 / 11 3.7 Progress on Implementation of the Priority Actions of the 16th Joint Review Mission Action I. Means erification of rogress omments Health Financing 1. Review resource allocation Resource Allocation ¾ RAF has been reviewed ¾ The draft report will be discussed in HPAC/TMC Formula guide and approved by SBWG formula for the sector. this financial year. and SMC. ¾ The consultant is yet to have discussions ¾ The plan is to complete /consultations with the the process by anuary CSO and PNFP Health 2012 and carry out providers to develop the dissemination by April formula for NGO 2012 and use the subsidies formula for resource ¾ Other grant resource allocation in FY allocation formulas have 2012/13. been widely discussed and ready for stakeholder consultation. of National Health ¾ The technical team and ¾ The NHA for financial 2. Institutionalisation year 2009/10 is Accounts steering committee have National Health Accounts. scheduled to start by been formed and the November 2011. technical team trained on NHA study. ¾ Road map, work plan and proposal for NHA institutionalization and implementation has been developed and approved in SBWG and SMC ¾ The MOH with support from ECSA and other partners have set aside a Budget for carrying out NHA exercise this financial year 2011/12. ¾ TORs for procurement of a consultancy to offer technical assistance has been developed and procurement process is ongoing. A n n u a l H e a l t h S e c t o r P e r f o r m a n c e R e p o r t 2 0 1 0 / 11 173 Action 3. Develop a health financing strategy. 4. Output based budgeting and transparency. 5. Improve quarterly financial reporting and accountability. funding for 6. Increase hospital along the high way. Means of erification Health Financing Strategy ¾ Budget estimates, BFP and MPS for FY 2011/12 uarterly reports Approved 2011/12 Budget rogress Consultations on going with TMC and all other stakeholders on the contents of the strategy Budget estimates, BFP and MPS developed with input from all stakeholders using the OBT. All Health institutions and policy makers consulted during the preparation process. The social services committee of parliament played a major role in the agreed outputs. There is been timely preparation of OBT quarterly financial and progress reports to stakeholders. There has been increased funding to the Hospitals along the highways. omments The strategy is expected to be discussed in the RM 2011. The TMC reviewed all the work plans and Budgets to ensure compliancy, value for money and transparency. Timely accountability is still a challenge Feasibility studies have been carried and procurement processes are ongoing. 17 General Hospitals and 2 RRHs along the high ways will be rehabilitated this financial year under the ICA, GOU and World Bank funding, 2 hospitals under PHC development grant and 13 RRHs under the GOU development grant. The hospitals will be equipped and ambulances provided. More drugs will be procured and distributed to the Hospitals, II. 174 Human Health Resources for A n n u a l H e a l t h S e c t o r P e r f o r m a n c e R e p o r t 2 0 1 0 / 11 Action the staff 1. Implement motivation strategy to enhance attraction, retention and productivity (submit health system strengthening proposal including HRH to GF). Means of erification uarterly and Annual Progress Report FY 2010/11 rogress omments ¾ All 24 districts covered through payment of 30% increments as wage component. Implemented by MOPS ¾ Sponsorship of students by MoH for health training at basic, postbasic and postgraduate levels has targeted inservice health workers and particularly those hailing from hard to reach and work districts Due to inadequate funding not all components have been implemented ¾ 2. Expedite appointment, deployment professionals the enrolled midwives. recruitment, and of health starting with nurses and 3. Develop and pre-service strategy. implement training 4. Strengthen Leadership and management skills at all levels. HRH Report Occupational Safety Strategy for Health (OSH) Hard to reach Recruitment ban in LGs did not allow Need to lift recruitment ban in order to attain appropriate staffing levels HRD and Training Policy and Strategy A Consultancy firm has been engaged to develop a Health Sector Human Resources Development and Training Policy Draft HRD and Training Policy is expected by end of st 1 quarter 2011/12 with the support of Baylor Uganda. Training Reports ¾ With the technical support of the MUK SPH and Uganda Capacity Programme ¾ ¾ A 24 week curriculum for HRH Leadership and Management (HRH LM) course developed. A pool of 16 National HRH LM course Facilitators were trained. st The 1 group of 26 district, hospital and health sub-district health managers from 7 districts of eastern and northern regions has completed the first HRH L M course and A n n u a l H e a l t h S e c t o r P e r f o r m a n c e R e p o r t 2 0 1 0 / 11 Funding the HRH LM plan implementation and follow up supervision remains a 175 Action Means erification of rogress commissioned with district L M improvement plans. III. omments big challenge. Health nfrastructure ¾ existing 1. Consolidate facilities to make them functional. Reports ambulance 2. Develop management strategy and guidelines Ambulance Strategy and guidelines and referral 3. Districts facilities should continue securing land titles in a phased manner. Land Titles Progressing slowly due to inadequate finds wholesome 4. Develop a strategy for managing medical waste starting from segregation at source to disposal materials. Medical Waste Management Strategy Developing draft 1. Increase (double) resource envelop for HC II 2m/ 2 month HC III 3.8m/2 month Allocation on Vote 116 It may not have doubled but it increased substantially 2. Review and update the standard list of essential medicines, laboratory and health supplies. EMLH List The medicine and health supplies list were finalized and ready for printing while the laboratory list we still need to have approval of the different laboratory kits from stakeholders ssential Medicines Health Supplies IV. 176 HSSIP focus is on consolidation of existing facilities specifically staff housing, maternity units and outpatient departments ¾ Rehabilitation and equipment of RRHs Being developed under the UHSS project and We may not be able to print them before RM A n n u a l H e a l t h S e c t o r P e r f o r m a n c e R e p o r t 2 0 1 0 / 11 Action Means of erification PPDA Regulations Work in progress The law has already been amended at the moment the regulations are being drafted and we are involved 4. Align / coordinate all partners dealing in EMHS management and harmonize their training programmes. Reports Many have come on board 5. All orders for health supplies including ARVs should be endorsed by the DHO / MS. Orders submitted Not all orders are endorsed by DHOs This is a continues process and it takes time for some to appreciate the need to align given the fact that some of them pay more allegiance to their funders than MOH Most of those that are sent by e-mail do not go through DHO 1. The National Policy on the PPPH should be expeditiously approved. Approved National Policy on PPPH by Cabinet st 2. Finalise and operationalise a MOU governing the Partnership between the public and private sectors. Signed MOU between GOU and Private Sector Was on agenda on 31 August, 2011, but was not presented due to long a Cabinet business list. On agenda for next meeting ¾ Draft MOU for PNFPs has been prepared. ¾ Draft for PHPs being worked on with IFC support Securing the Certificate of Financial implications from the MOFPED delayed th (received on 24 August, 2011) Lack of an approved PPPH Policy limiting progress and 3. Dissemination implementation of partnership policy at district level. Reports Dissemination has been done in the 20 districts of Nakapipipirit, Pader, Moroto, Gulu, Kitgum, inja, Rakai, Bushenyi, Bundibugyo, Kabale, Nebbi, Arua, Mityana, Mpigi, Nakasongola, Kyenjojo, Kasese, Lira, Kabarole and Masindi. This was supported by the Italian Cooperation in Uganda, and the Health Initiatives for the Private Sector, a USAID supported initiative. The assumption was that the PPPH Policy would be passed in due course. Reports ¾ Have developed job aides in various areas of RH (including Family These will contribute towards improvement of quality of care in public and for the 3. Advocate amendment of the PPDA regulations to provide for “procurement of medicines other health supplies under special procedures” V. VI. ublic rivate for Health rogress omments artnership Maternal and hild Health 1. Improve uality of Care in govt. and PNFP facilities A n n u a l H e a l t h S e c t o r P e r f o r m a n c e R e p o r t 2 0 1 0 / 11 177 Action supplies, recruitment management. Means erification of personnel rogress omments Planning, Maternal Health, Adolescent Sexual and Reproductive Health, Newborn care). ¾ Continued to build capacity in maternal and perinatal death auditing as aimed at improving quality of care. ¾ Training guidelines have been reviewed on ASRH, SGBV, and Integrated RH/HIV aimed at Continued Medical Education and professional development for service providers in the public and private sectors. ¾ Working with CSOs engaged in Reproductive Health to build capacity for Family Planning service provision on Long Term and Permanent methods of FP. Some retired midwives with training skills were utilized for supervision and supervision activities in the training highlighted under section 4.2.1. (above) PNFP facilities private sector. and the Major CSOs involved in RH, specifically Family Planning, include Reproductive Health Uganda (RHU), Marie Stopes Uganda, PACE, Family Health international 360, Uganda Private Midwives Association. 2. Actively engage retired and unemployed skilled attendants in the private sector (monitoring supervision, training, mentoring, data management ) etc Reports 3. Give incentives to mothers to deliver in the public health facilities e.g. Maama kits, soap, suka’ in Karamoja etc NMS reports; HMIS data. More Maama kits were procured and “pushed” to HC IIIs, and supplied to HC IVs and hospitals that ordered for them. This is reflected in the increase in percentage of pregnant women delivering in health units recorded in FY 2010/11. 4. Carry out maternal and child death audits MPD Audit Reports Tools were made available to districts that were trained in MPDR. Districts highlighted under section 4.2.1. (above) Some hospitals like Kitgum, Gulu, Apac, Nebbi that were active in auditing deaths in 2009 were doing so under project support. They became less active in 2010 During the financial year, 915 178 A n n u a l H e a l t h S e c t o r P e r f o r m a n c e R e p o r t 2 0 1 0 / 11 Action Means erification of rogress maternal deaths were reported to MoH from public and PNFP facilities. 91 deaths were audited and reports sent to MoH. The audits were from Nsambya hospital, inja RRH, Kayunga GH, Kamuli GH, Naggalama GH, Mubende GH, Moroto RRH, Katakwi HC IV, Kanungu GH, Nakaseke GH, Kiboga GH and Gulu RRH. omments allegedly because they were did not have funds. Some hospital like Kiwoko, Nakaseke have recorded significant reduction in maternal deaths due to institutionalization of maternal death audit. These hospitals are now concentrating on auditing perinatal deaths. In hospitals where the hospital administrators are actively involved in the MPDR Committee, there is better institutionalization i.e. better facilitation of MPDR committee meetings, availability of tools and implementation of recommendations VII. VIII. ommunicable ontrol isease community 1. Strengthen disease surveillance and early case detection. Reports Built Epidemic Preparedness and Response Capacity in 30 districts 2. Advocate for enhanced political participation and support in delivery of health services. Advocacy reports No activities reported 3. Training in leadership and governance e.g. in information management and utilization Training reports 16 HRH leaders received a TOT training in leadership and management. o Health managers o Other stakeholders Non iseases Inadequate funding to train and functionalise VHTs country wide The first training course of 32 HR leaders from 7 LGs was conducted (Mbale, Butalejja, Busia, Amolatar, Namutumba, Dokolo and Kamuli) ommunicable A n n u a l H e a l t h S e c t o r P e r f o r m a n c e R e p o r t 2 0 1 0 / 11 179 Action 1. Complete the Uganda NCD Survey on NCDs, their risk factors and social determinants 2. Scale up NCD prevention and management o Promotion of health styles o Promote screening for early detection o Capacity building: human resource, equipment, medicines and supplies Means of rogress erification NCD Survey report Procurement contract for survey equipment and furniture signed Reports ¾ Framework Convention on Tobacco Control (FCTC) partially implemented. omments Insufficient funds allocated to complete planned activities Procurement delays Implementation of Global strategies : on Diet, Physical Activity and Health; Against harmful use of alcohol to start when funds are available ¾ Screening for both cervical and breast cancers has been conducted in the Teso sub-region; Costing of nationwide screening for Scaling up to start when both cancers completed. funds are available ¾ MOU signed with Novo Nordisk to supply free insulin and diagnostic equipment; improve infrastructure; train health workers to manage type 1 Diabetes Support from Novo Nordisk as well as educate and Life for a Child children and their programme families. ¾ Steering Committee established to implement MOU Health romotion and nvironmental Health IX. 1. Scale up training and functionality of VHTs country wide. VHT Strategy Report ¾ VHT Strategy implemented in additional 18 districts ¾ Total number of districts which have fully established stands at 69 ¾ Trained VHTs in the 14 districts supported with ob Aids, certificates, protective wear and identification badges. ¾ VHTs 180 A n n u a l H e a l t h S e c t o r P e r f o r m a n c e R e p o r t 2 0 1 0 / 11 in Wakiso Action Means erification of rogress received bicycles from WHO and Global Fund. Public education through the media is very expensive and requires adequate funding 2. Intensify public education through the media and public relations. Activity reports ¾ Communication/ public relations specialist recruited. ¾ Public education announcements and discussions have been conducted on the print and electronic media districts 3. Facilitate (logistically, tools), to enable the staff inspect, supervise and monitor environmental health activities. Activity Reports Not done during the financial year 2010/11 due to inadequate funding. MoH to procure uniforms for Health Inspectors and Health Assistants during the FY 2011/12 if funds are available. 4. Procure and distribute existing Public Health Legislation to all districts for law enforcement in collaboration with all stakeholders. Copies of PH Legislation in districts None procured Inadequate funding, 5. Strengthen inter-sectoral linkages and leveraging at all levels to promote health. Minutes Inventory The division to purchase 1000 copies of Public Health Act during the FY 2011/12 ¾ Creation of a Sanitation and Hygiene budget line in the Ministry of Finance Planning and Economic Development. ¾ X. omments ¾ The division had a series of meetings with the Sanitation and Hygiene sub-sector Working Group. uarterly Water, ¾ Progress has been Sanitation and Hygiene registered in the area of sanitation and (WASH) cluster meetings hygiene with some of for Karamoja region held the Karamoja districts supported by UNICEF. achieving 10% latrine coverage more from the previous figures. Nutrition 1. Develop service standards for what is expected in nutrition at all levels on health care including VHT. Service standards Two meetings so far held to develop the nutrition service standards A n n u a l H e a l t h S e c t o r P e r f o r m a n c e R e p o r t 2 0 1 0 / 11 181 Action Means erification 2. Integrate and harmonise Strategies and strategies and guidelines on guidelines micronutrients. nutrition 3. Design interventions using data for advocacy purposes. of rogress omments ¾ Two day stakeholder meetings to develop a consensus held ¾ Concept and draft 0 developed ¾ Health care providers used Emergency Nutrition Assessment (ENA) for SMART in the assessment and designing response for the malnutrition crisis in Namutumba district. Reports ¾ Data from nutrition surveillance used in strengthening service delivery Nakapripirit district Supervision Monitoring and valuation XI. 1. Review and adapt support Progress report supervision tools for the sector. TOR developed for Procurement of Consultant developing a comprehensive initiated with support from supervision, monitoring and ICB Project inspection strategy 2. Train District Health Teams Report in supervision and monitoring skills. Not done IF and National 3. Harmonise institutionalise uality Strategic Plan Improvement initiatives in the health sector. and Final draft of the National IF and strategic plan ready 4. Operationalise the revised Revised HMIS in use HMIS in public and private health facilities as well as community level (VHTs). 5. Develop a strategic plan for UNHRO and health research 182 Strategic plan Launched the HMIS 2020 Not funded IF and strategy to be operationalised 2011/12 Tools not yet printed and therefore not in use. Trained all (112) District Biostasticians and HMIS FPs in 50 districts Inception report for the strategic plan and operating manuals are under development A n n u a l H e a l t h S e c t o r P e r f o r m a n c e R e p o r t 2 0 1 0 / 11 3.8 Progress on Implementation of the Recommendations of the 7th Annual y Health Assembly Means erification Resolution 1 of Action omments Human Resources for Health i. Implement the hard-to-reach, hard-to-stay, and staff motivation strategy to increase staff retention and reduce attrition. Implementation reports ¾ Hard to reach strategy was implemented by MoPS. Sponsorship list ¾ Motivation and retention component was costed Not implemented due to lack of funds. ¾ There are students from the hard to reach and work districts on preferential sponsorship of government solicited funding. ii. Lobby government to increase wages of health workers. Minutes Negotiations ongoing iii. Districts that have not reached 60% of their wage bill should recruit. HRH Report Recruitment plan made but no recruitment done No additional funds provided under PHC. iv. Accelerate the strategy of task shifting. HRH TWG meeting minutes. ¾ A situational analysis of Task Shifting in Uganda made and a report highlights the types/forms, magnitude and challenges of the processes and implementation. ¾ A high level stakeholders’ consultative workshop held to share and a consensus arrived at on key issues and the way to go. ¾ A position paper of the Ministry of Health was further presented to a HRH TWG meeting minutes. MoH Position Paper health work force rationalisation A n n u a l H e a l t h S e c t o r P e r f o r m a n c e R e p o r t 2 0 1 0 / 11 MoH Position Paper health work force rationalisation 183 Means erification Resolution of Action omments consensus meeting and it came out with a policy brief and proposed strategy covering the following items. ` Skills audit ` Calculating cost potential ` Value of different roles ` Harmonizing roles as necessary ` Different teaching and learning strategies ` Analyses/Evaluations of posts and competences profiles ¾ The rationalising of utilising HRH report is available and has been forwarded for further discussion at the top management level. v. Recentralize the deployment of key health workers such as Medical Officers. Amended Policy Cabinet decision not taken vi. Review the curriculum of Enrolled Comprehensive Nurses and Registered Comprehensive Nurses. Reviewed curriculum vii. MoH to write circular to districts banning recruitment Circular ¾ A joint consultancy of local and international level experts was engaged to evaluate the comprehensive nurse training program. ¾ It sought views from key stakeholders in MoH, MoES, MoPS, PNFPs, PHPs, Training institutions, Service providers, the alumni etc and developed a report with recommendations that was presented to the HRH TWG and discussed. Not done 184 A n n u a l H e a l t h S e c t o r P e r f o r m a n c e R e p o r t 2 0 1 0 / 11 The proposal awaits the SMC and TMC’s considerations and responses. ¾ A workshop for 30 key representative Means erification Resolution of Action of Nursing Assistants, and to work with MoE to phase out training of Nursing Assistants. omments s of Nur w ¾ ¾ viii. DHOs should monitor and ensure that schools training nurses and midwives are registered. List of students and schools practicing in district facilities ¾ NAs with appropriate qualifications are preferentially considered when selecting entrants to enrolled nurse/midwife ry courses. The above issues have been regularly articulated to DHMTs at various fora of interaction. Gazetted health training institutions have been put in the media and forwarded to the DHOs for reference, public notification and further action. ¾ ix. 2 Post of Medical Superintendent should be established and institutionalized in the Ugandan Civil Service. ssential Medicines Health Supplies i. Staffing Norms The professional councils are monitoring the process as they establish District Health Professionals Supervisory Authorities to regularly regulate the vice. Position of Hospital Director was RRH level was formalized and the substantive officers were appointed. The other posts are waiting for finalization of the restructuring process. and Improve procurement and supply chain management of medicines by regularly updating and monitoring the 3-year rolling plan ¾ A uantification Procurement Planning Unit ( PP) in place and operational A n n u a l H e a l t h S e c t o r P e r f o r m a n c e R e p o r t 2 0 1 0 / 11 185 Means erification Resolution of procurement plan (including all development partners’ contributions) and monitoring the performance indicators for NMS and MS to ensure sustainable availability of drugs and health supplies at both public and PNFP units. ii. iii. In light of new policy shift, develop and disseminate guidelines for the supply and distribution of drugs to all stakeholders. The guidelines should include a monitoring mechanism. Guidelines monitoring mechanism place. and Set up a transparent drug pricing system at NMS Price catalogue in Action omments ¾ Procurement developed disseminated ¾ MSS conducted ¾ MOU between MoH, MoLG NMS signed New list for HC II and III developed and in use ¾ plan and Overall guidelines development process to be started and completed in 2nd quarter of FY 2011/2012 ¾ NMS manuals to guide the guidelines development sent to MoH ¾ Price catalogue provided to MoH Price catalogue revised every year ¾ Pre- printed order forms distributed to HCIV and Hospitals Pre- printed order forms printed by NMS iv. NMS and MoH to prepare, publish and circulate a medicines and supplies price list. Price catalogue Same as above Same as above v. Build capacity at the user units in medicines and health supplies needs forecasting and rational drug use. Training reports ¾ MMS Trained in 45 districts with support from SURE ¾ Health workers in 442 health units provided support Capacity building is ongoing to cover all the districts and hospitals with support from Implementing Partners ¾ Soft ware piloted in three hospitals 3 ommunity nvolvement i. 186 Mobilize funding to scale up Budget for VHT Government, UNICEF, Projects and World USAID Vision A n n u a l H e a l t h S e c t o r P e r f o r m a n c e R e p o r t 2 0 1 0 / 11 More funding still needed for Resolution Means erification VHTs across the country. scale up of Action omments provided financial and logistical support for VHT scale up. monitoring and supervision of VHT activities HUMC reports HUMC guidelines under review Inadequate funding for training and facilitating HUMC operations the district iii. Strengthen partnerships with CSOs/NGOs when rolling out the VHT strategy. VHT reports Government, UNICEF, USAID Projects, World Vision provided financial and logistical support for VHT scale up. iv. Ban the use of professional medical titles for people who practice alternative medicine. Circular List of partners supporting VHT establishment ii. Put in place and build capacity of Health Unit Management Committees. 4 Health Financing i. Develop a sustainable strategy for financing the PNFP sector: the PNFP subsidy from GoU has reduced from 22% to 20% and user fees in the PNFP have increased. PNFP financing strategy Not done Awaits approval of the general national Policy on PPPH ii. Develop an evidence based health financing policy and strategy which can be used for advocacy within and outside government. HF policy strategy ¾ The process has started concept note, consultative meeting held to develop policy questions and policy action. ¾ A technical committee Meeting has been held, policy questions, roadmap and draft policy outline have been developed, by technical committee A meeting has been planned to obtain Senior Top and Top Management guidance and approve road map and A n n u a l H e a l t h S e c t o r P e r f o r m a n c e R e p o r t 2 0 1 0 / 11 187 Resolution Means erification of iii. Lobby to increase PHC nonwage recurrent budget to support operational costs especially at HC IV level. Budget Discussions ongoing with parliament and MOFPED to increase per capita expenditure on health iv. Review funding criteria of districts with peculiar needs e.g. border districts. Fund allocation criteria A comprehensive resource allocation formula is being finalized with technical assistance from WHO. Action It gives a special treatise to hard-to-reach districts and border areas, in addition to other criteria focused on poverty differentials and other peculiarities of different districts v. Accelerate the operationalization of National Social Health Insurance Initiative. 5 Malaria ontrol i. ii. 188 omments Finalization of the formula awaits a consultant’s meeting with the PPH TWG to finalize the PNFP components. Reports Additional principles were approved by Cabinet in September 2011 and now the bill is being re-drafted. The bill shall be tabled in Cabinet before end of this calendar year. Intensify efforts to roll-out proven effective malaria control interventions like IRS and ITNs. Reports 7.2m nets distributed to PWAs and 5s to all districts except 7 in Eastern Uganda. Awaiting 10.4m nets to achieve Universal Coverage (1 net to 2 persons) Delays have been experienced in the procurement cycle and disbursement of funds by GF GOU to specifically budget and fund Indoor Residual Spraying. Budget 2.4 and 2.9b provided for IRS in last and current FYs respectively. Plan was to cover 3 districts of Katakwi, Kumi and Bukedea Using Carbamate Bendiocarb, only one district can be covered with the amount provided. There is high resistance to pyrethroids that would have been a cheaper option A n n u a l H e a l t h S e c t o r P e r f o r m a n c e R e p o r t 2 0 1 0 / 11 Means erification Resolution 6 Maternal and hild Health i. Need to address the issue of high maternal deaths by focusing on EmOC and reducing the unmet need for FP. of Supervision activity reports; UDHS Action Planned action was to provide EmOC supplies to needy health facilities using the World bank loan. The procurement process has been initiated. More Family Planning commodities have been and more are being procured. Alternative distribution channel for FP commodities to potential FP users is being worked out to increase access through both the public and private sector, ii. Roll out and implement the Child Survival Strategy. ¾ Reports ¾ ¾ ¾ 7 Health nfrastructure i. Improve the release effective use of and the Budgetary allocation and CS Strategy was reviewed and aligned with HSSIP 2010/11 2014/15; Scaled up implementation of the integrated community case management (iCCM) and trained and equipped 13,882 VHTs in 24 districts (92%); Reviewed early implementation of iCCM in Karamoja and Kyegegwa; Secured TA to design MNCH passport using existing child health, FP, discharge, referral, MF5 and women passport; Started HW on job skills building on Helping Babies Breathe and Managing sick new born in HC III, IV and Hospitals. Increased capital development fund for Regional Referral A n n u a l H e a l t h S e c t o r P e r f o r m a n c e R e p o r t 2 0 1 0 / 11 omments The acute human resource shortages (doctors and midwives and anaesthetists should be addressed as soon as possible. Having EmOC and FP supplies without adequate numbers of relevant skilled service providers is NOT sufficient to achieve this. Assumption that regional teams and districts will be funded. Staffing levels in the division improve Focus consolidation on of 189 Resolution Means erification of development budget to improve functionality of the existing health infrastructure. Planning Guidelines Hospitals ii. DHOs should regularly provide and update the infrastructure and equipment inventory. Inventory reports Infrastructure and Equipment inventory not submitted iii. Maintenance of equipment should be prioritized. Reports Budget provision at Regional Hospitals (except inja Masaka, Mbarara and Mubende) 8 Health Sub- istricts i. Review the health sub district concept. Report Consultant to conduct HSD strategy evaluation is being sourced under World Bank financed Uganda Health Systems Strengthening Project. ii. Prioritize HC IV functionality particularly funding HC IVs. Budget allocations An additional Ushs 2bn was given to local governments to help functionalise HC IVs. Work plans NTD activities integrated with Child Day Plus Activities. Carried out mass deworming and Action Planning guidelines provided on utilization of PHC Development funds omments existing facilities through rehabilitation and expansion especially at HC III level to provide MCH services and staff accommodation Health Unit Physical Inventory Form (101) and Equipment Inventory Form (102) available and should be th submitted by 28 August every year Report will provide basis for reform of the strategy to support HSSIP implementation Neglected iseases/ merging diseases i. 190 Pay attention to neglected tropical diseases and emerging diseases. A n n u a l H e a l t h S e c t o r P e r f o r m a n c e R e p o r t 2 0 1 0 / 11 Emerging problems e.g. jiggers in Busoga region Means erification Resolution of Action omments azithromycin administration. 10 nvironmental Health i. Recommit LGs to the Kampala Declaration on Sanitation (1997) to enact and enforce bye-laws/ordinances to raise pit latrine coverage. Reports ii. Share and promote successful district/hospital experiences. Reports Brochures iii. Mobilize resources to address climate change issues that impact on Public Health. Workplan budget iv. Health units and health workers should participate in community activities that mitigate the effects of global warming such as tree planting. Reports 156 district staff were trained in processes of enactment of Ordinances and Bye- laws with support from MoH (7 districts MWE supported 135 participants) Holding Advocacy meetings with districts that are implementing Development of Ordinances and Bye Laws. and Not done Poor documentation and No funds were forth coming for Climate change activities. Budget allocation for Climate Change by MoH in the next financial year Not done No funds allocated FY10/11 A n n u a l H e a l t h S e c t o r P e r f o r m a n c e R e p o r t 2 0 1 0 / 11 were for 191 192 A n n u a l H e a l t h S e c t o r P e r f o r m a n c e R e p o r t 2 0 1 0 / 11 Bundibugyo Hoima Cholera (suspected) Cholera (suspected) 10 29 217 4 No. cases Ebola Luwero 01 Ebola and other viral hemorrhagic fevers Nakapiripirit Bugiri Affected districts Cholera (confirmed) Cholera Polio (confirmed) Polio Condition 01 0 5 10 0 No. deaths The index case was a 12 year old female from Nakisamata village, Ngalonkalu Parish, Zirobwe sub-county, Luwero district who passed away on 6th May 2011 following a febrile hemorrhagic illness that lasted six days. Laboratory The outbreak started on May 30, 2011 with cases being reported from Nkondo 1&2 villages, Nkondo Parish, Kabwoya sub-county. All cases were treated at Sebigoro HCIII and discharged by June 4, 2011 without any fatalities. Laboratory specimens were not obtained since antibiotics had been administered by the time the district rapid response team went down to investigate the cases. The initial cases were reported on February 9, 2011 from Bunyansiri parish, Ntotoro sub-county. A total 29suspect cases with 5 deaths were reported during the period February 9-22, 2011. Laboratory confirmation of Cholera outbreak was not done since we were unable to collect any stool samples. Index case was reported on October 18, 2010, from Achele village, Tokora parish, Kakomongole sub-county. Additional cases were reported from Nakapiripirit Town Council, Kakomongole, Namalu, Lorege, and Lolachat. Outbreak confirmation was undertaken by Mbale regional referral hospital laboratory. Latrine coverage was estimated at 3% and safe water coverage at 40-60% in the district. CTCs were set up at Nakapiripirit HCIII and Tokora HC IV and cholera and sanitation kits were supplied by NMS, WHO & UNICEF. The index case was a partially vaccinated 24 month old female from Nawansonga village in Kithodha Parish of Bulesa Sub County with 20 September 2010 as the date of onset. Wild Polio Virus (WPV) Type 1 was isolated from the laboratories (UVRI & NICD) and was genetically linked (97.46%) to the WPV isolated in Turkana region, North West Kenya on 3rd February 2009. Three of her contacts were also confirmed to be infected. There was a decline in the routine immunization coverage of DPT/OPV3 from 83% in FY 2008/09 to 76% in FY 2009/10. Supplemental Immunization in 48 high risk districts in North East, East and Northern Uganda using Monovalent OPV (TYpe1) were implemented using “The House to House strategy”. Remarks 3.9 Annual Epidemics Update July 2010 to June 2011 A n n u a l H e a l t h S e c t o r P e r f o r m a n c e R e p o r t 2 0 1 0 / 11 193 Kamuli VHF (suspected) Rabies Bundibugyo Bundibugyo Suspect VHF Rabies Kyegegwa Kampala, Wakiso, Nakaseke, Bugiri, Kasese, Gulu, Kabale, Nakasongola Affected districts Suspect VHF (Alert, Suspected) Ebola (confirmed) Condition 96 2 17 1 39 No. cases 6 2 8 0 (CFR 25.7%) 10 (CFR 100%) No. deaths Initial cases were reported on June 6, 2011 from Kasitu, Sindula, Ntotoro, Ngamba, Bukonzo, Bundibugyo Town Council, and Nyahuka Town Council. 100 doses of rabies vaccine for humans and another 1,000 doses for animals The initial case was a 35 year old female from Kamuli Town Council who was reported on June 25, 2011 by Kamuli mission hospital where she presented with a febrile hemorrhagic illness; she died on the same day of admission. Test results from UVRI were negative for Ebola & Marburg by PCR & Serology. The second case was a 15 year old girl 3days history of a febrile hemorrhagic illness. She passed away the same day she was admitted and test results were negative for Ebola & Marburg. The cases were reported during the period October 16-22, 2011 from Ntandi village, Kasitu sub-county and had febrile hemorrhagic illness. The seven specimens submitted to UVRI tested negative for Ebola and Marburg by ELISA and PCR. The case was reported on August 6, 2010, and involved a 2.5 year old male seen in Bugiburi HCIII who presented with 3-days history of a febrile hemorrhagic illness. The blood samples analyzed at UVRI were negative for Marburg and Ebola antigens and antibodies (Ig G and Ig M). cases and 22cases with 6deaths among suspect cases were investigated from Kampala, Wakiso, Luwero, Bugiri, K Nakaseke, Kabale, and Gulu but they all tested negative for Ebola/ Marburg and Yellow Fever. During the Ebola outbreak that occurred during the period May 6, 2011 to June 17, 2011, a total of 17 cases with 4 among alert investigations by way of both real time PCR testing and Antigen detection by ELISA confirmed Sudan Ebola virus (SEBOV). Phylogenetic analysis in CDC-Atlanta showed that the Bombo sequence is 99.3% similar to the Gulu 2000 strain. One contact (the brother to index case) tested positive for Ebola by IgG. The outbreak was declared over 17June-2011after two incubation periods elapsed following the death of the lone confirmed case on 6 May 2011 without any additional confirmed cases. Remarks 194 A n n u a l H e a l t h S e c t o r P e r f o r m a n c e R e p o r t 2 0 1 0 / 11 Arua Yellow Fever (suspected) Dengue fever (confirmed) Dengue Fever (suspected) Mogadishu (Somalia) Gulu, Arua, Lira, Kaabong, Kotido, Napak, Nebbi, Yumbe, Dokolo Yellow Fever (confirmed) Agago, Pader, Abim, Lamwo, Kitgum Affected districts Yellow Fever Yellow Fever Condition 106 167 97 10 No. cases 0 3 17 41 No. deaths The initial cases were reported on April 6, 2011from the Uganda sector of AMISOM troops in Somalia. The outbreak was confirmed on July 8, 2011. Patients present with fever, general weakness & joint pains with vomiting; some few had petechial hemorrhages in the skin, sub-conjunctival hemorrhage and jaundice. The majority of the cases present with dengue fever but there also a few cases with Dengue Hemorrhagic Fever (DHF) and Dengue Shock Syndrome (DSS). At least 34 cases have been confirmed in the laboratory either by PCR or serology. Several serotypes i.e. DEN-1, DEN-2 and DEN-3 have been identified during the outbreak. Due to the risk of importation of the disease into Uganda the following measures have been put in place: (a) Hold the troops in one central place [Bombo] for at least one week and discharge those who don’t manifest with symptoms. (b) Re-activated the isolation ward in Bombo to Cases presenting with fever, head ache, joint pains, epigastric pains, rigors, hiccups, mental confusion, and yellowing of palms and eyes were reported from Ayayia village, Ayayia Parish, in Ajia sub-county starting 8 June 2011. A total of 10 cases with 3 deaths were reported over a three-week period starting June 8, 2011. The cases were admitted in Agiya HC and Kuluva hospital. Laboratory testing was negative for Yellow Fever, Dengue and Hepatitis E Virus by PCR and serology. A total of 273 suspect Yellow Fever cases including 58 deaths (Case Fatality Rate 21.3%) were reported from 14 districts in Northern Uganda during the period November 2010 to April 2011. A total of 13 cases were confirmed to have Yellow Fever from the five the districts of Abim, Agago, Pader, and Kitgum. A vaccination campaign was conducted during the last week of January 2011 targeting all persons aged 6 months and above in the districts of Abim, Agago, Kitgum, Lamwo and Pader. The overall Yellow Fever immunization coverage in the five districts was 80.1% (with Abim having a coverage of 120.5%; Agago at 80.7%; Lamwo at 73.9%; Kitgum at 77.6%; Pader at 75.9%). were supplied to the district to facilitate response activities. Remarks A n n u a l H e a l t h S e c t o r P e r f o r m a n c e R e p o r t 2 0 1 0 / 11 195 Affected districts No. cases Namutumba Kasese Moyo Hepatitis B Virus (HBV) Hepatitis B Virus (HBV) Hepatitis B Virus (HBV) Acute Protein Energy Malnutrition (PEM) 67 86 818 Acute Protein Energy Malnutrition (PEM) Condition 13 0 10 No. deaths The initial cases were reported starting February 2010, samples were sent to UVRI where the infection was confirmed. The cases reported from the sub-counties of Moyo, Dufile, Gimara, Metu, Itula, Moyo TC, and Lefori. The prevalence of HBV infection in West Nile region is one of the highest and stands at 18%, much higher than the national average of 10% and the WHO threshold of 9%. The coverage for DPT3-Hep B+Hib was only 30% in Moyo during the FY 2008/09. Mobilization of communities needs to be enhanced to improve the coverage for this vaccine. A policy for Following media reports on June 20, 2011 indicating an outbreak of HBV in Kasese http://www.newvision.co.ug/D/8/12/758088 the MoH reviewed health facility data from six HU where HBV testing is done including Bwera, Kagando, St. Paul HCIV, Rukooki HCIII, Bishop Masereka HCIII, & Kasese TC HCIII. A total of 86 cases of HBV were confirmed out of 924 patients tested; putting the positivity rate at 9.3% which is lower than the national average of 10%. And besides the rate of 9.3% is over estimated as this was obtained from sick patients attending HU hence this rate is definitely higher than the actual rate in the general population. There was therefore no evidence of an outbreak of HBV infection in the district. The proportion of children receiving three doses of Hepatitis B vaccine in Kasese district currently stands at 96%. A press release was issued [June 24, 2011] by the Hon. MoH to clarify the erroneous media publication. Cases of acute PEM were reported from Magada sub-county during the 3rd week of June 2011. Cases were also reported from Mazuba, Kagulu and Nabiswegi Parishes in Magada sub-county and Kibale sub-county. The clinical history indicates that most of the affected have malnutrition (marasmic kwashiorkor) since April 2011. The affected areas experienced famine after crops were damaged by hail stones in March 2010. During the famine, families feed on alternate days with just one meal per day; a typical meal being cassava/ maize bread and greens. Magada HCIII and Nsinze HCIV were designated as therapeutic treatment centres. A team of pediatricians from Mwanamugimu unit in Mulago supported the initial health facility-based assessments and management of cases. Cases were also treated from the surrounding districts of Butaleja, Kumi, Pallisa, and Kibuku. provide supportive care for the sick, and (c) Continue line-listing and surveillance in Mogadishu as well as ensure supportive treatment (rehydration and paracetamol); and vector control measures in Mogadishu. Remarks 196 A n n u a l H e a l t h S e c t o r P e r f o r m a n c e R e p o r t 2 0 1 0 / 11 Affected districts Kitgum, Lamwo & Pader Hepatitis E Hepatitis E Kotido (confirmed) (confirmed) Kaabong Hepatitis E Virus (HEV) Human Influenza Human Influenza Head nodding disease Head Nodding Disease Condition 18 1008 27 1,876 No. cases 2 21 0 05 No. deaths Initial cases were reported starting from September 2009 till March 2011 and were reported from Kotido sub-county, Panyangara sub-county, and Kotido Town Council. The affected areas have very low latrine coverage of up to 2%. The outbreak started on August 18, 2009. The initial cases were linked to the consumption of Kwete in Kaaboong Town Council. Cases have been reported from Sidok, Karenga and Kaabong sub-counties. Latrine coverage is low (1%) and a factor in the spread of the disease. There was an upsurge in cases following the onset of rains in March 2011 that was responded to by GoU and partners. The National Influenza Centre in UVRI maintains sentinel surveillance sites in Mbarara hospital, Arua hospital, Koboko hospital, Kisenyi HC, Kiswa HC, Entebbe hospital, and Kitebi HC where patients presenting with Influenza Like Illness (ILI) are investigated systematically. The data (as of May 27, 2011) indicates that out of 618 specimens analyzed this year [2011], 27 specimens have yielded human influenza virus isolates with 24 being pandemic influenza A (H1N1) 2009; and 3 being seasonal flu B. An investigation undertaken by MoH with support from CDC & WHO in August 2010 in 26 sub-counties in the 3 districts of Pader (5 s/c); Kitgum (12 s/c); and Lamwo (9 s/c) identified a total of 1,876 cases with 1,090 cases originating from Pader; 307 cases from Lamwo; and 479 cases from Kitgum. The disease itself appears to be a novel epileptic disorder that is characterized by atonic seizures which without treatment progress to grand mal epilepsy. The etiology for now remains elusive but a response plan is in place to provide nutritional rehabilitation, chronic care clinics to prescribe antiepileptic, bi-annual mass treatment with ivermectin, psychosocial support as well as addressing the special education needs of these children and their families. vaccinating health care workers against HBV has been developed and vaccines made available to vaccinate all health care workers countrywide. Remarks A n n u a l H e a l t h S e c t o r P e r f o r m a n c e R e p o r t 2 0 1 0 / 11 197 Condition Affected districts No. cases No. deaths Nine cases have been confirmed by UVRI and response is being spearheaded by the District Task Force. Remarks 3.10 Development Partner Support Areas Health Project name Outturn 2010/11 Counterpart / Implementing Partner Outturn 2009/10 SECTOR Outturn 2008/09 USA Outturn 2007/08 1. AED (Academy for Educational Development) Engender Health A2Z Micronutrient / MOST 0.4 0.4 0.5 0.2 ACQUIRE 1.8 1.2 0.0 0.0 10.3 12.6 7.2 3.0 3.0 3.4 4.5 Health JSI (John Snow Inc) AFFORD - Health Marketing Initiative Central Contraceptive Procurement DELIVER 9.0 Health JHU (John Hopkins University) Multiple 0.6 0.6 1.4 3.8 Health Macro International Inc DHS Survey 0.6 0.6 1.0 0.0 Health Minnesota International Volunteers for Health SCF (Save the Children Fund) USA JHU (John Hopkins University ) 0.2 0.2 0.0 0.0 0.3 0.3 0.0 0.0 0.8 1.0 3.1 2.7 0.0 0.0 1.0 0.0 Health Health Health UNICEF Grant Solicitation & Management (GSM)-MIVH Grant Solicitation & Management (GSM)-SCF Health Communication Partnership (HCP2) -Broad Communication Immunization Health UNICEF SMMORE 0.0 0.0 0.0 1.0 Health ABT Associates 0.0 0.0 6.5 9.2 Health RTI (Research Triangle International) AED (Academy for Educational Development) Indoor Residual Spraying (IRS) Integrated Vector Management Netmark Plus 1.8 0.0 0.1 0.0 0.3 0.6 0.5 0.0 Health New FP Initiative 0.0 1.0 1.7 2.0 Health Quality Assurance/Pharmacovigilance RPM Plus 0.0 0.0 0.0 0.4 0.3 0.5 0.0 0.0 Health Health Health Health 198 MSH (Management Science for Health) A n n u a l H e a l t h S e c t o r P e r f o r m a n c e R e p o r t 2 0 1 0 / 11 Health Outturn 2010/11 Outturn 2009/10 Project name Outturn 2008/09 Counterpart / Implementing Partner Outturn 2007/08 SECTOR Health MSH (Management Science for Health) MSH (Management Science for Health) JHU (John Hopkins University ) US Pharmacopeia Inc (USP) UN-WHO HIV/AIDS Chemonics HIV/AIDS HIV/AIDS JHU (John Hopkins University ) IHI Capacity 0.0 0.0 0.0 2.1 HIV/AIDS HCD Capacity Project 0.5 0.8 1.3 0.0 HIV/AIDS Deloitte & Touche Civil Society Fund-FMA 0.0 9.3 13.1 8.6 HIV/AIDS Chemonics Civil Society Fund-M&E 0.0 0.0 0.0 2.0 HIV/AIDS Chemonics Civil Society Fund-TMA 0.0 0.0 0.0 2.0 HIV/AIDS TASO 0.0 0.0 0.0 3.7 HIV/AIDS 0.0 0.0 0.0 0.5 HIV/AIDS RHU (Reproductive Health Uganda) Multiple Community Based HIV Response Community Based HIV Response Condom Procurement 1.5 1.5 2.0 2.0 HIV/AIDS CARE USA Core Initiative 9.8 13.7 5.5 6.0 HIV/AIDS JSI Research 0.0 0.0 0.0 5.6 HIV/AIDS MSH District based HIV/AIDS Program - East Central Region District based HIV/AIDS Program - Eastern Region District based HIV/AIDS Program - South Western Region Education Sector Work Place Policy (ESWAPI) EGPAF (Elizabeth Glaser Pediatric Aids Foundation) 0.0 0.0 0.0 5.6 0.0 0.0 0.0 3.6 0.4 0.4 0.0 0.0 3.9 4.6 5.0 0.0 Health Health Health HIV/AIDS HIV/AIDS World Vision HIV/AIDS EGPAF Securing Ugandan's Right to Essential drugs (SURE) STRIDES 0.0 0.0 0.0 5.3 0.0 0.0 0.0 5.2 Uganda Stop Malaria 0.0 0.0 1.6 3.9 US Pharmacopeia Drug Quality and Info (USPDQ) WHO Umbrella Grant 0.2 0.2 0.3 0.0 0.3 2.7 0.2 0.0 ACE Boosting Capacity Uganda NGOs Be A Man Campaign /YEAH 1.7 2.5 2.9 2.8 1.3 1.0 1.4 1.4 A n n u a l H e a l t h S e c t o r P e r f o r m a n c e R e p o r t 2 0 1 0 / 11 199 HIV/AIDS Hospice Uganda HIV/AIDS Macro International Inc HIV/AIDS IRCU (Inter-Religious Council of Uganda) IRCU (Inter-Religious Council of Uganda) HIV/AIDS HIV/AIDS HIV/AIDS HIV/AIDS Outturn 2010/11 1.4 3.6 1.4 0.3 0.3 0.0 0.0 Faith Based HIV/AIDS Initiative Faith Based Network Model 0.0 0.0 0.0 5.4 6.5 5.7 6.3 0.0 HCI/URC 0.0 0.0 2.7 2.6 Emerging Markets Group (EMG) MJAP HIPS Private Sector 0.0 0.0 3.1 3.4 HIV/AIDS C&T and PC 0.0 0.0 4.5 4.3 JHU (John Hopkins University) Social & Scientific Systems Male Circumcision 0.0 0.0 0.5 0.0 Monitoring & Evaluation of Emergency Plan Progress (MEEPP) Northern Uganda Malaria Aids & TB (NUMAT) NuLife (Nutrition for PHAs) 1.9 2.3 2.0 2.5 6.1 5.8 8.1 6.8 0.0 0.0 1.9 2.6 HIV/AIDS JSI (John Snow Inc) HIV/AIDS HIV/AIDS University Research Corp Int'l Emerging Markets HIV/AIDS IHAA HIV/AIDS URC (University Research Corp Int'l) USAID - REDSO Expand Access to Palliative Care Facility Survey Outturn 2009/10 1.1 HIV/AIDS HIV/AIDS Project name Outturn 2008/09 Counterpart / Implementing Partner Outturn 2007/08 SECTOR 0.0 1.4 2.0 2.7 1.5 Quality Assurance 1.0 1.7 0.0 0.0 Safety T Stop 0.3 1.8 2.2 2.2 SPEAR 0.0 0.0 0.8 1.5 Supply Chain Management 1.7 2.5 0.0 12.2 HIV/AIDS TB/HIV (new) 0.5 0.9 0.4 0.0 HIV/AIDS TBD HIV/AIDS Projects 0.0 0.0 3.3 0.0 TREAT 14.9 16.9 10.1 7.7 UPHOLD - AIC and TASO 21.5 21.8 19.7 0.0 HIV/AIDS HIV/AIDS HIV/AIDS HIV/AIDS HIV/AIDS SECTOR WVI (World Vision International) PSCM JCRC (Joint Clinical Research Centre) JSI (John Snow Inc) Counterpart / Implementing Partner Project name 97.0 121.8 TOTALS 200 A n n u a l H e a l t h S e c t o r P e r f o r m a n c e R e p o r t 2 0 1 0 / 11 136.5 Outturn 2010/11 0.0 Outturn 2009/10 2.6 Outturn 2008/09 1.2 Outturn 2007/08 PART – Work Place HIV/AIDS Activity - MoES PHA Networks 145.2 2. SIDA / SWIDISH EMBASSY Area of support 1. 2. 3. 4. 5. 3. Sector budget Support Health Maternal Health/SRHR Management/Capacity Building Adolescent sexual and reproductive Health HIV prevention, care and treatment Total expenditure for 2010/11 2010/11 Expenditure (,000,000 USD) 8.2 3.2 1 0.87 1.60 14.87 ITALIAN COOPERATION Area of support Total expenditure for 2010/11 1. Policy formulation and health system 313.000 euro 2. District health system strengthening 275.000 euro 3. PHC and out reaches 200.000 euro 4. Drugs and Equipment 109.000 euro 5. Training and university support 132.000 euro Total expenditure for 2010/11 (excludes administration expenses for the organization/institution) 1.029.000 euro A n n u a l H e a l t h S e c t o r P e r f o r m a n c e R e p o r t 2 0 1 0 / 11 201 Implementing Partners Funded by Italian Cooperation Name of partner Amount received UNICEF 1.050.000 euro WHO 170.000 euro Total to multilateral implementing agencies 1.220.000 euro Districts supported by Italian Cooperation Name of district Area of support 20 pilot districts District Planning on PPPH Kaabong, Kotido, Abim, Moroto, Napak, Gulu , Pader, Agago, Nwoya District health system strengthening, PHC Nakapiripirit, Amudat, Amuru District health system strengthening, PHC, infrastructure 7 districts in Acholi District planning community health, operational research on NTDs Kitgum, Lamwo District health system strengthening, infrastructure, Drugs and equipment 1. Challenges Internal: Delay in funds disbursement process and unpredictability compounded by the international financial crisis At district level: ¾ Limited capacity in resulted oriented planning and efficient and coordinated use and management of the scanty resources (often not completely absorbed), inadequate problem solving approach, scarce and inconsistent information or data, inadequate supervision, Insufficient accountability and responsibility mechanisms, few qualified staff, lack of capacity in delegation, scarce professional integrity and ethical motivation 202 A n n u a l H e a l t h S e c t o r P e r f o r m a n c e R e p o r t 2 0 1 0 / 11 At central level: Limited coordination and communication with districts, difficult in utilizing efficiently the limited resources, limited reliability of data and information, still insufficient result oriented planning and problem solving approach, gaps in inter-departments communication 2. Proposed solutions ¾ Increase funds predictability (within the limit of the present financial global crisis) and timeliness ¾ Strengthening the supervision process and the reporting system, ¾ Clear definition about roles, accountabilities, responsibilities and delegation levels ¾ Strengthening communication and coordination within departments and within MoH and Districts and HSDs (minimizing gaps and distance, reducing the feeling of isolation and impotence) ¾ Increasing the result oriented approach and problem solving attitude ¾ Engineering a performance based rewarding/remuneration (motivation) mechanism oriented towards improving integrity and ethical professional motivation in health Staff (new and realistic HRH policy and strategy) ¾ Improve the resources’ efficient use and absorption ¾ Coordinate the various grants and investment sources at central and peripheral level ¾ Increase Human resources and funds allocation to the sector 3. UNITED NATIONS POPULATION FUND Area of support 1. 2. 3. 4. Reproductive Health – Midwifery Reproductive Health – Family Planning HIV Care Adolescent Reproductive Health Total expenditure for 2010/11 Total expenditure 2010/11 (UGX) 2,772,748,997 18,849,867,701 1,674,577,740 1,292,546,219 24,589,740,657 Implementing Partners Funded by UNFPA Area of Support Name of partner Midwifery services Ministry of Health – RH Division Population Secretariat CDFU A n n u a l H e a l t h S e c t o r P e r f o r m a n c e R e p o r t 2 0 1 0 / 11 Amount received UGX 913,405,145 56,000,000 404,463,852 203 Family Planning ASRH HIV/AIDS UNFPA – Equipment to HFs UNFPA – TA to MOH Reproductive Health Uganda Consortium(RHU PI, MSU, AIC) Kanungu District Mubende District Yumbe District Oyam District Katakwi District Moroto District Kotido District Kaabong District UNFPA Commodities Ministry of Gender, Labour and Social Development (HIV/AIDS and ASRH Uganda Red Cross Society Ministry of Health - ACP MGLSD Reproductive Health (and AIC) Uganda Catholic Secretariat Church of Uganda Popsec (UMSC, Other FBOs) PACE 1,225,900,000 172,980,000 1,790,290,924 171,907,710 67,451,500 140,500,200 130,541,100 182,422,000 93,539,000 148,931,500 113,990,667 16,010,263,100 84,275,200 482,002,151 163,006,850 97,096,750 130,206,881 76,945,000 234,719,391 246,334,000 726,268,868 Support to central level MoH: Programme 1. Reproductive Health - Midwifery 2. Reproductive Health – Family Planning 3. HIV Care Amount UGX 2,312,285,145 16,010,263,100 163,006,850 Districts supported Name of district Area of support Kanungu District Mubende District Yumbe District Oyam District Katakwi District Moroto District Kotido District Kaabong District Family Planning, Midwifery services Family Planning, Midwifery services Family Planning, Midwifery services Family Planning, Midwifery services Family Planning, Midwifery services Family Planning, Midwifery services Family Planning, Midwifery services Family Planning, Midwifery services Amount of funding UGX 171,907,710.00 67,451,500 140,500,200 130,541,100 182,422,000 93,539,000 148,931,500 113,990,667 204 A n n u a l H e a l t h S e c t o r P e r f o r m a n c e R e p o r t 2 0 1 0 / 11 Challenges x x x x x x x x x Human resources for Health are inadequate with most health facilities having less than 40 percent staffing positions filled Lack of data collection tools at health facilities and service delivery site poses data collection challenges and affects data quality and reliability Infrastructure challenges related to inadequate space, dilapidated structures and poor maintenance of buildings and equipment A mixed policy on supply chain management – The ‘Push’ and ‘pull’ policies are executed concurrently leading to mixed pictures with regard to contraceptives stocks at different levels Operations research not well factored into program interventions leading to poor generation of strategic information for advocacy on key issues in the system SRH/HIV integration is frustrated by structural, systemic and skills issues and a culture that sanctifies verticalization of interventions A weak support supervision and monitoring system in the health sector Inadequate financing to RH Poor mobilization for demand and utilization of services Proposed solutions x x x x x More support will have to be given in the bonding and training of particularly midwives Support should be provided towards conducting National Health Accounts to enable the tracking of resources for health More investment should be made in system strengthening with particular focus on infrastructure and medical technologies and supplies The resource center should be support to develop and distribute data collection tools Operations research should be an in-built element in sector and national development planning A n n u a l H e a l t h S e c t o r P e r f o r m a n c e R e p o r t 2 0 1 0 / 11 205 4. UNICEF Partners name Area District(s) Total PCA Amount (Cash + Supply) USD 1. SCiU (Milk Matters) Nutrition Karamoja 28,744 2. IBFAN Nutrition National 39,301 3. Malaria Consortium Health National 1,515,284 4. CUAMM Health Karamoja 370,596 5. ACF Karamoja & Acholi 788,850 6. IRC Nutrition Health, Nutrition, WASH & CAA 7. CRS H&N, CAA Western 331,525 8. CONCERN Worldwide Nutrition Karamoja 157,777 9. AVSI PMTCT, H&N 232,574 10. UCS** ALS Acholi Karamoja, Northern & Western 11. CoU ALS All 129,390 12. C&D ALS 351,225 13. ASB AS Karamoja Acholi, Karamoja, Teso 14. Africare WASH National 271,868 15. Warchild Holland Nutrition National 36,078 16. CESVI Nutrition Karamoja 108,125 17. SNV ALS National 163,979 18. BRAC ALS National 85,268 206 Karamoja & Acholi A n n u a l H e a l t h S e c t o r P e r f o r m a n c e R e p o r t 2 0 1 0 / 11 537,465 229,361 99,993 19. UMCS ALS National 90,755 20. HealthNeed Nutrition 33,688 21. Baylor CAA North-East Rwenzori, Acholi and Karamoja 378,625 5. Department for International Development (DFID) Area of support 1. 2. 3. 4. Total expenditure 2010/11 £ HIV Prevention and care Yellow Fever Epidemic Response Implementation of the National Population Policy (procurement of contraceptives) Support to AIDS Indicator Survey Total expenditure 4,000,000 592,903 1,323,326 200,000 6,116,229 Implementing Partners Funded by DFID Name of partner Civil Society Fund (Deloitte & Touche) – HIV Prevention & care) UN AIDS – HIV Prevention UN Joint Programme on Population: Population Programme World Health Organisation Civil Society Fund (Deloitte & Touche) - AIDS indicator survey Amount received £3,000,000 A n n u a l H e a l t h S e c t o r P e r f o r m a n c e R e p o r t 2 0 1 0 / 11 £1,000,000 £1,422,960 £633,613 £200,000 207 Figure 19: DPT3 Coverage by district FY2010/11 Figure 20: Deliveries in Government and PNFP facilities by district FY2010/11 208 A n n u a l H e a l t h S e c t o r P e r f o r m a n c e R e p o r t 2 0 1 0 / 11 Figure 21: OPD utilization by district FY 2010/11 Figure 22: HIV testing in infants born of HIV positive women by district FY 2010/11 A n n u a l H e a l t h S e c t o r P e r f o r m a n c e R e p o r t 2 0 1 0 / 11 209 Figure 23: Latrine coverage in households by districts FY 2010/11 Figure 24: Pregnant women receiving 2nd dose of Fansidar for IPT by district FY 2010/11 210 A n n u a l H e a l t h S e c t o r P e r f o r m a n c e R e p o r t 2 0 1 0 / 11 Figure 25: Pregnant women attending ANC 4th visit by district FY 2010/11 Figure 26: Approved posts that are filled by district FY 2010/11 A n n u a l H e a l t h S e c t o r P e r f o r m a n c e R e p o r t 2 0 1 0 / 11 211 241,500 403,200 427,200 374,700 206,200 77,100 76,900 475,700 163,000 55,200 BUSHENYI KABAROLE MBARARA GULU BUTALEJA LYANTONDE BULIISA JINJA KATAKWI ABIM District 1,597,800 Total Population KAMPALA A n n u a l H e a l t h S e c t o r P e r f o r m a n c e R e p o r t 2 0 1 0 / 11 191 91 84 97 93 106 110 98 113 93 136 % 55 36 13.7 15.0 67 30 71 50 70 55 63 56 12.5 14.6 13.9 15.0 15.0 14.7 15.0 13.9 15.0 8.3 5.4 10.0 4.6 10.6 7.5 10.5 8.2 9.5 8.4 14.0 2.4 1.0 1.7 1.0 2.8 1.2 1.8 1.0 1.3 1.0 1.1 10.0 10.0 57 75 41 118 9.7 10.0 27 47 69 106 10.0 10.0 10.0 10.0 118 103 9.5 10.0 61 % 10.0 Pentavalent Vaccine 3rd Dose Coveragei 94 15 % 10 Deliveries in govt and PNFP facilities Score 15 OPD Per Capita 10 5.7 7.5 4.1 10.0 2.7 4.7 6.9 10.0 10.0 10.0 6.1 39 50 84 64 84 85 50 93 77 91 86 % Coverage and quality of care (75) Score Score HIV testing in children born to HIV positive womenii Score 10 Latrine coverage in households 3.9 5.0 8.4 6.4 8.4 8.5 5.0 9.3 7.7 9.1 8.6 Score 59 46 59 69 95 78 63 39 40 29 59 % 5 IPT2 3.0 2.3 2.9 3.4 4.7 3.9 3.1 2.0 2.0 1.5 3.0 Score 40 17 44 46 88 18 30 45 52 65 72 % 5 ANC4 2.0 0.9 2.2 2.3 4.4 0.9 1.5 2.3 2.6 3.3 3.6 Score 92 96 75 81 96 75 77 59 75 78 67 % 5 TB cure rateiii 4.6 61 71 57 3.8 4.8 74 38 4.1 4.8 38 3.7 6.1 7.1 5.7 7.4 3.8 3.8 7.3 73 3.8 7.9 79 3.5 5.3 10.0 53 123 % 10 35 2.9 3.8 3.9 3.3 Score 3.11 District League Table 2010/11 % Monthly reports sent on time (2) 75 92 92 92 67 100 100 75 92 75 100 % Completeness monthly reports (1) 100 100 100 100 100 100 100 92 100 100 100 % Completeness facility reporting (1) 92 100 93 73 99 100 100 79 92 81 80 1 1 0 1 1 1 1 0 1 1 0 4.4 4.8 3.8 4.6 4.3 5.0 5.0 3.2 4.8 4.3 3.8 0 0 0 0 0 0 0 0 0 0 5 5 % Management (25) Completeness of the annual report (1) Approved posts that are fillediv Score HMIS reporting completeness and timeliness Score DHMT meetings held as plannedv 0.0 0.0 0.0 0.0 0.0 0.0 0.0 0.0 0.0 0.0 Score 67 100 67 0 0 100 17 84 0 100 0 % 5 Medicine orders submitted timely 3.4 5.0 3.4 0.0 0.0 5.0 0.9 4.2 0.0 5.0 0.0 Score 212 Total Score 66.4 66.4 66.7 67.0 67.7 68.0 69.0 70.3 73.1 74.2 77.5 11 10 9 8 7 6 5 4 3 2 1 Rank A n n u a l H e a l t h S e c t o r P e r f o r m a n c e R e p o r t 2 0 1 0 / 11 213 94 94 152 109 93 102 94 77 97 522,100 183,100 227,800 416,600 377,800 466,900 247,300 104,600 247,000 167,000 328,600 MUKONO KABERAMAIDO SIRONKO MBALE LIRA RAKAI KISORO KAPCHORWA MASAKA BUDUDA NEBBI 91 159 91 District 311,600 Total Population RUKUNGIRI % 13.7 15.0 14.6 11.5 14.2 15.0 13.9 15.0 15.0 14.1 14.0 13.6 64 24 57 34 60 31 46 50 36 44 45 56 9.6 3.5 8.5 5.1 9.1 4.7 7.0 7.5 5.4 6.5 6.7 8.4 1.1 1.0 0.3 1.3 1.6 1.1 0.9 0.9 1.2 1.1 0.8 1.5 15 % 15 Pentavalent Vaccine 3rd Dose Coveragei Score % 10.0 10.0 3.3 10.0 10.0 10.0 9.0 9.3 10.0 10.0 7.9 10.0 23 77 81 47 11 20 66 43 25 76 32 54 2.3 7.7 8.1 4.7 1.1 2.0 6.6 4.3 2.5 7.6 3.2 5.4 79 63 93 65 55 97 72 65 91 50 89 97 OPD Per Capita % 10 Deliveries in govt and PNFP facilities Score 10 10 Score HIV testing in children born to HIV positive womenii Score Latrine coverage in households 7.9 6.3 9.3 6.5 5.5 9.7 7.2 6.5 9.1 5.0 8.9 9.7 Score 64 36 26 31 20 48 46 42 36 59 51 50 % 5 IPT2 3.2 1.8 1.3 1.5 1.0 2.4 2.3 2.1 1.8 3.0 2.6 2.5 Score 1.6 1.9 32 39 1.6 1.4 29 32 3.1 1.9 1.5 2.0 2.6 62 38 29 41 52 1.4 1.3 25 27 2.5 50 % 5 ANC4 Score 77 52 60 78 75 93 86 81 85 120 67 88 % 5 TB cure rateiii 3.8 2.6 3.0 3.9 3.8 4.6 4.3 4.1 4.3 5.0 3.3 4.4 Score 51 42 48 63 71 55 75 64 71 63 52 38 % 10 Approved posts that are fillediv 5.1 4.2 4.8 6.3 7.1 5.5 7.5 6.4 7.1 6.3 5.2 3.8 Score % Monthly reports sent on time (2) 83 100 83 67 100 75 92 83 92 83 100 100 % Completeness monthly reports (1) 92 100 100 83 100 100 100 100 71 92 74 83 90 86 99 96 75 89 100 100 90 92 % Completeness facility reporting (1) 100 100 1 1 0 1 1 1 0 1 1 1 1 0 5 4.3 4.9 3.4 4.0 4.9 4.4 3.8 4.6 4.6 4.6 4.9 3.9 0 0 75 0 0 0 0 0 0 100 0 % Management (25) Completeness of the annual report (1) HMIS reporting completeness and timeliness Score 5 DHMT meetings held as plannedv 0.0 0.0 3.8 0.0 0.0 0.0 0.0 0.0 0.0 5.0 0.0 Score 5.0 0.9 17 5.0 5.0 4.2 3.9 1.3 2.5 2.9 1.7 2.3 1.7 100 100 100 84 78 25 50 58 33 45 33 % 5 Medicine orders submitted timely Score Coverage and quality of care (75) Total Score 62.6 62.7 63.0 63.6 63.9 64.0 64.2 64.4 65.1 65.2 65.3 65.8 23 22 21 20 19 18 17 16 15 14 13 12 Rank A n n u a l H e a l t h S e c t o r P e r f o r m a n c e R e p o r t 2 0 1 0 / 11 14.3 14.6 12.4 95 97 83 93 93 463,600 396,700 466,200 490,200 207,300 458,000 TORORO ISINGIRO IGANGA KABALE NAMUTUMBA NTUNGAMO 86 15.0 102 468,700 KAMULI 12.9 13.9 13.9 14.3 95 KAMWENGE 317,000 169,300 BUDAKA 13.5 90 13.1 337,700 PALLISA 14.3 15.0 95 113 % 35 28 34 45 33 31 39 20 35 64 54 53 1.2 5.3 4.3 5.2 6.7 5.0 4.6 5.8 3.0 5.3 9.6 8.1 7.9 5.0 0.9 1.4 0.8 1.2 1.3 1.0 1.0 0.8 0.7 1.0 15 88 233,800 KUMI District 209,400 Total Population MPIGI % 10 15 Pentavalent Vaccine 3rd Dose Coveragei Score Deliveries in govt and PNFP facilities Score OPD Per Capita 10.0 8.5 10.0 8.1 10.0 10.0 10.0 10.0 7.7 6.8 10.0 10.0 Score 21 22 38 30 16 47 22 49 62 17 87 19 % 10 HIV testing in children born to HIV positive womenii 2.1 2.2 3.8 3.0 1.6 4.7 2.2 4.9 6.2 1.7 8.7 1.9 Score 88 51 92 67 75 72 83 74 67 63 60 58 % 10 Latrine coverage in households 8.8 5.1 9.2 6.7 7.5 7.2 8.3 7.4 6.7 6.3 6.0 5.8 Score 21 32 42 36 41 49 40 35 59 88 50 65 % 5 IPT2 1.1 1.6 2.1 1.8 2.0 2.4 2.0 1.8 3.0 4.4 2.5 3.2 Score 36 19 50 55 75 23 24 27 43 18 16 35 % 5 ANC4 1.8 1.0 2.5 2.7 3.7 1.1 1.2 1.3 2.2 0.9 0.8 1.8 Score 89 74 70 65 78 60 66 87 95 93 64 69 % 5 TB cure rateiii 4.5 3.7 3.5 3.3 3.9 3.0 3.3 4.3 4.7 4.6 3.2 3.5 Score Coverage and quality of care (75) 63 54 48 73 40 49 49 74 58 60 27 42 % 10 6.3 5.4 4.8 7.3 4.0 4.9 4.9 7.4 5.8 6.0 2.7 4.2 % Monthly reports sent on time (2) 100 100 100 100 83 100 83 100 83 83 92 83 % Completeness monthly reports (1) 100 100 100 75 98 98 96 79 100 100 91 91 100 100 100 77 91 100 96 % Completeness facility reporting (1) 100 83 92 100 100 0 1 1 0 1 1 0 1 0 0 0 1 3.7 5.0 5.0 4.0 4.5 4.9 3.6 5.0 3.3 3.5 3.8 4.6 0 75 0 0 0 0 0 0 0 0 0 50 % % 0.0 3.8 0.0 0.0 0.0 0.0 0.0 0.0 0.0 0.0 0.0 2.5 59 100 0 78 67 75 92 33 67 84 34 33 5 5 5 Management (25) Completeness of the annual report (1) Approved posts that are fillediv Score HMIS reporting completeness and timeliness Score DHMT meetings held as plannedv Score Medicine orders submitted timely 3.0 5.0 0.0 3.9 3.4 3.8 4.6 1.7 3.4 4.2 1.7 1.7 Score 214 Total Score 59.4 59.4 59.9 59.9 60.2 60.9 60.9 61.2 61.3 61.5 61.8 62.1 35 34 33 32 31 30 29 28 27 26 25 24 Rank A n n u a l H e a l t h S e c t o r P e r f o r m a n c e R e p o r t 2 0 1 0 / 11 215 301,800 MITYANA 171,000 344,600 169,300 695,500 254,800 150,000 353,700 DOKOLO KAYUNGA AMURU KASESE KITGUM NAKASONGOLA OYAM 31,752,300 241,800 KANUNGU National average 67,500 BUKWO District 343,200 72 86 62 98 97 94 92 90 102 75 102 115 Score 10.8 12.9 9.3 14.7 14.5 14.2 13.8 13.5 15.0 11.2 15.0 15.0 41 38 47 48 27 37 27 39 52 37 19 1.4 0.5 6.1 0.9 0.9 1.0 0.8 0.7 5.7 7.1 7.2 4.1 5.5 4.0 1.0 1.4 7.8 5.8 1.0 1.4 0.4 5.6 2.8 3.4 5.2 10.0 9.0 9.4 10.0 8.1 7.2 9.5 10.0 10.0 10.0 4.5 30 10 72 32 44 23 29 30 12 40 8 11 3.0 1.0 7.2 3.2 4.4 2.3 2.9 3.0 1.2 4.0 0.8 1.1 71 73 53 78 35 61 62 71 87 93 79 73 Pentavalent Vaccine 3rd Dose Coveragei 22 15 % 10 Deliveries in govt and PNFP facilities Score % 10 OPD Per Capita Score 15 % 10 HIV testing in children born to HIV positive womenii Score Total Population MANAFWA % Latrine coverage in households 7.1 7.3 5.3 7.8 3.5 6.1 6.2 7.1 8.7 9.3 7.9 7.3 Score 57 57 40 41 45 49 69 43 42 38 47 74 % 5 IPT2 2.9 2.8 2.0 2.1 2.3 2.4 3.4 2.1 2.1 1.9 2.3 3.7 Score 32 39 24 49 21 25 43 32 25 37 18 39 % 5 ANC4 1.6 2.0 1.2 2.5 1.1 1.2 2.2 1.6 1.3 1.9 0.9 1.9 Score 96 84 108 89 85 74 94 77 73 70 100 94 % 5 TB cure rateiii 4.8 4.2 5.0 4.5 4.3 3.7 4.7 3.9 3.6 3.5 5.0 4.7 Score 8.5 5.4 54 85 6.7 67 3.0 7.7 77 30 6.3 7.4 74 63 5.2 4.6 4.8 4.3 4.1 52 46 48 43 41 % 10 Approved posts that are fillediv Score % Monthly reports sent on time (2) 100 100 67 67 100 100 100 77 100 92 75 100 % Completeness monthly reports (1) 100 100 92 92 100 100 100 94 100 100 100 100 % Completeness facility 96 93 75 78 95 100 92 85 88 68 91 97 1 0 1 0 1 1 1 1 0 1 1 0 5 5.0 3.9 4.0 3.0 4.9 5.0 4.9 3.8 3.9 4.5 4.4 4.0 0 0 0 0 0 10 0 0 75 100 % Management (25) reporting (1) Completeness of the annual report (1) HMIS reporting completeness and timeliness Score 5 DHMT meetings held as plannedv 0.0 0.0 0.0 0.0 0.0 0.5 0.0 0.0 3.8 5.0 Score 33 33 11 0 17 67 33 47 11 45 33 89 % 5 Medicine orders submitted timely 1.7 1.7 0.6 0.0 0.9 3.4 1.7 2.3 0.6 2.3 1.7 4.5 Score Coverage and quality of care (75) Total Score 56.5 57.0 57.2 57.2 57.6 58.3 58.3 58.4 58.8 58.8 58.9 59.1 46 45 44 43 42 41 40 39 38 37 36 Rank 148,500 429,300 171,100 96,700 326,300 51,100 248,000 208,600 316,800 271,700 242,800 KYEGEGWA MAYUGE BUKEDEA BUTAMBALA APAC NWOYA BUYENDE ZOMBO MASINDI AGAGO IBANDA District 178,600 Total Population NAKASEKE A n n u a l H e a l t h S e c t o r P e r f o r m a n c e R e p o r t 2 0 1 0 / 11 86 80 72 92 105 153 86 94 113 92 87 71 % 12.8 12.0 10.7 13.8 15.0 15.0 12.9 14.1 15.0 13.8 13.1 10.6 32 41 30 41 81 66 35 77 47 30 35 65 15 % 15 Pentavalent Vaccine 3rd Dose Coveragei Score Deliveries in govt and PNFP facilities 4.8 6.1 4.5 6.2 12.2 9.8 5.2 11.5 7.1 4.4 5.2 9.7 Score 1.1 0.9 1.2 0.7 0.7 2.7 0.7 1.4 0.8 0.6 1.0 1.0 10 OPD Per Capita 10.0 8.9 10.0 7.1 7.2 10.0 6.9 10.0 7.9 6.4 9.6 10.0 Score 21 0 20 3 43 14 31 6 8 % 10 HIV testing in children born to HIV positive womenii 2.1 0.0 2.0 0.3 4.3 1.4 3.1 0.6 0.8 Score 89 39 67 82 78 44 71 54 65 55 78 80 % 10 Latrine coverage in households 8.9 3.9 6.7 8.2 7.8 4.4 7.1 5.4 6.5 5.5 7.8 8.0 Score 21 35 49 52 47 88 50 41 54 40 52 43 % 5 IPT2 1.0 1.8 2.5 2.6 2.3 4.4 2.5 2.0 2.7 2.0 2.6 2.2 Score 38 31 33 35 24 37 25 27 20 25 49 22 % 5 ANC4 1.9 1.6 1.6 1.8 1.2 1.9 1.2 1.4 1.0 1.2 2.4 1.1 Score 62 84 71 77 66 85 96 69 90 81 73 62 % 5 TB cure rateiii 3.1 4.2 3.6 3.8 3.3 4.3 4.8 3.5 4.5 4.1 3.7 3.1 Score Coverage and quality of care (75) 28 59 72 51 33 36 66 45 56 65 53 60 % 10 2.8 5.9 7.2 5.1 3.3 3.6 6.6 4.5 5.6 6.5 5.3 6.0 % Monthly reports sent on time (2) 75 92 100 100 25 42 92 42 50 67 58 100 % Completeness monthly reports (1) 92 100 100 100 100 58 100 92 92 92 100 100 88 96 98 100 77 40 92 75 82 93 96 91 0 1 1 1 0 0 0 1 0 1 1 0 3.3 4.8 5.0 5.0 2.3 1.8 3.8 3.5 2.7 4.2 4.1 3.9 0 100 0 25 0 0 0 0 0 0 0 0 5 5 % Management (25) % Completeness facility reporting (1) Completeness of the annual report (1) Approved posts that are fillediv Score HMIS reporting completeness and timeliness Score DHMT meetings held as plannedv 0.0 5.0 0.0 1.3 0.0 0.0 0.0 0.0 0.0 0.0 0.0 0.0 Score 67 11 0 0 33 100 33 17 % 5 Medicine orders submitted timely 3.4 0.6 0.0 0.0 1.7 5.0 1.7 0.9 Score 216 Total Score 54.2 54.2 54.4 54.8 54.8 55.2 55.3 55.8 56.0 56.1 56.2 56.2 58 57 56 55 54 53 52 51 50 49 48 47 Rank A n n u a l H e a l t h S e c t o r P e r f o r m a n c e R e p o r t 2 0 1 0 / 11 217 38 426,400 356,200 1,260,900 387,800 713,700 236,500 211,400 200,700 169,200 SOROTI KYENJOJO WAKISO BUGIRI ARUA BUNDIBUGYO SHEEMA MARACHA KIBUKU 12.2 15.0 100 81 10.3 13.4 12.2 15.0 13.9 13.8 69 89 82 109 93 92 15.0 120 119,500 RUBIRIZI 5.7 15.0 102 173,800 District KALUNGU 11.4 6.8 6.2 41 6.2 5.6 5.6 3.2 4.6 4.7 4.7 3.9 2.7 45 41 37 38 21 31 31 31 26 18 8.1 0.8 0.9 0.8 1.1 8.6 8.0 10.0 8.0 6.7 0.7 0.8 7.0 7.3 0.7 0.7 8.1 7.7 9.3 8.8 0.8 0.8 0.9 0.9 2 2 5 14 51 16 11 28 145 15 2 62 0.2 0.2 0.5 1.4 5.1 1.6 1.1 2.8 10.0 1.5 0.2 6.2 Score Total Population 76 Score 210,100 2.9 66 6.6 6.6 6.6 66 66 7.0 5.9 8.0 8.7 7.8 6.4 8.9 8.7 4.1 70 59 80 87 78 64 89 87 41 Pentavalent Vaccine 3rd Dose Coveragei 20 15 % 10 Deliveries in govt and PNFP facilities Score % 10 OPD Per Capita Score 15 % 10 HIV testing in children born to HIV positive womenii PADER % Latrine coverage in households Score 45 61 42 40 49 33 29 39 30 37 21 39 % 5 IPT2 2.3 3.1 2.1 2.0 2.4 1.7 1.5 2.0 1.5 1.8 1.1 2.0 Score 18 47 39 31 16 32 34 4 35 19 % 5 ANC4 0.9 2.3 2.0 1.5 0.8 1.6 1.7 0.2 1.7 0.9 Score 93 79 78 99 79 71 70 73 82 4.6 4.0 3.9 5.0 4.0 3.6 3.5 3.7 4.1 3.9 3.0 60 78 4.2 84 % 5 TB cure rateiii Score 52 36 46 44 42 34 44 58 70 36 64 72 % 10 Approved posts that are fillediv 5.2 3.6 4.6 4.4 4.2 3.4 4.4 5.8 7.0 3.6 6.4 7.2 Score % Monthly reports sent on time (2) 75 100 50 100 67 83 100 92 50 75 42 83 % Completeness monthly reports (1) 92 100 75 100 100 100 100 100 92 100 100 92 % Completeness facility reporting (1) 74 100 76 95 83 81 91 88 75 58 59 82 0 1 0 0 0 1 1 0 0 1 0 1 5 3.2 5.0 2.5 4.0 3.2 4.5 4.9 3.7 2.7 4.1 2.4 4.4 0 0 0 0 0 0 0 0 0 % Management (25) Completeness of the annual report (1) HMIS reporting completeness and timeliness Score 5 DHMT meetings held as plannedv 0.0 0.0 0.0 0.0 0.0 0.0 0.0 0.0 0.0 Score 33 67 0 8 89 33 0 1.7 3.4 0.0 0.4 4.5 1.7 0.0 3.4 1.7 33 67 5.0 1.7 100 33 % 5 Medicine orders submitted timely Score Coverage and quality of care (75) Total Score 51.5 52.2 52.5 52.7 52.7 52.8 53.0 53.2 53.7 53.7 53.8 53.8 70 69 68 67 66 65 64 63 62 61 60 59 Rank 58,100 153,600 120,400 613,300 144,100 52,400 150,900 418,000 204,600 209,600 143,800 KALANGALA KIBOGA AMOLATAR KIBAALE NGORA BUVUMA BUKOMANSIMBI LUWERO KOTIDO KOBOKO NAKAPIRIPIRIT District 210,900 Total Population SEMBABULE A n n u a l H e a l t h S e c t o r P e r f o r m a n c e R e p o r t 2 0 1 0 / 11 81 115 102 74 115 139 94 90 138 108 134 107 % 12.2 15.0 15.0 11.0 15.0 15.0 14.1 13.5 15.0 15.0 15.0 15.0 11 1.7 4.6 4.0 26 30 5.8 2.5 2.2 8.2 4.2 0.8 0.5 0.8 0.6 0.6 0.8 0.8 0.7 0.4 0.1 9.0 3.9 1.2 0.8 2.7 2.1 39 17 14 55 28 26 60 18 14 15 % 15 Pentavalent Vaccine 3rd Dose Coveragei Score Deliveries in govt and PNFP facilities Score 10 OPD Per Capita 8.0 4.8 8.4 6.4 6.1 8.3 8.1 6.6 3.7 0.9 10.0 8.1 Score 12 4 14 3 9 11 40 1 0 12 % 10 HIV testing in children born to HIV positive womenii 1.2 0.4 1.4 0.3 0.9 1.1 4.0 0.1 0.0 1.2 Score 21 64 12 82 90 85 71 68 63 70 57 62 % 10 Latrine coverage in households 2.1 6.4 1.2 8.2 9.0 8.5 7.1 6.8 6.3 7.0 5.7 6.2 Score 70 38 37 33 24 38 50 44 65 27 24 % 5 IPT2 3.5 1.9 1.8 1.6 1.2 1.9 2.5 2.2 3.3 1.3 1.2 Score 41 22 18 30 49 22 36 22 15 55 31 27 % 5 ANC4 2.1 1.1 0.9 1.5 2.5 1.1 1.8 1.1 0.7 2.7 1.6 1.4 Score 81 73 45 61 60 67 64 86 87 86 92 97 % 5 TB cure rateiii 4.1 3.7 2.2 3.0 3.0 3.3 3.2 4.3 4.4 4.3 4.6 4.9 Score Coverage and quality of care (75) 60 55 67 69 30 27 32 46 83 43 50 44 % 10 6.0 5.5 6.7 6.9 3.0 2.7 3.2 4.6 8.3 4.3 5.0 4.4 % Monthly reports sent on time (2) 100 75 83 83 50 83 17 100 42 100 100 100 % Completeness monthly reports (1) 100 100 100 100 92 100 75 100 100 100 100 100 % Completeness facility reporting (1) 99 88 91 93 99 74 63 100 98 101 90 74 1 1 1 0 0 0 0 1 0 1 0 0 5.0 4.4 4.6 3.6 2.9 3.4 1.7 5.0 2.8 5.0 3.9 3.7 0 0 0 0 0 0 0 0 5 5 % Management (25) Completeness of the annual report (1) Approved posts that are fillediv Score HMIS reporting completeness and timeliness Score DHMT meetings held as plannedv 0.0 0.0 0.0 0.0 0.0 0.0 0.0 0.0 Score 67 33 67 25 100 67 67 25 0 0 33 67 % 5 Medicine orders submitted timely 3.4 1.7 3.4 1.3 5.0 3.4 3.4 1.3 0.0 0.0 1.7 3.4 Score 218 Total Score 49.1 49.4 49.5 49.6 50.2 50.7 50.8 50.9 51.3 51.5 51.5 51.5 82 81 80 79 78 77 76 75 74 73 72 71 Rank A n n u a l H e a l t h S e c t o r P e r f o r m a n c e R e p o r t 2 0 1 0 / 11 219 133,700 80,600 281,200 188,800 KYANKWANZI OTUKE BUSIA MITOOMA 7.6 51 15.0 12.3 82 221 15.0 132 11.4 76 407,100 AMURIA BUIKWE 566,600 MUBENDE 11.5 8.3 77 132,300 LAMWO 8.7 55 58 466,400 YUMBE 11.7 344,200 78 202,200 KALIRO 10.8 11.4 72 499,100 HOIMA 11.4 0 31 26 17 39 21 25 45 34 19 41 16 % 0.0 4.6 3.9 2.6 5.9 3.2 3.8 6.8 5.1 2.9 6.1 2.3 2.3 0.9 0.6 0.7 0.5 0.8 1.3 0.5 0.3 0.8 0.9 15 76 76 District 280,200 Total Population KIRUHURA % 15 Pentavalent Vaccine 3rd Dose Coveragei Score % 10.0 8.6 6.4 7.1 5.4 8.2 10.0 5.0 3.3 7.8 8.6 3 0.3 1.9 0.1 1 19 3.2 0.7 0.0 0.6 0.6 1.0 0.7 32 7 0 6 6 10 7 76 76 51 64 85 63 77 40 75 84 72 83 OPD Per Capita % 10 Deliveries in govt and PNFP facilities Score 10 10 Score HIV testing in children born to HIV positive womenii Score Latrine coverage in households 7.6 7.6 5.1 6.4 8.5 6.3 7.7 4.0 7.5 8.4 7.2 8.3 Score 0 53 44 38 37 44 71 50 35 21 47 29 % 5 IPT2 0.0 2.6 2.2 1.9 1.9 2.2 3.5 2.5 1.7 1.0 2.4 1.4 Score 22 20 14 34 8 20 18 17 25 21 % 5 ANC4 1.1 1.0 0.7 1.7 0.4 1.0 0.9 0.9 1.3 1.0 Score 78 67 86 86 67 91 75 108 122 80 87 64 % 5 TB cure rateiii 3.9 3.4 4.3 4.3 3.3 4.5 3.7 5.0 5.0 4.0 4.3 3.2 Score 38 34 73 25 52 67 28 32 68 76 33 31 % 10 3.8 3.4 17 50 75 75 2.5 7.3 100 50 83 83 100 50 83 92 % Monthly reports sent on time (2) 5.2 6.7 2.8 3.2 6.8 7.6 3.3 3.1 % Completeness monthly reports (1) 25 67 92 100 100 92 100 100 100 100 100 100 % Completeness facility reporting (1) 6 56 91 87 95 50 97 89 97 64 100 94 0 0 0 1 1 1 0 0 1 0 1 0 0.6 2.2 3.3 4.4 4.9 3.4 3.6 3.6 5.0 2.6 4.7 3.8 0 0 0 25 0 0 0 0 0 0 0 5 5 % Management (25) Completeness of the annual report (1) Approved posts that are fillediv Score HMIS reporting completeness and timeliness Score DHMT meetings held as plannedv 0.0 0.0 0.0 1.3 0.0 0.0 0.0 0.0 0.0 0.0 0.0 Score 67 33 67 67 33 0 33 100 0 100 % 5 Medicine orders submitted timely 3.4 1.7 3.4 3.4 1.7 0.0 1.7 5.0 0.0 5.0 Score Coverage and quality of care (75) Total Score 44.7 44.7 45.8 46.1 46.2 47.0 47.1 47.7 47.9 48.0 48.9 48.9 94 93 92 91 90 89 88 87 86 85 84 83 Rank 89 27 331,600 262,000 243,200 176,500 148,700 354,300 216,900 97,400 211,200 345,300 AD UMANI LWEN O LUUKA NA AK OMBA MOYO KOLE A n n u a l H e a l t h S e c t o r P e r f o r m a n c e R e p o r t 2 0 1 0 / 11 BUHWE U NAMAYIN O KAABON 55 68 69 79 114 71 58 38 79 285,300 KIRYANDON O District 121,300 Total Population MOROTO 72 % 8.3 10.2 10.4 11.9 4.1 13.4 15.0 10.7 8.7 5.6 11.8 10.9 7 15 21 26 18 14 19 13 14 18 21 10 15 % 15 Pentavalent Vaccine 3rd Dose Coveragei Score Deliveries in govt and PNFP facilities 1.0 2.3 3.2 3.9 2.7 0.6 0.5 0.5 0.4 0.9 0.8 0.8 2.8 2.1 0.6 0.6 1.9 2.1 0.8 0.6 3.1 2.8 0.6 1.6 Score 10 OPD Per Capita 6.1 4.9 4.9 4.4 8.7 8.4 8.1 5.9 6.1 8.0 5.7 6.0 Score 8 2 20 7 1 47 % 10 HIV testing in children born to HIV positive womenii 0.8 0.2 2.0 0.7 0.1 4.7 Score 16 55 42 67 78 53 10 55 74 68 61 7 % 10 Latrine coverage in households 1.6 5.5 4.2 6.7 7.8 5.3 1.0 19 38 50 50 20 26 24 13 24 7.4 5.5 21 44 50 % 6.8 6.1 0.7 Score 5 IPT2 0.9 1.9 2.5 2.5 1.0 1.3 1.2 0.7 1.2 1.0 2.2 2.5 Score 16 32 34 24 15 17 28 10 26 23 25 21 % 5 ANC4 0.8 1.6 1.7 1.2 0.8 0.8 1.4 0.5 1.3 1.1 1.3 1.1 Score 82 71 78 96 72 69 61 65 60 107 71 61 % 5 TB cure rateiii 4.1 3.6 3.9 4.8 3.6 3.5 3.1 3.3 3.0 5.0 3.6 3.1 Score Coverage and quality of care (75) 42 20 25 30 51 28 50 42 50 67 60 38 % 10 4.2 2.0 2.5 3.0 5.1 2.8 5.0 4.2 5.0 6.7 6.0 3.8 % Monthly reports sent on time (2) 75 50 25 42 100 42 100 42 17 75 33 83 % Completeness monthly reports (1) 100 100 83 50 100 100 100 67 42 92 100 100 % Completeness facility reporting (1) 83 76 54 50 100 86 100 67 27 90 49 75 1 0 0 0 0 1 0 1 1 0 1 0 4.3 2.8 1.9 1.8 4.0 3.7 4.0 3.2 2.0 3.3 3.2 3.4 0 100 0 0 0 0 50 0 75 5 5 % Management (25) Completeness of the annual report (1) Approved posts that are fillediv Score HMIS reporting completeness and timeliness Score DHMT meetings held as plannedv 0.0 5.0 0.0 0.0 0.0 0.0 2.5 0.0 3.8 Score 100 100 17 67 100 33 33 % 5 Medicine orders submitted timely 5.0 5.0 0.9 3.4 5.0 1.7 1.7 Score 220 Total Score 37.0 39.7 40.1 40.4 40.7 41.2 41.6 41.6 41.8 42.7 42.9 43.0 106 105 104 103 102 101 100 99 98 97 96 95 Rank A n n u a l H e a l t h S e c t o r P e r f o r m a n c e R e p o r t 2 0 1 0 / 11 221 101,100 76,000 94,600 118,900 AMUDAT NTOROKO KWEEN BULAMBULI 49 7.3 4 % 0.6 0.4 3.7 10 15 2 5 89 % 10 0.2 0.5 8.9 6.4 4.3 43 64 6.8 0.3 85 78 99 81 6 % 0.2 0.6 % 5 82 13 % 5 6.0 68 2 60 % 10 5 52 64 3.9 4.3 39 33 44 5.0 4.1 4.1 % 10 5.2 6.4 3.9 3.3 4.4 % Monthly reports sent on time (2) 17 67 75 67 42 % Completeness monthly reports (1) 92 92 75 92 92 52 91 68 83 77 % Completeness facility reporting (1) 0 0 0 0 0 5 1.8 3.2 2.9 3.1 2.5 0 0 75 0 0 % 5 0.0 0.0 3.8 0.0 0.0 Based on data from January 2010 - December 2010. (Data from January 2011 to June 2011 were not available at the time of publication.) Based on data from 2009-2010, due to the time required to assess outcome. Approved posts in the district league table exclude the central level and the semi-autonomous institutions. ii iii iv Districts were expected to conduct DHMT meetings quarterly. Districts that reported having more than 4 DHMT meetings a year were given a score of 0 for poor reporting. v Based on data from district annual reports, HMIS. Districts that did not submit an annual report were given a score of 0. i 0 84 % Note: Alebtong district was excluded from the district rankings due to poor reporting and inconsistencies in the data over multiple indicators (large discrepancies between annual report data and monthly OPD reports and very low reporting completeness rates). 128,700 District Management (25) Completeness of the annual report (1) Total Population SERERE % 15 Pentavalent Vaccine 3rd Dose Coveragei Score Deliveries in govt and PNFP facilities Score OPD Per Capita Score HIV testing in children born to HIV positive womenii Score Latrine coverage in households Score IPT2 Score ANC4 Score TB cure rateiii Score Approved posts that are fillediv Score HMIS reporting completeness and timeliness Score DHMT meetings held as plannedv Score 5 Medicine orders submitted timely 0.0 4.2 Score Coverage and quality of care (75) Total Score 17.8 17.8 22.9 23.2 30.1 111 110 109 108 107 Rank


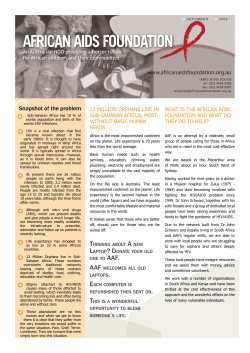


© Copyright 2026