
Document 249009
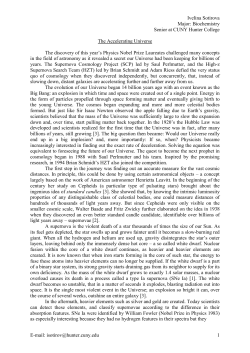
Astronomy
&
Astrophysics
A&A 366, 197–201 (2001)
DOI: 10.1051/0004-6361:20000211
c ESO 2001
Why did Supernova 1054 shine at late times?
J. Sollerman1,2 , C. Kozma1 , and P. Lundqvist1
1
2
Stockholm Observatory, SE-133 36 Saltsj¨
obaden, Sweden
European Southern Observatory, Karl-Schwarzschild-Strasse 2, 85748 Garching bei M¨
unchen, Germany
Received 13 July 2000 / Accepted 6 November 2000
Abstract. The Crab nebula is the remnant of supernova 1054 (SN 1054). The progenitor of this supernova has,
based on nucleosynthesis arguments, been modeled as an 8−10 M star. Here we point out that the observations
of the late light curve of SN 1054, from the historical records, are not compatible with the standard scenario,
in which the late time emission is powered by the radioactive decay of small amounts of 56 Ni. Based on model
calculations we quantify this discrepancy. The rather large mass of 56 Ni needed to power the late time emission,
0.06+0.02
−0.03 M , seems inconsistent with abundances in the Crab nebula. The late light curve may well have been
powered by the pulsar, which would make SN 1054 unique in this respect. Alternatively, the late light curve
could have been powered by circumstellar interaction, in accordance with scenarios in which 8−10 M stars are
progenitors to “dense wind” supernovae.
Key words. history and philosophy of astronomy – stars: supernova: general; individual: SN 1054 – ISM: supernova
remnants
1. Introduction
The Crab nebula is among the best studied objects in the
sky. Still, the nature of the progenitor star and many aspects of the explosion remain unclear. The ancient observations of SN 1054, conducted by astronomers in China
and Japan, have been analyzed by Clark & Stephenson
(1977). They conclude that SN 1054 was observable in
daytime for 23 days and during night for some 650 days
past explosion. Great attention has been directed to understand this light curve in terms of supernova theory
(Minkowski 1971; Clark & Stephenson 1977; Chevalier
1977; Pskovskii 1977; Wheeler 1978; Collins et al. 1999,
and references therein).
It is now widely accepted that SN 1054 was a corecollapse supernova, primarily due to the presence of the
pulsar. That SN 1054 would have been a type Ia supernova (SN Ia), an old suggestion that was recently
aired by Collins et al. (1999), is clearly in conflict also
with the large amount of mass in the filaments, and in
particular with its hydrogen-rich composition. However,
the idea that SN 1054 was a normal type II supernova (SN II), as was first suggested by Chevalier (1977),
is not unproblematic. The Crab filaments contain only
4.6 ± 1.8 M of material (Fesen et al. 1997) and cruise at
merely ∼ 1400 km s−1 (Woltjer 1972), which give a kinetic
energy an order of magnitude less than the canonical value
Send offprint requests to: J. Sollerman,
e-mail: [email protected]
for core-collapse supernovae, 1051 ergs. Some of this energy may also originate from the pulsar (Chevalier 1977).
As the early observations of SN 1054 indicate a rather
luminous explosion, Chevalier (1977) suggested that the
missing mass and energy of the Crab resides in a hitherto undetected outer shell. That some material indeed
exists outside the visible filaments was recently shown using HST observations (Sollerman et al. 2000).
Nomoto et al. (1982) constructed a detailed model for
the progenitor of SN 1054. They argued that the progenitor must have been more massive than 8 M in order to
leave a neutron star and less massive than ∼10 M to
be consistent with the observed metal abundances. An
8−10 M star would eject very little heavy elements
(Nomoto et al. 1982). In particular, it would eject very
small amounts of radioactive 56 Ni, responsible for the late
time emission of the supernova (Mayle & Wilson 1988).
In this report we want to draw the attention to the long
duration of the light curve of SN 1054, and point out that
this cannot be explained within the standard supernova
scenario, in which the powering of the emission at these
late phases is due to radioactive decay of a very low mass
of 56 Ni.
2. Discussion
2.1. Supernova light curves
The early light curves of SNe II are powered by the explosion energy slowly diffusing out of the ejecta. The large
Article published by EDP Sciences and available at http://www.aanda.org or http://dx.doi.org/10.1051/0004-6361:20000211
198
J. Sollerman et al.: SN 1054 at late times
diversity of light curve shapes in this phase (Patat et al.
1994) is largely due to variations in progenitor radius,
envelope mass and composition, as well as in the explosion energy itself. At later phases (>
∼ 150 days), the light
curves of SNe II are often powered by the radioactive decay of 56 Co→56 Fe, and then the late evolution is quite
uniform (Patat et al. 1994). The 56 Co is itself the decay
product of 56 Ni, synthesized in the supernova explosion.
The late light curve of the well studied SN 1987A was
reproduced by models with 0.07 M of 56 Ni (Kozma &
Fransson 1998a,b), and most SNe II light curves do follow
the decay rate of 56 Co (Barbon et al. 1984; Patat et al.
1994). In fact, the luminosity on the light curve tail can
be used to determine the mass of ejected 56 Ni, as has been
done for several supernovae (see Sollerman et al. 1998, and
references therein).
The radioactive energy from the decay of 56 Co is deposited in the supernova ejecta as γ-rays and positrons.
The luminosity on the light curve tail from the γ-rays is
given by Lγ = 1.26 1043 Fγ MNi e−t/111.3 ergs s−1 , where Fγ
is the fraction of the γ-rays trapped in the ejecta, MNi is
the amount of 56 Ni in solar masses, and 111.3 days is the
e-folding time for the decay of 56 Co. The positrons contribute Le+ = 4.45 1041 MNi e−t/111.3 ergs s−1 , assuming
they are all deposited locally.
To determine the nickel mass from the observed filter light curves, the γ-ray trapping and the bolometric correction have to be taken into account. In Fig. 1
we use SN 1987A to illustrate these concepts. There we
plot the bolometric light curve of SN 1987A (triangles)
from Bouchet & Danziger (1993). The upper dashed line
is given by the expressions above for a nickel mass of
0.07 M (Suntzeff & Bouchet 1990) assuming full trapping
of the γ-rays (Fγ = 1). This line fits the light curve tail at
epochs up to ∼ 300 days, but later the observed luminosity falls below the luminosity expected for full trapping,
due to an increasing leakage of γ-rays.
The γ-leakage can be illustrated using a simple model
with a central radioactive source, where the deposition
Fγ = (1 − e−τ ), and the γ-ray optical depth evolves as
τ = (t/t1 )−2 due to the homologous expansion. Here t1 is
the time when τ = 1. For SN 1987A, t1 ∼ 610 days gives a
reasonable agreement with the bolometric magnitudes as
shown by the dotted curve in Fig. 1. This means that
∼60% of the γ-rays were trapped at 650 days for
SN 1987A.
Also plotted in Fig. 1 is the V -band light curve of
SN 1987A (square symbols, Suntzeff & Bouchet 1990). It
can be seen that this filter light curve deviates substantially from the bolometric light curve after about 500 days.
At these late phases, the ejecta temperature is low and
most of the light is instead emitted in the infrared (Kozma
& Fransson 1998a,b).
Fig. 1. The upper long dashed line labeled “0.07” gives the
absolute bolometric magnitude expected from the radioactive
decay of 0.07 M of 56 Ni, assuming full trapping. The dotted
line allows for γ-ray leakage with t1 = 610, as explained in
the text. This gives a decent fit to the bolometric magnitudes
of SN 1987A (50 kpc, E(B − V ) = 0.16) shown by the triangles (Bouchet & Danziger 1993). The square symbols show
the absolute V -band magnitudes for SN 1987A (Suntzeff &
Bouchet 1990), which deviate substantially from the bolometric curve at late phases. The lower dashed line is the absolute
bolometric magnitude expected from the radioactive decay of
0.006 M 56 Ni, again assuming full trapping. The horizontal
line represents the naked eye detection limit for a source at a
distance of 2.0 kpc and with an extinction of E(B − V ) = 0.52,
the parameters for SN 1054. The error bar shown at day 650
for this detection limit encapsulates the errors described in the
text
2.2. The late time luminosity of SN 1054
The Crab is located at a distance of about 2.0 kpc
(Trimble 1973) with an extinction of E(B − V ) = 0.52
(Sollerman et al. 2000). From the historical records analyzed by Clark & Stephenson (1977) we know that
SN 1054 faded from visibility some 650 days after discovery. The detection limit for night time observations
was estimated to be 5.5 mag by these authors (Clark &
Stephenson 1977). SN 1054 must thus have had an absolute V (actually visual) magnitude of MV = −7.6 at
this epoch. In Fig. 1 we have indicated this limit together
with an error bar that encapsulates distances in the range
1500−2200 pc (Davidson & Fesen 1985), and an error of
±0.04 in E(B −V ). As a detection limit of 5.5 magnitudes
may be regarded too high, we encapsulate it with conservative limits of 5.5+0.7
−0.3 . This is also included in the error
bar in Fig. 1.
The Crab progenitor has been modeled as an
8−10 M star (Nomoto et al. 1982). The amount of 56 Ni
ejected in such an explosion is supposed to be very
small. Detailed calculations performed by Mayle & Wilson
(1988) indicate that no more than 0.002 M of 56 Ni should
be ejected from supernovae with progenitors in this mass
range.
J. Sollerman et al.: SN 1054 at late times
The 56 Ni eventually decays to 56 Fe and thus the current amount of iron probes the mass of ejected nickel.
Abundance analyses in the Crab are nontrivial, but indicate a subsolar iron abundance (Davidson 1978, 1979;
Henry 1984; Baustista et al. 1996). For an ejecta mass
of 4.6 M , solar abundance corresponds to 0.006 M of
iron. This is consistent with a low mass of ejected nickel,
as suggested by the explosion models of Mayle & Wilson
(1988).
Here we simply want to point out that the naked eye
observations of SN 1054 at 650 days seem to be inconsistent with the standard scenario where supernovae from
8−10 M stars are powered at late times by the radioactive decay of very small amounts of 56 Ni.
Even assuming full trapping and that all of the emitted
flux emerges in the visual band, (Fγ = 1, MV = Mbol ),
just barely keeps the supernova shining at 650 days past
explosion. The lower dashed line labeled “0.006” in Fig. 1
shows a full trapping, bolometric case for this amount of
ejected 56 Ni, and is fairly close to the lower limit of the
luminosity needed for naked eye visibility of the supernova
at 650 days.
This discrepancy is of course much more pronounced in
the more realistic case when the conservative assumptions
above are relaxed. For example, assuming that SN 1054
had the same γ-ray leakage and bolometric correction as
SN 1987A, ∼0.05 M of 56 Ni would be required to reach
MV = −7.6.
2.3. Modeling
Clearly, it is too simplistic to directly compare SN 1054
with SN 1987A. To quantify the discrepancy mentioned
above, we have therefore modeled SN 1054 in some detail. Lacking an explosion model, we base our input model
on the available observations. We have adopted an ejecta
mass of 4.6 M (Fesen et al. 1997) and a maximum velocity of 2300 km s−1 (Clark et al. 1983; Davidson & Fesen
1985). We assume that the density and composition are
constant throughout the ejecta. We use solar abundances
from Cameron (1982) except for helium, for which we
use a ratio of the mass fractions of helium and hydrogen,
X(He)/X(H) = 2 (e.g., Henry 1986).
A central source of radioactive 56 Ni is assumed.
Calculations have been done for 0.006 M , 0.04 M and
0.07 M of 56 Ni. The emission from SN 1054 is modeled in
detail from 200 to 800 days. The code is fully described in
Kozma & Fransson (1998a,b). In the decay of 56 Co, γ-rays
and positrons are emitted, and the thermalization of these
is calculated using the Spencer-Fano formalism (Kozma &
Fransson 1992). This time-dependent code successfully reproduces the detailed late time observations of SN 1987A
(Kozma 2000).
With this model, we estimate that only 32% of the
γ-rays were trapped at 650 days for SN 1054. The low
trapping is of course due to the low mass of the ejecta,
as compared to SN 1987A. In Fig. 2 we plot the light
199
Fig. 2. Absolute V -band light curves for the Crab model. The
upper curve is for 0.07 M of 56 Ni, while the lower curve is for
0.006 M of 56 Ni. The detection limit is the same as in Fig. 1
curves for the SN 1054 model for two different amounts
of ejected 56 Ni. At 650 days, a smaller amount of the luminosity comes out in the V -band for the low nickel-mass
model. This is because low amounts of nickel means less
heating, and as the temperature of the ejecta decreases
the emission is pushed further into the infrared.
From Fig. 2 we directly see that 0.006 M of 56 Ni could
not have provided the observed luminosity at 650 days.
Instead, the model with 0.07 M of 56 Ni (similar to the
mass ejected in SN 1987A), comes close to a V -magnitude
of 5.5 at day 650. Within the framework of this model,
a mass of 56 Ni of 0.06+0.02
−0.03 M was required to power
the supernova light curve when it faded from night time
visibility. This includes the errors estimated above for distance, reddening and naked eye-sensitivity. We have done
the same calculations also for a filter similar to the eye
sensitivity (Rhodopsin absorption curve, Kitchin 1991),
but the deviation from the V -filter is small, 0.07 mag for
the model with 0.07 M of 56 Ni at 650 days. Finally,
although according to Clark & Stephenson (1977) there
is no reason to question the dates of the Chinese sightings, an error of ±20 days in duration would introduce a
30% error in flux. We note that suggestions for alternative durations, although often based on less direct sources
(e.g., Pskovskii 1977; Collins et al. 1999), usually argue for
longer visibility of SN 1054, thus enhancing the problem
of keeping it shining at late times.
3. Powering scenarios
3.1. Radioactive decay
If radioactivity alone powered the late time emission, the
required mass of 56 Ni estimated above, 0.06+0.02
−0.03 M , is
significantly higher than that obtained in the explosion
models by Mayle & Wilson (1988), 0.002 M . Although
the unknown mechanism of core-collapse explosions makes
the existing explosion models rather uncertain, including
the exact amount of nickel mass, there are other reasons
200
J. Sollerman et al.: SN 1054 at late times
to believe that low mass SNe eject very small amounts of
56
Ni. Galactic chemical evolution models imply that the
amount of iron produced by SNe II is already quite high,
and Samland (1998) even suggested that the lower mass
limit of stars producing iron should be 11−12 M , instead
of the conventional 10 M .
Nevertheless, the above arguments cannot conclusively
argue that SN 1054 did not eject the 0.06 M of 56 Ni
required to maintain the late time luminosity. We therefore turn the attention to the measured abundances in the
Crab nebula.
Actually, only helium is enhanced in this supernova
remnant, while the abundances of C, N, O and Fe seem
to be (sub)solar (Davidson & Fesen 1985). In Sect. 2.2
we saw that solar abundance of iron for 4.6 M ejecta
corresponds to 0.006 M . The amount of 56 Ni required
to power the late time light curve, 0.06+0.02
−0.03 M , would
thus correspond to a present iron abundance which is 9+4
−5
times higher than solar abundance.
If radioactivity powered the supernova, the iron must
be locked up in dust. Dust is clearly present in the nebula,
and it is nontrivial to determine the dust mass (Sankrit
et al. 1998), although estimates seem to indicate that the
dust mass is low (Davidson & Fesen 1985). Note that this
scenario would also require large amounts of other metals to be locked up in dust. As the iron-group elements
are produced in the very center of the exploding star,
we do not expect to find a large amount of iron, while
the CNO-abundance has not been enhanced. For example,
SN 1987A, which ejected 0.07 M of 56 Ni, also ejected almost 2 solar masses of oxygen. Even the 11 M model of
Woosley & Weaver (1995), which ejects 0.07 M of 56 Ni,
and only 0.136 M of oxygen, provides an oxygen abundance higher than solar. We believe that the scenario in
which SN 1054 was powered by 0.06 M of 56 Ni, but where
all the nucleosynthesized metals are presently locked up in
dust, is not very convincing. We therefore briefly turn our
attention to alternative scenarios.
be responsible for the late time luminosity of SN 1054. He
worried, however, about the fact that the accretion luminosity would not be able to escape from the vicinity of the
neutron star during the first months, as the luminosity is
trapped by the inflow (see also Benetti et al. 2000). As
shown in Fig. 2, this need not be a problem, as even a low
mass of ejected 56 Ni is able to keep the supernova shining
for some 500 days. If the accretion is mediated via a disk,
the luminosity could perhaps be even larger than in the
spherical case.
Unknown in these scenarios is the fraction of the luminosity escaping in different bands. In fact, the full
Eddington luminosity would have to fall in the visible band to make SN 1054 observable at 650 days
(3.5 1038 ergs s−1 corresponds to Mbol = −7.7). This appears to be rather unlikely.
Pulsar nebulae in supernovae, with special attention
to the Crab, were investigated by Chevalier & Fransson
(1992). Unfortunately, they did not address the question
highlighted here, the luminosity of SN 1054 at 650 days.
In their scenario, the pulsar powers a bubble that shocks
and ionizes the supernova ejecta, and their calculations
suggested that 1.5% of the total pulsar luminosity could be
converted to radiation. This would be too low to account
for the luminosity of SN 1054 at day 650. However, if
the pulsar bubble is a significant source of synchrotron
emission (Chevalier 1996), the efficiency might be higher.
Another interesting possibility is that the pulsar was born
with a very rapid spin period (see Atoyan 1999), and thus
a very high initial spin-down luminosity.
In summary, although not investigated in detail, there
are several ways in which a pulsar could contribute to
the luminosity of supernovae. This has so far never been
unambiguously observed. If the pulsar was indeed responsible for the late light curve, this would make SN 1054 a
unique case.
3.2. The pulsar
Another mechanism important for supernova light
curves is interaction with circumstellar material (CSM).
Circumstellar interaction is responsible for the emission
at late phases for a number of supernovae, such as
SNe 1979C, 1980K, 1988Z, 1993J and 1995N. Such interaction can maintain a SN luminosity of several × 1038
ergs s−1 for many years (e.g., Chugai et al. 1995). In this
respect, we note that the Crab could fit into the scenario
of 8−10 M stars being progenitors to the so called “dense
wind” supernovae (Chugai 1997), where the supernova
ejecta interact with a dense superwind from the progenitor
star.
16
The dense wind must have extended out to >
∼ 6 10 cm
4
−1
for a maximum ejecta velocity of vej ∼ 10 km s . This
means that the wind started >
∼ 2(vej /vw ) years before the
SN breakout. Here vw is the wind velocity. Comparing
with the line fluxes in Chevalier & Fransson (1994), we
find that the late light curve can be explained if M˙ /vw
If radioactivity did not power SN 1054 at late times, the
obvious candidate is the pulsar that powers the nebula
today. Already Chevalier (1977) suggested that the pulsar
could contribute to the late time supernova light curve. In
fact, unless the bulk of the iron is locked up in dust, and
circumstellar interaction was unimportant (see Sect. 3.3),
the pulsar would have to make up for all of the late time
luminosity, as 0.006 M of 56 Ni could not have kept the
SN visible for more than ∼ 500 days (Fig. 2).
There are many ways in which a pulsar can contribute
to the optical luminosity of a supernova. Accretion onto
the neutron star could be either spherical or in a disk, depending on the angular momentum of the infalling matter.
A steady spherical accretion is supposed to reach a maximum Eddington luminosity of LEdd = 3.5 1038 ergs s−1 ,
and Chevalier (1989) suggested that this scenario might
3.3. Circumstellar interaction
J. Sollerman et al.: SN 1054 at late times
was typically in excess of 10−5 M yr−1 /10 km s−1 . Here
M˙ is the mass loss rate during the superwind. The swept
up wind should in this case now coast freely outside the
present nebula. However, no sign of ejecta, or swept up
wind, moving at velocities of order 104 km s−1 has been
identified (e.g., Fesen et al. 1997).
Chugai & Utrobin (1999) suggested that SN 1054 was
similar to the low-energy (∼4 1050 erg) event SN 1997D
(Turatto et al. 1998; Benetti et al. 2000), and that no fast
ejecta exist. In this case, circumstellar powering of the
late light curve could be more difficult as the luminosity
3
of the circumstellar shock scales as ∝ vej
. Furthermore,
in a low-energy explosion, the peak luminosity is more
likely to be lower, and Chugai & Utrobin (1999) therefore
suggested that circumstellar interaction was important for
SN 1054 also at the early phase. A low-energy explosion
model with a circumstellar shell was explored already by
Falk & Arnett (1977), and they found a high efficiency
in the conversion of shock energy to visual light during
the peak, in accordance with the suggestion of Chugai
& Utrobin (1999). Although there is thus no direct support for circumstellar interaction as the cause for the late
emission in the Crab, it is still premature to rule out this
possibility.
4. Summary
SN 1054, the creation of the Crab nebula and the Crab
pulsar, is the typical example of an 8−10 M supernova. Such supernovae are expected to eject only minute
amounts of 56 Ni, and here we demonstrate that SN 1054
could not have been powered by such a small mass of nickel
at late times. The required amount of 56 Ni, ∼0.06 M ,
is much larger than suggested by abundance analyses of
the Crab, and we therefore discuss alternative solutions.
The pulsar may have powered the supernova, which would
make SN 1054 unique in this respect. Alternatively, the
progenitor of SN 1054 could have had a dense wind and
the supernova could then have been powered by circumstellar interaction.
Acknowledgements. We thank the referee for careful reading.
References
Atoyan, A. M. 1999, A&A, 346, L49
Barbon, R., Cappellaro, E., & Turatto, M. 1984, A&A, 135, 27
Bautista, M. A., Peng, J., & Pradhan, A. K. 1996, ApJ, 460,
372
Benetti, S., Turatto, M., Balberg, S., et al. 2000, accepted for
publication in MNRAS [astro-ph/0010332]
Bouchet, P., & Danziger, J. I. 1993, A&A, 273, 451
Cameron, A. G. W. 1982, in Essays in Nuclear Astrophysics,
201
ed. C. A. Barnes, D. D. Clayton, & D. N. Schramm
(Cambridge: Cambridge Univ. Press), 23
Chevalier, R. A. 1977, in Supernovae, ed. D. Schramm
Chevalier, R. A. 1989, ApJ, 346, 847
Chevalier, R. A. 1996, in Supernovae and Supernova remnants,
IAU 145, ed. R. McCray, & Z. Wang
Chevalier, R. A., & Fransson, C. 1992, ApJ, 395, 540
Chevalier, R. A., & Fransson, C. 1994, ApJ, 420, 268
Chugai, N. N. 1997, Astron. Rep., 41, 5, 672
Chugai, N. N., Danziger, I. J., & Della Valle, M. 1995, MNRAS,
276, 530
Chugai, N. N., & Utrobin, V. P. 2000, A&A, 354, 557
Clark, D. H., & Stephenson, F. R. 1977, The Historical
Supernovae (Pergamon Press)
Clark, D. H., Murdin, P., Wood, R., et al. 1983, MNRAS, 204,
415
Collins, G. W., Claspy, W. P., & Martin, J. C. 1999, PASP,
111, 871
Davidson, K., & Fesen, R. A. 1985, ARA&A, 23, 119
Davidson, K. 1978, ApJ, 220, 177
Davidson, K. 1979, ApJ, 228, 179
Falk, S. W., & Arnett, W. D. 1977, ApJS, 33, 515
Fesen, R. A., Shull, M. J., & Hurford, A. P. 1997, AJ, 113, 354
Henry, R. B. C. 1984, ApJ, 281, 644
Henry, R. B. C. 1986, PASP, 98, 1044
Kitchin, C. R. 1991, Astrophysical techniques, 2nd ed., 4
Kozma, C. 2000, in Future Directions of Supernova Research:
Progenitors to Remnants, ed. S. Cassisi, & P. Mazzali,
in Memorie della Societa Astronomica Italiana, 71, 401
[astro-ph/9903405]
Kozma, C., & Fransson, C. 1992, ApJ, 390, 602
Kozma, C., & Fransson, C. 1998, ApJ, 496, 946
Kozma, C., & Fransson, C. 1998, ApJ, 497, 431
Mayle, R., & Wilson, J. R. 1988, ApJ, 334, 909
Minkowski, R. 1971, IAU Symp. No. 46, ed. R. D. Davies, &
F. G. Smith (Reidel Dordrecht)
Nomoto, K. Sugimoto, D., Sparks, W. M., et al. 1982, Nature,
299, 803
Patat, F., Barbon, R., Cappellaro, E., & Turatto, M. 1994,
A&A, 282, 731
Pskovskii, D., Yu 1978, AZh, 55, 737
Samland, M. 1998, ApJ, 496, 155
Sankrit, R., Hester, J. J., Scowen, P. A., et al. 1998, ApJ, 504,
344
Sollerman, J., Cumming, R. J., & Lundqvist, P. 1998, ApJ,
493, 933
Sollerman, J., Lundqvist, P., Lindler, D., et al. 2000, ApJ, 537,
861
Suntzeff, N. B., Nicholas, B., Phillips, M. M., et al. 1992, ApJ,
384, L33
Suntzeff, N. B., & Bouchet, P. 1990, AJ, 99, 650
Turatto, M., Mazzali, P. A., Young, T. R., et al. 1998, ApJ,
498, L129
Trimble, V. 1973, PASP, 85, 579
Wheeler, J. C. 1978, ApJ, 225, 212
Woltjer, L. 1972, ARA&A, 10, 129
Woosley, S. E., & Weaver, T. A. 1995, ApJS, 101, 181


© Copyright 2026