
Tech Boot Camp: Microsoft Office Basics February 11, 2009 INSTRUCTIONAL TECHNOLOGY
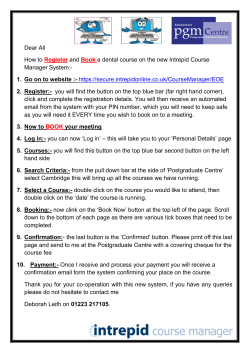
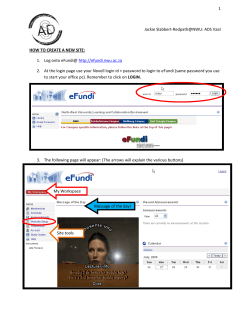
INSTRUCTIONAL TECHNOLOGY DEPARTMENT Tech Boot Camp: Microsoft Office Basics February 11, 2009 http://techbootcamp.weebly.com/technology-operations.html MACOMB INTERMEDIATE SCHOOL DISTRICT Instructional Technology Department 44001 Garfield Rd. Clinton Twshp., MI 48038 Fax: 586 228 1523 Frank Miracola: [email protected] 586 228 3417 Jennifer Parker-Moore, Ed.D. [email protected] 586 228 3517 http://www.misd.net Macomb Intermediate School District Department of Instructional Technology Presents Tech Boot Camp: Microsoft Office Basics February 11, 2009 featuring Dr. Jennifer Parker-Moore, Interactive Learning Consultant Mr. Frank Miracola, Interactive Learning Consultant Need an introduction to Word, Excel or PowerPoint? Get back to basics with this introductory level class that incorporates the basics of word processing, spreadsheets, and presentations with online productivity tools. Check out ZoomIt, shortcuts, templates, and other tips and tricks that make using Microsoft Office a snap! Word Learn how the experts create basic documents in Word, with some formatting and shortcuts thrown into the mix. Locate templates, create attractive layouts, add headers and footers, or track changes to your document. Excel Charts and spreadsheets are easy if you just have the basics. Learn how to use formulas to perform calculations within the worksheet. Create multiple worksheets, change names or customize formatting. Create a worksheet or chart in a snap! PowerPoint Add photos to create a photo album, prepare a digital story, setup a slide show for your Open House, or plan a lesson for students. All can be done very simply in PowerPoint. Learn how to create slides, add clipart, movies or photos, unique backgrounds and transitions, and WordArt to make it fun and you’re on your way! INSTRUCTIONAL TECHNOLOGY DEPARTMENT MICROSOFT WORD MACOMB INTERMEDIATE SCHOOL DISTRICT Instructional Technology Department 44001 Garfield Rd. Clinton Twshp., MI 48038 Fax: 586 228 1523 Frank Miracola: [email protected] 586 228 3417 Jennifer Parker-Moore, Ed.D. [email protected] 586 228 3517 http://www.misd.net Word Overview Using the Menu Bar Standard New Open Save Email Search Print Preview Spellcheck Cut, copy, paste Format painter Undo Hyperlinks Tables Columns Formatting Font Point size Bold, italics, underline Left, center, right, full justification Numbering Bullets Left, right indents Borders Highlighting Font color Menus File Edit View Insert o Symbols o Textboxes o Clipart, picture, objects Format o Paragraph Spac ing Han ging inde nts Tools o Track changes o Options (show all) Table Window Help Extra Word stuff Shortcuts Track changes Labels & Merge are too advanced for today! Word Hands on: Country of Kenya Activity or American Revolution Free Quick Reference Card Print It! Share it! Post it! Computer Training Courseware & eLearning www.customguide.com The Word 2003 Screen Title Bar Shortcuts Standard Toolbar Formatting Toolbar General Menu Bar Ruler End of Document Marker Task pane Vertical Split Bar Vertical Scroll Bar Open a Document Save a Document Print a Document Close a Document Undo Redo or Repeat Select Everything Help <Ctrl> + <O> <Ctrl> + <S> <Ctrl> + <P> <Ctrl> + <W> <Ctrl> + <Z> <Ctrl> + <Y> <Ctrl> + <A> <F1> Navigation — GO TO: Up One Screen View Buttons <Page Up> Down One Screen <Page Down> Beginning of a Line <Home> Status Bar Horizontal Scroll Bar The Fundamentals The Standard Toolbar New Blank Document Save Open E-mail Print Spell Check Cut Paste Insert Hyperlink Undo Print Research Copy Format Preview Painter Redo Insert Table Columns Document Map Insert Drawing Tables Worksheet and Borders Reading View Zoom End of a Line <End> Beginning of Document <Ctrl> + <Home> End of Document <Ctrl> + <End> Open the Go To Dialog Box <F5> Editing Show/ Hide Help Cut Copy Paste <Ctrl> + <X> <Ctrl> + <C> <Ctrl> + <V> To Create a New Document: Click the New Blank Document button, or press <Ctrl> + <N>. To Get Help: Press <F1> to open the Help task pane, type your question and press <Enter>. Open To Open a Document: Click the button on the Standard toolbar, or select File → Open from the menu, or press <Ctrl> + <O>. To Cut or Copy: Select the text and click the Cut button or Copy button on the Standard toolbar, or press <Ctrl> + <X> (cut) or <Ctrl> + <C> (copy). Save To Save a Document: Click the button on the Standard toolbar, or select File → Save from the menu, or press <Ctrl> + <S>. To Paste: Place the insertion point where you want to paste the text, click the Paste button on the Standard toolbar, or press <Ctrl> + <V>. To Save a Document with a Different Name: Select File → Save As from the menu and enter a different name for the document. To Move Text using Drag and Drop: Select the text you want to move, drag the text to the destination, and release the mouse button. Like this Quick Reference? You’ll LOVE the CD and book! To Preview a Document: Click the Print Preview button on the Standard toolbar or select File → Print Preview from the menu. Undo button on the To Undo: Click the Standard toolbar or press <Ctrl> + <Z>. Available at Amazon.com or your local bookstore, Personal Trainer will help you become a Word 2003 superhero! Interactive training CD with more than 12 hours of engaging lessons on Word Print To Print a Document: Click the button on the Standard toolbar, or select File → Print from the menu, or press <Ctrl> + <P>. For Advanced Print Options: Select File → Print from the menu. To Correct a Spelling Error: Right-click the error to bring up a suggestion menu. To Use the Thesaurus: Right-click the word you want to look up, select Synonyms from the shortcut menu, and select a synonym from the list. To Find Text: Select Edit → Find from the menu or press <Ctrl> + <F>. To Find and Replace Text: Select Edit → Replace from the menu, or press <Ctrl> + <H>. Formatting Bold Italics Underline Align Left Center Align Right Justify <Ctrl> + <B> <Ctrl> + <I> <Ctrl> + <U> <Ctrl> + <L> <Ctrl> + <E> <Ctrl> + <R> <Ctrl> + <J> Fully-illustrated and easy-to-read book Click to Learn More Bite-sized lessons: Learn what you need, at your own pace © 2005 CustomGuide, Inc. All rights reserved. © 2005 O’Reilly Media, Inc. O’Reilly logo is registered trademark of O’Reilly Media, Inc. You may print and distribute copies of this Quick Reference as long as you do not alter or sell them in any way. All other rights reserved. Formatting Tables Right Align The Formatting Toolbar Font Size Italic Style List Styles and Formatting Font List Left Align The Tables and Borders Toolbar Bullets Line Spacing Increase Highlight Indent Center Border Bold Numbering Decrease Underline Justify Indent Line Style Border Color Line Width Eraser tool Font Color To Format Selected Text: Change the style of text by clicking the Bold button, Italics button, or Underline button on the Formatting toolbar. Change the font type by selecting a font from the Font list on the Formatting toolbar. Change the font size by selecting it from the Font Size list. To Copy Formatting with the Format Painter: Select the text with the formatting you want to copy. Click the Format Painter button on the Standard toolbar and drag the Format Painter pointer across the text to which you want to apply the formatting. Double-click the Format Painter button to apply the formatting multiple times. To Change Paragraph Alignment: Select the paragraph(s) and Center, Right, or click the appropriate alignment button ( Left, Justify) on the Formatting toolbar. To Indent a Paragraph: Click the Increase Indent button on the Formatting toolbar, or click and drag the Left Indent marker on the ruler. To Decrease an Indent: Click the on the Formatting toolbar. Draw Table Decrease Indent button To Add a Tab Stop: Choose the type of tab you want to insert from the Tab selector box and click on the ruler to add the tab. Or select Format → Tabs from the menu and create tabs in the Tabs dialog box. To Adjust a Tab Stop: Click and drag the tab stop to the new position on the ruler. For exact measurements, select Format → Tabs from the menu and modify the tabs in the Tabs dialog box. To Remove a Tab Stop: Drag the tab stop from the ruler. To Change Paragraph Line Spacing: Select Format → Paragraph from the menu, click the Line Spacing list arrow, and select the spacing option. To Create a Bulleted or Numbered List: Select the paragraph(s) you want to bullet or number, and click the Bullets button or the Numbering button on the Formatting toolbar. To Add a Border: Select the paragraph and select a border from the Border button arrow on the Formatting toolbar. To Change a Document’s Margins: Select File → Page Setup from the menu, click the Margins tab, and adjust the margins. To Change a Page’s Orientation: Select File → Page Setup from the menu, click the Margins tab and select the orientation. To Add or View a Document Header or Footer: Select View → Header and Footer from the menu. To Switch Between the Header and Footer: Click the Switch Between Header and Footer button on the Header and Footer toolbar. To Insert a Manual Page Break: Place the insertion point where you want to insert the page break and press <Ctrl> + <Enter>. To Insert a Section Break: Select Insert → Break from the menu and select the type of section break you want to insert. To Create Newspaper Columns: Click the Columns button on the Standard toolbar and drag to select the number of columns you want. Cell Shading Color Add Borders Merge Align Cells button Insert Table Distribute Sort Columns Descending Evenly Text Direction Table AutoSum Split Cells Distribute AutoFormat Sort Rows Evenly Ascending Insert Table button on the To Create a Table: Click the Standard toolbar and select the number of columns and rows from the grid. To Adjust Column Width or Row Height: Drag the right border of the column, or drag the bottom border of the row. Right-click the border to AutoFit the column or row according to its contents. To Delete a Column or Row: Select the column or row, click the right mouse button and select Delete Columns or Delete Rows from the shortcut menu, or select Table → Delete → Columns or Rows from the menu. To Insert a Column or Row: Select the column or row where you want the new column or row to be inserted. Click the right mouse button and select Insert Columns or Insert Rows from the shortcut menu, or select Table → Insert → Columns or Rows from the menu. Drawing and Graphics The Drawing Toolbar Draw Menu Draw Text Draw Draw Line Rectangle Box Select Insert Draw Draw Objects AutoShape Arrow Circle Font Color Insert Clip Art Fill Object Color Insert Org Chart Insert Insert Picture WordArt Shadow Dash Style Line Color Line Style Arrow Style 3-D Effects To View the Drawing Toolbar: Click the Drawing button on the Standard toolbar, or select View → Toolbars → Drawing. To Insert a Clip Art Graphic: Select Insert → Picture → Clip Art, search by keyword, click the graphic’s list arrow, and select Insert. To Insert a Picture: Select Insert → Picture → From File from the menu, navigate to and select the file, and click Insert. To Draw an Object: Click the type of object you want to draw on the Drawing toolbar. Draw the shape by clicking on the document with the pointer and dragging until the shape reaches the desired size. To Move an Object: Click and drag the object using the mouse. To Resize an Object: Click the object to select it and drag the object’s sizing handles until the shape reaches the desired size. Mail Merge 1. Select the document type: Select Tools → Letters and Mailings → Mail Merge Wizard from the menu, select the type of main document type you want to use, and click Next. 2. Select the starting document: Specify how you want to set up your letters and click Next. 3. Select recipients: Specify the list of recipients you want to use (and enter the recipients if necessary) and click Next. 4. Write your letter: Place the insertion point where you want to insert the mail merge information in the Main Document and click the appropriate item(s) in the mail merge task pane. Click Next when you’re finished. 5. Preview your letters: Browse the merged letters and click Exclude to exclude a letter. Click Next when you’re finished. 6. Complete the Merge: Specify where you want to send the merged letters. © 2005 CustomGuide, Inc. All rights reserved. © 2005 O’Reilly Media, Inc. O’Reilly logo is registered trademark of O’Reilly Media, Inc. You may print and distribute copies of this Quick Reference as long as you do not alter or sell them in any way. All other rights reserved. Appendix A: Keyboard Shortcuts LINK to practice document: Women in American Revolution • • • • • • • • • • Ctrl – C = Copy Ctrl – V = Paste Ctrl – X = Cut Ctrl – Z = Undo Ctrl – A = Select All Ctrl – 1 = Single Space Ctrl – 2 = Double Space Alt – Tab = Move Between Programs Selecting B when in PPT = Screen Black Selecting W when in PPT = Screen White • Print Screen – Either Control+PrintScreen or just Print Screen Button Appendix B: Microsoft Word Shortcuts Zoom In and Out You can use the scroll button on your mouse to zoom in and out of documents quickly. Just hold down the Ctrl key and roll the scroll wheel forward to get a closer view of the document, or roll it back to shrink it. F7: Run the spell-checker. Shift-F7: Run the thesaurus. Shift-F3: Toggle Selected text between lowercase, initial capitals, and uppercase. F12: Open the Save As dialog Quickly Drawing a Line in a Word Document 3 hypens (---) and enter • • • Double click = to start typing anywhere in a Word document. Windows Key + D = to go desktop. Windows Key + M = minimize all open programs and documents. Format Painter INSTRUCTIONAL TECHNOLOGY DEPARTMENT MICROSOFT EXCEL MACOMB INTERMEDIATE SCHOOL DISTRICT Instructional Technology Department 44001 Garfield Rd. Clinton Twshp., MI 48038 Fax: 586 228 1523 Frank Miracola: [email protected] 586 228 3417 Jennifer Parker-Moore, Ed.D. [email protected] 586 228 3517 http://www.misd.net Excel Overview Standard Same as above Sort ascending, descending Chart wizard Formatting Same as above Merge and center Currency, percent, commas, decimals Formulas COUNT AVERAGE MAX MIN SUM MDAS (*/+-) Charting Chart Wizard Types range o o o o (rows vs. columns) X vs. Y titles, axes, gridlines, legends, data labels, data tables discuss difference - as new chart, in spreadsheet Excel Hands On: Practice 1,2,3 Add datasheets/worksheets, renaming Printing, set print area, what to print Office Basics - Excel Tour of screen: Columns (alphabetical) Rows (numbered) Cells identified as the intersection of Column/Row: “A1” Navigation Use arrow keys, Home (takes you to cell A1), End, Page Up, Page Down, Tab, Shift+Tab, or the Function Key 5 (F5) will GO TO a certain cell. Entering Data You may key information in any cell. Utilize the formatting tool bar to change the format of the information to dollars, percents, etc. Formatting cells On the tool bar, click on the $, %, or comma to format cells a certain way. You can also increase or decrease the number of decimals. Format, Cells Change the width of columns Use mouse to click between columns and drag to width desired or use Format, Column, Width Change the height of rows Use mouse to click between rows and drag to width desired or use Format, Row, Height Insert Row/Column Click where you want the row above or column to the left of and use Insert, Row or Column Wrap text Format, Cells, Alignment, check the “Wrap text” box Population of Northern Africa Merging cells Highlight two cells, Format, Cells, Merge cells Editing Cells You may type over a cell or go to the Edit mode with the Function Key 2 (F2). To delete rows or columns, click on Edit, Delete and select rows or columns. Sorting Click and drag (highlight) columns to be sorted. Click on Data, Sort, Ascending or Descending, OK If you wish to sort by two criteria (for example Western Africa and Population, identify both) Office Basics - Excel Charting To chart, click and drag on (highlight)the information to be charted. Click on the chart button on the tool bar. Complete steps 1-4. 1 2 3 4 When completing step 4, determine how you want to use the chart. “As New Sheet” will create a separate piece of paper. “As Object In” will let you insert the chart in an Excel sheet. Office Basics - Excel Chart Options Titles – Put titles on Chart, X (horizontal) axis title, Y (vertical) axis title Axes – format of graph using X or Y axis Gridlines – turn X and Y gridlines on or off Legend – A box to the left or right indicating what each color bar represents Data Labels – value or percent of each color bar, turn on or off Data Table – turn on or off ; the data sheet under the chart Formulas You can Count (only count cells that have numbers in them – it will not count cells that have letters [ex: names], Multiply(*), Divide (/), Add (+), Subtract (-), AVERAGE, and SUM. Or Use the AutoSum ∑ Headers and Footers Insert, Headers & Footers, Custom Header/Custom Footer Select left, middle or right heading Borders Use the borders button to add double lines or single lines under columns and make it look like a professionally prepared Accounting document! Name Date A 1 2 3 4 5 6 7 8 9 10 11 12 13 14 15 16 17 18 19 20 21 22 23 24 25 26 27 28 29 30 31 32 33 34 35 36 37 38 39 40 B C D E Excel Basics Practice 1 Car Expenses Depreciation Insurance Maintenance and Repairs Gas/Oil Tires Taxes/Fees Total Expenses 1 2 3 4 5 6 7 8 9 10 Amount $ 49.00 $ 9.00 $ 5.00 $ 22.00 $ 2.00 $ 13.00 $ 100.00 Complete the following activities Create the worksheet Format the expensese in currency Align the expenses to the right Create a pie graph P t titl Put a title on the graph th h Label the pie graph with a legend on the right Label the pie graph with data labels that show percents Use a formula to find total expenses Put a header/footer on to include name, date Print on one page with formulas showing Car Expenses Depreciation 24% Insurance Maintenance and Repairs 50% 4% 3% Gas/Oil Tires Taxes/Fees 11% 1% 7% Total Expenses F Name Date A 1 2 3 4 5 6 7 8 9 10 11 12 13 14 15 16 17 18 19 20 21 22 23 24 25 26 27 28 29 30 31 32 33 34 35 36 37 38 39 40 41 42 43 B C Excel Basics Practice 2 Name Sarah Shawn Raphael Michael Tommy Jeremy Su Li Carl Terri Kristen Juanita Pedro LaShawn Renee Stephen Sonya Todd Corbin Lester Ronald Jerry Jimmy MaryAlice Jay Conrad Sinbad Karly Samantha Lynn How many are over 5'6" What is the most frequent age What is the median/middle age What is the average age How old is the oldest student How old is the youngest student Height over 5'6" 1 1 1 1 1 1 1 1 1 1 1 1 1 1 1 1 1 =COUNT(B2:B30) Age 12 13 12 12 12 14 11 11 12 13 14 12 11 11 15 14 13 12 13 12 12 13 12 12 12 13 12 13 13 =MODE(C2:C30) =MEDIAN(C2:C30) =AVERAGE(C2:C30) =MAX(C2:C30) =MIN(C2:C30) D E Directions F 1 2 3 4 5 6 Enter the data in the worksheet G Center titles and data in Height, Age column Sort names AtoZ Put Header/Footer w/ Name, Date, Hour Use formulas to answer questions Print with formulas showing and on one page Name Date A 1 2 3 4 5 6 7 8 9 10 11 12 13 14 15 16 17 18 19 20 21 22 23 24 25 26 27 28 29 30 31 32 33 34 35 36 37 38 39 40 41 42 43 44 45 46 47 48 49 50 51 52 53 54 55 56 57 58 59 60 61 62 63 B C D E F G Excel Basics Practice 3 Population of Africa Mid - 2001 in millions Northern Africa Algeria Egypt Libya Morocco Sudan Tunisia Western Sahara 177 =SUM(B6:B12) 31 69.8 5.2 29.2 31.8 9.7 0.3 Western Africa Benin Burkina Faso Cape Verde Cote d'Ivorie Gambia Ghana Guinea Guinea-Bissau Liberia Mali Mauritania Niger Nigeria Senegal Sierra Leone Togo 240 =SUM(B15:B30) 6.6 12.3 0.4 16.4 1.4 19.9 7.6 1.2 3.2 11 2.7 10.4 126.6 9.7 5.4 5.2 Eastern Africa Burundi Comoros Djibouti Eritrea Ethiopia Kenya Mdagascar Malawi Maritius Mayotte Mozambique Reunion Rwanda Seychelles Somalia Tanzania Uganda Zambia Zimbabwe 251.9 =SUM(B33:B51) 6.2 0.6 0.6 4.3 65.4 29.8 16.4 10.5 1.2 0.5 19.4 0.7 7.3 0.1 7.5 36.2 24 9.8 11.4 Middle Africa Angola Cameroon Central African Republic Chad Congo Congo, Dem. Rep. Of Equatorial Guinea Gabon Sao Tome and Principe 99 =SUM(B54:B62) 12.3 15.8 3.6 8.7 3.1 53.6 0.5 1.2 0.2 SAMPLE CHART Northern Africa Population 80 70 60 50 40 30 20 10 0 Algeria Egypt Libya Morocco Sudan 1 In Millions Tunisia Western Sahara SAMPLE FORMULAS Count =COUNT(B15:B30) Maximum =MAX(B15:B30) Minimum =MIN(B15:B30) Add =B15+B16 Multiply =B16*B17 Divide =B15/B17 Subtract =B17-B18 Sum =SUM(B15:B30) Average =AVERAGE(B15:B30) Southern Africa Botswana Lesotho Namibia South Africa Swaziland 50.3 =SUM(E44:E49) 1.6 2.2 1.8 43.6 1.1 INSTRUCTIONAL TECHNOLOGY DEPARTMENT MICROSOFT POWERPOINT MACOMB INTERMEDIATE SCHOOL DISTRICT Instructional Technology Department 44001 Garfield Rd. Clinton Twshp., MI 48038 Fax: 586 228 1523 Frank Miracola: [email protected] 586 228 3417 Jennifer Parker-Moore, Ed.D. [email protected] 586 228 3517 http://www.misd.net PowerPoint Overview Standard Same as above Formatting Same as above Menus File Edit View Insert Format Tools Slide Show Views of PowerPoint Outline, Notes, Slide Sorter, Slideshow Adding slides Format Slide Design, Slide layout, Backgrounds Fuzzy Boxes Two levels of fuzz; removing a fuzzy box Inserting Objects Picture Photo Album Chart Organizational chart Movie Sound Word Art Slideshow Animation, builds, transitions on objects and text Printing Specify notes, slides, 2-3-4-6 slides per page, outline, etc. PowerPoint Hands On: Create Social Studies Project – Country or Biographical Figure, Digital Story, Open House presentation Po erPoint PowerPoint -The Basics Basics-- 1 Common Abuses of PowerPoint Reading slides Text too small Using sentences instead of bullets so that it takes a lot of room and you just keep talking! Color conflicts Moving or flying text Annoying use of sounds Complex diagrams or charts 2 PowerPoint Training Outline Starting PowerPoint Click Start, Programs, Microsoft PowerPoint Click File, New There are many choices: Blank Presentation will be starting with no backgrounds or pre-defined outlines (Apply) Design Template will give you a choice of backgrounds for your presentation Auto Content Wizard gives you a variety of pre-defined outlines that you can modify to fit your presentation. These presentations vary from General to Sales/Marketing, Projects, Corporate or Carnegie Coach. Tour the Screen – The views of PowerPoint Outline view Notes o reduced slide with area for notes; often used for handouts Full Page Slide Slide Sorter o see all slides on the screen Slide Show Menu bar tips File o Save or Save as Web Page Edit o Undo is the same as on the toolbar View o Normal View the slide in its normal format o Slide Sorter View all slides on the screen at once o Notes Slide is smaller and includes an area for notes o Slide Show Continuous, can be timed or change slides through a mouse click o Master o B&W Color is a toggle switch Insert o New Slide o Picture here is where you add clipart, autoshapes, organizational charts, Word Art, Scanner/Digital Images, or a table You can insert animated gifs through clipart Insert, Pictures, Clipart, select pictures, sounds or motions o Text box o Movies & Sounds for pre-recorded digital video clips on file o Chart Use your Excel knowledge to enter cell information o Table Use your Word knowledge to modify the format Format o Font Can also be changed on the tool bar o Slide Layout Select the way you want your slide to look, including graphs, organizational charts, clipart or tables o Slide Color Scheme Change the colors on the slide o Background Select a new color scheme for the background Watch the color combinations Consumer colors are RED, BLUE AND YELLOW Use care in selecting how busy the slides are and how bright o Apply Design Template Select a pre-designed artistic background for all slides Again, watch how busy and bright they are Tools o Spelling Check the spelling of all slides – one error can make you look like a fool! Slide Show o View Show o Action Buttons Add buttons on the slide that will make sounds, run mini-programs, or go into Word for example. o Preset Animation Have your text fly in from the right, or drop from the “sky” o Slide Transition Create transition/build effects on all slides to show the beginning or ending of a slide Inserting Pictures off the Internet Right click on picture on the Internet Save Image As Make sure the file type is a .jpg, .gif. or some type of picture type so it can be inserted Go to PowerPoint Insert, Picture, From file MICROSOFT POWERPOINT 2003 Some important differences in how you do things … Using the AutoContent Wizard File, New, From AutoContent Wizard Changing the Design Template File, New, Design Templates, review the list in “Available for Use” and select one by double-clicking. Additional PowerPoint Backgrounds http://www.freefoto.com/pictures/powerpoint_backgrounds/index.asp http://www.powerpointart.com/cgi-bin/imagefolio/imageFolio.cgi http://www.slideboom.com Formatting the Slide Layout Format, Slide Layout, select layout from column on right. Note: change the views NORMAL, SLIDE SORTER, or SLIDESHOW in the bottom right corner. Use the tabs on the left column to toggle between OUTLINE and SLIDES views. Adding Animation with Transitions and Builds Transitions – for changes between slides Go to Slide Sorter view, Slide Show, Slide Transition, click on the slide you wish to transition or Apply to All Slides, select the effect in the Apply to selected slides window. Builds – for changes between text boxes, clipart, and other objects. Slide Show, Custom Animation, Add Effect, select when (Entrance, Emphasis, Exit, Motion Paths), select the effect (Blinds, Box, Checkerboard, Diamond, Fly In, etc.) Adding an Organizational Chart Using the Drawing toolbar, click on Insert Diagram or Organizational Chart OR Insert, Pictures, Organizational Chart Add subordinates, coworkers, and assistants by right clicking on the box and selecting from the popup menu. Key text within the boxes by clicking in the box. Saving Pictures or Images from the Internet when Image banks are blocked by Filter Locate any image on a web page Right click on the image “Save Picture As” or “Save Image As” If the Save Bar doesn’t appear in the top right corner, right click on the image, Save Picture As, give it a filename, Save Other picture sources: SchoolTube, United Streaming, Pics4Learning Inserting a Movie on the Slide Ex: UNITED STREAMING VIDEO Note: you must have already saved the video somewhere Insert, Movies and Sounds, Movie from File Note: I have placed my downloaded videos in a folder called STREAMING VIDEO Select when you want the movie to play. Automatically-will play the video when the slide comes up. When Clicked-will play the video when you click on the video box located on the slide. Printing in PowerPoint IMPORTANT: Do not print full page slides unless you need them. Always change “Print What” to handouts, and 3 or 6 per page Slides – full pages Notes – single slide with notes below Handouts – 2,3,4,6, or 9 slides per page Step 1: Click on “Print What” Change to “Handouts” Step 2: Click on “Slides per page” Change to 3 or 6 Step 3:Click “OK” Create a PowerPoint Project Create a basic slide show for an Open House or Parent Teacher Conferences. Include a minimum of 5 slides using a variety of formats. Required Elements: Slide 1 should be the title slide/”Welcome” Use the remaining slides to present information about your class Incorporate a variety of color, fonts, point sizes, and Word Art to make visually appealing Change Slide backgrounds or presentation templates to enhance presentation (try Slideboom!) Insert chart, graph, or organizational chart Create a photo album or add pictures Insert cliparts, movies and/or sounds from online sources (ex: Teachertube, Schooltube, United Streaming image bank, Microsoft Office Clipart Gallery, web images or etc.) Add Transitions and builds or custom animation effects Preview print with 2, 3, 4, 6, or 9 slides to page; notes pages, outline, full Technology Integration Project Social Studies: Africa & Europe 1. Internet Research a. Use an approved search site (Mel databases, etc.) to locate and print information on your assigned country within the continent of Europe or Africa. i. Locate the following information about your country: 1. Land a. Landscape b. Climate c. Natural resources d. Animals 2. Society & Culture a. Racial/ethnic groups b. Languages c. Religion d. Education or social issues e. Traditional dress 3. Economy (the money system) a. Products (agriculture, mining, manufacturing, forestry, fishing) b. Gross domestic product or Gross national product c. Per capita income 4. People (population) a. Growth or decline for the past ten years 5. History/Government a. Leaders b. What type of government do they have (democracy, dictatorship, etc.) c. Major events that have changed their country 9ex: war, famine, etc.) ii. Save 3+ pictures from the Internet to use in your report 2. Word a. Key a 1‐2 page report about your country and print i. Center, underline, boldface and italicize the title ii. Put a header/footer on wit name, date, and hour/teacher iii. Double space the paper iv. Make all margins 1” (top, bottom, left, right) v. Use appropriate font and point size (10 or 12 point font, Arial or Times New Roman) vi. Insert a clip art, Word Art, and at least one picture vii. Include the following side‐headings: 1. Land a. The landscape b. Climate c. Natural resources d. Animals 2. Society & culture a. Racial/ethnic groups b. Languages c. Religion d. Education or social issues e. Traditional dress 3. Economy (the money system) a. Products (agriculture, mining, manufacturing, forestry, fishing) b. Gross domestic product or Gross national product c. Per capita income 4. People (population) a. Growth or decline for the past ten years 5. History/Government a. Leaders b. What type of government do they have (democracy, dictatorship, etc.) c. Major events that have changed their country 9ex: war, famine, etc.) viii. Submit the report for grading based on the standard writing rubric. 3. 4. 5. Excel a. Create a spreadsheet of population information i. Use the maximum, minimum, count, sum and MDAS cell math functions to answer questions like: 1. What is the highest populated area 2. What is the lowest populated area 3. What is the total population 4. Others as demonstrated ii. Create a graph for your country’s population ( ex: bar, pie, X‐Y) and print on a full sheet iii. Print the worksheet with formulas showing! iv. Submit for grading based on the Excel rubric. PowerPoint a. Create a basic slide show about your country b. Change the background c. Add WordArt d. Include pictures and/or Clipart i. Include one map e. Include transitions and builds f. Include the following information i. Land 1. The landscape 2. Climate 3. Natural resources 4. Animals ii. Society & culture 1. Racial/ethnic groups 2. Languages 3. Religion 4. Education or social issues 5. Traditional dress iii. Economy (the money system) 1. Products (agriculture, mining, manufacturing, forestry, fishing) 2. Gross domestic product or Gross national product 3. Per capita income iv. People (population) 1. Growth or decline for the past ten years v. History/Government 1. Leaders 2. What type of government do they have (democracy, dictatorship, etc.) 3. Major events that have changed their country 9ex: war, famine, etc.) g. View the outline, view the slide show h. Get approval to print the slides 3 per page i. Submit for grading using the PowerPoint rubric. Capstone/Culminating activity : prepare a display or presentation for sharing with your class using the information obtained.


© Copyright 2026