
Document 267837
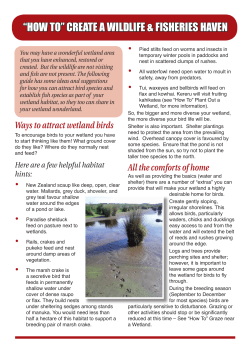
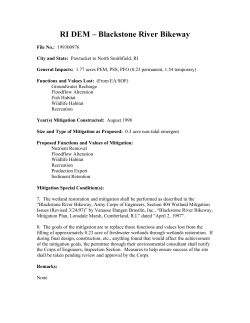
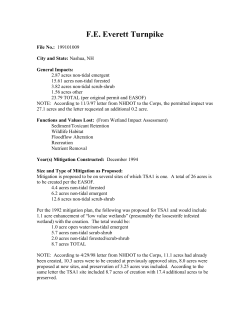
\a
Aqudtir:Ecolog' 36: 395-110.2002.
395
7T @2002KluwerAcudenicPublishers.Printedh theNetlErlands.
Monitoring changein aquatic invertebratebiodiversity: samplesizet
faunal elementsand analvtical methods
S.A. Halsel,D.J. Calel, E.J.JasinskalandR.J.Shiel2
I Deparlment oJ Conservatiotland land Managemen4Scienc-e
Division, PO Bor Sl WannerooWA 6916,Austrclia
(Fax +61 89306 I64I: E-mail: [email protected]);t Departmentof EnvironmentalBiobgy, Unbersity of
Adelqide,Adelaide SA 5005, Australin
Accepted 24 October 2001
microinvertebrates,ordination,salinity, speciesaccumulationcurves
Ke1 word,r.macroinvertebrates,
Abstract
Replicationis usually legardedas an integral pal1 of biological sampling,yet the cost of extensivewithin-wet!and
replication prohibits its use in broad-scalemonitoring of trends in aquatic invertebratebiodiversity.In this paper,
we report resultsof testing an alternativeprotocol, whereby only two samplesare collected from a wetland per
monitodng event and then analysedusing ordination to detect any changesin inveftebratebiodiversity over time.
Sinulated data suggestedordinationofcombined datafrom the two sampleswould detect20% speciestumover and
be a cost effectivemethodof monitoring changesin biodiversity,whereaspower analysesshowedabout 10 samples
were required to detect20% changein speciesrichnessusing ANOVA. Errors will be higher if yearswith extreme
climatic events (e.g. drought), which often have dramatic short-term effects on invedebratecommunities, are
included in analyses.We also suggestthatprotocolsfor monitodng aquaticinvedebratebiodiversity shouldinclude
microinvertebrates.Almost half the speciescollectedfrom the wetlandsin this study were microinvertebratesand
their biodiversity was poorly predictedby macroinvertebratedata.
Introduction
Biodiversity in wetlandsis being reducedby agricul
tural, urban and industrial developmentthrough most
of the world (Barbault & Sastrapradja,1995t Ricciardi & Rasmussen, 1999) and the situation is often
perceived as a crisis (Savage, 1995). In response,
many progmms have been initiated to conservewetland communitiesand processesat a regional or local
scale(e.g. Hails, 1996; Froend et a1., 1997). Such
programs usually include monitoring of biodiversity.
Ideally, any species loss or significant changes in
community stlucture will be detectedand appropriate managementinteF,'entionwill occur to recoverthe
speciesor community.
Developing monitoring protocols that are ljkely
both to be adoptedand to provide adequateinforma
tion about changes in aquatic invertebratebiodiver
sity is difficult (Fairweather,1991; Humphrey et al.,
1995). As managementagenciesale faced with an
evergreateraray ofsituations that requiremonitodng,
protocols that minimize costs will be preferred. This
is achieved most easily by reducing the number of
samplescollected and processed,although low numbers of samplesoften preventimpo ant changesbeing
detected(Fairweather,1991; Streever,I 998).
Most aquatic studiessamplerelatively small areas
or volumesand, therefore,collect only a small proportion of speciespresentat the sampling site (seeRouch
& Danielopol,I997; Tumer & Trexler,1997:Butcher,
1999).There is scopeto increasethe areaof substrate,
or volume of water, sampled and collect a grcater
proportion of the speciespresent.Thus, large-volume
samplesmay be one way of maintaining the ability to
detect changewhile reducing number of samplesand
associatedcosts (Andrew & Mapstone, 1987; Kneib,
r).
199
Another challenge in monitoring aquatic invertebrate biodiversity is selecting the appropriateorganisms to sample. Results will be useful only if the
396
groups chosen are representativeof trends in overall aquatic invertebrate pattems (see Green, 1979,
p. 34). Few studies have examined the relationship
betweenoverall aquatic invefiebratebiodiversity and
its componentsbut, working on trees,Azarbayjani &
Richardson(1999) showed little correlation between
richness within most arthropod orders and overall
aboreal arthropod diversity. Results from large-scale
wetland suryeys also suggestpredictions of overall
speciesrichness based on the chness of particular
orders will frequendy be unreliable becausevarious
orders exhibit different patternsof occurrence(Halse
et al., 2000b: seealso Usseglio-Polateraet al., 2000).
Many monitoring studieshave used speciesrichnessas a measureofbiodiversity and analysedthe data
with ANOVA. Two drawbacksare that comparatively
large numbersof samplesare requiredto detecttrends
and that the method works best when speciesloss,
ratherthan tumover,is occurring.The earliestchanges
in biodiversity, however,are usually the replacement
of sensitivespeciesby more tolerant ones without a
reduction in overall speciesrichness (Growns et al.,
1992).Multivariate dissimilarity measures,which take
accountof tumover, are better indicators of biodiversity and may be analysedusing ANOVA (Faith et a1.,
1995; Edward et a1.,2001) or ordination (Gray et a1.,
1990;Streever,1998).
This paper repofis a protocol for monitoring
aquaticinvertebratebiodiversity in wetlands,basedon
large sweepsamples,minimal within-wedand replication, identification of micro- and macroinvertebrates,
and ordination analysis. It is an extension of the ordination method proposedfor wetland monitoring by
Froend et al. (199'7) and its intended use is examination of long-term temporal changesat individual
wetlands. We tested the protocol at five ecologically
different wetlands, representingsulTogatesfor some
of the changesthat might occur at a single wetland
over many yea$ as a result of anthropogenicchanges
in its catchment,to examinewhether the protocol was
likely to detect changes in the aquatic invertebmte
community. It is not our intention to challenge the
needfor replicated,contolled studieswhen the causal
effects of particular environmentalimpacts are being
examined.
Materials and methods
Five relatively shallow, basin wetlands in the wheatgrowing zone of south westem Australia (Figure 1)
Towdiming
e
Bn-de
Mearfield
Figure L Locati,ot of the five wetlands in south-west Western
Australia. The 300 mm and 600 lnm rainfall isohyets corr€spond
approximately to boundaries of the area with most secondary
salinisation.
8 6 0
z
3
4
5
Cotrducaivity
0og10)
F,g&r"2. Nunberof invertebrate
species
in eachwetlandcompared
wilh log{ransformed
conductivily
values
asa measure
of salinity
(rz:0.831,p<0.0s).
were sampled in spdng (October) 1997. The region
has a Mediterraneanclimate with winter rainfall and
hot, dry summers. Annual average rainfall varies
from 600 mm at Lakes Towerinning and Wheatfleld
to 400 mm at Lake Bryde (Figure 1), with 80-907o
of rain falling betweenMay and September.Average
maximum temperaturesin Januaryand Februaryrange
from 32 'C at Lake Logue to 26 "C at Lake Wheatfield
(Bureauof Statistics,1995).
Prior to agdcultural clearing, vegetationconsisted
mostly of open woodland dominatedby eucalyptsor
heathland dominated by Proteaceaeand Myrtaceae.
Wetlandswere usually fringed by the trees Casuarina
39'1
Bryde
Wheatfield
Coyrecup
Towerinning
Logre
Fry&,"cJ. Mear numbef (+ SE) of invetebfate speciescollected irom cach wetlaDdby single samples,two (adjacent)samplesfrom the same
sector,two (paired) samplesfrom diflerent sectors.Number collecled by four samplesis also shown (seelexl fbr details ofsample collecting).
obesa and Melaleuca spp., with occasionaleucalypts
(Halseet a1.,1993a).Sedgesoccurredaroundthe water's edge of most wetlandsand acrossthe lakebedof
shallow seasonalwaterbodies.Casuarina obesa a\d
Melaleuca spp.sometimesoccured acrossIarge parts
of the lakebed of wetlandsthat intermittently flooded
to greaterdepths(ca. 2 m).
Land clearing, and the replacementof deep-rooted
perennial vegetationwith annual crops, has reduced
transpirationrates and resulted in fising saline water
tablesin n.ruchof the agriculturalzone, especiallybe
tween the 600 and 300 mm isohyets (George et al.,
1995). The processis often referred to as secondary
salinisation and has profoundly affected the ecology
of many ecosystemsin south-westemAustralia (see
Williams, 1999),including causingthe deathof much
wetland vegetationand its replacementby salt-tolerant
samphirc.Remnantsofdead treesaroundwetlandsare
now a commonsight(Halseet al., 1993a).
Attributes such as size, depth, type and extent of
riparian vegetation, and frequency of flooding var
ied among the five wetlands but probably the most
ecologically important differencesrelated to salinity
status and associatedchangesin riparian vegetation
(Table l). As wellas simplifying vegetationcomnuni
ties, secondarysalinity reducesthe diversity of aquatic
invertebrates(Timms, 1981)and alterswaterbirdcommunities(Halseet al., 1993b).
In terms of relationships between the wetlands,
Lakes Bryde, Towerinning and Coyrecup can be
viewed as being positionedalong a temporal gradient
of secondarysalinisation with Lake Bryde still relatively fresh, Lake Towednning mildly salinised and
Coyrecup showing effects of long-term (40 f years)
salinisation.Lakes Logue and Wheatfield have similar
salinity to Towerinning but more complex submerged
and ripadan vegetation,respectively,and are displaced
from the gmdient. Their salinity levels mostly reflect
naturalprocesse.:an historicalmarineconnectionat
Wheatlield and evapo-concentration
at Logue.
Sampling in each wetland was stratified,with two
widely separatedarcasbeing sampled(called sectors)
and two random samplesbeing collected within each
sector. The aim was to obtain measurcsof withinsectorand between-sectorvariation.Each samplecon'benthic'
sistedof
and 'planktonic' sub-samples.The
benthic sub-samplewas collected by 50 m of vigorous, discontinuoussweepingover a distancaof about
200 m with a 250 pm mesh pond net on a D-shaped
frame (350 mm wide and 250 mm high). All identiflable wetland habitats 51 m deep between the shore
and centueof the wetland were sampled, including
water column, submergedvegetation, bottom sediments, along submergedlogs and around tree trunks.
Contentsof the pond net were emptied into a bucket
severaltimes dudlg sampling to reduceresistanceof
the net in the water. After elutriation and removal of
large debris, the sub-samplewas preserved in 707o
ethanol. The planktonic sub-samplewas collected by
50 m of more gentle sweeping with a 50 g.m mesh
398
l) in October 1997. long term saliniry pauern.
Zrble /. Flooding ffequenc),,waier deprb (m) and co.dnctivily (tS crn
domirlnr vegclationand \\,etlandsize (hr) at the five well.rndssampled
Flooding
October
October
Srlinity
Vegetation
salinitv
Finging lrces (,44?l.r/cr./.?r
1,100
Brydc
spp/eucalypts)
Towefinning
PermaneDl
3.2
Vegetationmostly cleared.a few
r80
dcad ol livc lrccs
ca. 2
Whe.rtiiekl
Permancnl
Loguc
Scasonal
Coyrccup
S c m i p e r m a n e n t 0.9
Brackish
6700
Densefringing M?ldlPr.rr
Frcsh-brackish
7300
F tirEine Cdsudina obesd,
150
caDegmsson lakebed
pond oet on the same-sized
tiame in the sarnchabitats, other than benthos, and was prescrvedin I 2ol'
fomaldehyde.
In the laboratory, benthic samples were sieved
through a stackof 2 mm, 500 7rm,250 pm and 90 pm
meshsievesandthe pofiionretainedin eachsicvewas
sofiedundera dissectingmicroscope.
Planktonicsamples were sievedthrough250 prm,90 pm and 53 irm
mesh sieves.All animalswere sortedand identified to
the lowestlevelpossible.This was usuallyspeciesor
morphospecies
and, lbr convenicnce,
we usethe term
specieswhen rcferring to the numberof taxa identiiied
in a wetland.We also usethe terms microinvertebrates
and macroinvertebrates
to brcak iDvertebrates
into two
groupsbasedlooselyon size.Wc dcfinenicroinvertebratesas speciesbelonging to the Protista,Rotifera,
Cladocera,Ostracodaand Copepodaand we refer to
all other invertebratesas macroinvertebfates,
although
nany of them are quite small (e.g. sone speciesof
Nematoda,AcarinaandChilonomidae).
Analysis
Numbers ol invcrtebratespeciescollectcd in samples flom difTerentwetlandswere comparedby 1-way
ANOVA using PROC ANOVA in the SAS analysis
package(SAS lnstitute1990),aftcrchcckingthatdata
werc normally distributedand homoscedastic.
Number of samplesrequiredto be 907osureof detecting
20Voor 30Vodeclinein speciesrichnessin a wetland
was estimatedby the method of Snedecor& Cochran
( 1 9 8 0 p, p . 1 0 2 1 0 6 ) u
, s i n gc v: 0 . 0 5a n dF - 0 . 1 0 .
The averagepropol'tionol'species recovcredby
singlcsamples,two samplesfrom the samesecto.of
a wetland and two san]plesfron different sectol'swas
Fringnrg dead trees (salt-affected)
comparedwith the tolal number of speciesprescnt in
the wetland,asestimatedby the formula of Karakassis
(r995)
S t, 1 - a
l5r
rnJ 5q -.//l
b.
where S"" is the theoreticallimit of the asymptote
o l t h e s p e ri e . J ( c u m u l i r l i , ' ,n.u r r e . i . i r t h e m e a n
numberof speciesin all possiblecombinationsof k
' i r m p l e su. n dp . r n db d e h n et h er e p r e . r i o lni n eo l j , r
on 51.
The formulaof Kay et al. (1999),in slightlymodified form, was usedto derivespeciesaccumulation
curves
ai -
ai
| \,44/17-3))
where zr; is the mean number of additional taxa col
lected in the lth replicate,and 4l and 44 are the mean
numberof additionaltaxa collectedin the third and
fourth replicates,rcspectively.For samplesof all in
vertebratesliom Coyrecup. d2 and1,4 were used to
provide an estimateof the rate of changeot'the species
accumulationculve because,owing to chanccd3 :
a4,which prevented
4i reltchingan asymptote(generai
caseis thata; > a;11).
Similarity of invertebratesamplesfrom within and
betweenwetlandswas examinedby ordination.This
was done to test whether changeslikely to occur
within one wetland over time, as a result of human
activity, could be detectedreliably by single samples.
ln a formal monitoring program,the ordination would
'marker' wetcontain invertebratedata fiom several
lands,typical of the rangeof wetlandsin the region,
and a tempoml se es ofsamples from the wetland be
ing monitored.The markcr wctlands,sampledprior
399
to the commencementof monitoring, provide a stan
dardisedframeworkforintelpreting the magnitudeand
direction of changesin invertebratebiodiversity at the
monitored wetland.
Ordination was based on semi-strong-hybrid
multi dimensionalscaling in the PATN analysispackage (Belbin, 1993)with presence/absence
invertebrate
data and the Czekanowskidissimiladty measure.Dissimilarity values >0.95 were re-calculatedusjng the
shortestpath option (Belbin, 1993).F-ratios,calculatedby ANOSIM (Clark & Green,1988),were used
as a measureof within-wetland vadation relative to
separationbetween wetlands. lnfomation about the
overall invertebratecommunity of each wetland available from micro- or macroinvertebratesalone was
examinedby comparing ordinationsbased on microor macroinvertebmteswith thosebasedon all invertebmtes.
Ability of two samples from diff'erent sectorsto
charactedsethe overall invertebratecommunity of a
wetland was examined using four 'paired' samples,
which wele derived by combining all possible pairs
of samplesfrom the two different wetland sectors.In
addition, all four samplesfrom a wetland were combined to provide a 'composite' species list for the
wetland. Paired and composite samples were used,
together with simulated samples,in two ordinations.
The first examined effect of speciestumover on position of samplesin ordinationspaceand included
20 modified samples, derived by replacing approxi
mately f 0%, 20Eo, 30Eoand 40dloof the speciesin
compositesamplesof eachwetland with speciesfrom
the other four wetlands. Replacementswere random,
within the constmint that only biologically realistic
changeswere allowed. Ubiquitous speciesknown to
have wide ecological toleranceswere rarely replaced
and speciesthat occuffed in only one or two samples
from a wetland were more likely than those in four
all samples(although some four-samplespecieswere
replaced,especially in the 307oand 4070 steps). Replacementsmadeat the l07o stepwere carriedinto the
204/ostep, unless they were randomly selectedto be
rcplaced,etc.
The secondordination examinedeffect of species
Ioss on position of samplesin ordination space and
included 15 modified samples, derived by removing
10Ea,20Eoand 307c of speciesfrom composite samples, using the samemethodologyasfor replacements.
(")roo
--r- Bryde
80
960
9ao
I
20
(b) 70
-'r- Bryde
60
.E
t0
220
t0
0
l
3
5
7
9
l
l
l
l
1
5
No. of sMples
G)
60
50
d20
z
IO
0
1 3
5
7
9 1 1
1 31 5
No.olsanples
Frgrre 4. Species accumulation al cach welland with increasing
number of samples. (a) all aquatic inveflebrates.(b) macfoinveF
tebrates,(c) microinvef ebrates.
Results
At least 150 aquatic invertebrate species were collected from the live wetlands,with Lake Bryde yielding most species(87) and Coyrecup fewest (20) (Table 2, Appendix). The proportionof microinverte
bratesvariedfron 487oinBryde to 31Voin Wheatfield.
At order level, differencesin proportion of Cladocera
among wetlandswere especiallypronounced(237aof
speciesir Bryde, < 27oin Wheatfield).
Mean numbersofspeciescollectedper invertebmte
sample differed significantly between wetlands (Ta
ble 3), and therewas a significantnegativerelationship
betweenspeciesrichnessand salinity(Figure2), confirming that speciesrichnesswill changeif the salinity
of a wetland changessubstantiallyover time (seealso
400
Table 2. Nnmber of inveftebrate species of various taxonomic gmups in the live
wetlands
Bryde
0
t
t
l
6
0
3
0
2
0
11
5
l
0
2
'
7
Hydrozoa
Turbellaria
Nematoda
Tardigrada
Rotiiem
Mollusca
Oligochaeta
Cladocela
Ostracoda
Copepoda
Amphipoda
Isopoda
Other Crustacea
Coleoptem
Ceratopogonidae
Chironomidae
Other Diptera
Hemiptera
Odonata
Trichoptera
Microinve(ebrates
Macroinvertebrates
Total no. of species
2
1
4
3
3
2
42
45
87
Towerinning
0
t
t
0
0
0
3
1
3
8
6
1
0
0
5
Wheatfleld
CoFecup
I
0
0
I
I
I
I
I
I
0
4
0
0
0
0
I
0
2
6
3
I
l
2
3
I
7
2
I
0
0
3
3
4
3
4
I
0
lt
22
33
I
I
8
4
5
6
4
3
1
3
t'7
33
50
Logue
I
9
4
3
3
4
20
I
I
I
4
3
I
t
0
2
I
2
0
0
0
9
11
20
Table 3. Mean + SE numbem of micro-, macrc- and all invertebrate species collected in four samples and esfimated number of samples (N*) needed to delect a 2070
decline in species dchness with 90% confidence. Numbers of micro-, maclo- and all
invertebratesdiffercd significantly betweenwetlands(F: ? 1.1,F:38.3, F:51.1,
respectively, p < 0.0001). Means with differcnt letters were significantly diferent
(r < 0.05)
Wetland
Bryde
Towerinning
Wheatfield
Logue
Coyrecup
Microinvertebrates
Macroinvertebrates
Allspecies
Mean
V.rn
V.an
ll'
56.2+1.1
A
3t.2t3.4C
42.2+2.9
B
23.0+2.0
D
15.5+0.6
E
2
21
9
15
4
N'
26.8+0.5
A
2
12.2+1.4
B 23
14.0+1.3
B 16
8.2+0.6
C 11
7.2*0.2
C
3
lv+
29.5+0.9
A
3
1 9 . 0 + 2 . 1 B2 3
28.2+1.7
A
7
14.8t1.5
B t9
8.2+0.6
C 11
401
lirblr f. Estinated number of samples (N.) before an ad
ditional sanple collected < I extfa species. the estimated
numbers of speciespresent in each wetland using formulae
o f K a y e t a l . ( 1 9 9 9 )a n d K a r a k a s s i (s1 9 9 5 ) ,a n d t h e n u m b e r
o[ speciescol]ecledin lbur samples
N+ Speciesestimated
K")*r
Bryde
Towcinning
Whealiield
Logue
Coyrecup
8
9
l0
6
5
9 9
6 3
78
3 8
2 3
"!{-"k"r*'
91
58
75
36
23
Speciescollected
in four samples
87
50
20
Timms I98l , 1998). Using ANOVA, the estimated
number of samplesneededto be 907i, sure of detecthg a 20c/adecreasein speciesrichness at individual
wetlandsvaried from 2 at Bryde to 21 at Towerinning
(Table 3). Variation in these estimates reflects stochasticelror in estimatesof variancebecauseof small
samplesizesin our studyand about10 sampleswould
probablyproducethe statisticalpower requiredat most
wetlands. Estimated number of samples needed to
detecta 30% reduction varied from 2 10.
Diflerences betweeDwetlands were less clear cut
when micro or macroinvertebratesalone were examined; for example Wheatfield was similar to Bryde
in terms of macroinvertebraterichness but more like
Towerinning in number of microinvertebrates(Table 3). There was a tendencyfor fewer samplesto be
neededto detect a 20olodecline in microinvertebrate
than macroinvertebraterichness,althoughthe opposite
applied at Wheatfield (Table3).
Estimatesol speciesrichnessin each wetland suggesteda single sampleusually collects about 60% of
speciespresent at the time of sampling (range 4381c/o),two samplesfrom different sectors15Vo, and
four samples897o(Table4, Figule 3). Between-sector
variation in speciescomposition was usually greater
than within-sector variation so that, except at Coyrecup where there was no difference, about 77, more
taxa werr collected by two samples from different
sectors than by two fiom the same sector Depending on wetland, 6-10 sampleswere requircdto collect
all speciespresent(Figure 4a). Rate of accumulation
of microinveftebrateswas greater than nacroinveflebmtes and fewer samples were neededto collect all
micronve(ebratespecies(Figures4b and 4c).
All samplescontainedsufficientinformation about
the inyertebratecommunity of their source wetland
to separatethem in oldination space frorn samples
collectedin the other wetlands(Figures5a and 5b).
Furthemore, all samplesfrom a wetland were close
in ordination spaceto the composite sample for that
wetland and, thus, probably containedmost of the information signal of the full invertebratecommunity.
While theseresults are, at least partly, a consequence
of the ordination containing wetlands with very different comnLrnity composition(the spreadof samples
from the samewetland would be greaterand betweenwetland separationless clear if all wetlandshad similar communities), it strongly implies that ordinating
a temporal series of single samples from a wetland
within a framework ofmarker wetlandswill detectany
substantialecologicalchangesthat have occulTed.
Relative positions of samplesfrom different wetIands changedsomewhatin ordinationsbasedon microiDvertebrates
or macroinvertebrates
alone, with the
microinvefiebmtepattem being more similar to that of
l h ew h o l ei n r e r l e b r i i l e c o m m u nl iht a
l nl o m t c r o i n ! e r tebrates(Figures 5c e). Samplesfrom the same wetland were usually closest to each other in ordination
space,relatiyeto the distancebetweenwetlands,in the
microinvertebrateordination, which was reflected by
the highest F-ratjo from ANOSIM analysis(al1invertebrates,F : 3.301,macroinvertebrates,
F:2.393,
microinvertebmtes,
F : 4.109, compositesamples
excluded).
Pairedsamplesfiom different secto$ of a wetland
were closer in ordination space to both each other
and compositesamplesthan were single samples(Figures 5a, 5b and 6). Paired samplesalso showedbetter
discdminationbetweenwetlands(F : 5.586vs 3.301,
compositesamplesexcluded).Thus, a pair of samples
from different sectorsprovided more preciseinformation about the invertebratefauna of a wetland than a
single sampleand enablefiner-scaledifferentiation of
ecologicalcharacter.
Ordination of modilled sample data, representing
different levels of speciesturnover and loss at the five
wetlands.showedspeciestumovercausedlargel shifts
in ordination spacethan speciesloss (Figure 7). Shifis
in sample position causedby turnover of - 207o in
community composition were about twice the variation exhibited by paired samplesat all live wetlands
(Figures 7a and 7b) and suggestedthat changes of
7 20Votn community con.rpositionwould be reliably
detectedby ordination of a temporal seriesof paired
samplesfrom a wetland(p < 0.2).
402
(b)
(a) All tara
1.5
s*
oo
o
trtr
o t
A^
o o
oa
c
tla
I
o
ao
.F
o
.3#
ls..
o o
to
0
Ais 1
0
Aris I
(d)
(c) Mrcroinvertebrates
1.5
EF
trtr
1.5
A
A
o
6 0
^
.
o
otr
F
o
o
o
o
o
o
;
-1.5
o
o
o
o
.
0
Attu I
(e, Microinv€debrates
1.5
t ' a
t oa
0
Arb I
(D
1.5
4A
a
a
aa
.o
odAo
t a
a
og
o-
-
Etrs
Etr-
o o $
-1.5
ri"r
o
1.5
-l.5
0
Aris I
1.5
Fr€rrs t Three-dimensionalordination of samplesfrom five wetlands. 0 Bryde, O Towerinning. a Wheatfield, tr Logue, A Coyrecup- (a,
b) All invetebrate data, with composite samples(closedsymbol or arrowed). stress: 0.11; (c, d) macroinvertebratedata, stress: 0. i3; (e. 1)
microinvertebratedata. stress: 0.06.
403
(a, Paired samples
(b)
1.5
l.s
aru
t
-1.5
s
s
0
Arir I
s , " & i
a
p
1.5
0
Atis I
1 f
Fr,qr,"e6. Three dimensional odinalion of paired and composite (closed symbol or anowed) samples ftom each wetland. 0 Bryde,
Towerinning, O Wheatlield, I Logue, A Coyrecup,stress: 0.09.
Discussion
Fofiy-five percent of species collected dudng this
study were microinvertebrates,which is similar to
proportions recorded in other studies and reinforces
that microinvertebratesform a major component of
wetland biodiversity (Dole-Olivier et al., 20001Halse
et al., 2000b).The pattemsof micro- and macroinvertebratebiodiversity in the five wetlands differed (Table 3, Figure 5) and it was clear that monitodng based
on one group alone would have been misleading in
termsof overall invertebmtebiodiversity.Despitethis,
most studies of wetland ecology and aquatic inyertebrate biodiversity sample only macroinvertebrates
(Resh& McElravy, 1993).
The estimateof 6 10 samplesto collect all species
in the live wetlands (Table 4) was similar to the 4 6
samplesneededat Toolibin and Walbyring Lakes in
south-westemAustralia using similar sampling methods (Halse et al.; 2000a). Four factors contributedto
speciesaccumulating faster in these studies than in
most others reported in the literature (e.g. Rouch &
Danielopol, 1997; Butcher, 1999): (l) sweep sampling, which collects species more efnciendy than
most techniques(Cheal et al., 1993; Tumer & Texler,
1997),(2) large effort per sample,(3) employing both
small and intemediate mesh sizes to increaselikelihood of collecting micro- and macroinvertebrates,
respectively,and (4) sampling a range of microhabitats.Sweepsamplesof micro- andmacroinvertebrates,
collected over large areasand inporporatingas many
microhabitatsas possible,yield more information on
community composition than small samples at little
extra cost. Our experiencehas shown that processing
costsare more relatedto number and type of samples
than volume of those samples.
Despite recovedng speciesmore efficiently than
most samplingprotocols (Rouch & Danielopol, 1997;
Butcher, 1999), our single sweep samplescollected
only about 60% of inveftebmte speciespresent in a
wetland. Even when severalsampleswere taken,some
patchily distdbuted or low-abundancespecies were
missed. Yet, when documentingchangesin biodiver
sity is the objective, these rare species may be of
most intercst.We have no solution to this conundrum
otherthan increasingsamplesize.We suggestthat taking paired samples,which on averagecollect 7570 of
speciespresent,representsa reasonabletmde-off between cost and completenessof the species list but
speciesaccumulationcurvescan be used to detemine
the number of samplesrequiredfor a higher recovery
rate (Moreno & Halffter, 2000).
This study confirmed that large numbers of samples are usually required to demonstratechangesin
speciesdchnessat a wetland, unlessexpectedchanges
are large (about 10 samplesper wetland sampling occasion were neededto detect20Eodecline in species
richnessand five to detect 30% decline). Examining
change in speciescomposition using ordination is a
more efficient way of detectingchangesin biodiversity (Gray et al., 1990; Warwick, 1993), particularly
becausethe first changesin invertebratebiodivenity at
wetlands subject to environmentalchangeusually in-
104
(a) Speciestumover
1 5
(b)
1.5
*
&f.ts
Y-
f e t
/t
*E$
\r
a
\
q=.J
I""t
0
Aris I
0
Ans I
(dl
(c) Speciesloss
15
1.5
a^
dg
#
4
f
$a
a
tr
*f
- 15
0
Aiis I
$ r a
-t 5
0
Ads 1
tlgrf" Z Three-dimensionalordination ofpaired samplcsliom cach wctland. 0 Bryde, (,iTowerinning, a Wheatfield. !Logue, A Coyfecup.
(a. b) cffcct of 10 407. specieslumover oD position of composite sample (composite and sil11ulared
sanples shown by closed symbots and
connectedby lilre), stress= 0 I l , (c. d ) etrect of 10 30./. speciesloss on position of conposite saDple, stress= 0. 10.
volve speciesreplacementratherthanreducedrichness
(Grownset al., 1992).
Streever(1998)showedsignificantpatternamong
the invertebratecommunitiesol'difltrent sitesby ordinatingcombineddatafrom two smallcoresamplesper
site, althoughpattems becamemore stableas number
of samplesincrcased.Halse et al. (2000a)showedthat
single large samplescould distinguishbetweendifferent types of wetland. This study conlirmed earlier
results: ordination of data from large paired samples
producedstablepatternsand characteisedthe wetland
communityfrom which they were taken(Figure6).
Ordination of modilied sample data, simulating
t l p e ' o l ' i h r n g e l i k e l ) t o o c c u ro v e r l i m c a r a r e sult of anthropogenicchange, suggested> 207.
speciesturnovercould be detectedreliabiy (Figures7a
and 7b). The relativeinsensitivityof ordinationsto
changesin speciesrichnessitself, which is characteristic of multivariate techniques(Clarke et al., 1996),
i r b e n e f i c i ailn a l o n g t e r m m o n i r o r i n gf r o g r a m i n
that small variations in sampling effofi over time (or
amongoperators)have minimal effectson results.
We have not tested the discdminatory power of
paired-samplernonitoring in a lbrmal way because
visual assessmentof effect size can be an ellective
method of evalLration(see Anderson et al.. 2000).
More figorous testing could be achieved by visual
assessmentof simulated data from a larger number
of wetlands or by ANOVA of dissimilarity measures
(seeEdwardet al., 2001).However,the magnitudeof
405
changesthat are biologically significant is yet to be
determinedand this should precedethe development
of formal statisticaltests.
The proposedmonitoring protocol is not intended
to detectdisturbance-induced
changesthat are smaller
than the natural fluctuations between most years.
These can only be detected using complex designs
and, even then, are dilficult to demonstrate (Underwood, 1993). However, in stuongly seasonaland
semi-aridclimates,suchas occur in much ofAustralia
(Gentilli, 1972), drought and flood eventsmay cause
much largerchargesin community composition,at interyals of a decadeor so, than are likely to be caused
by anthropogenicfactors (Halse et al., 1998; Timms,
1998).Unusualnaturaleventscomplicatethe monitor
ing of trends in wetland biodiversity and we suggest
that the most appropdateaction is to exclude extreme
years(asdefinedby water levelsor other crite a) from
analysis,althoughin somesituationschangein the fre
quencyof extleme events,and the occurrenceof their
associatedinvertebratecommunities, will be important. Exclusion of years with extreme eventsreduces
both the likelihood of Type I error (false evidenceof
anthropogenicchange) and the cost of achieving an
acceptablelevel of Type II error.
Acknowledgements
We thark WR. Kay and J.M. McRae for help in
the field. A.W. Storey, PG. Fairweather and M.R
Williams provided very useful commentson a draft of
the manuscipt.
Ref€rences
Anderson
DR,Link WA.Johnson
DH andBurnhanKP (2001)
Suggeslionsfor presentingthe results of data analyses.J Wildl
MaMge 65: 373-378
Andrew NL and Mapstone BD (1987) Sampling and the description
ofspalial patternin marineecology.OceanogrMarBiol Ann Rev
25:39-90
Azarbayjani FF and RichardsonBJ (1999) Moniloring lbr changes
in aborcalarlhropod biodivenity in woodlands:how many replicatesare needed?In: PonderW and Lunncy D (eds.),The Olher
99'l.: The Conservationand Biodivcrsity ofll1verGbrates.Transactions of the Zoological Society of New South Wales, Sydney,
pp. 40-45
Barbault R and S,rsrapradja SD (1995) Generalion. maintenance
and loss of biodiversity. In: Hcywood VV and Watson RT (eds)
Clobal Biodiversity Assessnent. Cambridge University Press.
C a m b f i d g ep. p . 1 9 3 2 7 4
Bureau of Statistics (1995) Wcslern Australian Yearbook. Australian Bureau of Statistics,Perh
Belbin L (1993) PATN: PatternAnalysis Packagc.CSIRO, CaDberra
Butcher RJ (1999) Assessingbiodiversity in lemporarlrand permanent wetlands. In: Ponder W and Lunney D (eds.), The Orher
997.: The ConseNationand Biodiversity of Invertebrates.Trans
actions of the Zoological Society of New South Walcs, Sydney.
pp.50 53
Chcal F. Davis JA, Growns JE, Bradley J.S. and Whittles FH
(1993) The influence of sampling method on the classification
of wetland macrcirvelebrate communities.Hydrobiologia 257:
41 56
Clark KR and Green RH (1988) Statisticaldesign and analysjsfor a
'biological
effects' study.Mar Ecol Prog Ser 46: 213-226
Clarke RT. Furse MT' Wrighl JF and Moss D (1996) Derivation
ol a biological quality index for river sites: comparison of thc
obsen ed with the expectedfauna.J Appl Stat 23: 311-332
Dole Olivier M J, Gaiassi DMB Marmonier P and Creuz6 des
Chatelliers, M (2000) The biology and ecology of iolic nicro
crustaceans-FreshwatBiol 14: 63 91
Edward DH. Storey AW and Smilh MJB (2001) Assessing river
heallh in south-westernAust alia: comparisonof macrcinve(e
braGs at family level with Chironomidae at specicsle\rel. Verh
Int Ver Limnol 27: 2326 2335
FairweatherPG (1991) Statistical power and design requirements
lbr environmentalmonitoring. AustJ MarFreshwat Res42: 55556'.1
Faith DP. DostinePL and Humphrey CL (1995) Detection ofmining
impacts on aquatic macroinveftebratecommunitiest rcsults o[ a
disturbanceexperiment and the design ol a nultivariate BACIP
monitoring programme at Cororation Hill, Nofthern Teffitory.
AustJ Ecol20: 167-180
Froend RH, Halse SA and Storey AW (1997) Planning 1bf the rccovefy of Lake Toolibin. Westem Australia. Wetl Ecol Manage
5:73-85
Gentilli J ( 1972)Auslnlian Climate Patterns.Nelson, Melbourne
GeorgeRJ. McFarlane DJ and SpeedRJ (1995) The consequeDces
c n \ : r c n m e n rl o r n r r i \ e ! e g e r r o n n
o t i c h . r g r l g ' r y d r o l o A re
southwesternAuslralia. In: SaundersDA. Craig JL and Mattiskc
EM (eds) Nature Conservation4: The Role olNctworks. Surey
Beatty. Sydney.pp.9 22
Cray JS, Clarke KR, WaNick RM and Hobbs G (1990) Detection
ofinitial effecls oipollution on nal.ine benthos:an examplefrom
the Ekofisk and Eld{isk oilfields, North Sea. Mar Ecol Prog Ser
66: 285-299
Creen RH (1979) SampliDg Design and Statistical Methods for
EnvironmentalBiologists-Wiley. New York
Growns JE. Davis JA, Cheal F. Schmidl LC, Rosich RS and Bradley
JS (1992) Multivaiale patten aralysis of wetland invenebrate
communilies and environmentalvariables in Western Australia.
Ausr J Ecol 17: 275-288
Hails AJ (ed.) (1996) Wedands. Biodiversity and lhc Ramsar
Convenlion.RamsarConvenlionBufeau. Gland
Halse SA, PearsonGB and Patrick S (1993a) Vegetationof depth
gaugedwetlands in nature rcseNes of soulh-westWestem Australia. Tech Rep 30. Depatment of Conservation and Land
Management.Pellh
Halse SA. PearsonCB, McRae JM and Sliel RJ (2000a)Monitoring
aquatic invertebratcsand waterbirds al Toolibin and Walbyring
Lakes ir the WeslernAustralian wheatbelt.J Roy Soc West Aust
83:23-34
Halse SA. Shiel RJ. Storey AW. Edward DHD, Lansbury I, Cale DJ
and Harvey MS (2000b) Aquatic invertebratesand waterbirdsof
wetlands and rivers of thc southem Camarvon Basin. Weslern
A u s E a l i aR
. c c W e s tA u s t M u s S u p p l 6 l : 2 1 7 - 2 6 5
406
Halse SA, Shiel RJ and Williams WD (1998) Aquatic invertebrates
of Lake Gregory north westem Aushalia, in relation to salinity
and ionic compositioD.Hydrobiologia 381: 15 29
Halse SA. Williams MR, Jaensch RP and Lane JAK (1993b)
Wetland characteristicsand waterbird use of wetlands in southwesternAustralia. Wildl Res 20: 103-126
Humphrey CL, Faith DP and Dostine PL (1995) Baseline requirements for assessmentof mining impact using biological
monitoring. Aust J Ecol 20: 150-166
KarakassisI (1995) 58: a new method for calculating macrobenthic
speciesdchness.Mar Ecol Prog Ser 120: 299-303
Kay WR, Srnith MJ. Pinder AM. McRae JM, Davis JA and Halse
SA (1999) Pattemsof distribution of macroinverrebrare
families
in rivers of north-westernAustralia. FreshwatBiol4l: 299-316
Kneib RT (1991) Flume weir for quantitativecollection of nekron
from vegetaiedinlerlidal habitats.Mar Ecol Prog Ser 75: 29 38
Moreno CE and Halffter G (2000) Assessingthe completenessof
ba! biodivenity inventoriesusing speciesaccumulationcurves.J
A p p i E c o t3 7 : 1 4 9 1 5 8
Ricciardi A and RasmussenJB (1999) Extinction rares of North
American lieshwater fauna. Cons Biol 13. 1220-1222
Resh VH and McElravy EP (1993) Contenporary quanrirariveap
proachesto biomoniloring using benthic macroinvetebntes. In:
RosenbergDM and Resh VH (eds) Freshwaler Biomonitoring
and Benthic Macroinvertcbrates.Chapmanand Hall, New York.
pp. 159-194
Rouch. R and Danielopol DL ( 1997)Speciesdchnessof microcrustacea in subteflaneanfreshwater habilats, comparativeana]ysis
and approximateevaluation.Int Rev ces Hydrobiol 82: 121-1,15
SAS Instirure (1990) SAS/STAT User's Guide. SAS hstitute Inc,
Cary, NC
Savage JM (1995) Systematics and the biodjversity crisis. Biosciencezl5: 673 679
SnedecorGw and Cochran WG (1980) Statislicat Merhods. lowa
StateUniversity Press,Ames, lowa
Streever WJ (1998) Preliminary example of a sampling design
assessmentmethod for biomonitoring studiesthat rely on ordioation. Ini Mccomb AJ and Davis JA (eds)Werlandsfor rhe Fu
tur€: Contributions from INTECOLS 6th Inrernational Wetland
Conference.GleneaglesPublishing.Adelaide, pp. 53? 552
Tinms BV (198i) Animal communities in three Victorian lakes of
differing salinity. Hydrobiologia 8l: 18l 193
Timms BV (1998) Further sludieson the saline lakes of the easren
Paroo. inland New South Wales. Australia. Hydrobiologia 381:
3142
Tumer AM and Trexler JC (1997) Sampling aquatic inverrebrates
from marshesievaluaringthe options. J N Am Benthol Soc 16l
694JO9
Underwood AJ ( 1993) The mechanicsof sparially rcplicared sampling programmesto detectenvironmentalimpads in a variable
w o d . A u s tJ E c o l l 8 r 9 q 1 1 6
Usseglio-PolateraB Boumard M, Richoux P and Tachel H (2000)
Biological and ecological traits of benthic freshwarer macroin
ve{ebrates: relationshipsand delinition of groups with similar
traits.FreshwatBiol 43: 175-205Warwick RM (1993) Environmenral impact studies on marine
communitiesrpmgmatical considerations-Aust J Ecol l8: 63-80
Williams WD (1999) Salinisalion: major threat to waler resources
in the arid and semi arid regionsofthe world. Lakes Reservoirs:
ResManage 4: 85-91
40'7
Appendix, Species recorded in the wedands.I
Towednning,3 wheatfield, 4 Logue,5 Coyrccup.
Bryde, 2
Wetland
1
3
FII'DROZOA
Cordylophorusp.
TURBELLARIA
NEMATODA
TARDIGRADA
ROTIFERA
Macrotrachelasp.A.
H erarthra fennica (Le\ andet)
Hexarlhra tuiru (H\dson)
Testudinellapatina (Her'x.mn\
Brachio us qltadidentatur Hemann
Brachionus rctun fo rmLr(Tschugunoff)
Euchlanis diIdhtta Etrcnberg
Trichocercarattw carindta (Muller)
GASTROPODA
Coriella sp.
OLIGOCHAETA
Ainudri Ius nharna Pinder&Bink\urst
Tubificidae
Derc dieitata (Mnller)
Paranaislitoralis (Mnller\
Enchytraeidae
ARTHROPDA
ACARIFORMES
Hydrachnidae
Eylaissp.
Halacaridae
Oribatida
Mesostigmata
ANOSTRACA
Branchinelh lyrtfera Lndet
CONCHOSTRACA
Caenesthzriasp.no\. A (nr lutraria)
CLADOCERA
Alona diaphanaKjng
Alona rectangulanovaezealandiae
Sars
Alona didphlttutyermiculdtdSmiNov&Timms
Alora sp.nov.A (Bryde)
Alona cf. crassicauda
Biape|tars rigid :audis s.l. S'J.ffn'o.'
Biapertura cf. IonSiquaSfiirno'r'
Leldigia cf. ciliata Garrllier
Monospilusdiporus Smimov & Timms
MonospiluselongatusSmirnov& Timms
I
t
I
I
5
2
4
408
Continued
wetland
t 3 5
Plurispina cf. chauLiodi.sFrey
I
Pleuroxuscf.foveatwFrcy
I
Rdt sp. nov. B (Venemores)
I
Ceriodaphnia laticaudata MJ€ller
2
4
I
I
Dophni.l cephalataKjrg
I
Daphnio carinata s.I. King
1
I
I
1
Daphniopsis pusi a Serrenty
I
Daphniopsi.s quee sla densis Sergee.'
I
Simocephalus exspinosus De Grcer
I
SimocephalusvitoriensirSmimov&Timms
1
Macrcthri:c brerilet r Sfiirnov
I
Neothrix cf. drmata G\fiiey
I
I
OSTRACODA
Limnocytherc mowbmyeruis Chapnan
Clpridei; australieuis
I
HatuIF' t
IlJocypris australiensis Sars
I
I
I
lllocl,pr'i.r sp. nov. A
I
Alboa v,orooa De Deckker
Australocypris insalaris (Chapman)
I
I
I
Bennelongia austmlis Br^dy)
I
Candonocypris notaezehndiae (Baid)
I
C)prctta bqlyi McKettzie
I
I
I
CJpinotus edwardiMcKenzie
1
Diacrpri.s spinosaDeDeckker
I
Eucyprb vircns JuJine
I
Heterccypris wtia De Deckker
I
M)tilpcypris
ambiguosaDeDeckker
I
Mjtilocypris
tastnanica chapmaniMcKenzle
I
Ilrodrcmus cf. canlonite.r De Deckker
1
Cwericercus sp.442
I
I
I
1
1
I
1
Retiq,pris clavaDeDecl.ker
I
I
Cabonoctpris nunkeri De De.kket
1
Platycypris baueriHerbst
Sarscypridopsis acaleata (Costa)
I
1
1
1
laptocythere hcustris DeDeckker
1
Kennethia cristataDeDeckker
I
1
COPEPODA
Boecke a triarticulata (Thomson)
Cala/noecia anpulla (Searle)
I
I
I
1
1
Calamoeciaclite ataBayly
I
Gladioferens inparipe s Tt\onson
Metacycbps sp.462
I
I
Metactclaps amaudi (sensn SaJs)
Austrulocyclops australis (Sars\
I
I
Halicyclnps cf. anbiguus Kefet
Mesocyclops brool<siDe Laurentiis et al.
1
I
t
I
409
Continued
Wetland
t
3
5
E ucyclops australiens is Mofion
Ap ocycI op s den8 i.i us (Lepecbkine)
Mesochru baylj,i Hamond
Mesochm ?favaLang
I
Cletocamp tus deirersi (Rjchal.d)
I
OqJchocamptus benealensir (Sewell)
I
Schizopera cLlndestiw (Klie)
I
AMPHIPODA
Austrochiltonia subtenuis (Sayce)
ISOPODA
Haloniscus sea ei (Chlhon)
DECAPODA
Palaemo etcs auitrali.s Dakln
IIEMIPTERA
Sallula nt brevicornis Rimes
Saldidae
A g rcp tocor ixa p arv ip unctata (I{nle)
A grapto cori:ca hift ifaons (Ela1e)
Mic mnecto robustlt HaIe
Micronecta gruciis Hale
Anisops gratus H^le
Ani.sops occipitalis Brcddin
Anisops sp.
ODONATA
Austrole stesannulos us (Sely s)
I
I
Hemiandx pap ensis (Bulmeisrer\
I
I
Hemicordulia tau Selys
I
I
TRICHOPTERA
Notalina spira SLClair
I
Oecetis sp.
I
Synp h ito new ia wheeI eI i B ar,ks
I
Tr ip I ect i des aust ralis N avas
I
Leptoceridae sp.
DIPIERA
Tipulidae group C
Anopheler annulipes Walker
Culicoides sp. A.
I
I
Nilobezzia sp. A
I
Nilobezzia sp.B
Ceratopogonialae
sp. A
,t
Ceratopogonidae sp. B
Psvchodidae
I
I
Stratiomyidae
I
I
I
I
Dolichopodidae
i
I
'
2
4
410
Continued
Wedand
r 3 5
Ephydridae
ProcladiuspatuAcoh Skise
Procladius ))illosimanusKi effer
Ablabesmyianotabilis Sklse
Pammerina leyiAensis (Skvse)
CricotoplLsalbitarsusWalker
Paralimnophyespullulus (Sk]dse\
'
Onhocladiinaesp.A
%n],tdruarsp.A (nr Kto sensuCranston)
Chiro o/nusoccidentalisSktse
Chircnomlts
tepperi Sk'rse
Chironomuscf. alternansWalker
D icrctendipespseltdoconjunctusEpler
Dbrotendipessp.A
PolJpedihonn bifer (Sk[se)
Pollpedilum converum I ohannsen
Cryptochi ronomusI risei dorsum Ki,eff er
Ckldopelmacurtiwba Kieffer
Parachironomussp.A
COLEOPTERA
A odessusbi.striIdtus(Cla*)
AntiporusBilberti (Clark)
Stemopriscusmuhimaculats (Claft)
Necterosona penicillatus (Clark,
Rftartr.r rutu,'alis wS Macleay
I^cncetes Ianceolat6 (Clark\
Bens us discolor Blackbnm
. Bemsusnunitipemis Blackb]'m
Beross sp,
Hydrophilidae
Ochthebiussp.
Heteroceridae
Curculionidae
2
4


© Copyright 2026