
Document 333797
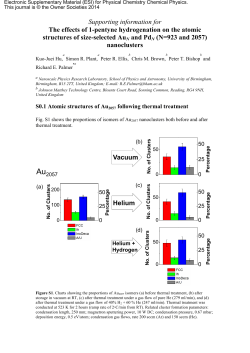
A AGO1 (6D8.2) in MCF10 B AGO1 (4B8) in MCF10 Supplementary Figure 1. Enrichment analysis of two ChIP-seq experiments using the commercial antibodies to AGO1 6D8.2 from Millipore (A) and 4B8 from Sigma (B) in MCF10 cells across various genomic regions: CpG islands (CpG), promoters, exons, 5’UTRs (5’UTR), coding exons (CDS), 3’UTRs (3’UTR), downstream of the polyA site (Tail), introns, first intron (Intron1), 300 nt downstream of the first 5’ splice-site [Intron 1 (300), intergenic regions (Intergenic), intragenic enhancers (Enh-in), intergenic enhancers (Enhout) and bidirectional promoters (Bi-di-promoters). The y-axis represents the log2-rate of the observed over expected overlaps. Significant enrichment and depletion are indicated as red and blue bars, respectively, with gray indicating no significant difference (see Methods for details). A 1 2 3 4 5 6 B 1 2 3 4 5 6 7 8 9 10 11 12 Supplementary Figure 2. (A) Proteins from nuclear and cytoplasmic extracts from HeLa cells (lanes 2, 3, 5 and 6; 20 µg each) and 0.5 µg of spliceosomal B complexes (lanes 1 and 4) were separated on a 8% polyacrylamide SDS gel, transferred to a nitrocellulose membrane and probed with anti-Ago1 4B8 and 6D8.2 antibodies. (B) Total cell extracts from SF3B, AGO1 or Luciferase depleted cells were separated on a 8% polyacrylamide SDS gel, transferred to a nitrocellulose membrane and probed with anti-SF3b155, antiAgo1 4B8 and 6D8.2 antibodies. Antibody against the spliceosomal protein U5-116k was used as a loading control. Supplementary Figure 3. 2D Western blot analysis of human spliceosomal B complexes with the 6D8.2 antibody (Millipore). B complex purification and 2D gel electrophoresis were perform as described in Agafonov et al., 2011. Proteins were transferred to the nitrocellulose membrane, stained with Ponceau S (left panel) and, subsequently, blotted with 6D8.2 antibody (right panel). Major spots stained with Ponceau S were identified according to the position on the 2D map of the spliceosomal B complex (Agafonov et al.). The spot recognized by 6D8.2 antibody was matching the position and the shape of SF3b145 protein on the 2D map of the B complex. A B Bidirec9onal Promoter Supplementary Figure 4. (A) Profile of AGO1 reads from significant clusters around transcription start sites (TSSs) for all TSSs (green), for TSSs after removing enhancers (Not in Enh, red), after removing bidirectional promoters (Not in Bi-di-prom, orange) or after removing both (Not in Enh or Bi-di-prom, dashed blue line). (B) Profile of AGO1 reads from significant clusters centred at the middle of bi-directional promoters. Supplementary Figure 5. Profile of H3K27ac and H3K4me3 on the ChromHMM enhancers defined as active and non-active. A B Supplementary Figure 6. Profile of AGO1 reads (from significant clusters) centered on enhancers classified as active intergenic (A) and active intragenic (B). Active and nonactive enhancers were identified as explained in Methods. A B Supplementary Figure 7. (A) Profile of H3K36me3, H3K27me3 and H3K9me2 at AGO1 significant clusters. (B) Profile of AGO1, H3K27me3 and H3K9m2 reads centered at intragenic enhancers classified as active. Random signals, obtained from the randomization of clusters (see Methods) are represented with dashed lines. Active and non-active enhancers were identified as explained in Methods. A B Supplementary Figure 8. Profile of AGO1, H3K27me3 and H3K9me2 reads (from significant clusters) centered on enhancers classified as non-active intergenic (A) and non-active intragenic (B). Active and non-active enhancers were identified as explained in methods. A B Supplementary Figure 9. (A) Active enhancers (green boxplots) have significantly higher densities of AGO1 reads (KS test p-value < 2.2e-16). (B) Active enhancers with AGO1 (blue boxplots) have a significantly higher density of GRO-Seq reads (KS test p-value < 2.2e-16) than active enhancers without AGO1 (green boxplots). Supplementary Figure 10. Density of long (upper panel) and short (lower panel) nuclear RNAs in intragenic and intergenic enhancers separated according to whether there is AGO1 signal (green) or not (blue). Supplementary Figure 11. Profile of AGO1-4B8, AGO1-6D82 and Histone marks (H3K9me2, H3K27me3 and H3K36e3) around internal exons. The reference point (0) is located at the 5’end of the internal exons. Supplementary Material Argonaute-1 binds transcriptional enhancers and controls constitutive and alternative splicing in human cells Mariano Allóa,1,2, Eneritz Agirreb,1,3, Sergey Bessonovc,1, Paola Bertuccia,1, Luciana Gómez Acuñaa, Valeria Buggianoa, Nicolás Bellorab,4, Babita Singhb, Ezequiel Petrilloa, Matías Blausteina, Belén Miñana b,d , Gwendal Dujardina, Berta Pozzia, Federico Pelischa, Elías Becharab,d, Dmitry Agafonovc, Anabella Srebrowa, Reinhard Lührmannc, Juan Valcárcelb,d,e, Eduardo Eyrasb,e,5,6, and Alberto R. Kornblihtta,5,6 a Laboratorio de Fisiología y Biología Molecular, Departamento de Fisiología, Biología Molecular y Celular, IFIBYNE-CONICET, Facultad de Ciencias Exactas y Naturales, Universidad de Buenos Aires. Ciudad Universitaria, Pabellón II, (C1428EHA) Buenos Aires, Argentina. b Universitat Pompeu Fabra, Dr. Aiguader 88, E-08003 Barcelona, Spain. c Max-Planck-Institute for Biophysical Chemistry, Am Fassberg 11, 37077 Göttingen, Germany. d Centre for Genomic Regulation. Dr. Aiguader 88, E-08003 Barcelona, Spain. e Catalan Institution for Research and Advanced Studies (ICREA), Passeig Lluís Companys, 23, E-08010 Barcelona, Spain. 1 These authors contributed equally to this work 2 Present address: European Molecular Biology Laboratory, Meyerhofstrasse 1, 69117 Heidelberg, Germany. 3Present address: Institute of Human Genetics, CNRS UPR 1 1142, Montpellier, France. 4Present address: INIBIOMA, CONICET-UNComahue, Bariloche, Río Negro, Argentina. 5 Co-corresponding authors 6 To whom correspondence should be addressed (e-mail: [email protected], [email protected]). Materials and Methods Characterization of commercial anti-AGO1 antibodies from Sigma and Millipore. We first assessed AGO1 endogenous localization by Western blot of HeLa cell extracts. The signal for antibody 6D8.2 is predominantly nuclear (Fig. S2A, lanes 2 and 3), whereas 4B8 reveals equally abundant signals in cytoplasmic and nuclear fractions (lanes 5 and 6). As mentioned above for MCF7 cells, the bands recognized by these antibodies in HeLa cells differ in about 60 kDa: 4B8 reveals a band of about 90 kDa, which is the expected size for the AGO1 protein, while 6D8.2 reveals a band of about 150 kDa. Moreover, when 6D8.2 is used to immunoprecipitate endogenous AGO1 only one clear band is developed by Western blot at the size of 150 kDa, whose identity was revealed by mass spectrometry analysis as that of the constitutive splicing factor SF3B. This amazing result was confirmed by the fact that 6D8.2, but not 4B8, detects a 150 kDa band in a purified preparation of the spliceosomal B complex, characterized by the presence of the 150 kDa SF3B factor (Fig. S2A, compare lanes 1 and 4). Two independent laboratories have previously shown evidence of interaction between AGO1 and proteins involved in splicing regulation (1, 2) in the nucleus of human cells and found SF3B as one of the first hits from mass 2 spectrometry analysis of immunoprecipitates. However, in the light of our results, the presence of SF3B in 6D8.2 immunoprecipitates could be the result of an antibody cross-reaction rather than of an AGO1- SF3B interaction. To explore this possibility, we performed RNAi depletions of either AGO1 or SF3B from HeLa cells and performed Western blots with different antibodies. Fig. S2B shows that the intensity of the 150 kDa signal recognized by both the anti SF3B and 6D8.2 antibodies displays a dramatic reduction upon SF3B but not AGO1 depletion (lanes 5 and 11). Conversely, AGO1 depletion only reduced the signal of the 90 kDa band seen by 4B8 (lane 9). In parallel, immunoprecipitation of HeLa cell extracts with anti SF3B or 6D8.2 antibodies generated 150 kDa bands revealed by both SF3B and 6D8.2 but not by 4B8. Finally, in a 2D Western blot analysis of purified human spliceosomal complex B, 6D8.2 clearly recognizes a spot corresponding to SF3B2 (sf3b145) demonstrating that the 150 kDa band observed in regular Western blots is SF3B (Fig. S3). Taken together, these results demonstrate that 4B8 recognizes AGO1 in a very specific fashion while 6D8.2 reacts mainly with SF3B both in native and denaturing conditions, which indicates that the use of 6D8.2 provided by Millipore is a potential source of dramatic artifacts. This prompted us to ignore the ChIP-seq results obtained with 6D8.2, displayed in Fig. 1A. Chromatin Immunoprecipitation (ChIP): ChIP assays were performed as described (3, 4) using AGO1 Millipore (6D8.2), AGO1 Sigma (4B8H3) (Abcam), H3K36me3 (Abcam), H3K9me2 (Millipore), H3K27me3 (Millipore), HP1-alpha (Abcam), 5meC (Diagenode). In order to perform ChIPs, MCF7 and MCF10 human breast cells were plate and incubated during 72 hours in complete medium (DMEM high glucose GutaMAX (Life Technologies), then the medium was changed by crosslinking medium containing 1% formaldehyde. Cells were incubated for 10 min at 3 37°C and the reaction was stop by adding 125 mM glycine. After 5 min at room temperature, cells were washed twice with cold PBS and collected. Chromatin was prepared as previously described (4), DNA fragments length was analyzed by ethidium bromide agarose gel and it was quantified using the Nanodrop. 300-400 µgr of chromatin were pre-cleared and incubated ON in buffer IP (Diagenode) with the specific antibody. Samples were incubated with pre-blocked beads (Diagenode) for three hours. Then, the beads were washed three times with washing buffers, one with TE buffer and 250 µl of elution buffer were added. The immuno-precipitated DNA was extracted from the eluted samples with QIAquick PCR-Purification kit (Qiagen). Immunoprecipitation and immunoblotting of affinity purified spliceosomal B complexes, nuclear and cytoplasmic extracts. Nuclear and cytoplasmic extracts were prepared from HeLa cells essentially as described by (5). Proteins from nuclear and cytoplasmic extracts were separated on 8% SDS-PAGE, transferred on a nitrocellulose membrane and probed with 4B8, 6D8.2 or anti SF3b145 antibodies. Spliceosomal B complexes were isolated as described in Bessonov et al., 2008 (6). Briefly, PM5 pre-mRNA was incubated with a 20-fold molar excess of purified MS2–MBP fusion protein. The splicing reaction containing 3 mM MgCl2, 65 mM KCl, 2 mM ATP, 20 mM creatine phosphate, 20 mM HEPES-KOH, pH 7.9 and 5 nM of [32P]-labeled PM5 pre-mRNA was incubated for 4 min at 30 oC. Reaction mixture was separated on a 10–30% glycerol gradient containing 150 mM NaCl. Spliceosomes were then affinity purified from the gradient fractions using amylose beads. Spliceosomal proteins were resolved by 2D gel electrophoresis and immunoblotted with 6D8.2 or SF3b145 antibodies. For immunoprecipitation, the HeLa nuclear extract was incubated with protein A or 4 protein G beads charged with antibodies in the G-400 buffer (400 mM NaCl, 1.5 mM MgCl2, 20 mM HEPES-KOH, pH 7.9). Beads were washed extensively with G-400 and immunoprecipitated material was eluted SDS-PAGE loading buffer, resolved on a protein gel and analyzed with Western blotting. Intronic siRNAs and treatments: Transfection with siRNAs and treatments with 5azadC and TSA were done as we previously reported (7). The sequences of Invitrogen Stealth siRNAs used here are: I107as1-AUCCUCAACCUCGCUCCCAUGUCGU I107as2-CGCCCCAACCCCCCACCCCUUUCCA I107as3-CGGGUCUGGGGACCAAGAUGGCAGA. Camptothecin (CPT) was applied according to Dujardin et al. (2014) (8). RNA sample preparation: MCF7 total mRNA purification was performed with Rneasy mini Kit from QIAGEN following their instructions. Three biological replicates from each sample were sequenced with Illumina HiSeq-2000 using standard protocols. Deep Sequencing: ChIP-seq library preparation was performed following the protocol by Illumina. Briefly, 10 ng of immunoprecipitated DNA was end-repaired, and Illumina double stranded adapters for single read sequencing were ligated to the DNA. After purification of the sample with a MinElute spin column, we size selected the libraries on a 2% agarose gel and fragments corresponding to an insert size range of around 130 bp were recovered. The libraries were finally amplified with an 18cycle PCR reaction, and library quality was confirmed on the Agilent 2100 Bioanalyzer. The samples were loaded at concentrations of 8-11 pm (proportionally less in case of sample pooling) onto Illumina single read flowcells and sequenced on 5 the Illumina Genome Analyzer II or Iix using a 40 cycles recipe. Basecalling was performed using Illumina pipeline version 1.4.0 (within SCS 2.3). RNA-seq library preparation was performed following the protocol by Illumina. Briefly, 3.5 ug of total RNA were used to isolate polyA+ mRNA using Sera magnetic beads coated with oligo-dT. The isolated mRNA was fragmented by incubation in buffered zinc solution and heat treatment. cDNA was generated by first creating a single-stranded cDNA using SuperScript II reverse transcriptase by random priming. The ssDNA was copied into double stranded cDNA by incubation with Rnase H and DNA polymerase I. Following end-repair, adapters for paired-end sequencing were ligated to the DNA. After purification with MinElute spin columns we ran the samples on a 2% agarose gel. Fragments corresponding to an insert size of around 250 bp were excised from the gel. Then, the library was amplified with a 16-cycle PCR reaction, and the quality of libraries confirmed on the Agilent Technologies 2100 Bioanalyzer. Samples were sequenced on the HiSeq2000 using v1 sequencing chemistry using a paired end sequencing recipe (2 x 50 bases). Basecalling was performed using the Illumina HiSeq pipeline 1.7.0 (within HCS 1.4.8). Significant ChIP-Seq clusters: Additionally to the ChIP-Seq data generated, we included RNAPII in MCF7 (9). As control samples for MCF7 and MCF10A, we used ChIP-Seq data with a non-specific antibody (IgG). Sequencing reads were mapped to the reference genome sequence (hg18) using bowtie (10) with parameters –v 2 –best – strata –m 1, i.e. keeping the best unique matches with at most 2 mismatches to the reference. Using Pyicos (11), all reads were extended to 200nt in the 5’ to 3’ direction, apart from AGO1 reads that were extended to 350nt, based on the mean size of the fragments obtained after sonication for each sample; and reads overlapping centromeres, gaps, satellites, pericentromeric regions and low mappability regions 6 (“Duke excluded“ regions from ENCODE CODE (2011) (12) were excluded. Finally, clusters were built from reads that overlap each other in genomic coordinates using Pyicos (11) and singletons (clusters with one read) were discarded. To calculate significant ChIP-Seq clusters we estimated the background signal in the ChIP-Seq samples by assuming that the low coverage regions were equivalent to the background (13). Low coverage clusters were defined to have less than 10 reads; and those overlapping with Control clusters were selected from each sample. The mean of the log2 ratios between these overlapping sample and control clusters was used to estimate the ChIP over Control normalization factor (CNF) (14): CNF = !n $ 1 N log 2 ## s,i && ∑ N i=1 " nc,i % where N is the total number of overlapping sample and control with less than 10 reads, and ns,I and nc,I are the number of sample and control reads, respectively, in each overlapping pair of clusters. From the CNF a p-value was obtained for each ChIP-Seq cluster using (15). P(ns | nc ) = (CNF)ns (ns + nc )! ns !nc !(1+ CNF)(ns +nc +1) Where P is the conditional probability inferred for a cluster with ns reads in a ChIPSeq sample, provided that nc control reads overlap in the same region. For clusters with no overlapping control reads, a pseudocount of 1 control read was used. Thresholds of p-value < 0.01 and p-value < 0.001 were used to obtain significant clusters in MCF7 and MCF10, resulting in 14205 and 25097 significant AGO1 clusters, respectively. MCF7 and MCF10 showed differences in cluster count and in the enrichment values relative to the CNF. The thresholds were selected to obtain a 7 similar number of significant clusters for the two cell lines. The enrichment analyses (see below) were performed for various cut-offs without major differences. Random clusters were calculated by relocating each cluster in an arbitrary new position in the same chromosome, avoiding satellites, gaps, pericentromeric regions and the overlap with any other random cluster previously generated. Genomic regions and ChIP-Seq overlap enrichments: To study the significance of the co-occurrence of the different ChIP-Seq clusters in specific regions we used the block bootstrap and segmentation method (version 0.8.1) (http://encodestatistics.org/) (16) with parameters –r 0.1 –n 10000, where r is the minimum overlapping fraction of each cluster to a region and n is the number of bootstrap samples used. As input for this method, multiple regions (genome, promoters, etc) and ChIP-Seq clusters that fall within those regions were used, and only mappable regions were considered. The observed vs. expected overlap ratios and corresponding z-scores were calculated for each ChIP-sample and genomic region pair. The associated z-score was considered significant when |z-score|>3.3, corresponding to a two-tail p-value<0.001. These results are shown in Figure 1A and Supplementary Figure 1. The association of AGO1 and enhancers in genes was also analyzed using a 2x2 contingency table (Table S1) Genes with AGO1 Genes with no AGO1 Genes with enhancer n11 n21 Table S1 and calculating the mutual information: 8 Genes with no enhancer n12 n22 ! $ n11 mi = log 2 # (n11 + n12 + n21 + n22 )& " (n11 + n12 )(n11 + n21 ) % and performing χ2 test. For all enhancers: (n11, n12, n21, n22) = (3084, 66, 16890, 8935), mi=0.506, chi=1383.534, p-value = 2.2e-16. For active enhancers: (n11, n12, n21, n22) = (2451, 699, 9334, 16491), mi = 0.935, chi = 2018.21, p-value = 2.2e-16. For active enhancers restricted to lengths 400-2600bp: (n11, n12, n21, n22) = (1898, 1252, 6744, 19081), mi= 1.014, chi=1561.801, p-value < 2.2e-16. Active enhancers: Regions predicted by chromHMM as candidate enhancers in 9 different cell lines (17) were used to compare with the significant AGO1 clusters. We labelled as active those candidate enhancers with a significant enrichment (z-score > 3) of H3K4me3 and H3K27ac ChIP-Seq over input signal, calculated with Pyicos using ENCODE ChIP-Seq data for MCF7 cells. Those cases without enrichment were defined as inactive enhancers. This produced 2622 active and 2219 non-active enhancers. Estrogen-dependent enhancers were defined as the MCF7 ER-α-H3K27ac co-bound regions (18). Co-bound regions were selected when the distance from the centre of an ER-α peak to the H3K27ac peak occupied region was ≤1 kb. The selected enhancer regions were ranked according to the coverage of GRO-Seq reads for each one of the replicas. Enhancers were then divided into active or non-active according to whether they are in the top 25% or bottom 25%, respectively, in any of the two replicates. According to this, we obtained 157957 active and 166453 nonactive enhancers. Association of Histone marks. We considered the following contingency table (Table S2) for the co-occurrence of histone marks genome-wide and at enhancers, separated according to whether they coincide or not with AGO1 clusters: 9 Both marks not in Both enhancers enhancers n11 n12 Without AGO1 n21 n22 With AGO1 marks on Table S2 The corresponding p-values for each association are shown in Table S3: Association of marks Chi-square test p-value H3K9me2 and H3K27me3 0.0001743 H3K36me3 and H3K9me2 0.01370 H3K36me3 and H3K27me3 0.01196 H3K27me3 and H3K36me3 0.002915 H3K9me2 and H3K36me3 4.101e-10 Table S3 The profile plots show already that the marks appear enriched on AGO1 clusters genome-wide. These tests show that the enrichment of enhancers sites with AGO1 is significant. RNA-Seq data analysis: Small RNA single end reads of length 50 nucleotides were adapter trimmed using fastx-trimmer in fastx_toolkit-0.0.13.2. The reads without adapters were trimmed to maximum length of 46 nucleotides from 3’ end to avoid any further adapter overlap. The trimmed reads were then mapped to the human reference 10 (hg19) genome using STAR version 2.2.0 with parameters – outFilterMismatchNoverLmax 0.05 –outSAMattributes All –outSJfilterOverhangMin 20 10 10 10 --sjdbFileChrStartEnd introns_ucsc_hg19 –sjdbOverhang 45. Intron coordinates were generated from UCSC table browser. Long RNA paired-end reads (MCF-7 and MCF-10 cells) were mapped with tophat2 using parameters –readrealign-edit-dist 0 –a 10 –p 4 –g 10 –library-type fr-firststrand –j junction_file –G gtf_file hg19_index_file read_1 read_2, where junction_file contain the intron coordinates generated from the UCSC table browser. BAM files were transformed to hg18 coordinates to compare with the rest of the datasets. Expression levels of genes were calculated as the RPKM of the RNA-Seq reads on the exonic regions projected onto the genome, using Ensembl annotation version 54 after removing pseudogenes and rRNA genes. Promoters were defined to be the 2kb region upstream of the annotated transcription start site (TSS). In case of multiple TSSs, the furthest upstream TSS was taken. The ranking of RNA-Seq RPKMs was used to split genes into high (top 25%), medium (middle 50%) and low (bottom 25%) expression sets, including also genes with zero reads. Differential expression was calculated with DEGSeq (19) using the MATR method, i.e. 2 versus 2 replicas. Using as threshold a Benjamini-Hochberg corrected p-value of 0.05, a total of 1274 genes were found to be regulated upon AGO1 depletion: 813up-regulated and 461 downregulated in the knockdown sample compared to wild type. Further, 698 genes were classified as no change (NC), defined by being labeled as HIGH in the 4 RNA-Seq samples, and by having expression enrichment (log2-ratio of the RPKM in knockdown over wild type) between -0.05 and +0.05 in all possible comparisons. In order to detect all possible exon cassette events, all combinations of three adjacent exons (E1, E2, E3) in the annotation were considered. Splice junctions of 56nt were 11 generated for each exon pair (E1E2, E2E3, E1E3), containing the last 28 bases of the upstream exon and the first 28 bases from the downstream exon. RNA-Seq reads were mapped to the junctions with bowtie (10) allowing up to 2 mismatches. The inclusion level (I) of the middle exon E2 was calculated as the fraction of reads that include the exon over the total number of reads that include and skip the exon: I= n12 + n23 n12 + n23 + 2n13 where n12, n23 and n13 are the number of reads that span the junctions E1E2, E2E3 and E1E3, respectively. The inclusion change between two conditions, siAGO1 and siLuc, was computed for each event as the log2-rate of the inclusion levels: ⎛ I ⎞ M = log 2 ⎜ siAGO1 ⎟ ⎝ I siLuc ⎠ To estimate the significance of the inclusion changes, the tool Pyicos (11) was used to € calculate a significance score as a function of the number of reads in the junctions: ( A = log2 (n12 + n 23 + n13 ) siAGO1 + (n12 + n 23 + n13 ) siLuc ) The significance of the enrichments was estimated by comparing the enrichment € values between the two conditions (siAGO1 and siLuc) to those between replicas. Keeping only those events with a significant change in all comparisons (BenjaminiHochberg corrected p-value < 0.01) resulted in a total of 659 regulated events: 354 that increase their inclusion and 305 that decrease their inclusion, upon AGO1 depletion. The Splicing Efficiency Score (SES) of an intron is defined as SES = s s+u € 12 , where s is the number of spliced reads defining the intron and u is the number of reads over exon-intron boundaries. All reads that fall entirely inside any of the annotated exons were first discarded. Significant changes in the SES score were calculated analogously to the AS analysis described above, by calculating the log2-fold enrichment between siAGO1 and siLuc as a function of the number of the total number of reads from both conditions in log2 scale. Those introns with a significant change (Benjamini-Hochberg corrected p-value < 0.05) were kept. References 1. Ameyar-‐Zazoua M, et al. (2012) Argonaute proteins couple chromatin silencing to alternative splicing. Nat Struct Mol Biol 19(10):998-‐1004. 2. Hock J, et al. (2007) Proteomic and functional analysis of Argonaute-‐ containing mRNA-‐protein complexes in human cells. EMBO Rep 8(11):1052-‐1060. 3. Bertucci, P.Y. et al. (2013). Progesterone receptor induces bcl-‐x expression through intragenic binding sites favoring RNA polymerase II elongation. Nucleic Acids Res. 41, 6072-‐6086. 4. Strutt, H., and Paro, R. (1999). Mapping DNA target sites of chromatin proteins in vivo by formaldehyde crosslinking. Methods Mol Biol 119, 455-‐467. 5. Dignam, J.D., Lebovitz, R.M., and Roeder, R.G. 1983. Accurate transcription initiation by RNA polymerase II in a soluble extract from isolated mammalian nuclei. Nucleic Acids Res 11(5), 1475-‐1489. 13 6. Bessonov, S., Anokhina, M., Will, C.L., Urlaub, H., and Luhrmann, R. (2008). Isolation of an active step I spliceosome and composition of its RNP core. Nature 452, 846-‐850. 7. Allo, M. et al. (2009). Control of alternative splicing through siRNA-‐mediated transcriptional gene silencing. Nat Struct Mol Biol 16, 717-‐724. 8. Dujardin, G. et al. (2014). How Slow RNA Polymerase II Elongation Favors Alternative Exon Skipping. Mol Cell 54, 683-‐690. 9. Welboren, W.J., van Driel, M.A., Janssen-‐Megens, E.M., van Heeringen, S.J., Sweep, F.C., Span, P.N., and Stunnenberg, H.G. (2009). ChIP-‐Seq of ERalpha and RNA polymerase II defines genes differentially responding to ligands. EMBO J 28, 1418-‐1428. 10. Langmead, B., Trapnell, C., Pop, M., and Salzberg, S.L. (2009). Ultrafast and memory-‐efficient alignment of short DNA sequences to the human genome. Genome Biol 10, R25. 11. Althammer, S., Gonzalez-‐Vallinas, J., Ballare, C., Beato, M., and Eyras, E. (2011). Pyicos: a versatile toolkit for the analysis of high-‐throughput sequencing data. Bioinformatics 27, 3333-‐3340. 12. ENCODE (2011). A user's guide to the encyclopedia of DNA elements (ENCODE). PLoS Biol 9, e1001046. 13. Rozowsky, J., Euskirchen, G., Auerbach, R.K., Zhang, Z.D., Gibson, T., Bjornson, R., Carriero, N., Snyder, M., and Gerstein, M.B. (2009). PeakSeq enables systematic scoring of ChIP-‐seq experiments relative to controls. Nat Biotechnol 27, 66-‐75. 14 14. Liang, K., and Keles, S. (2012). Normalization of ChIP-‐seq data with control. BMC Bioinformatics 13, 199. 15. Audic, S., and Claverie, J.M. (1997). The significance of digital gene expression profiles. Genome Res 7, 986-‐995. 16. Bickel, P. J., Boley, N., Brown, J. B., Huang, H., & Zhang, N. R. (2010). Subsampling methods for genomic inference. The Annals of Applied Statistics 4(4), 1660-‐1697. 17. Ernst, J., Kheradpour, P., Mikkelsen, T.S., Shoresh, N., Ward, L.D., Epstein, C.B., Zhang, X., Wang, L., Issner, R., Coyne, M., et al. (2011). Mapping and analysis of chromatin state dynamics in nine human cell types. Nature 473, 43-‐49. 18. Li, W., Notani, D., Ma, Q., Tanasa, B., Nunez, E., Chen, A.Y., Merkurjev, D., Zhang, J., Ohgi, K., Song, X., et al. (2013). Functional roles of enhancer RNAs for oestrogen-‐dependent transcriptional activation. Nature 498, 516-‐520. 19. Wang, L., Feng, Z., Wang, X., and Zhang, X. (2010). DEGseq: an R package for identifying differentially expressed genes from RNA-‐seq data. Bioinformatics 26, 136-‐138. 15


© Copyright 2026