ABC
docz
Explore
Log in
Create new account
Download
Report
No category
Co-Electrolysis of Steam and Carbon Dioxide in Solid
Turning CO into valuable products, powered by the sun
VP Marketing - Commerce Mentorship Program
8MW Nominal Capacity - Dresser-Rand
How fossil fuels are formed …
Imagine what you can achieve in 50 days
Module Guide
Safety and health standard of cannabis extractions with an
` American Motor Credit
âDesign Principles for Reversible CO2 Chemistriesâ
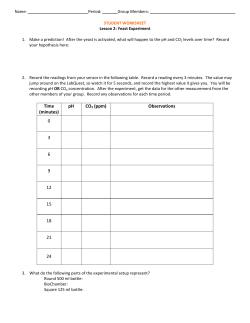
Time (minutes) pH CO2 (ppm) Observations 0 3 6 9 12 15 - C-MORE
© Copyright 2026
About abcdocz
DMCA / GDPR
Report