ABC
docz
Explore
Log in
Create new account
Download
Report
No category
Publisher version
(i) Make a 100 lines copies and write down the New words of L
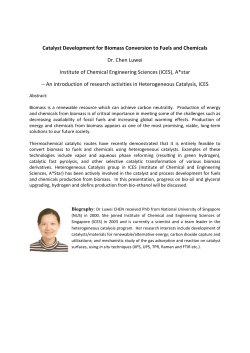
Dr. Chen Luwei - BioEnergy Society of Singapore
GF log dryer A4 4pp 27-03-2015 pages 1 & 3
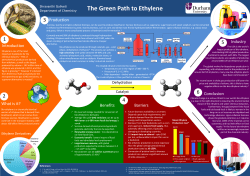
The Green Path to Ethylene Conclusion
Notification Letter to Organs of State
Wi-Fi Login flow for Vibrant Gujarat
Encostas de Favaios Red
SiloSolve EF
Technical Tour of 8th ISFR 2015
BIOMASS FOR REGISTER FOR THE CONFERENCE REGISTER A POSTER
© Copyright 2026
About abcdocz
DMCA / GDPR
Report