
Aalborg Universitet IDA`s Energy Vision 2050 Mathiesen
Aalborg Universitet IDA's Energy Vision 2050 Mathiesen, Brian Vad; Lund, Henrik; Hansen, Kenneth; Ridjan, Iva; Djørup, Søren Roth; Nielsen, Steffen; Sorknæs, Peter; Thellufsen, Jakob Zinck; Grundahl, Lars; Lund, Rasmus Søgaard; Drysdale, Dave; Connolly, David; Østergaard, Poul Alberg Publication date: 2015 Document Version Publisher's PDF, also known as Version of record Link to publication from Aalborg University Citation for published version (APA): Mathiesen, B. V., Lund, H., Hansen, K., Ridjan, I., Djørup, S. R., Nielsen, S., ... Østergaard, P. A. (2015). IDA's Energy Vision 2050: A Smart Energy System strategy for 100% renewable Denmark. Department of Development and Planning, Aalborg University. General rights Copyright and moral rights for the publications made accessible in the public portal are retained by the authors and/or other copyright owners and it is a condition of accessing publications that users recognise and abide by the legal requirements associated with these rights. ? Users may download and print one copy of any publication from the public portal for the purpose of private study or research. ? You may not further distribute the material or use it for any profit-making activity or commercial gain ? You may freely distribute the URL identifying the publication in the public portal ? Take down policy If you believe that this document breaches copyright please contact us at [email protected] providing details, and we will remove access to the work immediately and investigate your claim. Downloaded from vbn.aau.dk on: January 02, 2016 The Danish Society of Engineers, IDA a modern professional association for technical and science professionals IDA’s Energy Vision 2050 A Smart Energy System strategy for 100% renewable Denmark IDA’S ENERGY VISION 2050 IDA’s Energy Vision 2050 A Smart Energy System strategy for 100% renewable Denmark © The Authors: Brian Vad Mathiesen Henrik Lund Kenneth Hansen Iva Ridjan Søren Djørup Steffen Nielsen Peter Sorknæs Jakob Zinck Thellufsen Lars Grundahl Rasmus Lund David Drysdale David Connolly Poul Alberg Østergaard Aalborg University, Department of Development and Planning Published by: Department of Development and Planning Aalborg University Vestre Havnepromenade 5 9000 Aalborg Denmark Printed: IDA’s Print Centre, ISBN: 978-87-91404-78-8 Cover page: Screenshot of the video: “Smart Energy Systems: 100% Renewable Energy at a National Level”. Video based on research conducted at Aalborg University (www.smartenergysystems.eu). Production courtesy of Blue Planet Innovation This report has been prepared and edited by researchers at Aalborg University. Its findings and conclusions are the responsibility of the editorial team. The report has been commissioned by IDA, The Danish Society of Engineers. The work has been followed by IDA’s Expert monitoring group: Anders Dyrelund, IDA Energi Hans Jørgen Brodersen, IDA Teknologivurdering Kurt Emil Eriksen, IDA Byg Leif Amby, IDAs Erhvervs- og vækstudvalg Michael Søgaard Jørgensen, IDA Grøn Teknologi Martin Kyed, IDA Pernille Hagedorn-Rasmussen, IDA 2 IDA’S ENERGY VISION 2050 IDA’s Energy Vision 2050 This is IDA’s Energy Vision 2050. With this vision, we bring into focus how an intelligent integration of the electricity, heat, gas and transport sectors can create a robust energy supply for Denmark in the future based on renewable energy. IDA’s Energy Vision is an input to the debate. Because we want a debate in Denmark on how we can reach the political goals of replacing fossil fuels completely. At the same time, we see the transition of the energy system as an exciting opportunity for citizens and businesses. The intelligent transformation of the energy system also creates a direction which can initiate export and jobs, benefitting all of us. We have a certain responsibility to look at the energy system from a technological point of view. Where are we today and what can we expect from the energy technologies of the future? Fluctuating wind and solar energy production is already affecting our energy system, and it is a transformation which is here to stay. Luckily, the intelligent solutions can interact in smart systems which use sensor technology and automation to create dynamics between production and consumption. An important conclusion from IDA’s Energy Vision is that we need to stop thinking in sectoral terms and start considering cross-sectoral interaction. We can benefit greatly from perceiving the energy system as one system with the integration of sectors such as industry, transport, households and buildings. The electrified energy demand will play a more central role in the future, both for the individual house owner and in businesses. We need to adjust to the idea that the total energy demand in Denmark needs to decrease, while our individual electricity demand is allowed to increase. IDA’s Energy Vision 2050 builds on the work in IDA’s Climate Plan 2050 (2009) and IDA’s Energy Plan 2030 (2006). It is based on contributions and input from IDA’s professional networks and from Aalborg University’s long-standing work on energy system analysis. I wish to thank everyone who has contributed to IDA’s Energy Vision 2050. I hope that the technological voice will serve as a valuable input to the discussion about how Denmark can develop a robust energy system based on renewable energy in the years towards 2050. Frida Frost President The Danish Society of Engineers, IDA 3 IDA’S ENERGY VISION 2050 4 IDA’S ENERGY VISION 2050 Content IDA’s Energy Vision 2050.......................................................................................................................3 Introduction.............................................................................................................................................9 Executive summary ..............................................................................................................................11 Abbreviations........................................................................................................................................31 1 The design of 100% renewable energy systems ...........................................................................33 1.1 History of Energy in Denmark ...................................................................................................33 1.2 Previous research .....................................................................................................................34 1.2.1 IDA Energy Plan 2030 (2006) ................................................................................................34 1.2.2 The Heat Plan Denmark Studies (2008 and 2010) ................................................................35 1.2.3 The IDA Climate Plan 2050 (2009) ........................................................................................35 1.2.4 The CEESA (Coherent Energy and Environmental Systems Analysis) project (2011) ..........36 1.3 The Smart Energy System Approach ........................................................................................37 1.3.1 Strategic Research Center for Energy Neutral Buildings: NZEB (Net Zero Energy Buildings) ...........................................................................................................................................40 1.3.2 The 4DH Strategic Research Centre: 4th Generation District Heating ...................................40 2 Methodology for the IDA 2035 and IDA 2050 scenarios ...............................................................42 2.1 Overall methodology .................................................................................................................42 2.2 Socio-economic costs and electricity market exchange ............................................................43 2.3 EnergyPLAN hour by hour in smart energy context ..................................................................44 2.4 The 2015 Reference and Replication of the DEA 2035 and 2050 Scenarios ............................45 2.4.1 Presentation of the DEA Scenarios .......................................................................................46 2.5 Replication of the 2015 Reference ............................................................................................47 2.6 Replication of the DEA Scenarios .............................................................................................47 2.7 Differences between DEA and IDA scenarios ...........................................................................48 2.7.1 Technological development ...................................................................................................48 2.7.2 Methodological differences ....................................................................................................48 2.8 Fuel prices, investment cost and socio-economy......................................................................49 2.8.1 Fuel and CO2 price forecasts in IDA Energy Vision 2050 ......................................................49 2.9 Technical facilities and new technologies .................................................................................51 3 The IDA 2035 and IDA 2050 energy systems .................................................................................53 5 IDA’S ENERGY VISION 2050 3.1 The primary energy supply in IDA 2035 and IDA 2050 in an international context ...................53 3.2 CO2-emissions in the scenarios ................................................................................................56 3.3 The socio-economic costs of IDA 2035 and IDA 2050 ..............................................................58 3.4 Socio-economic costs in an uncertain context ..........................................................................60 4 Electricity .........................................................................................................................................64 4.1 Electricity demands ...................................................................................................................64 4.2 Electricity savings .....................................................................................................................67 4.3 Flexible electricity demands ......................................................................................................67 4.3.1 Sensitivity analysis of electricity savings and flexible demand...............................................68 4.4 Renewable electricity ................................................................................................................69 4.4.1 Sensitivity analysis for renewable electricity production ........................................................73 5 Heating and cooling ........................................................................................................................75 5.1 Heat demand in buildings .........................................................................................................75 5.1.1 Heat demand in the existing building stock............................................................................76 5.1.2 Heat demand in new buildings...............................................................................................77 5.1.3 Sensitivity analysis of heat demands .....................................................................................78 5.2 Heat production.........................................................................................................................84 5.3 Renewable heat ........................................................................................................................86 5.3.1 Geothermal ............................................................................................................................86 5.3.2 Solar thermal .........................................................................................................................87 5.3.3 Large-scale heat pumps ........................................................................................................88 5.3.4 Thermal energy storage.........................................................................................................89 5.3.5 Sensitivity analysis of renewable district heat production ......................................................90 5.4 Cooling ......................................................................................................................................91 6 Industry ............................................................................................................................................93 6.1 The 2015 energy consumption..................................................................................................93 6.2 Growth assumption same as DEA ............................................................................................94 6.3 The Industrial energy transformation hierarchy .........................................................................95 6.4 Energy Savings .........................................................................................................................95 6.5 District heating and Cooling and heat pumps............................................................................97 6.6 Replacing fossil fuels with electricity, biomass and green gas. .................................................99 6 IDA’S ENERGY VISION 2050 7 Transport ........................................................................................................................................101 7.1 Transport demand in different scenarios .................................................................................101 7.2 Meeting the transport demand ................................................................................................102 7.3 Transport scenario overview ...................................................................................................109 7.4 Impact of assumption variations..............................................................................................110 7.4.1 Variation of EV share ...........................................................................................................110 7.4.2 Variation of electrofuel ratio .................................................................................................112 8 Sensitivity of key technologies and assumptions ......................................................................114 8.1 Renewable electricity production ............................................................................................114 8.1.1 Renewable heat production .................................................................................................117 8.1.2 Technology efficiencies .......................................................................................................120 8.1.3 Investment costs ..................................................................................................................123 9 Biomass and waste .......................................................................................................................125 9.1 Biomass potential in Denmark ................................................................................................125 9.2 Biomass demand of the DEA and IDA Energy Vision 2050 scenarios ....................................127 9.3 Waste for incineration .............................................................................................................130 10 Health costs ...................................................................................................................................132 10.1 Calculation of emissions for individual technologies ............................................................132 10.2 Health costs of the individual elements of the energy systems............................................133 10.3 Total health costs ................................................................................................................135 11 Employment ...................................................................................................................................138 11.1 Calculation of types of cost and employment effect.............................................................138 11.2 Total employment effect ......................................................................................................139 11.3 Regional and local employment effects ...............................................................................141 12 Conclusion .....................................................................................................................................142 12.1 Main findings .......................................................................................................................142 12.2 The key technologies in IDA’s Energy Vision 2050 .............................................................143 12.3 Smart Energy System components in IDA 2050..................................................................145 12.4 Primary energy and biomass consumption in IDA 2050 ......................................................145 12.5 Socio-economic costs of IDA’s Energy Vision 2050 ............................................................147 13 References .....................................................................................................................................150 7 IDA’S ENERGY VISION 2050 8 IDA’S ENERGY VISION 2050 Introduction This report is the main report of IDA’s Energy Vision 2050 and is supplemented by a ‘Technical data and methods’ report outlining background data. The report is commissioned by IDA - The Danish Society of Engineers – and is prepared by researchers from The Sustainable Energy Planning Group at the Department of Development and Planning at Aalborg University. The project was carried out in the period from July to November 2015. The work on the report has been followed by IDA’s Expert monitoring group consisting of: Anders Dyrelund, IDA Energi Hans Jørgen Brodersen, IDA Teknologivurdering Kurt Emil Eriksen, IDA Byg Leif Amby, IDAs Erhvervs- og vækstudvalg Michael Søgaard Jørgensen, IDA Grøn Teknologi Martin Kyed, IDA Pernille Hagedorn-Rasmussen, IDA IDA’s Energy Vision 2050 provides a Smart Energy System strategy for a 100% renewable Denmark in 2050. The vision presented should not be regarded as the only option in 2050 but as one scenario out of several possibilities. With this vision, The Danish Society of Engineers, IDA, presents its third contribution to an energy strategy for Denmark. The IDA Energy Plan 2030 was prepared in 2006 and The IDA Climate Plan 2050 was prepared in 2009 [1,2]. IDA’s Energy Vision 2050 is developed for IDA by representatives from The Danish Society of Engineers and by a group of researchers at Aalborg University. It is based on state-of-the-art knowledge about how low-cost energy systems can be designed while also focusing on long-term resource efficiency. IDA’s Energy Vision 2050 has the ambition to focus on all parts of the energy system rather than single technologies, but in an approach integrating all sectors in the system. While Denmark is well on the way to having renewable based electricity and heating sectors, a number of challenges still exist within energy storage, transport and the integration of the energy sectors. By presenting a strategy for an energy system in 2050, IDA’s Energy Vision 2050 hopes to demonstrate the technical possibilities that are available and that can inspire short-term decision-making. On behalf of the authors Brian Vad Mathiesen, November 2015 9 IDA’S ENERGY VISION 2050 10 IDA’S ENERGY VISION 2050 Executive summary This is an executive summary of the report IDA’s Energy Vision 2050 - A smart energy system strategy for 100% renewable Denmark. The long-term governmental goal for Denmark in 2050 is to have an energy supply based on 100% renewable energy. The IDA Energy Vision 2050 is an input from the Danish Society of Engineers (IDA) in the important debate on how to implement this goal. The IDA Energy Vision 2050 shows that 1) a conversion to 100% renewable energy is a technical option within economic reach, 2) an integrated Smart Energy System design can create a more robust and resilient system, and 3) there is a potential for creating more jobs than in a fossil fuel based energy system as well as lower health related costs from emissions from the energy supply. The Smart Energy Systems concept IDA’s Energy Vision 2050 is based on the Smart Energy System concept, which is a cross-sectoral approach that makes use of synergies between the various energy sub-sectors by identifying suitable and cost-effective renewable energy solutions for the future. The two key forms of energy production are bioenergy and intermittent renewable energy such as wind and solar power. Bioenergy is a direct substitution for fossil fuels, since it has many similar characteristics and comes in different forms, but in a 100% renewable energy system, bioenergy is a scarce resource and the current fossil fuel consumption cannot be met with bioenergy. Intermittent renewable energy sources are more plentiful, but they pose a challenge due to the fluctuations in their production, which need to be accommodated. Therefore, accommodating large amounts of intermittent renewable energy and limiting the bioenergy resource to a sustainable level are two key features of the Smart Energy System concept. A smart energy system consists of new technologies and infrastructures which create new forms of flexibility, primarily in the ‘conversion’ stage of the energy system. In simple terms, this means combining the electricity, thermal, and transport sectors so that the flexibility across these different areas can compensate for the lack of flexibility from renewable resources such as wind and solar. The smart energy system is built around three grid infrastructures: Smart Electricity Grids to connect flexible electricity demands such as heat pumps and electric vehicles to the intermittent renewable resources such as wind and solar power. Smart Thermal Grids (District Heating and Cooling) to connect the electricity and heating sectors. This enables the utilisation of thermal storage for creating additional flexibility and the recycling of heat losses in the energy system. Smart Gas Grids to connect the electricity, heating, and transport sectors. This enables the utilisation of gas storage for creating additional flexibility. If the gas is refined to a liquid fuel, then liquid fuel storages can also be utilised. Based on these fundamental infrastructures, a Smart Energy System is defined as an approach in which smart Electricity, Thermal and Gas Grids are combined with storage technologies and coordinated to identify synergies between them in order to achieve an optimal solution for each individual sector as well as for the overall energy system. Figure 1 and Figure 2 illustrate the overall Smart Energy System structure for a 100% renewable energy system and different storage options together with investment costs of technologies. 11 IDA’S ENERGY VISION 2050 Figure 1. Smart Energy System structure. (EVs: Electric vehicles, Quad: production of four outputs) 100 100.000 90 80 10.000 1.000 60 50 100 40 Efficiency (%) Price (€/MWh) 70 30 20 10 10 1 0 Electricity Thermal Gas Price Efficiency Liquid fuel Figure 2. Investment costs and efficiency comparison for different energy storage technologies 12 IDA’S ENERGY VISION 2050 The IDA Energy Vision puts forward a scenario and a roadmap to implement the goal of a 100% renewable energy system in 2050, in the following called IDA 2050. In order to assess the economic and environmental consequences, this scenario has been compared to two scenarios published by the Danish Energy Agency (DEA). One, called the DEA fossil 2050 scenario representing a system like the present primarily based on fossil fuels, and another, called DEA Wind 2050 representing what one might call a consensus scenario of the current strategy of implementing the 2050 goals of 100% renewable energy. All scenarios are also described in a 2035 step with the outset of the current 2015 energy system. This vision builds on top of two previous energy strategies from IDA, namely the “IDA Energy Plan 2030” from 2006 and the “IDA Climate Plan 2050” from 2009. Both of these have already provided important inputs to Danish energy policy. 100% renewable energy is technically possible The IDA Energy Vision 2050 shows that a 100% renewable energy system is technically and physically possible for Denmark as well as economically feasible compared to the fossil fuel energy system. In Figure 3, the primary energy consumption in IDA 2035 and IDA 2050 is shown. In IDA 2050, the total primary energy supply is decreasing from the current level of approx. 200 TWh to 160 TWh in 2050. Figure 3 also shows the primary energy supply of the current energy system and the DEA scenarios. Primary Energy Supply (TWh/year) 250 200 150 100 50 0 DEA fossil 2015 DEA wind IDA DEA fossil 2035 DEA Wind IDA 2050 Coal Oil Gas Biomass/waste Onshore Offshore PV Wave/tidal Geothermal Solar thermal Figure 3: Primary Energy supply in 2035 and 2050 in the IDA Energy Vision, in 2015 and in the DEA scenarios In the future energy system, the backbone of the energy system is fluctuating renewable electricity such as onshore wind power, offshore wind power, photovoltaic and wave power. More than 60% of the primary energy supply is from fluctuating renewable electricity sources, requiring vast amounts of flexibility in the energy system as such and in the electricity grid. In the district heating grid, low temperature heat from renewable sources is also harvested from solar thermal and geothermal. Including individual solar thermal, a total of 8% of the primary energy supply is provided by fluctuating renewable energy used directly for the heating sector. 13 IDA’S ENERGY VISION 2050 Significant flexibility is implemented in the energy system between the production of renewable energy on one side and the demands for energy services on the other side. IDA’s Energy Vision exploits storages between production and end demands in order to balance resources and to provide a cost-effective system. Significant end demand savings are implemented in households, industry and businesses, while maintaining an economic growth. Electricity savings are implemented in all sectors, while significant heat savings are implemented in existing buildings combined with planned renovations and building improvement from now until 2050. New buildings and heat savings in existing buildings are done in a manner that emphasizes a balance between the costs of producing low temperature heat on one side and improving the building envelope on the other side. Within the industrial sector, knowledge about the end consumption characteristics has been used to save electricity and fuels. In IDA’s Energy Vision 2050, a significant part of the transport demand is covered by battery electric vehicles, plug-in hybrid vehicles, electric trams and trains as well as vans and busses using electricity. Meeting the transport demand for heavy-duty transport such as trucks, marine and aviation is a major challenge both in terms of costs and bioenergy resources needed. The demand is covered by electrofuels1. Investments in rails and charging stations for electric vehicles and other transport infrastructure are crucial for the assumed modal shifts and electrification. IDA’s Energy Vision 2050 assumes a transport demand growth that is differently distributed than the growth in the DEA scenarios. As illustrated in Figure 3, the DEA scenarios confirm that it is possible to convert to 100% renewable energy in 2050; however, the IDA Energy Vision has a lower biomass consumption based on the modelling assumptions used in this report regarding fuel prices and electricity exchange. In IDA 2050, it is possible to lower the biomass consumptions from the DEA Wind 2050 level of approximately 300 PJ to a level of 235 PJ. The replication of the DEA Wind 2050 scenarios shows a biomass consumption of 250-300 PJ and with fuel prices similar to the prices used by the DEA, the replication reaches a level around 250 PJ, equal to what is found in the DEA scenario report. A smart 100% renewable energy strategy can be feasible In the analyses of the costs of a transition to 100% renewable energy, the cost of each individual technology has been carefully assessed and implemented in the vision. Figure 4 illustrates the costs of IDA 2050 as well as the other energy systems. In the comparison of costs, the investments are annualised based on the technical lifetimes and an interest rate of 3%. The fuel cost levels correspond to the oil price of 105 $/barrel. This is an average price between the oil price level in June 2015 (62$/barrel) and the recommended level from December 2014 for long-term planning in 2035 (148$/barrel) by DEA. The total costs also include earnings on electricity exchange as well as operation and maintenance costs. An average price on the international electricity market of €77/MWh is used as a medium level out of a total of 10 price levels used. This level is the level recommended by DEA for analyses of the year 2035. The total costs give a comprehensive picture of the cost of the current Danish energy sector including transport as well as the future potential energy supply in IDA 2050, in 2015, in IDA 2035 and the DEA scenarios. The DEA scenarios have been recreated and the costs included here are based on the same principles as the costs included in the analyses of IDA 2035 and IDA 2050. 1 Electrofuels represent fuel production by combined use of electrolysers with carbon source. If the carbon sources are CO2 emissions, the term CO2-electrofuel is used; if the carbon source is from biomass gasification, the term bioelectrofuel is used. 14 IDA’S ENERGY VISION 2050 Socio‐economic costs (Billion €/year) 30 25 20 15 10 5 0 ‐5 DEA fossil 2015 DEA wind IDA DEA fossil 2035 Investments O&M DEA Wind IDA 2050 Fuels Electricity exchange CO₂ Figure 4: Socio‐economic costs of the energy systems analysed including transport. Net earnings on international electricity markets are illustrated as a negative and should be subtracted to get the total costs of the systems While the future IDA 2050 energy system is slightly more expensive than the current 2015 energy system, it should be noted that this system, like DEA Wind 2050, covers a significantly larger demand in regard to heat square meters, transport demand and industry. IDA 2050 has lower costs than the proposal for a 100% renewable energy system in DEA Wind 2050. Sensitivity analyses have demonstrated that this conclusion is robust. The major differences in the costs are related to vehicle costs and can be explained by lower growth rates in road transport demands as a result of modal shifts to rail and biking/walking. Furthermore, the heat saving costs are lower due to a better strategy in heat savings in new and existing buildings as well as lower cooling costs due to a higher share of district cooling in comparison to individual cooling investments in the DEA scenarios. Finally, the fuel costs are lower in the IDA scenarios because of reduced biomass demand. The fossil fuel based DEA Fossil 2050 has slightly higher costs than IDA 2050 and slightly lower costs than DEA Wind 2050. The major advantage of IDA 2050 is that it is able to exploit the synergies in the different grids in the energy and transport system, while DEA Wind 2050 to a lower extent does this. In IDA 2035, the cost difference is less predominant, however, it should be noted that the costs for fuel are significantly lower and that the earnings on the international electricity markets are higher than in the DEA 2035 scenarios. Going towards 100% renewable energy significantly changes the cost structure of the energy supply. In the future, much more costs are allocated to investments and much fewer to fuels. This is illustrated in both IDA 2050 and DEA 2050; however, IDA 2050 is a more fuel-efficient system and hence fewer costs are allocated to fuels in this case. The IDA Energy Vision and the DEA scenarios have been aligned to the degree possible regarding technological development, fuel prices and investment costs. The key technological specifications that have been altered include the type of electrolysers installed, renewable energy capacity factors and 15 IDA’S ENERGY VISION 2050 efficiencies for power plants and CHP plants. The impact of these alterations are analysed in further details in the report. Additional analyses have been performed investigating the impact of increasing the interest rate from 3% to 4%. The results show that all scenarios would have higher total socio-economic costs with the greatest in-crease around 7-8% in the DEA 2050 wind and the IDA 2050 scenarios compared to 4% in the 2015 reference. However, these higher costs do not change the relations between the scenario costs. A robust and resilient strategy for renewables in an international context Trade with fuels for electricity, heating and transport, as well as electricity exchange on the Nord Pool spot market are important parts of the current energy supply system. In the future, the characteristics of both the energy supply system and the consumer side will change; however, international cooperation is also important in a future renewable energy context. 5 5 0 0 ‐5 ‐5 ‐10 ‐10 ‐15 ‐15 ‐20 ‐20 2015 DEA Fossil Electricity Export (TWh/year) Net export (TWh/year) DEA Wind IDA DEA Fossil DEA Wind IDA Net electricity exchange earnings (Billion €/year) Electricity Exchange (TWh/year) Current electricity markets, both the Nordic electricity market, Nord Pool Spot, and the central European/German electricity market, EPEX, are set up based on the marginal price setting principle. With this settlement principle, a participant’s profit depends on a more expensive unit also winning. In markets based on marginal price setting, participants submit bids equal to or close to the short-term marginal cost of participation, assuming that no one in the market is exercising market power. As such, the participants’ bidding strategy normally results in units with the lowest short-term marginal costs being employed first; the market is therefore known for keeping total system costs low, even though this does not necessarily cover the long-term costs of the participants who own the power plants or wind turbines in the market. Electricity Import (TWh/year) Net electricity exchange earnings (Billion €/year) Figure 5: Electricity exchange and earnings on electricity import and export assuming three levels of fuel price assumptions for 2015 as well as the IDA and DEA scenarios In Figure 5, the electricity exchange and earnings on electricity imports and export are illustrated. While the net earnings of IDA 2035 and 2050 are similar to those of the fossil DEA scenarios, the earnings in DEA Wind are lower. This is due to higher wind and PV capacities in IDA, flexibility on the consumption side in IDA, and 16 IDA’S ENERGY VISION 2050 higher efficiencies on the power plants and Combined Heat and Power (CHP) plants in IDA. The conclusion that the IDA scenarios have the ability to generate earnings on international electricity markets does not change significantly with ten other electricity price assumptions. As illustrated in Figure 6, investments become extremely important in the future and while electricity exchange is important, the overall design of the entire energy system including thermal and gas grids is more important if a cost-effective system is needed. While investments are long term and will stabilize the overall costs, the costs of biomass and the ability to import and export electricity are important in the short term with the facilities installed. In the past, fuel prices have fluctuated significantly. The IDA Energy Vision has been analysed using three different fuel price assumptions as well as 10 different assumptions regarding future international electricity market prices for each of the scenarios. This has been done in order to analyse the ability of the energy system to make net earnings on import and export between Denmark and the surrounding countries, while also being subject to changing biomass prices. Socio‐economic costs (Billion €/year) 30 25 20 15 10 5 0 ‐5 Medium 2015 Low Medium High Low DEA 2050 Fossil Investments Medium High Low DEA 2050 Wind O&M Fuels Electricity exchange Medium High IDA 2050 CO₂ Figure 6: Socio‐economic costs of the energy systems analysed including transport for the three different fuel price levels (oil prices equivalent to 62, 105 and 148 $/barrel and 77 €/MWh on the international electricity markets). Net earnings on international electricity markets are illustrated as a negative and should be subtracted to get the total costs of the systems In Figure 7, the overall socio-economic costs of all three fuel price levels are illustrated. A change in fuel costs changes 1) the costs for using fuel domestically and 2) the ability to have an income from international electricity markets. While the costs do vary, the results show that IDA 2050 and IDA 2035 have lower costs than the DEA scenarios as previously described. With low fuel costs, the net earnings on electricity markets increase and the opposite is the case with high fuel costs. Again this confirms that a fuel-efficient energy system design increases the robustness and resilience overall in the fact that the IDA scenarios are better at exploiting all situations. An important effect of different 100% renewable energy system designs is seen in the consumption of biomass. In the DEA Wind 2050 scenario, the biomass costs vary €300 million with the three fuel cost levels, from a total low level of €1,800 million. In IDA 2050, however, the costs vary €350 million from a low level of €1,400 million. One issue is the cost variation and the cost level; another is the effect on the biomass consumption in 17 IDA’S ENERGY VISION 2050 200 200 180 180 160 160 140 140 120 120 100 100 80 80 60 60 40 40 20 20 0 0 ‐20 Electricity Exchange (TWh/year) Primary Energy Supply (TWh/year) PJ. This difference reflects a span of using 367, 306 or 256 PJ of biomass with low, medium and high fuel price level assumptions in the DEA 2050 scenario. In IDA 2050, this span is 270, 234 and 180 PJ. Behind these results are naturally many system dynamics between power plant boilers and CHP. However, not only is it possible to create a more cost-effective scenario with overall lower fuel costs and higher earnings on international electricity markets. It is also possible to create a system which is more robust and resilient in a world where biomass resources may be expensive or scarce due to over exploitation. In Figure 23, the resulting primary fuel consumption is illustrated. ‐20 Low Medium High Low DEA 2050 Wind Medium High IDA 2050 Coal Oil Gas Biomass/waste Onshore Offshore PV Wave/tidal Geothermal Solar thermal Electricity Import Electricity Export Figure 7: Resulting primary fuel production assuming three different fuel price levels (oil prices equivalent to low: 62, medium: 105 and high: 148 $/barrel and 77 €/MWh on the international electricity markets) In the future energy system, it is uncertain whether this market principle of bidding using short-term marginal prices will be sufficient to ensure cost-effective electricity system investments. The reason is that wind power and photovoltaic have very low short-term marginal costs and will by far be the dominant technologies. This will bring down prices, and with very little price elasticity on the consumption side, this will make the short-term prices very low or negative. In the future, this will mean that 1) capacities with high costs and low operation time will not be able to cover the long-term investments costs, which was the assumption in the marginal price setting principle; and 2) unless feed-in-tariffs are regarded as investment markets and kept at a certain level, new technologies will not be installed, even though, e.g., onshore wind is now the lowest cost electricity producing unit. Currently, early warnings of this problem are present in Europe, the Nordic power market and Denmark with closing power plants and low earnings for power plant and wind turbine owners. This dilemma will increase in the coming years as Northern Europe as such is expanding the level of renewable energy resources. As is shown in Figure 8, the wind power capacity is expected to increase substantially in Sweden, Northern Germany and Norway from 2014 to 2020. Towards 2050, the expansion of wind power and photovoltaic will be significant and will challenge the current market construction. 18 IDA’S ENERGY VISION 2050 Figure 8: Installed wind power capacity in Denmark, Northern Germany, Norway and Sweden in 2014 (blue) and 2020 (green). Adopted from Energinet.dk The IDA 2050 scenarios are, to a further extent than the DEA 2050 scenario, able to cope with a situation where Denmark is not able to export (physically or with low costs as a result).The electricity exchange between the Danish energy system and external markets is subject to both import and export risks. The import risks exist in two forms; firstly, that there might be a lack of power plant capacity to produce electricity outside Denmark due to the current trend of declining capacities in Northern Europe. This means that situations might arise where it is not possible physically for Denmark to import due to insufficient power plant capacity in periods with low wind power production in Denmark. Secondly, in these periods with low wind power production, the electricity prices might become too high due to the increased demand across countries. Low wind power production is likely to also occur outside Denmark and power plant capacities will be needed outside Denmark as well. Export risks exist as the weather patterns are rather similar between neighbouring countries, which means that there will be an excess of wind power and PV power production in these countries in the same periods. Firstly congestion in transmission lines is likely to occur making it physically impossible to export even with higher transmission line capacities than today. Secondly if transmission capacity is available, the high wind power production occurs at the same time in the northern European area and hence this will lead to a decreasing or even negative electricity price. These four electricity exchange risks are worth considering when planning for a future energy system. The IDA 2050 scenario represents an energy system design with electricity trade between sectors as a the main strategy to increase the cost-effectiveness using the smart energy system approach; i.e., that electricity can cost-effectively be used in heating and transport while also being traded on international electricity markets when good opportunities occur. The DEA 2050 scenario to a larger extent represents an energy system which assumes that the integration of wind power mainly can be done in international electricity markets, i.e., that wind is not congesting transmission lines from the surrounding countries. 19 IDA’S ENERGY VISION 2050 International electricity exchange analysis shows that in a situation where the electricity export is restricted due to congestion from wind power in Northern Europe in general, the IDA 2050 scenario can even have a lower biomass consumption compared to a non-restricted situation. This is due to the fact that the energy system design is done using synergies combining several sectors. Here, biomass can be replaced by wind power and photovoltaic in more corners of the energy system. This is not the case in the DEA 2050 scenario, where the biomass consumption remains rather high compared to IDA 2050. International electricity exchange alone is not the best solution, when the Northern European regions go in the same direction as Denmark. Incentives for more technologies to behave flexibly in the energy system are important. Interactions between electricity and heating, gas and transport are needed in the future and these cannot alone be supported by a marginal electricity price market. A strategy in which each country increases renewables by exporting renewable electricity is a high-risk strategy for Denmark and countries in Europe as a whole in the long term. The Smart Energy System approach provides cost-effective synergies with the exchange of energy between sectors, while using cheap storages across smart electricity, smart thermal and smart gas grids. IDA’s Energy Vision 2050 provides such a strategy for Denmark. A strategy moving from a single sector to an integrated approach would also be a more robust strategy for Europe. Contents of the IDA scenario This section summarizes and describes the main characteristics that were included in the IDA Energy Vision 2050 for the IDA 2035 and IDA 2050 scenarios. More information can be found in the report. Heat savings It is essential for the future smart energy system to reduce the heat demand substantially for buildings. However, there has to be a balance between heat savings and heat production. At a certain level, it becomes too expensive to save energy in comparison to producing energy. IDA’s Energy Vision therefore tries to identify the point to which heat demand in buildings should be reduced. As a result, the heat demand for existing buildings should be approximately 80 kWh/m2 in 2050. This is a reduction of 40 % compared to today’s demand. If Denmark achieves substantially less or substantially more savings in the existing building stock, the total cost of the energy system will increase, either due to more production units or due to saving measures with higher costs. To achieve cost-effective savings, the building renovation and improvement in energy performance have to be coordinated. It will be too expensive to refurbish the same building twice before 2050. Hence this level costs reflects that building owners reduce heat demands at the same time as they refurbish their building anyway. If this is not the case, the costs will be too high to achieve a 40 % reduction. For new buildings IDA’s Energy Vision suggests a heat demand of approximately 55 kWh/m2 from now and until 2050. This demand only reflects the heat demand in the building, and not production units such as photo voltaics on the building that can reduce the total demand pr. m2 of the building as such. The goal of IDA’s Energy Vision is to have a focus on the actual heat performance of new buildings, and not as the Danish 2020 Building Code where production units such as photovoltaics can compensate for a lack of heat performance in a building. IDA’s Energy Vision suggests an ambitious target for both heat demand reduction in new buildings and e.g. photo voltaics, solar thermal and other renewable energy production units. Electricity savings in households In the IDA 2050 scenario, electricity savings in households have been carried out in order to reduce end demands and stay within biomass potentials. Three different factors affect the future electricity demand; firstly, 20 IDA’S ENERGY VISION 2050 the increase in equipment that will lead to higher demands which is particularly the case for Information and Communication Technologies (ICT); secondly, the technical savings that are possible to implement, and thirdly, the savings that can be carried out due to behavioural changes. In IDA’s Energy Vision, it has been estimated that a future increase in equipment of 4% in 2035 and 10% in 2050 will take place, thus increasing the electricity demand. On the other hand, technical savings in electricity demands of 6% in 2035 and 15% in 2050 are implemented, primarily due to an enhanced regulation and technology development. Additionally, also including emphasis on behavioural aspects can introduce savings in electricity demands. In IDA, savings of 8% in 2035 and 20% in 2050, respectively, have been assessed as possible. This leads to an overall reduction in the electricity demands of 10% in 2035 and 25% in 2050 for the IDA Energy Vision compared to the 2015 reference. Principle transformation hierarchy for the Industrial energy demand In the IDA Energy Vision, the industry and service sectors including agriculture and construction are assumed to have the same growth as in the DEA fossil fuel and wind scenarios, i.e., approx. 40% from 2015 to 2050. This means that the same demands are met. The IDA Energy Vision introduces a principle hierarchy giving priority to first savings, then smart energy coordination with district heating and cooling as well as electricity via heat pumps, and finally, the replacement of fossil fuels with electricity, heavy biomass and lastly high quality biogas upgraded with hydrogen (methanated biogas). 1. Priority is given to savings 2. Priority is given to district heating and cooling including the utilisation of waste heat from processes either internally or for district heating 3. Priority is given to heat pumps for remaining space heat demands 4. Priority is given to replacing fossil fuels with electricity 5. Priority is given to replacing fossil fuels with heavy biomass 6. Priority is given to replacing fossil fuels with green gas (methanated biogas) The hierarchy is defined out of the wish to transform industry and service into a part of a future renewable system in which the energy consumption and the costs of the total energy system are minimized as much as possible. The IDA Energy Vision assumes the same savings as in the DEA Fossil and Wind scenarios, since these savings are closely linked to the assumptions on growth. The main difference here is the focus on using energy efficient technologies, which means that the IDA Energy Vision includes more district heating and cooling and utilises more low-temperature industrial waste heat as well as more electricity and less biomass. An energy demand of 193 PJ in 2015 with a high share of fossil fuels is transformed into an energy demand of 189 PJ with no fossil fuels and with contributions from district heating and cooling as well as the conversion to electricity consumption and gas. District Heating Expansions The district heating supply in the IDA Energy Vision is assumed to be expanded to 66% of the total heat demand based on analyses in Heat Plan Denmark from 2008 and the IDA Climate Plan 2050 in 2009. The total district heating demand is assumed to increase from 22.8 TWh in 2015, corresponding to a share of 53%, to 30.5 TWh in 2035 and 28.2 TWh in 2050 achieving the assumed 66%. This is taking into account expansions of district heating coverage, conversion of industry, and general heat savings in buildings. The expansions of the district heating systems will generate a number of benefits to the district heating production. Expansions in district heating will enable better integration of excess heat production from various 21 IDA’S ENERGY VISION 2050 processes including industrial excess heat, excess heat from biogas or electrofuel production and waste incineration. It will also improve the integration of the energy sectors as an increased number of consumers and demand will increase the flexibility of the total system and thereby increase the potential for integrating wind power through large heat pumps and combined heating, cooling and power. In Denmark, currently heat is supplied by mainly CHP plants and fuel boilers. In the future, there will be many new forms of heat supplies available. These include wind power, which can be used for heat production with large-scale heat pumps, solar thermal, deep geothermal and surplus heat from industry. It is possible to extract more heat from these resources if their delivery temperature is lower. Thus, reducing the temperature in the district heating network will allow the utilisation of more renewable heat. Furthermore, if the temperature in the pipes is lower, then the amount of heat lost in the pipe is also reduced and more of the heat produced reaches the consumer. In the future, district heating distribution temperatures should be reduced from today’s level of 80-100 °C to approximately 50-60 °C. District cooling Currently air conditioning units using electricity meet the majority of the cooling demand in Denmark. However, there is a large potential in supplying some of the space cooling demand as district cooling. District cooling incorporates some of the same advantages as district heating. The peak production demand is reduced by the fact that several consumers with different consumption profiles are connected; it is possible to incorporate large-scale storage and it is possible to include a mix of sources for the cooling production. The production of cooling in a district cooling system depends on local conditions. District cooling can be produced from a mix of sources such as groundwater cooling, free cooling from ambient sources and heat pumps. It is possible to utilise the heat produced on heat pumps at the same time as the cooling and thereby optimize the system performance. In the IDA 2050 Vision, 40% of the cooling demand is met by district cooling and it is assumed that 75% of the district cooling is produced in a combined production with heating. Electrification of transport and electrofuels In the IDA Energy Vision, the same assumptions for vehicle efficiency improvements apply as in the DEA Fossil and Wind scenarios, divided into different modes of transport. In the IDA Energy Vision, differently distributed growth rates in transport demands and modal shifts shape new transport demands for 2035 and 2050. First priority is given to the electrification of the transport sector. The rest of the transport demand not suitable for electrification was met by electrofuels: bioelectrofuels and CO2 electrofuels. The end fuels assumed to be used both in the 2035 and 2050 scenarios are dimethyl ether (DME) or methanol distributed evenly in the power trains running on liquid fuels. The direct and battery electrification is of high priority and large shares of cars, vans and rail are electrified. Total transport fuel demand is 133 PJ in 2050, of which 100 PJ are liquid electrofuels and 33 PJ of electricity is used for the electrification of transport. Half of the electrofuel demand is supplied by bio-based electrofuels, resulting in 47 PJ of biomass needed for fuel production, which is aligned with the biomass potential available for transport in Denmark. In order to achieve these levels, a reduction of transport demand growth, a high share of public transport, and a modal shift of road transport to rail were implemented, including the costs of such changes. The passenger transport demand was distributed so that 45% of the transport demand was met by vehicles, 29% by public transport, 5% were bikes and walking and 21% was aviation. The highest share of freight transport demand was met by marine at 82% followed by trucks at 13%, and vans and rail at only 1.3%. In the 2050 scenario, battery electric vehicles meet 75% of the private car transport demand and the rest is met by electrofuels used in 10% of plug-in hybrid vehicles, 5% of hybrids and 10% of ICEs. Electric busses 22 IDA’S ENERGY VISION 2050 meet 15% of the transport demand while an even mix of bioelectrofuel and CO2 electrofuels supplements the remaining 85% of internal combustion engines (ICEs). The rail is completely electrified, and both aviation and marine transport are met by an even mix of electrofuels. For freight transport, 35% of the vans are battery electric vehicles and the remaining 65% is met by ICE, ICE hybrids and ICE plug-in hybrids powered by an even mix of electrofuels. The trucks covering only national demands were assumed to be 75% ICE, 20% of ICE hybrid and 5% of fuel-cell hybrid running on electrofuels. The same assumptions apply for aviation and marine as for passenger transport. The power-to-gas and power-to-liquid are of great importance to the smart energy system concept. By using electrolysers as a mediator for electricity storage by converting the intermittent electricity from renewable sources to the gases or liquids that can be used in energy sectors or stored in different storage technologies, we establish the interconnection between electricity, gas and transport sectors. These technologies therefore offer a solution for meeting different fuel demands while providing flexibility to the system. In this way, we compensate for the lost flexibility on the resource side by providing flexibility in the conversion processes. As the fuel production facilities produce excess heat, this is another important factor for the integration of fuel production and heating sector in the future. The transformation of the transport sector into renewable energy is possible with affordable costs with a focus on maximizing the electrification of transport, minimizing the biomass share for transport, and reducing the transport demand by using more efficient technologies and lower growth. Wind, PV and Wave power The three main renewable electricity resources available in Denmark are onshore and offshore wind and solar PV. The potential of onshore wind is estimated at between 9-35 TWh, whereas the offshore wind potential is estimated at between 16-330 TWh. The solar PV potential is estimated at between 5-29 TWh. In addition, wave power is assumed to have a minor role of 300 MW installed capacity. The electricity production from each renewable resource is listed in Table 1. Table 1: Electricity production from renewable fluctuating resources in the 2015 reference and the 2035 and 2050 DEA and IDA scenarios Electricity production (TWh) 2015 2035 2050 DEA IDA DEA IDA Offshore wind 4.4 21 26 58 64 Onshore wind 7.2 11 13 11 16 Solar PV 0.6 0.9 3.8 2 6.4 In 2050, in the IDA scenario, the total installed capacity for onshore wind, offshore wind, solar PV and wave power are 5,000 MW, 14,000 MW, 5,000 MW and 300 MW, respectively. In order to achieve electricity production from these technologies, the installation of the new renewable electricity infrastructure would occur at different rates depending on the technology and the time period. PV would need to reach a level of approx. 150 MW per year. For onshore, the level would be 150-200 MW per year and for offshore wind power, 450500 MW per year. This is a significant challenge, however, it should be kept in mind that these technologies replace imported fuels and are able to meet major parts of the demands in not only the heating and cooling sectors, but also the transport sector. 23 IDA’S ENERGY VISION 2050 Sustainable Biomass and Waste Management Additional to renewable sources such as wind, solar and geothermal, the IDA Energy Vision also uses biomass. However, the use of biomass, i.e., straws, wood, crops, biogas, etc., will influence greenhouse gas emissions depending on the nature of the biomass resource, how it is utilised and if, e.g., new trees are planted or not. Consequently, one should make an effort to secure that biomass is used in a sustainable way. The IDA Energy Vision 2050 does this in two ways: ‐ ‐ First, the amount of biomass is reduced by utilising storages and integrating sectors allowing other resources into the energy system. Secondly, the type of biomass is limited to residual resources such as straw, wood waste from forest industry and biogas (manure and organic waste) and minor changes in agriculture towards energy crops with negligible or minor effect on food production. The IDA Energy Vision does not entail any restriction to use domestic bioenergy. Certification systems or similar schemes are out of the scope of the analysis here. The aim is to design systems which are able to function fuel-efficiently and cost-effectively in a context where the availability of bioenergy is uncertain regarding costs. IDA 2050 uses between 180-270 PJ/year, depending on the international electricity market conditions. This is in line with the level of the Danish share of the available world resources and the Danish residual resources. Using the same assumptions as in the IDA scenarios, the DEA 2050 scenarios use 256 to 367 PJ. When applying the high fuel prices as used in the DEA scenario report, the biomass consumption is around 250 PJ. This shows that with similar fuel prices the biomass consumption of 250 PJ reported in the DEA scenario report are similar to the replication with high fuel prices in this report. The biomass consumption in different situations is shown in Table 2. Table 2: Bioenergy demands using different biomass price assumptions DEA Wind 2050 IDA 2050 Fuel price level low medium high Low medium high Biomass demands (PJ) 367 306 256 270 234 180 Several studies have shown the potential biomass resources in Denmark. Most focus on residual resources, other focus on also using algae and/or energy crops. In Figure 9, the studies in Denmark on biomass potential in the last ten years are listed. From these studies, it is evident that the biomass resources available are closer to 150 PJ than 250 PJ when not including energy crops and/or algae potentials. Advances in the design of energy systems have made it possible to reduce the demands for biomass; however, the challenge regarding biomass is not only the amount but also the types of biomass available. 24 IDA’S ENERGY VISION 2050 450 400 350 300 PJ 250 200 150 100 50 0 Excluding energy crops + algae Excluding algae Including all biomass resources (2006) Danish Energy Agency (2006) IDA Energy Plan 2030 (2009) IDA Climate Plan 2050 (2011) CEESA 2050 (2012) Grøn energi (2012) + 10 Mio Tons Planen (2012) Biomass futures: atlas (2014) Wenzel Carbon Footprint Figure 9: Biomass potentials according to studies in the last 10 years The biomass demand for each technology (i.e. boilers) is met by different biomass types, for example wood, straw, energy crops and biogas. By comparing the biomass demand of the different technologies with the biomass potential from different resources, it is evident that there is sufficient potential to meet the demand of the technologies. In addition, it is evident for some scenarios that the combined biomass demand of all the technologies is close to the extreme upper limit of the biomass potential. The biomass consumption in the two main 2050 scenarios is illustrated in Figure 10. 350 Waste incineration 300 Biogas, manure 250 200 100 Wood, energy crops (gasified for Transport) PJ 150 Straw, wood & energy crops (Solid for boilers, industry etc.) 50 Wood, energy crops (gasified for CHP) 0 DEA 2050 IDA 2050 Figure 10: Biomass demands distributed on types in DEA Wind 2050 and IDA 2050 25 IDA’S ENERGY VISION 2050 The IDA Energy Vision 2050 gives priority to waste management and recycling of waste. Only waste which is not recycled is used for energy purposes. Out of this fraction, priority is given to gas and liquid fuel production either as part of biogas and if possible thermal biomass gasification or as bio-oil production of organic waste. Remaining parts will be used in waste incineration together with similar fractions of biomass, which neither can be transformed into gas nor liquid fuel. These incineration plants are used for flexible combined heat, power and steam production, in which steam is used for geothermal heat or biomass conversion. As a consequence, the IDA Energy Vision uses 26 PJ/year in waste incineration which is less waste than in the two DEA strategies Fossil and Wind (44 and 41 PJ/year, respectively). Flexible consumption and production technologies In order to be able to integrate the increasing levels of fluctuating renewable resources, a high degree of flexibility is implemented in the IDA scenarios by introducing certain consumption and production technologies. On the production side, fast regulating CHP and power plants are installed based on gas consumption in order to ensure a high regulating ability. The thermal capacities installed are rather similar in the DEA and IDA scenarios with the exception of a slightly higher capacity in the IDA scenarios. In the IDA scenarios, the overall capacities are around 6000 MW, compared to 5500 MW in the 2050 DEA scenarios similar to a difference of around 10%. The installed production capacities are illustrated in Figure 11. Electricity production capacities (MW) 35,000 30,000 25,000 20,000 15,000 10,000 5,000 0 DEA fossil 2015 Onshore Offshore DEA wind IDA DEA fossil 2035 PV River/wave DEA Wind IDA 2050 Industry and waste CHP and Power plants Figure 11: Electricity production capacities for the 2015 reference, the 2035 and the 2050 DEA and IDA scenarios Some of the electricity capacity is only used in few hours throughout the year, which can be seen in Figure 12. The vast majority of the electricity production (around 80%) in both the DEA and IDA 2050 scenarios is produced by renewable electricity resources, while the thermal plants are used in case of low wind or solar production. 26 IDA’S ENERGY VISION 2050 Electricity Production (TWh/year) 120 100 80 60 40 20 0 DEA fossil 2015 Onshore DEA wind IDA DEA fossil DEA Wind 2035 Offshore PV River/wave IDA 2050 Industry and waste CHP Power plant Figure 12: Electricity production for the 2015 reference, the 2035 and the 2050 DEA and IDA scenarios On the consumption side, some key technologies are also installed in order to ensure flexibility in the system. The consumption capacities can be seen in Figure 13. Electricity consumption capacities (MW) 30,000 25,000 20,000 15,000 10,000 5,000 0 DEA fossil 2015 DEA wind IDA DEA fossil DEA Wind 2035 IDA 2050 Conventional demand Cooling demand Flexible demand+dump electricity Smart transport Heat pumps Electrolysers Electric boiler Figure 13: Electricity consumption capacities for the 2015 reference, the 2035 and the 2050 DEA and IDA scenarios 27 IDA’S ENERGY VISION 2050 It is clear that there is a large difference in terms of electricity production capacity between the fossil scenarios and the DEA and IDA scenarios. Especially in 2050, heat pumps and electrolysers enhance the flexibility in the system, since these technologies can act as conversion technologies connecting the different energy sectors such as electricity with the heating, transport and gas sectors. The conversion of electricity into heating or gas has several benefits. Firstly, the increased electricity consumption replaces demands in other sectors that would otherwise have been supplied by biomass or fossil resources. Secondly, the conversion from electricity to a different energy carrier allows for less expensive storage options in the heating and gas networks. Thirdly, electricity consumption can ensure a more efficient use of energy resources through the use of heat pumps instead of boilers and electric vehicles in the transport sector. It is therefore essential that these technologies are installed to ensure sufficient flexibility in the system and allow for a conversion to 100% renewable resources. Electricity, heat, cooling and transport fuel demands (TWh/year) The greater reliance on electricity in the future renewable systems are visible in Figure 14. Here, it can be seen that the heat demands are rather similar to today as the expected growth is outweighed by the heat savings implemented. The cooling demands are unchanged in the scenarios while the transport fuels are lower in the 2050 scenarios compared to the 2015 reference. This should not be seen as an overall reduction in transport demand, but rather as an indication of the increased efficiency in the transport sector due to the significant electrification of transportation in all the 2050 scenarios. Finally, the electricity demand is three times higher in the IDA 2050 scenario than in the 2015 reference, despite of end demand savings for households, but the electricity growth occurs due to the increased electrification of the heating, transport and industrial sectors. In the IDA 2035 and 2050 scenarios, more flexible and efficient technologies are implemented, which enhances the system efficiency and this results in a decreasing primary energy demand even with the significant increase in electricity. 120 100 80 60 40 20 0 DEA fossil 2015 Heat demands DEA wind IDA DEA fossil 2035 Electricity demands Transport fuel demand DEA Wind IDA 2050 Cooling demand for buildings Figure 14: Energy system demands for heating, electricity, cooling and transport fuels, excluding losses in the conversion processes, transmission and distribution. Notice that some demands for e.g. heating using heat pumps might be counted twice as part of both the heating demand and the electricity demand 28 IDA’S ENERGY VISION 2050 Health costs Total health costs can be calculated based on the data on health costs originating from emissions from the various types of technology, fuel, and location of point sources. Costs are identified by counting the work days lost, hospital admissions, damage to health, deaths, etc. The health costs included are exclusively based on the six emissions and do not include the environmental cost of damage to nature and animal life or the cost of mining for fuels and materials overseas, e.g., from a coal mine in South Africa. Thus, the estimate is rather conservative. In IDA 2035, health costs are reduced due to energy savings as they lower the consumption of coal in electricity production compared to DEA Fossil 2035. Similarly, the conversion to district heating, geothermal heat pumps, and solar thermal means that there is a reduction in the cost of emissions from the burning of wood in individual households. These trends continue up to IDA 2050 in which there are further conversions to biomass and more renewable energy is introduced into the electricity system, which replaces solid fuels. In addition, health costs originating from the transport sector are further reduced in IDA as the reliance on biomass is reduced. In IDA 2050, the total health costs are reduced to approximately €0.6 billion. Thus, if the initiatives in IDA’s Energy Vision are implemented, there will be savings of approximately €0.9 billion in 2050, compared with DEA Fossil 2050 and about €0.1 billion in 2050, when compared with DEA Wind 2050. As the total costs are based on current emission factors, it must be emphasized that this type of estimate only gives an indication of the total socio-economic costs. Employment effects The potential employment effects from IDA Energy Vision have been investigated and estimated on the basis of the energy system analyses. Even in the case that the different scenarios do not vary much in total system costs, the difference in cost structures may have a significant effect on domestic labour demand. Compared to the fossil scenarios, both IDA Energy Vision and the DEA Wind scenarios contribute to higher levels of domestic turnover. This higher level of domestic demand can be expected to create additional employment in the Danish economy. In general, the renewable scenarios reallocate funds from fuel related costs into investments and expenses for operation and maintenance activities. Funds allocated for investments in production units, infrastructure, energy savings, etc., typically imply lower import shares compared to the handling of fossil fuels. Therefore, more domestic employment can be created for the same costs. The job effect in 2050 is the same for DEA Wind 2050 and IDA 2050, due to similar investment levels and cost structures. The analysis suggests that both scenarios contribute with 50,000 jobs/year compared to the fossil alternative in 2050. The calculations indicate that the yearly job effect in 2035 is 30,000 jobs/year higher for IDA 2035 compared to DEA Fossil 2035. The DEA Wind 2035 scenario contributes with approximately 15,000 jobs/year additionally compared to DEA Fossil 2035. The higher job effect in IDA 2035 compared to DEA Wind 2035 is due to the fact that IDA’s Energy Vision has a higher share of investment at this point in time, while the DEA wind scenario allocates more capital to the use of fossil fuels. The conducted employment analysis thus concludes that 1) investing in a renewable energy system creates more employment and 2) the earlier these investment are made, the earlier the positive employment effect appear. The line of thought behind this employment analysis is based on a demand side approach to employment. As such, labour supply is implicitly assumed available. Any shortage in labour supply 35 years ahead must be considered unknown today. If full employment should be permanently present in the Danish economy for the next 35 years - which in a historical perspective must be considered unlikely – a higher net import of labour 29 IDA’S ENERGY VISION 2050 would be necessary in the renewable scenarios compared to the fossil scenarios. In such a 'worst case' situation where domestic labour supply is not available, a renewable energy system will merely have to import labour instead of importing fuels as it is done in the fossil alternative. For the fossil alternative, however, a worst case situation of high unemployment would be further worsened by the outflow of capital for fuel import. In that respect, the renewable scenarios carry a lower economic risk - and greater opportunities. 30 IDA’S ENERGY VISION 2050 Abbreviations 4DH 4GDH BTL CEESA 4th Generation District Heating Centre 4th Generation District Heating Biomass-To-Liquid Coherent Energy and Environmental Systems Analysis CHP Combined Heat and Power COP Coefficient of Performance DCE Danish Centre for Environment and Energy DEA Danish Energy Agency DH District Heating DHC District Heating and Cooling EPEX European Power Exchange HP Heat Pump ICT Information and Communications Technologies IDA Danish Society of Engineers IEA International Energy Agency NZEB O&M PES Net Zero Energy Buildings Operation and Maintenance Primary Energy Supply PP Power Plant PV Photovoltaics RES Renewable Energy Sources SOEC Solid Oxide Electrolyser Cell SNG Synthetic Natural Gas WEC World Energy Council 31 IDA’S ENERGY VISION 2050 32 IDA’S ENERGY VISION 2050 1 The design of 100% renewable energy systems This chapter describes the history of energy in Denmark along with a number of research projects that form the basis for the IDA Energy Vision 2050. Furthermore, the Smart Energy Concept which the IDA Energy Vision is based on is described and presented. 1.1 History of Energy in Denmark Denmark has for decades actively been working on transforming its national energy system from a relatively simple system exploiting fossil energy resources that can be utilised as per need to a system that to a large extent exploits renewable energy sources with availability beyond human control and a system exploiting the synergies between its different parts. The transition may be described in a number of phases. In the first phase, the energy system started to exploit renewable energy sources and establish efficient cogeneration of heat and power (CHP) combined with district heating. The onset of this phase coincided with the first oil crisis in 1973, and was characterised as an introductory phase in which technologies were developed and applied. However, the penetration was modest with the effect that the general energy systems infrastructure would not have to adapt to the fluctuating nature of the renewable energy sources available in Denmark. In the second phase, happening today, renewable energy technologies play a larger role causing and calling for changes in the overall energy system to adapt to the significant fluctuations. At the same time, the traditional power producers are threatened by the growing share. In Denmark, small-scale as well as large-scale power plants are affected by renewable power production which reduces spot market prices to the extent that small–scale CHP plants seek to shift heat production to biomass boilers of solar collectors and owners of large-scale plants seek to sell these. Wind power reached a significant 50% penetration in Western Denmark in 2015, however, at the same time, wind power production exceeded demands by almost 1000 hours in 2014 as shown in Figure 15. Figure 15: Annual hours of wind power production above 100% of demand 33 IDA’S ENERGY VISION 2050 The long-term governmental goal for Denmark is to have an energy supply based on 100% renewable energy in 2050. Thus, in order to increase the renewable energy penetration even further, the third and final phase entails a focus on flexibility and integration between the electricity, heating and transport sectors in the system to assist in reaching this goal. The long-term goal for Denmark was first formulated in 2006 parallel to the publication of the first “IDA Energy Plan 2030”. To achieve this goal in a least-cost way, it is essential that Denmark discusses and identifies suitable least-cost and long-term implementation strategies. It is also important that such strategies are resilient against variable prices on the international electricity and fuel markets. Furthermore, it has always been emphasized by IDA that such a goal carries the potential of creating jobs and developing industries within the green energy sector. IDA’s Energy Vision 2050 is a contribution from the Danish Association of Engineers (IDA) in this important debate. IDA’s Energy Vision 2050 is built on the two previous inputs from IDA, namely the “IDA Energy Plan 2030” from 2006 and the “IDA Climate Plan 2050” from 2009, and similar to the previous strategies, it is based on the input from a group of experts. Moreover, it is based on a number of important studies and research projects which have been related to the IDA strategies in one way or another. In the following, the way in which these studies and projects have contributed to IDA Energy Vision 2050 is highlighted. This includes the essential Smart Energy Systems concept, which is a cross-sectoral approach that makes use of synergies between the various energy sub-sectors when identifying suitable and costeffective renewable energy solutions for the future. 1.2 1.2.1 Previous research IDA Energy Plan 2030 (2006) In 2006, IDA established an energy year that led to the publication of IDA Energy Plan 2030. This report was based on inputs from more than 40 seminars in which a total of 1600 participants discussed and designed a model for the future energy system of Denmark. The methodology for the energy system analysis included hour-by-hour computer simulations which led to the design of energy systems that were flexible and had the ability to balance the electricity supply and demand. The outputs were detailed system designs and energy balances for two energy target years: 2050 with 100% renewable energy from biomass combined with wind, wave and solar power; and 2030 with 50% renewable energy, which emphasized the first important steps on the way. The conclusion was that a 100% renewable energy supply based on domestic resources is physically possible, and that the first step towards 2030 is feasible for the Danish society. Furthermore, such a strategy has a high potential to generate jobs and develop further the energy industry and export opportunities for Denmark. However, the report also highlighted a number of issues for further discussion. Firstly, Denmark will have to decide between relying mostly on biomass resources, which will involve the reorganization of the present use of farming areas, or mostly on wind power, which will require a large production of hydrogen or similar energy carriers that may lead to particular inefficiencies in the system design. Next, Denmark will have to decide how to implement a transport solution based on renewable energy, especially when considering aviation. There is no single-technological solution to this problem. Numerous technologies need to be utilised and coordinated with the rest of the energy system. 34 IDA’S ENERGY VISION 2050 Finally, the heating of buildings should be considered further, especially in terms of how much should be from district heating and how the remaining buildings should be heated. IDA’s Energy Vision 2050 is built on the same principles and methodologies as the first IDA Energy Plan 2030. 1.2.2 The Heat Plan Denmark Studies (2008 and 2010) The first two Heat Plan Denmark studies went into detail answering the questions on how heating should be provided in the future. The reports analysed the role of district heating in various future renewable energy system configurations. At the time of these studies, the share of renewable energy was close to reaching 20%. From this point of departure, the reports defined a scenario framework in which the Danish system was supplied with 100% renewable energy sources (RES) by the year 2060. This included reducing the space heating demand by 75%. By doing a detailed energy system analysis of the entire national energy system, the consequences in relation to fuel demand, CO2 emissions and cost were calculated for various heating options, such as district heating and individual heat pumps and micro CHP. The studies included almost 25% of the Danish building stock, namely buildings with individual gas or oil boilers that could be substituted by district heating or a more efficient individual heat source. Today, these buildings are supplied by heat from individual boilers based on oil, natural gas or biomass. Compared to such a reference, the analysis showed that a substantial reduction in fuel demands, CO2 emissions and costs can be achieved by converting to a district heating supply. This conclusion seems to be valid in the present energy systems as well as in a future scenario aiming at a 100% renewable energy supply in 2060, even if the space heating demand is reduced to as much as 25% of the present demand. The Heat Plan Denmark studies reached the conclusion that the best solution will be to expand district heating from 46% in 2006 to somewhere between 63% and 70% of the individual heating demand. The remaining buildings should use solutions based on individual heat pumps and solar thermal. The reports emphasise that the analysis is based on a gradual improvement of district heating technologies, implementing, among other initiatives, lower temperature heat coupled with lower space heating demand and a lower return temperature from the consumers. Therefore, it is crucial to continue the present development in such a direction. Moreover, the expansion of district heating will improve the utilisation of heat produced from waste incineration and industry, which was included in the analysis. IDA’s Energy Vision 2050 is built on the input from the Heat Plan Denmark studies and includes an expansion of district heating to 66% of the demand. Heating for the remaining building stock is recommended to be from individual solutions based on heat pumps and solar thermal. 1.2.3 The IDA Climate Plan 2050 (2009) In 2009, three years after making IDA Energy Plan, the Danish Society of Engineers made a follow-up extended study called IDA Climate Plan 2050. This follow-up study was part of a joint effort by engineering societies from various countries to contribute to the COP15 meeting in Copenhagen in 2009. IDA Climate Plan added to IDA Energy Plan by including not only the energy sector but all other sectors releasing greenhouse gas emissions. Furthermore, the study included additional transport analyses and biomass assessments, as well as an estimate of health costs and job creation based on applied concrete institutional economics. IDA Climate Plan included contributions from the first Heat Plan Denmark study as well as preliminary results from the CEESA study (described below). 35 IDA’S ENERGY VISION 2050 Again, the conclusion was that a 100% renewable energy system is possible, but the balance between a large consumption of biomass and a large amount of electricity for direct use or for the production of synthetic fuels appears to be a challenge. The plan included changes in the agricultural sector and the extra contribution from aviation and concluded that the emission of greenhouse gases can be reduced to 10% in 2050 compared to 2000 levels. The change from a conventional energy system to a renewable energy system provides socio-economic savings itself, due to the fact that the savings achieved in fuel costs are higher than the additional annual investment costs. On top of this, the renewable energy system entails a benefit for the health of the population, which increases the socio-economic savings. Further, if the changes are implemented relatively early in the period, there is a potential for exports and related jobs. In all cases, the changes will increase the amount of jobs, even if the commercial potential for increased exports is not met. These results indicate the possibility of continuing economic growth while implementing climate mitigation strategies. IDA’s Energy Vision 2050 does not include the whole climate sector similar to IDA Climate Plan, but does include findings from the Climate Plan as well as the calculation of health cost. 1.2.4 The CEESA (Coherent Energy and Environmental Systems Analysis) project (2011) CEESA (Coherent Energy and Environmental Systems Analysis) was a research project partly financed by the Danish Council for Strategic Research with participants from Aalborg University, Technical University of Denmark, University of Southern Denmark, Copenhagen Business School, and Copenhagen University. The project used the IDA scenarios as a starting point and focused on some of the main challenges that were highlighted in the first IDA Energy Plan 2030, namely the biomass and the transport issues. The CEESA study emphasizes the cross-sectoral approach to identifying the best solutions and ends up introducing and giving name to the Smart Energy Systems approach. This involves among others fuel pathways including power-to-heat, electrofuels, hour-by-hour analysis of the gas grid, and similar analyses of the electricity, heating and cooling grids. As in the IDA plans, the aim of the CEESA scenarios is to design a 100% renewable energy system by the year 2050. A focus point is that this transition highly relies on the technologies which are assumed to be available within the specified time horizon and which may have different effects on the biomass consumption. To highlight this, the CEESA project has identified scenarios based on three different assumptions with regard to the available technologies. This methodology allows a better optimization and understanding of the energy systems. To enable a thorough analysis of the different key elements in 100% renewable energy systems, two very different 100% renewable energy scenarios as well as one recommendable scenario have been designed. The recommendable CEESA scenario is shown in Figure 16 below. In all scenarios, energy savings and direct electricity consumption are given a high priority, and all scenarios rely on the holistic Smart Energy System approach. This includes the use of heat storages, district heating with CHP plants, and large heat pumps as well as the integration of transport fuel pathways with the use of gas storage. These Smart Energy Systems enable a flexible and efficient integration of large amounts of fluctuating electricity production from wind turbines and photovoltaics. The gas grids and liquid fuels allow long-term storage, while the electric vehicles and heat pumps allow shorter-term storage and flexibility. 36 IDA’S ENERGY VISION 2050 Figure 16: The primary energy supply for Denmark in 2010, in the CEESA Recommendable scenario IDA’s Energy Vision 2050 (as well as IDA Climate Plan) includes the CEESA findings on how to deal with limited biomass resources and differentiated transport needs. Moreover, the concept of a Smart Energy System approach is essential to the design of the suggested scenario. 1.3 The Smart Energy System Approach As an essential aspect, IDA Energy Vision 2050 is based on the Smart Energy System concept, which is a cross-sectoral approach that makes use of synergies between the various energy sub-sectors when identifying suitable and cost-effective renewable energy solutions for the future. The Smart Energy System concept outlines how national energy systems can be transformed from fossil fuels to 100% renewable energy. The two key forms of energy production are bioenergy and intermittent renewable energy such as wind and solar power. Bioenergy is very suitable as a replacement for fossil fuels since it has many similar characteristics; but in a 100% renewable energy system, bioenergy is a scarce resource. Intermittent renewable energy sources are more plentiful, but they pose a challenge due to the fluctuations in their production, which need to be accommodated. Therefore, accommodating large amounts of intermittent renewable energy and limiting the bioenergy resource to a sustainable level are two key features of the Smart Energy System concept. To achieve these, it is essential that synergies between the electricity, heat, and transport sectors are utilised more effectively in the future, especially thermal storage, heat pumps, electric vehicles, electrofuels, and fuel storage. This will improve the overall efficiency of the system and enable the utilisation of more intermittent 37 IDA’S ENERGY VISION 2050 renewable energy. The result is a 100% renewable energy system and zero net carbon dioxide emissions. Furthermore, the cost of the Smart Energy System will be the same as a fossil fuel scenario, but more importantly, the Smart Energy System will be based on domestic infrastructure instead of imported fuels, thus creating more local jobs. Smart Energy arises as a solution in a future energy system relying on renewable energy resources such as wind and solar power. These resources do not contain large amounts of stored energy, but instead the energy from the wind, sun, waves and tides must be captured and used immediately. This is one of the key technological challenges facing energy systems in the future. The question is: Based on renewable energy, how can the future energy system operate without the flexibility currently being provided by large amounts of stored energy in fossil fuels, while providing affordable energy and utilising a sustainable level of the resources available? The solution will be to find new forms of flexibility within the energy system which are affordable and utilise renewable energy resources in an efficient manner. This is called a Smart Energy System or Smart Energy. A Smart Energy System consists of new technologies and infrastructures which create new forms of flexibility, primarily in the ‘conversion’ stage of the energy system. This is achieved by transforming the system from a simple linear approach as in today’s energy systems (i.e., fuel to conversion to end-use), to a more interconnected approach. In simple terms, this means combining the electricity, thermal, and transport sectors so that the flexibility across these different areas can compensate for the lack of flexibility from renewable resources such as wind and solar. The Smart Energy System is defined in [3,4] and uses technologies such as: Smart Electricity Grids to connect flexible electricity demands such as heat pumps and electric vehicles to intermittent renewable resources such as wind and solar power. Smart Thermal Grids (District Heating and Cooling) to connect the electricity and heating sectors. This enables the utilisation of thermal storage for creating additional flexibility and the recycling of heat losses in the energy system. Smart Gas Grids to connect the electricity, heating, and transport sectors. This enables the utilisation of gas storage for creating additional flexibility. If the gas is refined to a liquid fuel, then liquid fuel storages can also be utilised. Based on these fundamental infrastructures, a Smart Energy System is defined as an approach in which smart Electricity, Thermal and Gas Grids are combined with storage technologies and coordinated to identify synergies between them in order to achieve an optimal solution for each individual sector as well as for the overall energy system. Figure 17 and Figure 18 illustrate the overall Smart Energy System structure for a 100% renewable energy system and different storage options together with investment costs of technologies. 38 IDA’S ENERGY VISION 2050 Figure 17: Smart Energy System structure. (EVs: Electric vehicles, Quad: production of four outputs) Figure 18. Investment costs and efficiency comparison for different energy storage technologies The Smart Energy System concept described above was the first definition of Smart Energy on a system level encompassing all energy sectors. Other definitions of Smart Energy exist today; however, less research has been done on a system level for these definitions than for the concept defined here. The definition of Smart 39 IDA’S ENERGY VISION 2050 Energy described here should not be seen as an isolated research concept, but as a broad research area encompassing a wide range of technological solutions and research. IDA Energy Vision 2050 is built on the principles and methodologies of the Smart Energy Systems approach. 1.3.1 Strategic Research Center for Energy Neutral Buildings: NZEB (Net Zero Energy Buildings) In the NZEB Research Centre, industry, universities and the public sector collaborated to investigate the potential to develop and implement Net Zero Energy Buildings. As part of the research centre, a study was carried out to investigate to which extent heat should be saved rather than produced and to which extent district heating infrastructures, rather than individual heating solutions, should be used in future sustainable Smart Energy Systems. These analyses were based on inputs from Heat Plan Denmark and CEESA. Based on the CEESA recommendable scenario (a concrete proposal to implement the Danish governmental 2050 fossil-free vision), the study identifies marginal heat production costs and compares these to marginal heat saving costs for two different levels of district heating. A suitable least-cost heating strategy seems to be to reduce the net heat demand by approximately 50% in new buildings and buildings that are being renovated anyway, while the implementation of heat savings hardly pays if it is not part of a general building renovation. Moreover, the analysis points in the direction that a least-cost strategy will be to provide approximately 2/3 of the heat demand from district heating and the rest from individual heat pumps. IDA Energy Vision 2050 uses marginal heat saving cost data from and built on the principles and methodologies of the NZEB research. This includes a heat saving and heating strategy similar to the study carried out in NZEB. 1.3.2 The 4DH Strategic Research Centre: 4th Generation District Heating The 4DH Research Centre is a collaboration between industry, universities and the public sector to investigate the potential for and develop 4th Generation District Heating (4GDH), financed by Innovation Fund Denmark and the involved parties. The 4DH research is, among others, based on findings of Heat Plan Denmark regarding the further development of district heating with the aim to match the needs of the future energy system. Low-temperature district heating for low energy buildings is an essential aspect. The development of 4GDH is fundamental to the implementation of the Danish objective of being fossil fuelfree by 2050 and the European 2020 goals. With lower and more flexible distribution temperatures, 4GDH can utilize renewable energy sources, while meeting the requirements of low-energy buildings and energy conservation measures in the existing building stock. In 4GDH systems, synergies are created between three areas of district heating, which also sum up the work of the 4DH Centre: Grids and components; Production and system integration, and Planning and implementation. The 4GDH system is defined as a coherent technological and institutional concept, which by means of smart thermal grids assists the appropriate development of sustainable energy systems. 4GDH systems provide heat supply to low-energy buildings with low grid losses in a way in which the use of lowtemperature heat sources is integrated with the operation of Smart Energy Systems. The concept involves the development of an institutional and organisational framework to facilitate suitable cost and motivation structures as illustrated in Figure 19 below. 40 IDA’S ENERGY VISION 2050 Figure 19: District heating progression diagram ‐ [5] 4DH has created focus on and knowledge about the future 4GDH potential within the district heating industry. 4GDH systems and technologies will form a significant part of future cost-effective sustainable energy systems and are likely to replace the import of fossil fuels and create jobs and economic growth in Denmark and in Europe. Among other results, the Heat Roadmap Europe studies have developed the most advanced knowledge about energy planning currently available for analysing the heating sector in Europe and have demonstrated how a simultaneous expansion of heat savings, district heating, and heat pumps will result in the cheapest low-carbon heating sector for Europe. IDA Energy Vision 2050 is built on 4DH principles and includes low-temperature district heating for low energy buildings as well as integrated heat production from various sources in a future energy system, such as lowtemperature industrial waste heat, geothermal, and waste heat from biomass conversion and electrolysis. 41 IDA’S ENERGY VISION 2050 2 Methodology for the IDA 2035 and IDA 2050 scenarios 2.1 Overall methodology IDA’s Energy Vision is based on the Smart Energy Systems approach and contains findings from previous research projects within areas such as energy storage, heat savings, transport and methodologies for creating renewable energy scenarios for a national energy system. This research combined with updated data and methodologies form the foundation for IDA’s Energy Vision. The aim in IDA’s Energy Vision is to show that it is possible to create a cost-effective energy system for the future only based on renewable energy sources, which is also robust towards changes in fuel and electricity prices. For this, a long-term perspective has been used towards 2050 with an intermediate scenario for the year 2035. This long-term frame allows radical changes in the technologies and systems implemented, which will be required in order to integrate sufficient renewable resources in the future and to improve the efficiency of the system. IDA’s Energy Vision meets the energy demands and services in an energy system where economic growth has increased industrial production, increased heat demands due to a growing building area, increased energy services from electricity demands due to more appliances and increased transport demands grow. IDA’s Energy Vision is based on a number of scenarios that indicate the situation in a given year and serve as a ‘snapshot’ of the energy system in this year. These scenarios are based on a complete energy system analysis meaning that all sectors of the energy system are included (electricity, heating, cooling, transport and industry). This enables us to analyse energy system synergies and impacts across sectors; for example when changes are carried out in the heating sector, it is also possible to identify the impacts in the electricity sector and vice versa. This is a key feature of a Smart Energy System that benefits from sector integration and energy storage across sectors. Furthermore, when integrating large shares of fluctuating renewable energy, it is necessary to analyse the system changes on a detailed time scale. This is why IDA’s Energy Vision is based on hour-by-hour analysis throughout a year, which enables a thorough analysis of the flexibility of an energy system. The advanced energy system analyses tool EnergyPLAN model is used in the analyses described below. This analysis time frame is also essential when analysing electricity exchange in a system and how external electricity markets impact the energy system. These type of analyses have been included in the IDA scenarios to ensure robustness against changes in external markets. The first part of IDA’s Energy Vision contains a replication of a number of scenarios developed by the Danish Energy Agency (DEA) [6]; a fossil scenario and a scenario based on wind power for both 2035 and 2050 in the energy systems analyses tool used: DEA Fossil 2035, DEA Fossil 2050 and DEA Wind 2035 and DEA Wind 2050. These scenarios show how the future energy system might transform and which impacts it might have. The DEA Wind scenario in 2050 is based only on renewable energy sources. IDA’s Energy Vision uses the demands in DEA Wind 2035 and DEA Wind 2050 as a starting point. Using state-of-the-art knowledge this creates a different system with different specifications and impacts on factors such as primary energy demand, socio-economic costs and electricity trade. Compared to the DEA Wind 2050 scenario, some alterations include energy saving levels, supply technologies, changes in demand types, and technological development in few key technologies. These differences are further described in Section 2.7 and the impacts of these changes are analysed in Chapter 8. Besides these changes, IDA’s Energy Vision and the DEA Wind 2050 scenario are in general based on similar assumptions regarding technology efficiencies, investment costs, fuel and electricity prices and to a large degree also on the energy demand growth projections expected towards 2050. This allows comparison between the scenarios and the identification of differences between the systems. 42 IDA’S ENERGY VISION 2050 The scenarios developed in this report are named IDA 2035 and IDA 2050. It should be noted that the replication of the DEA scenarios regarding mainly costs for transport infrastructure makes it difficult to directly compare with the costs reported in the report about the DEA scenarios [6]. A reference energy system is developed for Denmark based on statistical data for 2013 and subsequently updated with recent changes for 2015. This update is implemented in order to compare with the most recent national energy system. 2.2 Socio-economic costs and electricity market exchange In the report, the focus on the system impacts will primarily include energy in terms of primary energy demands and biomass, socio-economic costs, CO2 emissions from the energy system, impacts on electricity exchange, as well as health costs and job creation. The methodology for the analyses of health costs and job creation is described within those chapters of the report. The socio-economic costs of the IDAs Energy Vision 2050 as well as the DEA scenarios has been calculated as annual cost divided on fuel, operation and maintenance, electricity exchange and investments. The investments are shown as annual cost using a calculation rate of 3% and the expected lifetime of the technology in question. Sensitivity analyses have been performed with an interest rate of 4%. Both the Nordic electricity market, NordPool Spot, and the central European/German electricity market, EPEX, are set up based on the marginal price setting principle, where each winning participant in the market is cleared on the basis of the most expensive winning bid. EnergyPLAN emulates this market price setting principle by grouping types of production units internally, and the external market is represented by the market price in each hour and the import and export effects on this external market price. With this settlement principle, a participant’s profit depends on a more expensive unit also winning. In markets based on marginal price setting, participants submit bids equal to or close to the short-term marginal cost of participation, assuming that no one in the market is exercising market power. The reason for this is that, with such a bid, the short-term marginal cost is covered in case the bid is accepted. Any potential extra income can be used to cover fixed costs and pay off investments. As such, the participants’ bidding strategy normally results in units with the lowest shortterm marginal costs being employed first; the market is therefore known for keeping total system costs low, assuming that no one is exercising market power. It has also been described as a fair settlement principle, as all participants are settled at the same price, and it appears easier for small participants to do well, as only knowledge of own costs is needed in order to provide an optimal bid. The analyses of the impacts of electricity market exchange focusses on the ability of the systems to create earnings by either importing or exporting depending on the external electricity prices and the fuel costs used in power and CHP plants. In addition the analysis are used to investigate the primary energy supply and biomass use in the systems. A total of ten different electricity prices and three different fuel prices are used in the analyses. These analyses apply the 2013 Nord Pool hour-by-hour distribution on the annual electricity price assumed. The analyses are conducted for the DEA and IDA scenarios in a number of combinations of electricity prices and using distribution data for wind power production and demands assuming 2013 as well. The prices for electricity and fuels can be found in Section 2.8. The analyses are conducted with a transmission line capacity of 4,140 MW in and out of Denmark, not specifying to which country the trade is done, but using the NordPool area as such as the marketplace. Sensitivity analyses have been conducted in which the transmission capacity is twice the mentioned level. This however does not change the results of the analyses, as both the DEA and IDA scenarios have nearly zero critical excess electricity export. 43 IDA’S ENERGY VISION 2050 2.3 EnergyPLAN hour by hour in smart energy context The analysis of Smart Energy Systems calls for tools and models which can provide similar and parallel analyses of electricity, thermal and gas grids. The advanced energy systems analysis model, EnergyPLAN, has been developed to fulfil such a purpose on an hourly basis (www.EnergyPLAN.eu), so that optimal solutions can be identified. The main purpose of the model is to assist the design of national energy planning strategies on the basis of technical and economic analyses of the consequences of different national energy systems and investments. However, the model has also been applied to the European level as well as to a local level such as towns and/or municipalities. The design of EnergyPLAN emphasises the option of looking at the complete energy system as a whole. Therefore, EnergyPLAN is designed to be a tool in which, e.g., electricity smart grids can be coordinated with the utilisation of renewable energy for other purposes than electricity production. In the tool, renewable energy is converted into other forms of carriers than electricity, including heat, hydrogen, synthetic gases and biofuels, as well as energy conservation and efficiency improvements, such as CHP and improved efficiencies, e.g., in the form of fuel cells. All such measures have the potential for replacing fossil fuels or improving the fuel efficiency of the system. The systems relevant in the long term are those in which such measures are combined with energy conservation and system efficiency improvements. As a consequence, the EnergyPLAN tool does not only calculate an hourly electricity balance, but also hourly balances of district heating, cooling, hydrogen and natural gas, including contributions from biogas, gasification as well as electrolysis and hydrogenation. A complete overview of the energy flows, technologies, and regulation strategies in the EnergyPLAN tool are outlined in Figure 20. IDA’s Energy Vision 2050 has used the EnergyPLAN model to develop a complete 100% renewable energy strategy for Denmark, accounting for electricity, heat, industry, and transport, while also considering the hourly variations of both supply and demand. 44 IDA’S ENERGY VISION 2050 Figure 20. EnergyPLAN energy flows, technologies, and regulation strategies 2.4 The 2015 Reference and Replication of the DEA 2035 and 2050 Scenarios This section presents the background of the models used as references for the IDA scenarios presented in this report. For 2015, a reference scenario is constructed, mainly based on historical data. For 2035 and 2050, the scenarios developed by the DEA are used, specifically the Fossil and the Wind scenarios. These scenarios have been analysed and replicated in the modelling tool, EnergyPLAN, to enable a direct comparison with the IDA scenarios. The reference scenarios and their replications are presented in the following sections. Table 3 shows the key parameters of the replications of the five scenarios mentioned above. The replications of the scenarios are modelled in the EnergyPLAN tool and simulated to reflect the system dynamics, fuel consumption and electricity exchange with external electricity markets. More details about the modelling of the scenarios and the assumption can be seen in the following sections and in the supplementary report “Technical data and methods” [7] with an elaboration of the specific inputs for each of the models. 45 IDA’S ENERGY VISION 2050 Table 3: Comparison of reference scenarios on key parameters 2015 Reference DEA 2035 Fossil Wind DEA 2050 Fossil Wind Parameter Demands Unit Electricity District heating Individual heating Industry Transport Primary energy supply Wind Solar PV Coal Oil Natural gas Biomass Electricity net-export Conversion capacities Wind power Solar PV CHP (Central) CHP (Decen.) Power plant Heat pumps Costs Fuel and variable Fixed O&M Investments Electricity exchange CO2 Annual total TWh/year TWh/year TWh/year TWh/year TWh/year 34.2 22.8 20.0 26.8 55.6 37.6 24.5 21.8 21.9 58.5 49.3 24.5 21.7 20.7 53.4 43.5 21.3 17.6 23.4 49.2 80.5 21.3 17.7 17.6 44.9 TWh/year TWh/year TWh/year TWh/year TWh/year TWh/year TWh/year 11.5 0.6 24.4 103.4 37.3 34.5 3.4 19.6 0.7 72.1 56.2 15.7 28.4 15.8 31.5 0.9 0 46.0 18.4 67.1 5.7 31.5 0.7 54.9 32.1 13.8 25.6 13.1 68.4 1.7 0 0 0 86.9 6.0 MW-e MW-e MW-e MW-e MW-e MW-e 5,030 629 6,244 1,889 841 0 5,650 800 2,776 1,424 1,000 0 8,500 1,000 1,421 1,026 900 216 8,500 800 1,575 1,424 1,400 0 17,500 2,000 0 684 4,600 328 B€ B€ B€ B€ B€ B€ 8.3 4.2 8.4 -0.1 0.7 21.5 5.7 4.9 11.7 -0.9 1.2 22.7 5.1 5.3 12.6 -0.3 0.5 23.1 3.5 5.1 13.9 -0.7 1.3 23.2 1.9 6.5 16.5 -0.1 0 24.8 2.4.1 Presentation of the DEA Scenarios The DEA has developed four different fossil free scenarios for a future Danish energy system; a wind scenario, a biomass scenario, a Bio+ scenario and a hydrogen scenario. The scenarios are constructed from a biomass perspective, where the highest biomass demands are in the bio+ scenario around 700 PJ/year; in the biomass scenario, this level is 450 PJ/year, while for the wind and hydrogen scenarios, the biomass demand is around 200-250 PJ/year. The biomass and Bio+ scenarios will require import of biomass in the future and are therefore not feasible from a biomass and security of supply perspective. In the hydrogen scenario, the annual energy system costs are higher than in all other scenarios except the Bio+ scenario. It is decided to use the wind scenario from the DEA as a basis for developing the IDA scenarios. The wind scenario from the DEA is rather similar to the scenario developed by the Climate Commission, the energy scenario from Energinet.dk and the previous DEA wind scenario [8,6,9]. The wind scenario is developed through a massive electrification of the transport and the heating sectors, thereby reducing the biomass demand to 250 PJ/year. Some of this biomass is used for biofuel production that is integrated into the electricity and heating supply, while wind power will be the dominant technology for electricity production. Heating is primarily from excess heat, CHP and electric heat pumps. The majority of the personal vehicles, busses and rail are converted to electricity-based, while the remainder of the transport demand is supplied by advanced BTL (biomass-to-liquid) technology with hydrogen addition that provides diesel, petrol and jet fuel. 46 IDA’S ENERGY VISION 2050 The part of the transport demand that depends on gaseous fuels is supplied by synthetic natural gas (SNG) produced through the upgrading of biogas. In addition, a fossil scenario has been developed neglecting all national targets and therefore continuing the consumption of fossil fuels. This scenario is included here as well, for the purpose of comparison with the other scenarios. This scenario consumes a large share of coal due to its low price, but also oil and natural gas for transport and electricity and heat production. In the future, wind power and electric vehicles are also assumed to be economical and therefore these technologies are also part of the fossil scenario, but on a lower level than in the wind scenario. 2.5 Replication of the 2015 Reference The Reference 2015 model is based on the newest national energy statistics for Denmark from 2013. To make the model represent 2015, some key inputs have been updated using newer data sources. In the documentation of the specific inputs, presented in the supplementary report - “Technical data and methods” [7], the values updated with 2015 data are put in brackets after the 2013 values. Most of the inputs are from the National Energy Statistics 2013 from the DEA [10]. This consists of a main report and a spreadsheet as an appendix and both documents have been used. For some of the more plant or plant type specific inputs, the Register of energy producers 2012 (Energiproducenttællingen) from the DEA has also been used. This is only used for the distribution of production between plant types and fuel mix and not for total fuel consumption or energy production. To supplement these two sources, a number of other references have been used for 2015 values or for more specific issues that the National Energy Statistics do not cover, such as thermal storage capacity, district heating grid losses, and cooling demand and production. The 2013 model has been calibrated to match the energy balance reported in [10]. The calibration has been done by firstly, adjusting the calculated efficiencies of the CHP plants in central district heating areas to match the total fuel consumption of the system, and secondly, adjusting the calculated fuel distribution of the CHP plants in central district heating areas to make the model match the fuel mix in the statistics. In the documentation of the inputs in Table 3, it has been noted which inputs have been used for calibration. After the calibration, the selected 2013 values are replaced with 2015 values, as mentioned above. In the modelling, the district heating areas have been divided into central and decentralised areas. The central areas are those areas where large extraction CHP plants are located. The decentralised areas are the remaining areas. The decentralised district heating areas consist of both areas with CHP and without CHP. In all district heating areas, there are heat-only boilers that serve as peak load or back-up supply units. 2.6 Replication of the DEA Scenarios To compare the IDA Energy Vision 2050 scenarios with the DEA Fossil and Wind scenarios, all four scenarios were recreated in EnergyPLAN: The 2035 Fossil, 2050 Fossil, 2035 Wind and 2050 Wind scenarios. These recreations are based on the report [6] created by the DEA. A detailed validation of the replication of the DEA scenarios is described the in the supplementary report - “Technical data and methods” [7] 47 IDA’S ENERGY VISION 2050 2.7 Differences between DEA and IDA scenarios This section describes the main differences between the DEA Wind scenarios and the IDA scenarios in terms of both technological development and assumptions. The purpose of this is to create transparency about the scenarios and to allow an understanding of why the scenarios provide different results. 2.7.1 Technological development In terms of technological development, four key differences appear between the IDA 2050 and the DEA Wind 2050 scenarios, and the impacts of these are analysed in Chapter 8. Firstly, the electrolysers installed in the scenarios are different. The technology installed in DEA Wind 2050 are alkaline electrolysers while in the IDA scenario high temperature electrolysis by solid oxide electrolysers (SOECs) is preferred. These technologies have different efficiencies. For SOECs efficiency of 73% is assumed, while the alkaline electrolysers have an efficiency of 58%. In addition, the SOECs have lower investment costs due to the projected technological development and lower material costs. Besides this, the fuel demand in IDA scenarios is met by power-to-fuel technology and equal distribution of CO2-electrofuels and bio-electrofuels is produced. Firstly electricity is converted to hydrogen that is further used for hydrogenation of carbon source that is either biomass gasification or CO2 emissions. In the DEA Wind 2050 scenario the transport fuels are produced by advanced BTL technology with addition of hydrogen resulting in a different demand for biomass and electricity for fuel production. For further details see Chapter 7. Furthermore, the capacity factors for renewable electricity production for wind power and PV is different between the two scenarios. The IDA scenarios are more optimistic in terms of technological development as suggested by [11]. In IDA 2050 the capacity factors are 37%, 52% and 14% for onshore, offshore and PV production, respectively while in the DEA 2050 Wind scenario the factors are 35%, 47% and 10%, respectively. Finally, the power plant and CHP plant technologies installed are different in terms of efficiencies, where the IDA 2050 scenario plants have higher efficiencies. Here, the efficiencies are 61.5% for power plants and 52/39% for CHP (electric/thermal), while in DEA Wind 2050, the efficiencies are 44% for power plants and 49/43% for CHP plants. 2.7.2 Methodological differences Other differences between the scenarios are due to different approaches to e.g. savings, capacities installed and other system design specifications. A difference in terms of heat supply is the level of district heating that is implemented as the IDA scenario has a higher share of district heating than the DEA 2050 Wind scenario. In the IDA scenario the district heating share is 66% while it is 55% in DEA Wind 2050 and on top of this the heating demands are slightly different because of other heat saving levels. Moreover, the heat savings are differently distributed as the IDA scenario implements more retrofitting of existing buildings while the DEA Wind 2050 scenario has a larger focus on new buildings. On the supply side the IDA scenarios implement more heat pumps in the district heating system to increase the electricity demand compared to the DEA Wind scenario. However, for individual heating, the DEA Wind scenario has a large share of individual heat pumps (100%), while this is considered a higher share than what is possible to implement in the IDA scenario. Instead, around 10% biomass boilers are installed in this scenario. On the supply side, a larger amount of district heating boilers are installed in the IDA scenario; thus, the entire district heating demand at any time can be covered by boilers. The capacity is more than twice as high as in the DEA scenario. The last difference within heating is the CHP capacity, as the decentralised capacity in the IDA scenario is twice as high as in the DEA scenario. 48 IDA’S ENERGY VISION 2050 Furthermore, no centralised CHP plants are installed in the DEA scenario, while a large capacity of 3500 MW is implemented in the IDA scenario. In the cooling sector, the differences between the IDA and DEA scenarios are not clear, as the cooling demands and supply are not explicitly described, but are included as part of the conventional electricity demand. However, in the IDA scenario, district cooling has been prioritized for efficiency gains and this results in a lower electricity demand, see more in Section 5.4. For the waste sector more recycling has been implemented in the IDA scenario which results in less waste available for waste energy recovery compared to the DEA 2050 Wind scenario. This affects the district heating and electricity that has to be replaced by other resources. For the power plant and CHP capacity for electricity production a slightly higher overall capacity of 10% are included in the IDA scenarios in order to cover a larger share of the demand without import. On the electricity demand side a higher share of flexible electricity demand is included in the IDA scenario in order to enable a better alignment between demand and production. Finally, regarding transport a different growth structure is expected between the scenarios along with more modal shifts in the IDA scenario. More details about the transport can be found in Chapter 7. 2.8 2.8.1 Fuel prices, investment cost and socio-economy Fuel and CO2 price forecasts in IDA Energy Vision 2050 The DEA last updated its fuel price assumptions in December 2014 [12]. The update is connected primarily with the fact that the IEA in World Energy Outlook from November 2013 re-evaluated its expectations for the fuel price trend. In the DEA's update, the crude oil price is in 2035 expected to increase to 148 2015-$/barrel. When IDA's Climate Plan 2050 was completed in 2009, the DEA's corresponding expectations were at 122 2007-$/barrel [13]. Based on the historical crude oil price development shown in Figure 21, indicating that the yearly crude oil price never has exceeded 120 2015-$/barrel, a crude oil price of 148 2015-$/barrel must be considered high. As such, in IDA’s Energy Vision 2050, the DEA forecasts from December 2014 are seen as high price forecasts. 49 IDA’S ENERGY VISION 2050 Figure 21: Yearly Brent crude oil price in 2015‐$/barrel [14]. In IDA’s Energy Vision 2050, three different cost scenarios for 2035 are used: Low fuel cost: Based on the fuel prices in 2015, where the crude oil price is about 62 $/barrel. [15] [16] [17] Medium fuel cost: The average between the low and high cost scenario, where the crude oil price corresponds to about 105 2015-$/barrel. High fuel cost: DEA’s fuel price forecast for 2035 from December 2014, where the crude oil price is expected to be about 148 2015-$/barrel [12]. The fuel costs, excluding costs for the transport of fuel to the place of consumption, for each of the fuel types are shown in Table 4. Table 4: Fuel costs by fuel type excl. costs for transport to the place of consumption for each cost scenario. 2015€/GJ Crude oil Coal Natural gas Fuel oil Diesel fuel/ Gas Oil Petrol/ JP1 Straw/ Wood chips Wood pellets (general) Energy Crops $/barrel crude oil Low 10 2 6 6 11 12 5 10 6 62 Medium 14 3 8 12 16 16 6 11 7 105 High 18 4 10 17 21 21 7 12 8 148 To determine the cost of transporting each fuel to the place of consumption, the DEA’s price forecast from December 2014 is used. These costs are shown in Table 5, and are used in each of the three cost scenarios. 50 IDA’S ENERGY VISION 2050 Table 5: The cost of transporting each fuel to the place of consumption [12]. 2015-€/GJ Coal Natural gas Fuel oil Diesel fuel/ Gas Oil Power plants Small plants and industry Households 0.05 0.21 0.29 Road transport Aviation Straw/ Wood chips Wood pellets (general) Energy Crops 0.29 0.68 0.29 1.65 0.94 1.78 0.55 0.91 1.65 4.04 3.85 3.85 Petrol/ JP1 4.34 4.67 0.29 In the fuel price forecast from December 2014, the DEA’s uses three estimates for the CO2 quota price in 2035; a low price of 24 2015-€/tonne, a medium of 42 2015-€/tonne and a high of 60 2015-€/tonne. In IDA Energy Vision 2050, the medium CO2 quota price forecast for 2035 of 42 2015-€/tonne is used. In the price forecast from December 2014, the DEA’s foresees a Nord Pool Spot system price for electricity in 2035 of 77 2015-€/MWh. This is expected to be for a CO2 cost of 42 2015-€/tonne. It is assumed that the Nord Pool Spot system price follows the same time distribution as in 2013. A price elasticity has been calculated for electricity exchange, cf. the descriptions in "Local Energy Markets"[18]. Analyses of international electricity market exchange and its consequences due to changes in precipitation for the Norwegian and Swedish hydroelectric power systems have not been done in IDA's Energy Vision 2050. Such analyses were conducted in the IDA Energy Plan 2030 from 2006 [19]. It must be emphasised that the CO2 quota costs employed here are used primarily to be able to evaluate incomes and costs from electricity market exchange. The use of 42 2015-€/tonne CO2 reflects the costs of CO2 reductions and is not an analysis of the socioeconomic impacts of the CO2 emission. Externalities, environment, and health costs are discussed further in the supplementary report - “Technical data and methods” [7] 2.9 Technical facilities and new technologies IDA’s Energy Vision extends from today to 2050. Over this period, energy infrastructures will be continuously replaced when their lifetime ends. The costs of the technologies in IDA’s Energy Vision have been calculated as extra expenses for plant investments as well as operation and maintenance. Better and more efficient technologies will be installed in IDA’s Energy Vision. These replace the old facilities that have to be replaced under all circumstances. The technology data used in IDA’s Energy Vision 2050 applied the same methodology as the DEA. However, the replication of the DEA scenarios in this report uses the latest technology cost data. This means that the costs used in the DEA scenario report are not directly comparable to the costs in this study for energy technologies. The transport cost data included in IDA’s Energy Vision 2050 is a major difference from the DEA methodology. In this study, transport cost data is included for transport infrastructure, charging stations and vehicles, which was not included in the DEA study. The costs for the technologies, including investments, fixed and variable costs, and lifetimes have been determined through a comprehensive overview of data and are finally calculated with a starting point in the latest cost data from the "Technology Data for Energy Plants" [20]. This catalogue is also used by the DEA. 51 IDA’S ENERGY VISION 2050 However, this does not create a complete picture. Therefore to be comprehensive, in IDA’s Energy Vision 2050, this data is supplemented with more than 20 other sources which are included in the cost database in the supplementary report - “Technical data and methods” [7]. In addition, IDA’s Energy Vision 2050 includes a range of conservation measures, conversions, etc., and the costs of these have not been calculated in "Technology Data for Energy Plants". The new costs of renewable technologies have been taken into account and are presented also with the rest of the costs in the supplementary report - “Technical data and methods” [7] The socio-economic impact analysis has been done by calculating the annual costs in IDA’s Energy Vision 2050. The cost calculation has been divided among the costs for fuel, operation and maintenance expenditures, and depreciation of technologies. Depreciation of technologies has been calculated using the individual investment's lifetime. In addition, any profits or losses in international electricity market exchange with the surrounding countries have been included. 52 IDA’S ENERGY VISION 2050 3 The IDA 2035 and IDA 2050 energy systems This chapter presents the main findings regarding the primary energy supply, CO2 emissions, the total socioeconomic cost, and international electricity exchange analysis, as well as a comparison of IDA’s Energy Vision scenarios IDA 2035 and IDA 2050 and the wind and fossil scenarios from the DEA, DEA Wind and DEA Fossil for 2035 and 2050. A reconstruction of the 2015 energy system is included as a means for comparison. The results are all based on hour-by-hour energy system analyses of the entire energy system including transport. The results are based on energy system analyses of seven scenarios using three different fuel price levels and 10 different levels of electricity prices on the international electricity markets. In addition more than 80 central sensitivity analyses have been conducted. This makes the analyses based on more than 400 simulations. 3.1 The primary energy supply in IDA 2035 and IDA 2050 in an international context In Figure 22, the primary energy consumption in IDA 2035 and IDA 2050 is shown based on the hour-by-hour analyses using the medium fuel price assumptions. In IDA 2050, the total primary energy supply is decreasing from the current level of approx. 200 TWh to 160 TWh in 2050. Figure 22 also shows the primary energy supply of the current energy system in 2015 and the DEA scenarios. IDA’s Energy Vision 2050 shows that a 100% renewable energy system is technically and physically possible for Denmark. In the future energy system, the backbone of the energy system is fluctuating renewable electricity such as onshore wind power, offshore wind power, photovoltaic and wave power. More than 60% of the primary energy supply is from fluctuating renewable electricity sources, requiring vast amounts of flexibility in the energy system as such and in the electricity grid. In the district heating grid, low temperature heat from renewable sources is also harvested from solar thermal and geothermal. Including individual solar thermal, a total of 8% of the primary energy supply is provided by fluctuating renewable energy used directly for the heating sector. Significant flexibility is implemented in the energy system between the production of renewable energy on one side and the demands for energy services on the other side. IDA’s Energy Vision exploits storages between production and end demands in order to balance resources and to provide a cost-effective system. Significant end demand savings are implemented in households, industry and businesses, considering that economic growth will increase demands in the future. Electricity savings are implemented in all sectors, while significant heat savings are implemented in existing buildings combined with planned renovations and building improvement from now until 2050. New buildings and heat savings in existing buildings are done in a manner that emphasizes a balance between the costs of producing low value heat on one side and improving the building envelope on the other side. Within the industrial sector, knowledge about the end consumption characteristics has been used to save electricity and fuels. In IDA’s Energy Vision 2050, a significant part of the transport demand is covered by battery electric vehicles, plug-in hybrid vehicles, electric trams and trains as well as vans and busses using electricity. Meeting the transport demand for heavy-duty transport such as trucks, marine and aviation is a major challenge both in terms of costs and bioenergy resources needed. The demand is covered by electrofuels. Investments in rails and charging stations for electric vehicles and other transport infrastructure are crucial for the assumed modal shifts. IDA’s Energy Vision 2050 assumes a transport demand growth that is differently distributed than the growth in the DEA scenarios. 53 IDA’S ENERGY VISION 2050 Primary Energy Supply (TWh/year) 250 200 150 100 50 0 DEA fossil 2015 DEA wind IDA DEA fossil 2035 DEA Wind IDA 2050 Coal Oil Gas Biomass/waste Onshore Offshore PV Wave/tidal Geothermal Solar thermal Figure 22: Primary Energy supply in 2035 and 2050 in the IDA Energy Vision 2050, in 2015 and in the DEA scenarios using the medium fuel price assumptions corresponding to the oil price of 105 $/barrel. Both DEA Wind 2050 and IDA 2050 confirm that it is possible to convert to 100% renewable energy in 2050; however, IDA’s Energy Vision has a lower biomass consumption. In IDA’s Energy Vision 2050, future fuel prices, electricity prices and the uncertainty about the international context of Denmark are regarded as central for assessing the robustness and resilience of the IDA scenarios. By varying the fuel prices and the electricity prices on the international electricity markets, it is possible to show how the IDA scenarios and the DEA scenarios react to different international circumstances. In Figure 23, the primary energy supply and the electricity exchange are illustrated using three different fuel price levels but keeping the same price on the international electricity markets for DEA Wind 2050 and IDA 2050. The medium price level corresponds to the level at which the primary energy consumption is illustrated in Figure 22. While the renewable energy resources in the primary energy supply remain the same, Figure 23 illustrates the effects of using three different fuel cost levels on the biomass consumption and takes into consideration the effects on the import and export of electricity. For DEA Wind 2050, the biomass consumption decreases to 71 TWh with high fuel prices and increases to 102 TWh with low full prices (from 256 PJ to 368 PJ of biomass). The corresponding differences in IDA 2050 is 50 TWh and 75 TWh (from 180 PJ to 270 PJ of biomass). The effect can be explained in the operation of power plants and CHP plants, which changes with different fuel prices due to the differing prices on the international electricity markets. In general, there is a lower import in IDA 2050 than in DEA 2050 due to the higher share of renewables (+16 TWh), such as offshore wind power and PV, as well as more efficient power plants and a more flexible demand side in IDA 2050. In general, IDA 2050 has a higher export due to efficient power plants and CHP plants, which means that in all three fuel price levels, there is a higher biomass consumption in the power plant sector than in DEA 2050 in order to create earnings on electricity markets. DEA Wind 2050 has a higher import and hence lower biomass consumption in power plants and CHP plants, as it is more feasible to import. 54 200 200 180 180 160 160 140 140 120 120 100 100 80 80 60 60 40 40 20 20 0 0 ‐20 Electricity Exchange (TWh/year) Primary Energy Supply (TWh/year) IDA’S ENERGY VISION 2050 ‐20 Low Medium High Low DEA 2050 Wind Medium High IDA 2050 Coal Oil Gas Biomass/waste Onshore Offshore PV Wave/tidal Geothermal Solar thermal Electricity Import Electricity Export Figure 23: Resulting primary fuel production assuming three different fuel price levels (oil prices equivalent to low: 62, medium: 105 and high: 148 $/barrel and 77 €/MWh on the international electricity markets. A total of 120 simulations of the effects of 10 electricity prices and three different fuel price levels have been conducted for DEA Wind 2050 and IDA 2050 to investigate the effects on the biomass consumption. The conclusions of the electricity exchange analyses on the economic cost side are reported in Section 3.4. In Figure 24 the effects of the market exchange analyses on the biomass consumption in DEA Wind 2050 and IDA 2050 are illustrated and the central scenarios are marked on the graphs. The effects of fuel prices and electricity prices combined show that IDA 2050 under all circumstances has a lower fuel demand than DEA Wind 2050. The total range for DEA Wind 2050 is from 230 PJ to 482 PJ and, for IDA 2050, 123 PJ to 339 PJ. 55 IDA’S ENERGY VISION 2050 500 Annual biomass consumption (PJ/year) 450 400 350 300 250 200 150 100 50 0 15 31 46 62 77 92 108 123 139 154 Average external electricity price [€/MWh] Low fuel prices DEA Wind 2050 Medium fuel prices DEA Wind 2050 High fuel prices DEA Wind 2050 Low fuel prices IDA 2050 Medium fuel prices IDA 2050 High fuel prices IDA 2050 Figure 24: Annual biomass consumption in DEA Wind 2050 and IDA 2050 for three different fuel price levels and 10 different price levels for electricity on the internal electricity markets. The central scenarios for DEA Wind 2050 and IDA 2050 are marked in the diagram. An additional market simulation of the IDA 2050 scenario has been conducted, in which all technologies (electricity, heating and transport) are focussed on reducing the biomass consumption level across sectors while the net import is zero. The results are similar to the IDA 2050 scenario with high prices, however the biomass consumption can be reduced to 47 TWh (168 PJ) this shows that IDA 2050 is able to have low demands even in situation where it is not possible to import. The analysis of the primary energy supply shows that is it possible to construct a system with a sustainable amount of biomass; however, this requires careful consideration of the technologies in the different sectors and the interaction between these technologies and storages. A number of sensitivity analyses have been conducted that confirm that IDA 2050 is well equipped to have a low biomass consumption under many circumstances; i.e., it is a robust and resilient Smart Energy System combining savings, renewables and storages using key infrastructures. 3.2 CO2-emissions in the scenarios In IDA’s Energy Vision the focus has been placed on the long term goal of 100% renewable energy, not on the very short term reduction of CO2-emissions. In Figure 25 the emissions from the energy system alone are illustrated. In 2050 the CO2-emissions from the energy sector can be reduced to very low levels or zero as illustrated. For waste a fossil contribution is assumed in 2035 for all scenarios analysed as well as in 2015 and DEA Fossil 2050. In DEA Wind 2050 and IDA 2050, the fossil contribution from waste is assumed to be zero. When a fossil part of waste is assumed, a level of 37 kg of CO2/GJ is used based on the assumptions from the DEA in 2014 [13]. 56 IDA’S ENERGY VISION 2050 The results indicate that IDA 2035 has a slightly higher reduction in 2035 due to more savings and due to more renewable energy. DEA Fossil 2050 also has a reduction mainly due to the wind power also installed in this scenario. Figure 25: CO2‐emissions from 2000 until 2050 from the energy sector in IDA’s Energy Vision 2050 as well as the DEA Fossil and Wind scenarios. The emissions from the DEA scenarios from the DEA is based on the replication of the scenarios in this report and not on the scenarios from the report [6]. These are the emissions from the energy sector alone and excludes emissions from the agricultural sector as well as from non-energy related industry in IDA’s Energy Vision 2050. The greenhouse gas contributions from the energy systems presented only represent a part of the emissions. In 2000, the combined emissions (adjusted) corresponded to 72 million tonnes of CO2 equivalents, of which 54 tonnes came from energy (75%), while 18 tonnes came from agriculture and industrial processes (25%). In addition, there is an extra contribution from aviation, which has not been included in the 72 million tonnes. In the IDA Climate Plan 2050 from 2009 [21] the greenhouse gas emissions from industrial processes and agriculture as well as the extra contribution from aviation were analysed. In the report from 2009, the greenhouse gas emissions from industry (excluding energy consumption which is accounted in this report) were estimated at 4.2 million tonnes of CO2 equivalents/year including emissions from waste disposal sites. In 2009, it was suggested that this could be reduced by 20% mainly by changing the production of and materials for cement. In addition in the report form 2009, the total greenhouse gas emissions from agriculture were estimated at 19 million tonnes/year, including the energy related emissions estimated at 7 million tonnes/year. The Climate Plan 2050 proposed that these 19 million tonnes/year are reduced by 11.7 million tonnes/year through reduced food wastage, dietary habits, and changed agricultural practices. 57 IDA’S ENERGY VISION 2050 Another contributor not included in the analyses in IDA’s Energy Vision 2050 is aircraft greenhouse gas effects due to high altitude combustion. There is no widespread consensus on the magnitude of this increase, with multiplication factors varying from 1.7 up to 5 proposed for ordinary aviation fuel on top of the CO2 emissions directly related to the fuel. This has not been included in the analyses here; however, in the IDA Climate Plan 2050 from 2009 [21] the direct CO2 emissions from aviation were estimated using a factor of 2. In the year 2000, this would amount to 2.5 million tonnes of CO2 equivalents. The question is whether condensation clouds, including cirrus clouds, would increase because of more particles and water vapour or not with new fuel types. For example, if aircrafts were propelled by hydrogen, it would result in 2.6 times more water vapour according to the IPCC. In this report, aviation has been converted to renewable energy based on electrofuels in 2050, but it is reasonable to assume that this alternative for aircrafts will not be significantly different from conventional fuels in regard to this effect. In the IDA Climate Plan 2050, all the above considerations were made, resulting in a reduction of CO2 emissions equivalent to 7.2% by 2050 compared to the level of year 2000. If the extra contribution from aircraft was included, the reduction would be 10.2% in 2050 compared to the 2000 level. 3.3 The socio-economic costs of IDA 2035 and IDA 2050 In the analyses of the costs of a transition to 100% renewable energy, the cost of each individual technology has been carefully assessed and implemented in the vision. Figure 26 illustrates the costs of IDA 2050 as well as the other energy systems. In the comparison of costs, the investments are annualised based on the technical lifetimes and an interest rate of 3%. The fuel cost levels correspond to the oil price of 105 $/barrel. This is an average price between the oil price level in June 2015 (62$/barrel) and the level recommended by DEA in December 2014 for long-term planning for 2035 (148$/barrel). The total costs also include earnings on electricity exchange as well as operation and maintenance costs. An average price on the international electricity market of €77/MWh is used as a medium level out of a total of 10 price levels used in further analyses. This medium level is the level recommended by DEA for analyses of the year 2035. The total costs give a comprehensive picture of the cost of the current Danish energy sector including transport as well as the future potential energy supply in IDA 2050, in 2015, in IDA 2035, and the DEA scenarios. The DEA scenarios have been recreated and the costs included here are based on the same principles as the costs included in the analyses of IDA 2035 and IDA 2050. The costs include considerations on transport infrastructure and transport vehicles. All major differences regarding technology assumptions have been assessed in sensitivity analyses. 58 IDA’S ENERGY VISION 2050 Socio‐economic costs (Billion €/year) 30 25 20 15 10 5 0 ‐5 DEA fossil 2015 DEA wind IDA DEA fossil 2035 Investments O&M DEA Wind IDA 2050 Fuels Electricity exchange CO₂ Figure 26: Socio‐economic costs of the energy systems analysed including transport. Net earnings on international electricity markets are illustrated as a negative and should be subtracted to get the total costs of the systems While the future IDA 2050 energy system is slightly more expensive than the current 2015 energy system, it should be noted that this system, like DEA Wind 2050, covers a significantly larger demand in regard to heat square meters, transport demand and industry. IDA 2050 has slightly lower costs than the proposal for a 100% renewable energy system in DEA Wind 2050. Sensitivity analyses have demonstrated that this conclusion is robust. The major differences in the costs are related to vehicle costs and can be explained by lower growth rates in road transport demands as a result of modal shifts to rail and biking/walking. Furthermore, the heat saving costs are lower due to a better strategy in heat savings in new and existing buildings as well as lower cooling costs due to a higher share of district cooling in comparison to individual cooling investments in the DEA scenarios. Finally, the fuel costs are lower in the IDA scenarios because of reduced biomass demand. The fossil fuel based DEA Fossil 2050 has slightly higher costs than IDA 2050 and slightly lower costs than DEA Wind 2050. The major advantage of IDA 2050 is that it is able to exploit the synergies in the different grids in the energy and transport system, while DEA Wind 2050 is also able to do this to a minor extent. In IDA 2035, the cost difference is less predominant, however, it should be noted that the costs for fuel are significantly lower and that the earnings on the international electricity markets are higher than in the DEA 2035 scenarios. Going towards 100% renewable energy significantly changes the cost structure of the energy supply. In the future, much more costs are allocated to investments and much fewer to fuels. This is illustrated in both IDA 2050 and DEA 2050; however, IDA 2050 is a more fuel-efficient system and hence fewer costs are allocated to fuels in this case. 59 IDA’S ENERGY VISION 2050 3.4 Socio-economic costs in an uncertain context Investments become extremely important in the future and while electricity exchange is important, the overall design of the entire energy system including thermal and gas grids is more important if a cost-effective system is needed. While investments are long term and will stabilize the overall costs, the costs of biomass and the ability to import and export electricity are important in the short term with the facilities installed. In the past, fuel prices have fluctuated significantly. IDA’s Energy Vision has been analysed using three different fuel price assumptions as well as 10 different assumptions regarding future international electricity market prices for each of the scenarios. This has been done in order to analyse the ability of the energy system to make net earnings on import and export between Denmark and the surrounding countries, while also being subject to changing biomass prices. Socio‐economic costs (Billion €/year) 30 25 20 15 10 5 0 ‐5 Medium 2015 Low Medium High Low DEA 2050 Fossil Investments Medium High Low DEA 2050 Wind O&M Fuels Electricity exchange Medium High IDA 2050 CO₂ Figure 27: Socio‐economic costs of the energy systems analysed including transport for the three different fuel price levels (oil prices equivalent to 62, 105 and 148 $/barrel and 77 €/MWh on the international electricity markets). Net earnings on international electricity markets are illustrated as a negative and should be subtracted to get the total costs of the systems In Figure 27, the overall socio-economic costs of all three fuel price levels are illustrated. A change in fuel costs changes 1) the costs for using fuel domestically and 2) the ability to have an income from international electricity markets. While the costs do vary, the results show that IDA 2050 have lower costs than the DEA scenarios as previously described. With low fuel costs, the net earnings on electricity markets increase and the opposite is the case with high fuel costs. Again this confirms that a fuel-efficient energy system design increases the robustness and resilience overall, confirmed by the fact that the IDA scenarios are better at exploiting all situations. An important effect of different 100% renewable energy system designs is seen in the consumption of biomass. In the DEA Wind 2050 scenario, the biomass costs vary €300 million with the three fuel cost levels, from a total low level of €1,800 million. In IDA 2050, however, the costs vary €350 million from a low level of €1,400 million. One issue is the cost variation and the cost level; another is the effect on the biomass consumption in PJ which is very significant as mentioned earlier in Figure 23. Behind these results are naturally many system dynamics between power plants, boilers and CHP plants. However, not only is it possible to create a more 60 IDA’S ENERGY VISION 2050 cost-effective scenario with overall lower fuel costs and higher earnings on international electricity markets. It is also possible to create a system which is more robust and resilient in a world where biomass resources may be expensive or scarce due to over exploitation. Trade with fuels for electricity, heating and transport, as well as electricity exchange on the Nord Pool spot market are important parts of the current energy supply system. In the future, the characteristics of both the energy supply system and the consumer side will change; however, international cooperation is also important in a future renewable energy context. Current electricity markets, both the Nordic electricity market, Nord Pool Spot, and the central European/German electricity market, EPEX, are set up based on the marginal price setting principle. With this settlement principle, a participant’s profit depends on a more expensive unit also winning. In markets based on marginal price setting, participants submit bids equal to or close to the short-term marginal cost of participation, assuming that no one in the market is exercising market power. As such, the participants’ bidding strategy normally results in units with the lowest short-term marginal costs being employed first; the market is therefore known for keeping total system costs low, even though this does not necessarily cover the long-term costs of the participants who own the power plants or wind turbines in the market. 5 5 0 0 ‐5 ‐5 ‐10 ‐10 ‐15 ‐15 ‐20 ‐20 2015 DEA Fossil 2035 Electricity Import (TWh/year) Net export (TWh/year) DEA Wind 2035 IDA 2035 DEA Fossil 2050 DEA Wind 2050 IDA 2050 Net electricity exchange earnings (Billion €/year) Electricity Exchange (TWh/year) In Figure 28, the electricity exchange and earnings on electricity imports and export are illustrated based on an assumed transmission capacity in and out of Denmark of 4140 MW, a medium fuel price level, and a longterm electricity price of 77 €/MWh. The dispatchable capacities define how much a system can produce and sell on the spot market together with the demand domestically and the transmission capacities installed. In IDA 2035, there is 2,000 MW more CHP and power plant capacity installed than DEA Wind 2035 but the same level as DEA Fossil 2035. In 2050, the capacities are more similar for IDA 2050 and DEA Wind 2050 at 6,000 MW and 5,284 MW. The level of the DEA Fossil scenario is slightly lower in 2050 at 4,399. Electricity Export (TWh/year) Net electricity exchange earnings (Billion €/year) Figure 28: Electricity exchange and earnings on electricity import and export assuming three levels of fuel price assumptions for 2015 as well as the IDA and DEA scenarios. 61 IDA’S ENERGY VISION 2050 While the net earnings of IDA 2035 and IDA 2050 are similar to those of the fossil DEA scenarios, the earnings in DEA Wind are lower. This is due to higher wind and PV capacities in IDA, flexibility on the consumption side in IDA, and higher efficiencies on the power plants and Combined Heat and Power (CHP) plants in IDA. The conclusion that the IDA scenarios have the ability to generate earnings on international electricity markets does not change significantly with ten other electricity price assumptions. Further electricity exchange analyses have been conducted with all 2035 and 2050 scenarios in Figure 29 and Figure 30. Here the three different fuel price levels have been combined with ten levels of electricity prices. Previously, we saw how much of an impact this can have on the biomass consumption; here we illustrate the effects on the overall costs of the system. In the 2035 system, the DEA Wind scenario does not tend to perform as well as the other scenarios decreasing towards lower electricity prices. IDA 2035 performs better or equally well as DEA Fossil 2035, except with low fuel prices, where the capacities and low cost fuels enable DEA Fossil 2035 to out-perform the other systems slightly. Socio‐economic costs (Billion €/year) DEA Fossil 2050 and IDA 2050 perform very similarly under different conditions. Overall, DEA Wind 2050 performs worse than IDA 2050 under all conditions. Again it should be noted that behind this picture are large differences in the consumption of biomass, as illustrated in Figure 24. 24 23 22 21 20 15 31 46 62 77 92 108 123 139 154 Average external electricity price [€/MWh] Low fuel prices DEA Fossil 2035 Medium fuel prices DEA Fossil 2035 High fuel prices DEA Fossil 2035 Low fuel prices DEA Wind 2035 Medium fuel prices DEA Wind 2035 High fuel prices DEA Wind 2035 Low fuel prices IDA 2035 Medium fuel prices IDA 2035 High fuel prices IDA 2035 Figure 29: Total socio‐economic costs of the 2035 energy systems with three levels of fuel prices and 10 different levels of electricity prices. 62 IDA’S ENERGY VISION 2050 26 26 Socio‐economic costs (Billion €/year) 25 25 24 24 23 23 22 22 21 21 20 15 31 46 62 77 92 108 123 139 154 Average external electricity price [€/MWh] Low fuel prices DEA Fossil 2050 Medium fuel prices DEA Fossil 2050 High fuel prices DEA Fossil 2050 Low fuel prices DEA Wind 2050 Medium fuel prices DEA Wind 2050 High fuel prices DEA Wind 2050 Low fuel prices IDA 2050 Medium fuel prices IDA 2050 High fuel prices IDA 2050 Figure 30: Total socio‐economic costs of the 2035 energy systems with three levels of fuel prices and 10 different levels of electricity prices. 63 IDA’S ENERGY VISION 2050 4 Electricity This chapter contains a presentation of the electricity demands and saving levels as well as the electricity supply side of the IDA Energy Vision 2050. A number of sensitivity analyses concludes the chapter assessing the influence of key technologies and assumptions. 4.1 Electricity demands The electricity demands in the scenarios analysed differ for a number of reasons. First of all, electricity savings are implemented in some scenarios and, secondly, a higher degree of electricity is integrated in the heating and transport sectors for especially DEA Wind 2050 and IDA 2050. This is visible from Figure 31 where especially the electrolyser, heat pump and direct electrification in transport are varying across the scenarios. The conventional electricity demand is rather constant in the scenarios, as growth on one side is outweighed by savings on the other for the 2035 and 2050 scenarios. Electricity demands (TWh/year) 100 90 80 70 60 50 40 30 20 10 0 2015 DEA Fossil 2015 DEA Wind IDA DEA Fossil 2035 DEA Wind IDA 2050 Conventional demand Cooling demand Flexible demand+dump transport electricity Smart transport electricity Heat pumps Electrolysers Electric boiler Figure 31: Electricity demands in the 2015, 2035 and 2050 scenarios When analysing the electricity consumption capacities, DEA Wind 2050 and IDA 2050 have higher capacities than the remaining scenarios. In particular, smart transport that is charged intelligently is capable of integrating large amounts of electricity in certain periods. 64 IDA’S ENERGY VISION 2050 Electricity consumption capacities (MW) 30.000 25.000 20.000 15.000 10.000 5.000 0 DEA Fossil 2015 DEA Wind IDA DEA Fossil 2035 DEA Wind IDA 2050 Conventional demand Cooling demand Flexible demand+dump electricity Smart transport Heat pumps Electrolysers Electric boiler Figure 32: Electricity consumption capacities in the 2015, 2035 and 2050 scenarios When considering how these electricity demands are met, the electricity production is also significantly different between the scenarios. The electricity production grows significantly in the DEA Wind 2050 and the IDA scenarios in line with the increasing electricity demands, and the primary growth takes place in renewable production from onshore and offshore wind power as well as solar power. The electricity production from power plants and CHP plants in DEA Wind 2050 and IDA 2050 is lower than in the 2015 reference, indicating that the systems become sufficiently flexible to integrate a larger share of renewables. 65 IDA’S ENERGY VISION 2050 Electricity Production (TWh/year) 120 100 80 60 40 20 0 2015 DEA Fossil 2015 Onshore DEA Wind IDA DEA Fossil 2035 Offshore PV River/wave DEA Wind IDA 2050 Industry and waste CHP Power plant Figure 33: Electricity production in the 2015, 2035 and 2050 scenarios However, the production capacities of power plants and CHP plants are responsible for a larger share of the total capacities than the similar production from these plants. This shows that these plants are primarily providing regulating power in cases where the wind and solar power productions are insufficient to meet the demands. In IDA 2035 and IDA 2050 gasified biomass is used for power plants and CHP plants of the type combined cycle gas turbine. Electricity production capacities (MW) 35.000 30.000 25.000 20.000 15.000 10.000 5.000 0 DEA Fossil 2015 Onshore Offshore DEA Wind IDA DEA Fossil 2035 PV River/wave DEA Wind IDA 2050 Industry and waste CHP and Power plants Figure 34: Electricity production capacities in the 2015, 2035 and 2050 scenarios 66 IDA’S ENERGY VISION 2050 4.2 Electricity savings In the IDA 2050 scenario, electricity savings have been carried out in order to reduce end demands and stay within biomass potentials. The electricity savings described in this chapter only refer to the “classical” electricity demand, i.e., not including increased demands for technologies such as heat pumps or electric vehicles. Electricity demands and saving potentials are not easy to assess as they are impacted by a number of external factors that are hard to foresee. The electricity saving potentials are closely linked to the regulation in place and it is therefore crucial to have an ambitious policy framework within this area to achieve the savings assumed in the IDA scenarios. Future technology improvements are furthermore also affected by EU regulations (e.g., the EcoDesign Directive) that may influence national policies. Also other factors such as economic growth, fuel prices and demographic changes may have a significant impact on the electricity demands and saving potentials in the future. The electricity savings assumed here are therefore based on existing knowledge, but they may change according to future developments in the energy system and the surrounding society. Three different factors affect the future electricity demand in the IDA scenarios; firstly, the increase in the amount of appliances that will lead to higher demands, which is particularly the case for ICT technologies; secondly, the technical savings that are possible to implement, and thirdly, the savings that can be carried out due to behavioural changes. These potentials have been assessed for the IDA 2035 and IDA 2050 scenarios. In regard to the technical electricity savings, it is assumed that technology development and an enhanced regulation along with more ambitious policies for savings may lead to technical saving potentials of 6% in 2035 and 15% in 2050 compared to today. In addition, behavioural changes also contribute to a reduced electricity demand of 8% in 2035 and 20% in 2050. Some of these savings are then on the other hand negated by an increase in appliances. This increase leads to an increase in electricity demand of 4% in 2035 and 10% in 2050. When considering the savings and the increase in appliances the overall electricity demand reduction is 10% in 2035 and 25% in 2050 compared to the 2015 reference. In other studies even more ambitious saving potentials have been assessed [13]. Table 6. The technical and behavioral savings and the increase in appliances Saving - technical More appliances Behavioural savings Total savings Savings (TWh) IDA 2035 6% -4% 8% 10% 0.89 IDA 2050 15% -10% 20% 25% 2.22 The costs of implementing these electricity savings are calculated based on an electricity price of 0.31 €/kWh and a payback time of four years. In addition, a decrease in prices of 50% has been implemented due to the dominance of efficient technologies in the market [21]. The total investments in electricity savings have been assessed as 545 M€ in 2035 and 1364 M€ in 2050 with a lifetime of 10 years. 4.3 Flexible electricity demands Some of the electricity demand for households and industry and services has been assessed as a potential for flexible demands. For industries and services, it is assumed that 10% of the electricity demand can be moved over one day while 2% can be moved over one week. For households, the shares are 10% for one day and 5% for one week. These potentials are assumed to be similar for both 2035 and 2050. The investments 67 IDA’S ENERGY VISION 2050 in smart meters for small consumers are 85€ and for large consumers it is 855€ [22]. It is estimated that the total number of large consumers that need to install smart meters are 250,000; for small consumers, the amount is 350,000, and for households, it is 2,600,000 [23][24][25]. When applying these costs the investments are 222 M€ for households and 244 M€ for industries resulting in a total investment of 466 M€ in both 2035 and 2050. 4.3.1 Sensitivity analysis of electricity savings and flexible demand In order to identify the impact of electricity savings and flexible demands, these have been analysed in a number of sensitivity analyses. Concretely, the impacts of increasing and decreasing, respectively, the electricity savings and the flexible electricity demand on primary energy and system costs have been analysed. Changes in Primary Energy Supply (TWh/year) Figure 35 shows the impact on primary energy, where it is visible that a higher level of electricity savings can contribute to reducing the biomass demand, as less electricity is produced from power plants. The same impact is clear when increasing the flexible demand; while a reduced amount of flexible demand only leads to a slightly higher biomass demand. 1,5 1,0 0,5 0,0 ‐0,5 ‐1,0 ‐1,5 ‐2,0 Electricity savings + 50% Electricity savings ‐50% Flexible demand ‐50% Flexible demand +50% IDA 2050 Coal Oil Gas Biomass/waste Onshore Offshore PV Wave/tidal Geothermal Solar thermal Total Figure 35: Changes in primary energy demand when changing the electricity savings and the flexible electricity demand When implementing more electricity savings, the overall costs of the system increase, while reduced savings will create a less expensive system. For flexible demands, an increased level reduces the costs, as the fuel savings are greater than the additional investments required. The impacts on socio-economic costs are, however, limited compared to the overall system costs. It can, however, be concluded that a more flexible demand can reduce both biomass demand and costs, while more electricity savings improve the fuel demand, but also creates a more costly system. 68 Changes in Socio‐economic costs (Billion €/year) IDA’S ENERGY VISION 2050 0,15 0,1 0,05 0 ‐0,05 ‐0,1 ‐0,15 Electricity savings + 50% Electricity savings ‐50% Flexible demand ‐50% Flexible demand +50% IDA 2050 Investments O&M Fuels Electricity exchange CO₂ Total Figure 36: Changes in socio‐economic costs when changing the electricity savings and the flexible electricity demand 4.4 Renewable electricity The onshore wind capacity in Denmark is currently 3,759 MW with an annual production of around 7.19 TWh. An expansion potential for onshore wind turbines exists, but is restricted by planning regulations that require wind turbines to be placed at a distance of 4 times the height of the wind turbine from buildings, as well as outside protected areas. However, recently Energinet.dk released a report examining the onshore potential with the possibility of buying up buildings to create more space for onshore wind turbines. The report concludes that a total onshore potential of 12 GW wind capacity is socio-economically more attractive than building offshore wind capacity [26]. The primary reason behind the feasibility is that the price for onshore wind projects is around 1.2 M€/MW in 2013-2014, which is low compared to offshore with a price between 2.5-4 M€/MW [27]. Therefore, IDA Energy Vision 2050 proposes an expansion of the onshore wind capacity to 3,875 MW in IDA2035 and 5,000 MW in IDA2050. The development of onshore wind capacity is illustrated in Figure 37. 69 IDA’S ENERGY VISION 2050 DEA Wind Figure 37: Development of onshore wind capacity As seen in Figure 37, IDA Energy Vision 2050 follows the development of the DEA wind scenario closely until the year 2035; after that, the DEA wind scenario stops the onshore expansion while the IDA Energy Vision 2050 scenario continues to 5,000 MW capacity. The capacity factors as well as economic costs for onshore wind turbines are based on [11] and are shown in Table 7. Table 7: Onshore wind turbines [28] Capacity Capacity factor Production Investment O&M MW % TWh/year M€/MW €/MWh IDA 2035 3,875 37 12.5 1 8 IDA 2050 5,000 37 16.2 0.9 8 The offshore wind capacity in Denmark is currently 1,271 MW with an annual production of around 4.35 TWh. The economic costs of offshore wind power depend on the water depth, the distance to shore as well as the size of the wind farm. This means that as more offshore is built, less favourable locations needs to be used, making offshore increasingly more expensive. On the other hand, technological development could lower the costs. IDA Energy Vision 2050 proposes a similar large-scale deployment of offshore wind turbines as the DEA wind scenario, as shown in Figure 38. The proposal is a significant increase in capacity to 5,887 MW in IDA2035 and further to 14,000 MW in IDA2050. 70 IDA’S ENERGY VISION 2050 DEA Wind Figure 38: Development in offshore wind capacity for IDA Energy Vision 2050 The capacity factors as well as economic costs for offshore wind turbines are based on [11], see Table 8. The capacity factor is expected to increase slightly between 2035 and 2050 due to technological development. The investment costs include grid connection to the shore Table 8: Offshore wind turbines [28] Capacity Capacity factor Production Investment O&M MW % TWh/year M€/MW €/MWh IDA 2035 5,887 51 26.3 2.43 16 IDA 2050 14,000 52 63.76 2.12 15 Since the beginning of 2012, the number of photovoltaic (PV) plants in Denmark has increased significantly. Before 2012, the total number of plants was below 5,000, while in 2015 this has increased to 91,680 and with a total capacity of 629 MW. However, the increase in capacity was primarily in the years 2012-2013 and has since stagnated due to changes in subsidies for PV. This development is illustrated in Figure 39. 71 IDA’S ENERGY VISION 2050 Figure 39: Number of photovoltaic plants in Denmark [29] The PV development exemplifies that it is possible to install a large capacity within a short timeframe. Furthermore, the International Energy Agency expects the price of PV modules to halve within the next two decades and fall to approximately 0.28-0.36 M€/MW [30]. Therefore, IDA Energy Vision 2050 expects that it is possible to increase the PV capacity to 3,127 MW in IDA2035 and 5,000 MW in IDA2050. This is illustrated in Figure 40. DEA PV Figure 40: Development of photovoltaics in IDA Energy Vision 2050 As seen Figure 40, the expected capacity of PV is significantly higher in IDA Energy Vision 2050 than in the DEA wind scenario. The capacity factors as well as economic costs for PV are based on [11] and are shown in Table 9. 72 IDA’S ENERGY VISION 2050 Table 9: Capacities, production and costs for PV [28] Capacity Capacity factor Production Investment O&M MW % TWh/year M€/MW €/MW/year IDA 2035 3,127 14 3.8 0.82 8,160 IDA 2050 5,000 14.5 6.35 0.69 6,940 Wave power has a great potential but is still a technology that needs to mature. In Denmark, around 14 test sites of varying sizes for wave power technologies exist today [31]. Nevertheless, IDA Energy Vision 2050 includes a moderate deployment of wave energy of 175 MW in IDA2035 and 300 MW in IDA2050. 4.4.1 Sensitivity analysis for renewable electricity production Changes in Primary Energy Supply (TWh/year) Different levels of PV production have been analysed in sensitivity analyses. The impact of increasing the PV level and installing a different mix of electricity production than in the IDA 2050 scenario is analysed. When increasing the PV production by 25%, the biomass demand is reduced and the opposite occurs when reducing the PV production. It is also found that more fuel is used when installing more wind power instead of solar power, and that more PV instead of wind reduces the biomass demand. 10 8 6 4 2 0 ‐2 ‐4 ‐6 ‐8 ‐10 PV production PV production ‐ Replace all PV Replace all PV +25% 25% with onshore with offshore More PV less onshore More PV less offshore Renewable electricity Production IDA 2050 Coal Oil Gas Biomass/waste Onshore Offshore PV Wave/tidal Geothermal Solar thermal Total Figure 41: Changes in Primary energy demand when changing the PV production and altering the electricity production mix In terms of costs, an increased PV production leads to lower expenses as the fuel cost savings exceed the additional investments. If the PV production is replaced by wind power, the total costs will increase regardless of whether it is onshore or offshore wind power production. Finally, an increased PV production at the expense of onshore wind power leads to higher costs, but if the additional PV production replaces offshore wind power, 73 IDA’S ENERGY VISION 2050 Changes in Socio‐economic costs (Billion €/year) the system costs improve. The overall changes in terms of socio-economic costs when altering the PV production are, however, rather insignificant. 0,15 0,1 0,05 0 ‐0,05 ‐0,1 PV production PV production ‐ Replace all PV Replace all PV +25% 25% with onshore with offshore More PV less onshore More PV less offshore Renewable electricity Production IDA 2050 Investments O&M Fuels Electricity exchange CO₂ Total Figure 42: Changes in socio‐economic costs when changing the PV production and altering the electricity production mix 74 IDA’S ENERGY VISION 2050 5 Heating and cooling This chapter describes the heating and cooling sectors in IDA Energy Vision 2050 in terms of heating production and demands. Sensitivity analysis concludes that chapter with assessments of key technologies in the heating sector. 5.1 Heat demand in buildings To achieve a future Smart Energy System in Denmark, energy savings play a key role. Thus, it is important to consider future heat demands in buildings. This consideration requires a focus on the future demand in buildings existing today and the heat performance of a new building stock that currently does not exist. This section describes the identified levels in IDA’s Energy Vision. In all the scenarios for 2035 and 2050 a growing building area is assumed compared to 2015 and this results in a growing heat demand. However, due to savings in the existing buildings and the construction of new buildings that leads to lower heat demands the overall heat demand is reduced in all the 2050 scenarios compared to the 2015 reference. In addition, there is a difference between the scenarios in terms of district heating shares. In the IDA scenarios a more ambitions district heating level is implemented leading to a district heating share of 66% in the IDA 2035 and 2050 scenarios. The share in the DEA Wind and Fossil scenarios for 2035 are 53% and in 2050 these scenarios reach a district heating share of 55%. This also means that the individual heating demand is higher in the DEA scenarios. 50 550 530 510 490 30 470 20 450 430 10 410 Building area (million m2) Heat demands (TWh/year) 40 390 0 370 ‐10 350 2015 DEA Fossil 2015 DEA Wind IDA DEA Fossil 2035 District heat demand Individual heat demands DEA Wind IDA 2050 Imbalances Building area Figure 43: Heat demands and heating imbalances along with the building area in the 2015, 2035 and 2050 scenarios The investments for expanding the district heating networks are calculated based on [32]. The district heating expansion costs can be found in Table 10 and is calculated based on the level of district heating that is achieved as the marginal costs of expansions increase when reaching a higher level. In Table 10 the estimated 75 IDA’S ENERGY VISION 2050 value of the existing district heating network is also included based on [32]. All the district heating investments are based on a lifetime of 40 years and 1.25% O&M of the investment. Table 10: District heating investment and O&M costs District heating costs Existing network District heating expansion 5.1.1 Unit Investment - Million € Annual costs Million €/year Investment - Million € Annual costs Million €/year Reference 2015 DEA Fossil and DEA Fossil and Wind 2035 Wind 2050 16,703 IDA 2035 and 2050 931 0 0 171 5,448 0 0 9 304 Heat demand in the existing building stock Based on the NZEB report [33], IDA’s Energy Vision estimates the current average heat demand in buildings at 131.76 kWh/m2 including a domestic hot water demand of 13.7 kWh/m2. By applying the methodology and results described in the NZEB report, it is possible to identify the heat performance level of future buildings. Figure 1 shows the main outcome of this report. The NZEB reports estimates that existing buildings should be refurbished to a future heat demand of 82 kWh/m2 in 2050. These numbers are slightly conservative; thus, IDA’s Energy Vision uses 78.79 kWh/m2. This totals a future heat demand in existing buildings of 32.94 TWh. Based on the cost assumptions in the NZEB report, see the supplementary report - “Technical data and methods” [7], the refurbishments require a total investment costs of 31.07 billion €. To reach this level of savings at the estimated costs, the NZEB report stresses that the necessary improvements to the building envelope have to be made when buildings are refurbished anyway. It is too expensive to renovate buildings twice before 2050, due to the high investment costs and the long lifetime of the building envelope. A second key point from the NZEB report is that it may not be necessary to renovate all existing buildings. Instead, the goal is to refurbish the most cost-efficient buildings as much as possible, and give a lower priority to the renovation of those buildings where renovation would be most expensive. The average heat demand of this is expected to equal the 78.79 kWh/m2, but some buildings will perform better, while others worse. Towards 2035, the goal is to achieve 65% of the reductions. This equals a heat demand in existing buildings of 40.72 TWh at a total investment cost of € 18.71 billion. The DEA estimates the future heat demand in existing buildings at 34.99 TWh in 2050[34]. Based on the cost assumptions in the NZEB report described in the supplementary report - “Technical data and methods” [7], the estimated total investment costs are € 27.55 billion. In 2035, the DEA assumes that the demand is 43.26 TWh, thus 59% of the savings are achieved. Based on the NZEB report, this corresponds to total investment costs of € 15.18 billion. Table 11 summarizes the savings in the different scenarios and the costs related to achieving these savings. 76 IDA’S ENERGY VISION 2050 Table 11: Heat demand reduction in existing buildings and associated cost assumptions. REF 2011 DEA 2035 DEA 2050 IDA 2035 IDA 2050 55.08 43.26 34.99 40.72 32.94 Total investment costs [Billion €] 0 15.18 27.55 18.71 31.07 Lifetime [Years] 50 50 50 50 50 Fixed operation and maintenance [% of investment] 0 0 0 0 0 Demand [TWh] 5.1.2 Heat demand in new buildings Based on data from the NZEB report, new buildings currently perform at a level 67.13 kWh/m2 including a domestic hot water demand of 13.7 kWh/m2. To achieve IDA’s Smart Energy Vision, these buildings should achieve a net heat demand of 56 kWh/m2 as estimated in the NZEB report. Figure 44 indicates this result. Based on the DEA’s assumptions [2], the total new buildings in 2035 equal 63.11 million m2 and in 2050 112.95 million m2. With the assumed level of performance of new buildings, the total heat demand is 3.53 TWh in 2035 and 6.33 TWh in 2050. The costs of improving the standards of new buildings are estimated at € 0.85 billion in 2035 and € 1.52 billion in 2050. It is important to note that these costs are all tied to improving the building envelope; thus, this differs from the current building code where it is possible to include photovoltaics. The DEA assumes that the heat demand in new buildings is 2.92 TWh in 2035 and 4.04 TWh in 2050. It is unclear to which extent the DEA uses production units such as photovoltaics to reach this demand as they point to the Danish building standards as relevant for new buildings [34]. If these are based on the performance of the building envelope, the demand is calculated as 46.26 kWh/m2 in 2035 and 35.73 kWh/m2 in 2050. The DEA does not estimate any costs, but the NZEB cost curves are used for comparison. Based on this, the total investment costs are estimated at € 3.29 billion in 2035 and € 13.70 billion in 2050. This can be seen in the supplementary report - “Technical data and methods” [7]. Table 12 shows the different scenarios and the related costs. Table 12: Heat demand reduction in new buildings and associated cost assumptions. Demand [TWh] Total investment costs [Billion €] Lifetime [Years] REF 2035 REF 2050 DEA 2035 DEA 2050 IDA 2035 IDA 2050 4.24 7.58 2.92 4.04 3.53 6.33 0 13.70 3.29 13.70 0.85 1.52 50 50 50 50 50 50 0 0 0 0 0 0 Fixed operation and Maintenance [% of investment] 77 IDA’S ENERGY VISION 2050 Figure 44. Marginal costs for reducing heat demand in existing and new buildings compared to marginal costs of providing more energy in the CEESA 2050 energy system [33]. 5.1.3 Sensitivity analysis of heat demands The sensitivity analysis of the heat demand in buildings follows three paths. The first investigates what happens if Denmark does not implement heat savings in the existing building mass. The second investigates the consequences of introducing higher standards in IDA’s Energy Vision than the main suggestions. The third path investigates the consequences of not achieving a 66% district heating share. No savings in existing households One of the arguments in this report is that extensive heat savings are required, but also that at some point, production becomes cheaper than savings. To test the argument, this section analyses three alternative scenarios. These are: No savings in existing buildings 50 % less savings than in IDA’s Energy Vision 2050 50 % more savings than in IDA’s Energy Vision 2050 To compare these scenarios with IDA’s Energy Vision, the sensitivity study uses total annual costs and primary energy supply. For the analysis of these three scenarios, it is necessary to adjust IDA’s Energy Vision 2050. First, the change of the heat demand changes the distribution curves due the fixed domestic hot water demand. Second, the boiler capacity is changed in the district heating networks to accommodate for the higher demands in district heating. Third, the costs of district heating are changed, since it has to supply a higher demand. Fourth, 78 IDA’S ENERGY VISION 2050 individual heat pump and boiler demands are also changed to accommodate for higher demands in individual heating. Overall, these changes should reduce the costs of heat savings, but increase the costs of producing energy. Table 13 summarises the inputs for the different scenarios. Table 13. Inputs for IDA’s Energy Vision’s sensitivity of heat savings in existing buildings. Decentral DH Central DH Indiv. boilers Indiv. HP Heat saving costs DH Investment costs Decentral DH boiler Central DH boiler IDA's Energy Vision 12.94 22.3 1.59 13.07 32,592 5448 4,400 7,600 No savings in existing buildings 19.65 33.87 2.41 19.85 1,517 8,058 7,600 13,100 50% less savings 16.3 28.09 2 16.46 15,697 6,753 6,100 10,500 50% more savings 9.59 16.53 1.17 9.69 56,473 4,144 2,800 4,800 Figure 45 shows the changes in total annual system costs and Figure 46 shows the changes in primary energy supply. Figure 45. Total annual costs of the Danish Energy System depending on the level of savings in existing buildings 79 IDA’S ENERGY VISION 2050 180 Primary Energy Supply [TWh] 160 140 120 100 80 60 40 20 0 No savings 50 % less savings Savings in IDA's Energy Vision Fluctuating renewables 50 % more savings Biomass Figure 46. Primary energy supply of the Danish Energy System depending on the level of savings in existing buildings From Figure 46, it is seen that the primary energy supply drops when savings are increased, and Figure 45 shows that the total annual costs drops until a certain level is reached. At that point, the costs increase again. In combination, these figures present the argument that even though it is possible to continue to decrease the primary fuel use, the cost at some point becomes too excessive. On the other hand, the analysis also shows that a system with a high reduction in heat demand is cheaper than one without savings. This underlines the viewpoint that Denmark has to start renovating existing houses to achieve a more efficient energy system in 2050, both in terms of costs and in terms of primary energy use. Consequences of higher standards in new buildings Sensitivity analyses have been made to investigate the consequences of higher standards for new buildings. As these buildings have not yet been built, it becomes important to see the coherence between heat demand and building standards. The analysis compares IDA’s Energy Vision to two alternatives: A demand in new buildings of 43.82 kWh/m2 A demand in new buildings of 35.73 kWh/m2 The sensitivity analysis compares total annual system costs and primary energy consumption. Due to the relatively small changes in total heat demands, the demand curves are not changed in this sensitivity analysis. Like in the analysis of existing buildings, the costs for renovation and district heating costs are related to changes in demand. In district heating areas, the boiler capacity is lowered, while in individual areas, the sizes of individual boilers and heat pumps are lowered. This should take into account fewer investments in energy producing units due to higher demand reductions. Table 14 summarizes the inputs in the two alternatives and the reference. 80 IDA’S ENERGY VISION 2050 Table 14. Inputs for IDA’s Energy Vision’s sensitivity to higher requirements to new buildings. Decentral DH Central DH Indiv. boilers Indiv. HP Decentral DH boiler Central DH boiler Heat saving costs DH investments IDA's Energy Vision 12.94 22.3 1.59 13.07 4400 7600 32592 5448 Heat performance of 43.82 kWh/m2 12.52 21.59 1.53 12.65 4300 7400 38443 5432 Heat performance of 35.73 kWh/m2 12.25 21.11 1.5 12.37 4200 7200 44744 5375 The results comparing these three scenarios are seen in Figure 47 and Figure 48. 23200 Total annual costs [Million €] 23100 23000 22900 22800 22700 22600 22500 IDA's Energy Vision 2050 Heat performance 43.82 kWh/m2 Heat performance 35.73 kWh/m2 Figure 47. Total annual costs of the Danish Energy System depending on the heat demand in new buildings 81 IDA’S ENERGY VISION 2050 180 Primary energy supply [TWh] 160 140 120 100 80 60 40 20 0 IDA's Energy Vision 2050 Heat performance 43.82 kWh/m2 Fluctuating renewables Heat performance 35.73 kWh/m2 Biomass Figure 48. Primary energy supply of the Danish Energy System depending on the level of savings in new buildings The results show that an increased requirement to new buildings does not really change the primary energy supply of the total system. The total changes are not that significant, and the system still needs to produce electricity for transport. This is in accordance with [35]. However, an increase in the level of performance of new buildings does lead to higher annual system costs. This builds a case, where the costs of extremely high heat performance standards of new buildings do not carry any significant benefit. These costs could instead be used in other parts of the systems, such as heat savings in existing buildings or energy production units. While it is important to identify standards for new buildings and have a low heat consumption in these, this sensitivity analysis compared with the previous analysis on existing buildings shows that refurbishing existing buildings play a key role in the transition to a 100 % renewable smart energy system. Consequences of not reaching 66 % district heating The third sensitivity analysis performed on the heating demands concerns how much is covered by district heating and how much is heated individually. The goal is to see what happens if we do not reach a district heating share of 66%. Therefore, the study compares IDA’s Energy Vision with a scenario that has a district heating share of 50.5%. This study compares total annual system costs, but emphasises a comparison of the integration of renewable energy in the energy system. The main points of comparison will therefore be power plant production and import/export of electricity. To construct this scenario, demand is moved from district heating to individual heating. The ratio between decentralised and central district heating is kept as well as the ratio between individual biomass boilers and individual heat pumps. As a result, no investments are made in the expansion of the district heating grid, and the boiler capacity in district heating grids is reduced. Other production units are kept fixed even though they might be scaled as well. On this basis, the cost comparison might not be complete; however, by fixing the district heating heat pump and CHP capacities, the system effect becomes more obvious. Table 15 highlights the inputs for the scenarios. 82 IDA’S ENERGY VISION 2050 Table 15. Inputs for IDA’s Energy Vision’s sensitivity to different district heating shares. Decentral DH Central DH Indiv. boilers Indiv. HP Decentr al DH boiler Central DH boiler DH Investme nts IDA's Energy Vision 12.94 22.3 1.59 13.07 4400 7600 5448 District heating share of 50.5 % 9.89 17.06 2.32 19.03 3400 5800 0 Figure 49 and Figure 50 show the results of the scenario. Total annual system costs [Million €] 23050 23000 22950 22900 22850 22800 22750 22700 22650 22600 IDA's Energy Vision District heating share of 50.5% Scenario Figure 49. Total annual systems costs depending on level of district heating 83 IDA’S ENERGY VISION 2050 16 Electricity production [TWh] 14 12 10 8 6 4 2 0 IDA's Energy Vision District heating share of 50.5% Scenario Import Export Power plant Figure 50. Electricity production on power plants, and import and export of electricity depending on level of district heating Figure 49 shows that the costs for the system become higher if less district heating is implemented. Some of this difference could be reduced with less CHP in the system, but the 50.5 % DH share system is still more expensive due to the higher investment in individual boilers and heat pumps. Second, Figure 50 shows that the system will be more dependent on electricity production on power plants and slightly more dependent on electricity import. This is due to the fact that more heat is produced on individual heat pumps, while biomass boilers in the district heating system are reduced. This actually lowers the Danish domestic fuel use slightly, but creates a higher demand from the surrounding energy systems. Overall, it does not mean a great difference to the energy system whether district heating is increased, but the costs are higher due to higher investment costs in individual heating equipment. 5.2 Heat production In this section, the heat production is described for individual and district heating. The individual heating levels are higher in the DEA Fossil and Wind scenarios for 2035 and 2050 than in the IDA 2035 and 2050 scenarios. This is because of the district heating conversion levels that differ between the scenarios. The current natural gas boilers are phased out almost completely in all the 2035 scenarios and replaced by biomass boilers and heat pumps. In 2050, the heat pump levels are even higher, in particular in DEA Wind 2050 where all individual heat is supplied from heat pumps and a small share of solar thermal. In IDA 2050, a small share of biomass boilers are still in the system, as it is expected that there will be areas where biomass is readily available or very cheap and a conversion to heat pumps therefore seems unrealistic. 84 IDA’S ENERGY VISION 2050 Individual heat demand (TWh/year) 25 20 15 10 5 0 2015 DEA Fossil 2015 Coal boiler DEA Wind IDA DEA Fossil 2035 Oil boiler Natural gas boiler DEA Wind IDA 2050 Biomass boiler Heat pumps Electric heating Solar thermal Figure 51: Individual heat demands in the 2015, 2035 and 2050 scenarios The district heating production is covered by numerous sources as can be seen in Figure 52. In 2015 and 2035, a large share of the district heating demand is covered by CHP plants, while this share decreases in DEA Wind 2050 and IDA 2050 and is replaced by more heat pumps and excess heat from the production of transport fuels and from industry. In the IDA 2050 scenario, almost no district heating boilers are in operation as they are replaced by more flexible and efficient heat pumps. District heating imbalances also increase, in particular in DEA Wind 2050 due to the increase in baseload production from transport fuel plants. This baseload production allows less integration of more flexible technologies, such as CHP plants and heat pumps, which results in imbalances in the summer periods. 85 IDA’S ENERGY VISION 2050 District Heating Production (TWh/year) 50 40 30 20 10 0 ‐10 ‐20 2015 DEA Fossil DEA Wind 2015 Solar thermal IDA DEA Fossil 2035 Industry and geothermal CHP DEA Wind IDA 2050 Heat pumps Boilers Electric heating Waste Imbalance Figure 52. District heating production in the 2015, 2035 and 2050 scenarios 5.3 Renewable heat In this section the potentials for renewable heat sources for district heating is assessed. 5.3.1 Geothermal The current district heating production from geothermal energy is 0.08 TWh/year, which is supplied from three facilities in Thisted, Copenhagen and Sønderborg. Theoretically, the geothermal energy potential can cover the entire district heating demand in Denmark, but it is not economically feasible or physically possible to establish geothermal plants everywhere, and geothermal plants are not suitable for producing peak load [21]. The geothermal input for district heating in the IDA 2035 scenario is assumed to be in total 10% of the production in the decentralised district heating areas and 15% in the central district heating areas. This makes a total geothermal input of 5.0 TWh in the IDA 2035 scenario, and 4.6 TWh in the 2050 scenario. The decrease in the input is caused by reduced heat demands and thereby a lower capacity is needed to cover the 10% and 15% respectively. The applied values are presented in Table 16 and compared with the Fossil and Wind scenarios from the DEA. Table 16: Geothermal inputs assumed in the DEA scenarios and IDA Energy Vision 2050 scenarios for 2035 and 2050. (TWh) 2035 2050 DEA Fossil Scenario 0.2 0.3 DEA Wind Scenario 1.3 1.2 IDA Energy Vision 2050 5.0 4.6 86 IDA’S ENERGY VISION 2050 Table 17 shows the cost assumptions for geothermal energy supply for district heating for 2035 and 2050. The values are obtained from [11]. Table 17: Cost assumptions for geothermal energy in the IDA Energy Vision 2050 scenarios. Investment cost (M€/MJ/s) IDA Energy Vision 2035 IDA Energy Vision 2050 5.3.2 Fixed O&M (€/MJ/s/year) Variable O&M Technical lifetime (years) 1.8 47,000 - 25 1.8 47,000 - 25 Solar thermal Solar thermal plants contribute today (2015) with 0.28 TWh/year to district heating production from a large number of relatively small plants distributed all over the country. See Figure 53. Figure 53 shows the areas with solar thermal district heating and the heat demand densities in Denmark. It can be seen that the solar thermal district heating systems are almost only located at places with relatively low heat demands and hardly any solar thermal can be found in the district heating systems of the big cities (Copenhagen, Aarhus, Odense, Aalborg, Esbjerg). This indicates that solar thermal heat is more cost-effective in small district heating systems than in large ones. This is reflected in the assumptions for the scenarios where the decentralised district heating areas have the largest solar thermal input. Figure 53: Map of solar thermal district heating and heat demand density in Denmark [36]. 87 IDA’S ENERGY VISION 2050 The solar thermal energy input for district heating production is assumed to be 25% in the decentralised areas and 5% in the centralised areas. Because of reductions in the district heating demand, the total input is reduced from 2.4 TWh to 2.2 TWh from 2035 to 2050. In the small district heating areas, the coverage from solar thermal can reach 50%. To accommodate the large integration in these areas, a total thermal storage capacity of 30 GWh is assumed for these. This is described further in the following Section 5.3.4 about Thermal energy storage. The applied values are presented in Table 18 and compared with the Fossil and Wind scenarios from the DEA. Table 18: Solar thermal inputs for the DEA scenarios and the IDA Energy Vision 2050 scenarios for 2035 and 2050. (TWh) 2035 2050 DEA Fossil Scenario 1.0 1.7 DEA Wind Scenario 1.0 1.7 IDA Energy Vision 2050 2.3 2.2 Table 19, presents the cost assumptions for solar thermal energy supply for district heating for 2035 and 2050. The values are obtained from [11]. Table 19: Cost assumptions for solar thermal energy in the IDA Energy Vision 2050 scenarios. Investment cost (M€/TWh/year) Fixed O&M (€/MWh) Technical lifetime (years) IDA Energy Vision 2035 307 - 0.57 30 IDA Energy Vision 2050 307 - 0.57 30 5.3.3 Variable O&M Large-scale heat pumps This section presents large-scale compression heat pumps for district heating used in the scenarios. The purpose of the heat pumps is to utilise electricity in a flexible way to balance fluctuations in the supply from wind or solar power. The existing heat pump capacity for the production of district heating in Denmark is less than 30 MW heat output. In the IDA scenarios, the largest capacities of heat pumps are located in the central CHP areas with 1,400 MW and 1,050 MW in the decentralised areas. This is opposite to the DEA Wind scenario, where the largest capacities are located in the decentralised district heating areas. In the IDA scenarios, the heat pumps are able to replace more fuel consumption in the centralised areas and the total costs of the system are lower with this setting. The applied values are presented in Table 20 and compared with the Fossil and Wind scenarios from the DEA. Table 20: Large heat pump capacities for the DEA scenarios and the IDA Energy Vision 2050 scenarios for 2035 and 2050. (MW-th) 2035 2050 DEA Fossil Scenario 0 0 DEA Wind Scenario 650 1,050 2,450 2,450 IDA Energy Vision 2050 Studies have shown that there are available heat sources for large heat pumps everywhere in the country. Heat sources have different levels of quality and quantity depending on the location, and local assessments 88 IDA’S ENERGY VISION 2050 should be performed to evaluate their feasibility for heat pumps. In the cities with high district heating demands, the high temperature heat sources can be scarce, and ambient temperature heat sources, such as sea water, may be needed. In Table 21, the cost assumptions for large heat pumps for district heating are presented for 2035 and 2050. The values are obtained from [11]. Table 21: Cost assumptions for large heat pumps in the IDA Energy Vision 2050 scenarios. (Assuming a COP of 3.5) Investment cost (M€/MJ/s) (% of investment) IDA Energy Vision 2035 0.98 IDA Energy Vision 2050 0.83 5.3.4 Fixed O&M Variable O&M Technical lifetime (years) 2.0 - 25 2.0 - 25 Thermal energy storage In Denmark, today the most common type of thermal storage is tank thermal energy storages in connection to district heating plants, which improve the flexibility of the CHP operation. However, an increasing number of pit thermal energy storages, used for seasonal storage, are being implemented these years, with the main purpose to accommodate larger amounts of solar thermal heat. The DEA energy scenarios for 2035 and 2050 use thermal energy storages, but it is not mentioned in the report exactly which capacities are assumed in those scenarios. For the DEA scenarios and the IDA scenarios for both 2035 and 2050, the tank thermal storage capacities are assumed to be 320 GWh. The capacity of pit thermal energy storage is assumed to increase because of the increased level of solar thermal capacity. The level of the Reference scenario for 2015 is 10 GWh and this is assumed to increase to 30 GWh in 2035. This level is kept in the IDA 2050 scenario. In this study, pit thermal energy storage has only been assumed for solar thermal seasonal storage, but it can potentially be applied to other inflexible heat sources as well, such as geothermal or waste incineration heat production. Table 22 presents the cost assumptions for tank thermal energy storage for district heating for 2035 and 2050. The values are obtained from [11] and [37]. Table 22: Cost assumptions for tank thermal energy storage in the IDA Energy Vision 2050 scenarios. Investment cost (M€/GWh) Fixed O&M Variable O&M Technical lifetime (years) (% of investment) IDA Energy Vision 2035 3 0.7 - 20 IDA Energy Vision 2050 3 0.7 - 20 In Table 23, the cost assumptions for pit thermal energy storage are presented for 2035 and 2050. The values are obtained from [11] and [37]. 89 IDA’S ENERGY VISION 2050 Table 23: Cost assumptions for pit thermal energy storage in the IDA Energy Vision 2050 scenarios. Investment cost (€/m3) (% of invest./year) IDA Energy Vision 2035 0.49 IDA Energy Vision 2050 0.43 5.3.5 Fixed O&M Variable O&M Technical lifetime (years) 0.7 - 20 0.7 - 20 Sensitivity analysis of renewable district heat production Changes in Primary Energy Supply (TWh/year) In the IDA 2050 scenario, a number of different renewable heat production technologies have been installed and a sensitivity analysis investigates if more or fewer of these technologies should be installed. The technologies that have been analysed are an increase and decrease in, respectively, the solar thermal, geothermal and industrial excess production. Besides these technologies, more renewable heat technologies have been analysed in detail in Chapter 8. For all three technologies the biomass demand increases when reducing the production from the district heating technology and the biomass demand decreases when installing a higher production. 3 2 1 0 ‐1 ‐2 ‐3 Solar thermal ‐ Solar thermal 50% +50% Geothermal ‐ 50% Geothermal +50% Industrial excess ‐50% Industrial excess +50% Heat supply in IDA 2050 Coal Oil Gas Biomass/waste Onshore Offshore PV Wave/tidal Geothermal Solar thermal Total Figure 54: Changes in Primary energy demand when changing the renewable heat production for district heating These technologies only have a limited impact on the socio-economic costs when increased or decreased. When increasing the solar thermal and geothermal production the overall system costs increase as the 90 IDA’S ENERGY VISION 2050 Changes in Socio‐economic costs (Billion €/year) additional investments exceed the fuel savings. However, for industrial excess heat production an increase in production results in lower costs. The difference between the technologies is the heat production price that is significantly lower for industrial excess heat. 0,06 0,04 0,02 0,00 ‐0,02 ‐0,04 ‐0,06 ‐0,08 Solar thermal ‐ Solar thermal 50% +50% Geothermal ‐ 50% Geothermal +50% Industrial excess ‐50% Industrial excess +50% Heat supply in IDA 2050 Investments O&M Fuels Electricity exchange CO₂ Total Figure 55: Changes in socio‐economic costs when changing the renewable heat production for district heating 5.4 Cooling A total demand of cooling in Denmark is estimated at 9.5 TWh/year in a report describing a cooling plan for Denmark [38]. The cooling demand is found to be evenly distributed between comfort cooling mainly occurring during the summer and process cooling occurring evenly distributed over the year. It is assumed that the saturation rate of cooling is currently approximately 80%, meaning that 80% of cooling demand is being met, resulting in a demand of 7.6 TWh/year. Currently, air conditioning units using electricity meet the majority of the cooling demand in Denmark. However, there is a large potential for supplying some of the cooling demand as district cooling. District cooling incorporates some of the same advantages as district heating. The peak production demand is reduced by the fact that several consumers with different consumption profiles are connected; it is possible to incorporate large-scale storage and it is possible to include a mix of sources for the cooling production. The production of cooling in a district cooling system depends on local conditions. District cooling can be produced from a mix of sources such as groundwater, ambient sources and heat pumps. It is possible to utilise the heat produced on heat pumps at the same time as the cooling and thereby optimize the system performance. In the energy model, cooling is divided into four groups: Compression cooling (low temperature), compression cooling (room temperature), district cooling (room temperature) and combined district cooling & heating (room temperature). In the DEA fossil and wind scenario cooling is mentioned only as part of the classical electrical consumption and it is therefore assumed that no district cooling is included in their scenarios. In IDA 2035, it is assumed that 20% of the cooling supplied comes from district cooling and in IDA 2050, the district cooling 91 IDA’S ENERGY VISION 2050 share is 40%. Further, it is assumed that 75% of the district cooling is produced in a combined production with heating at the same COP. An overview of the division of the cooling supply is available in Table 24. Table 24: Division of cooling supply. Cooling type COP Current/DEA IDA 2035 IDA 2050 2.5 10% 10% 10% Compression cooling (room temp) 5 90% 70% 50% District cooling (room temp) 7 0% 5% 10% Combined district cooling and heating (room temp) 6 0% 15% 30% Compression cooling (low temp) The resulting cooling demands and heat production are seen in Table 25. Table 25: Cooling demands and heat production. Cooling demands (TWh) Current/DEA IDA 2035 IDA 2050 Compression cooling (low temp) 0.76 0.76 0.76 Compression cooling (room temp) 6.84 5.32 3.80 District cooling (room temp) 0.00 0.38 0.76 Combined district cooling and heating (room temp) 0.00 1.14 2.28 Total cooling demand 7.60 7.60 7.60 Heat Production (TWh) 0.00 1.14 2.28 The cost of cooling is calculated based on the cost found in [38]. The investment costs are 544 million € per TWh of cooling for district cooling and 736 million € per TWh of cooling for new compression cooling. The costs in the scenarios are seen in Table 26. Table 26: Investments costs for cooling Cooling investment costs (billion €) Current/DEA IDA 2035 IDA 2050 Compression cooling (low temp) 0.56 0.56 0.56 Compression cooling (room temp) 5.03 3.91 2.80 District cooling (room temp) 0 0.21 0.41 Combined district cooling and heating (room temp) 0 0.62 1.24 5.59 5.30 5.01 Total cooling demand 92 IDA’S ENERGY VISION 2050 6 Industry Industry and service including agriculture and construction are assumed to have the same growth as in the DEA fossil fuel and wind scenarios, i.e., approx. 40% from 2015 to 2050. The IDA scenario introduces a principle hierarchy giving priority to first savings, then smart energy coordination with district heating and cooling as well as electricity via heat pumps, and finally the replacement of fossil fuels with electricity, heavy biomass and lastly high quality green gas electro fuels. A higher potential for the utilization of industrial waste heat is included as a consequence of more district heating with lower temperatures (4GDH). An energy demand of 54 TWh in 2015 (including electricity, transport and district heating/cooling) with a high share of fossil fuels is transformed into an energy demand of 42 TWh with no fossil fuels and with contributions from district heating and cooling. 6.1 The 2015 energy consumption Based on the 2013 statistics and as explained elsewere in this report the total energy consumption in 2015 in Industry and Service is composed by an electricity demand of 20.26 TWh and a fuel consumption of 26.67 TWh. In accordance with the statistics and the reference used here the fuel can be divided into 1.5 TWh of coal, 11.2 TWh of oil, 10.8 TWh of Natural gas and 3.3 TWh of Biomass. This excludes a district heating demand which is included in the district heating section. Moreover, this fuel consumption includes internal work transport, but not transport in general in the industry. The latter is included under transport. As a reference representing 2015 the energy consumptions can be illustrated as shown in Table 27. The distribution into purposes such as cooling, heating and process is based on the analysis in [39] and [40] as described below. Table 27: Electricity and fuel consumption in the Industry and Service sector in the reference 2015 in accordance with [39] and [40]. 7 TWh/year for transport is included in the transport section. Industry and Service: Reference 2015 TWh/year Electricity Electricity 18 Cooling 2 Heat Pumps 0 Fuel Space Heating 7 Work Transport 5 Process and Destillation 5 Others 10 DHC Sum Transport Sum Transport Sum 7 20 27 0 47 7 54 Based on the electricity and fuel input above the industry and service sector provides an electricity production from industrial CHP of 1.2 TWh/year and a contribution to district heating of 1.3 TWh/year. 93 IDA’S ENERGY VISION 2050 6.2 Growth assumption same as DEA In accordance with [41] the DEA scenarios assume an annual growth in industrial production of 0.61-1.17 % depending on the area of industry. In total, the net energy consumption of industry and service is expected to increase from 67.1 in 2011 to 96.2 TWh/year in 2050 equal to a growth of 40% from 2015 to 2050. This assumption is called “frozen” and assumes no savings. In the DEA Fossil and DEA Wind scenarios, “big savings” are assumed resulting in a net energy consumption in 2050 of 73.8 TWh/year, equal to a growth of approx. 10%. Since the savings (and the costs) are the same in all the DEA scenarios, DEA has not included any cost in this part of their scenarios. The IDA scenario is based on the energy consumption in 2015. As a starting point it is assumed the same growth in 2050 as DEA, i.e. approx. 40%. Expected growth has been implemented using different growth rates for different energy demands as specified in Table 28. However the IDA scenario includes savings and changes in production which are slightly different from the DEA scenarios. To compare the cost we have identified the extra investments in the IDA scenario compared to the DEA “large savings” assumption. Table 28. Electricity and fuel consumption in the industry and service sector in 2050 assuming similar growth rates as used in the DEA scenarios. 2050 Industry and Service: Growth Growth fuels 37% Growth electricity 52% Growth heat 15% Growth transport 48% TWh/year Electricity Electricity 28 Cooling 3 Heat Pumps 0.4 Fuel Space Heating 8 Work Transport 7 Process and Destilation 6 Others 14 DHC Sum Transport Sum Transport Sum 10 110.9 127.9 0.0 239 35 274 94 IDA’S ENERGY VISION 2050 6.3 The Industrial energy transformation hierarchy Here, the transformation of the industry and service sector is treated after the follow principle hierarchy: 1. Priority is given to savings 2. Priority is given to district heating and cooling including the utilisation of waste heat from processes either internally or for district heating 3. Priority is given to heat pumps for remaining space heat demands 4. Priority is given to replacing fossil fuels with electricity 5. Priority is given to replacing fossil fuels with heavy biomass 6. Priority is given to replacing fossil fuels with green gas (methanated biogas) The hierarchy is defined out of the wish to transform industry and service into a part of a future renewable system in which the energy consumption and the costs of the total energy system are minimized as much as possible. 6.4 Energy Savings The estimation of the potential energy savings is based on the report [40] which again in the description of the current 2015 consumption refers to [39]. These reports estimate the total energy consumption in industry and service at 55.3 TWh [39] of which 6.7 TWh is transport. However the distribution between electricity and fuel are somewhat different than the statistic figures. Moreover, the share of district heating, if any, is not specified. Consequently the numbers have here been adjusted to match the statistics and the DEA fossil and wind scenarios, and the reports [39] and [40] are mainly used to estimate saving potentials and costs within the different sectors and areas. Out of the approx. 47 TWh excluding transport mentioned above [40] analyse only 39 TWh since 3 TWh of process heat (T>150 C) and 6 TWh of several small areas such as distillation, melting and other use of electricity have not been included. Here, the part of the fuel consumption, which is not included in [40] (i.e. 5 TWh) has been treated on its own since it represent mostly process heating and distillation, while the part of the electricity consumption (i.e. 4 TWh) is considered to be represented by the general estimations of electricity consumption since it represents “other use of electricity” and similar. The reports conclude that a potential of 25% savings can be achieved with a payback time of 10 years or less as shown in Table 29 below. The potential is higher (43%) within the electricity demand than for the fuel demand (17%). 95 IDA’S ENERGY VISION 2050 Table 29: Energy savings potentials divided by payback time [40] Consumption Savings potential Savings potential TJ/year TJ % 2 4 10 2 4 10 Conversion and grid losses 8,476 204 441 737 2% 5% 9% Heating/boiling 16,214 1,135 1,946 4,653 7% 12% 29% Drying 13,567 1,119 1,899 3,677 8% 14% 27% Condensation 4,595 427 797 1,379 9% 17% 30% Burning/vitrification 3,895 0 0 428 0% 0% 11% Space heating 34,617 0 0 5,158 0% 0% 15% Work-related transport 18,098 1,162 1,162 1,162 6% 6% 6% 99,462 4,047 6,245 17,194 4% 6% 17% 617 26 43 68 4% 7% 11% Space cooling 2,233 221 364 951 10% 16% 43% Refrigeration/freezing (excl. Space cooling) 6,217 631 870 1,912 10% 14% 31% Space ventilation 5,451 1,379 1,785 2,008 25% 33% 37% Pumping 4,562 1,049 1,733 2,463 23% 38% 54% Fans 2,952 289 565 874 10% 19% 30% Compressed air 3,343 550 927 1,793 16% 28% 54% 751 60 129 251 8% 17% 33% Ligthing 11,471 2,042 2,960 7,743 18% 26% 68% IT and other electronics 4,507 2 40 187 0% 1% 4% 42,104 6,250 9,417 18,250 15% 22% 43% 141,566 10,297 15,662 35,445 7% 11% 25% Surplus heat, process integration 74,546 2,032 4,514 12,506 3% 6% 17% Electric motors and transmissions 34,797 1,024 2,120 5,648 3% 6% 16% Automation 133,187 679 2,850 4,049 1% 2% 3% Subtotal (not electricity) Energy demand heat pumps Hydraulics Subtotal (electricity) Total Of these transversal Thus, IDA’s Energy Vision includes 43% savings of 21 TWh of electricity equal to a reduction of 8.8 TWh. And a 17% savings of 27 TWh of fuel equal to 4 TWh while the 4 TWh for process heating and distillation is maintained. The energy consumption is now as illustrated in Table 30. 96 IDA’S ENERGY VISION 2050 Table 30: Electricity and fuel consumption in the industry and service sector after implementing all savings with a payback time less than10 years. Industry and Service: After Savings Savings in fuels -50% Savings in Electricity -31% Savings in heating -27% Savings in transport 0% TWh/year Electricity Electricity 19 Cooling 2 Heat Pumps 0.3 Fuel Space Heating 6 Work Transport 7 Process and Destilation 3 Others 7 DHC Sum Transport Sum Transport Sum 10 76.6 84.2 0 161 35 196 The cost is estimated on the basis of the payback periods in [40]. These payback periods are calculated as simple payback periods (i.e. with an interest rate of 0) and using actual electricity and fuel prices for the specific investments. Here the investments are estimated under the assumption of an electricity price of 67€/MWh resulting in annual savings of 590 million €/year. Assuming an average payback time of 5 years this is equal to an investment of around 2.95 billion equal to 336 million €/TWh saved. Similarly, the cost of fuel savings are estimated on the basis of a fuel cost of 40 €/GJ resulting in annual savings of 540 million €/year. Assuming an average payback time of 6 years this is equal to an investment of around 3.2 billion, equal to 870 million € per 1 TWh saved. 6.5 District heating and Cooling and heat pumps As a next step, space heating and cooling demands are transformed into district heating and district cooling assuming the same shares as in the other sectors, i.e. a district heating share of 66% and a district cooling share of 50%. Assuming that heating is now provided in boilers with an efficiency of 90% and cooling in appliances with a COP of 2.5 (equal to a “cooling COP” of 1,5) the numbers are as shown in Table 31. 97 IDA’S ENERGY VISION 2050 Table 31. District heating and cooling conversions in the industrial and services sectors Industry and Service: DHC District Heating share 66% District Cooling share 50% Cooling COP 1.5 Boiler efficiency 90% TWh/year Electricity Electricity 19 Cooling 1 Heat Pumps 0.3 Fuel DHC Sum Transport Sum 1 Space Heating 2 Work Transport 7 Process and Destilation 3 Others 7 3 Transport 10 Sum 73.5 70.4 17.2 161 35 196 Moreover the remaining space heat demand has been converted to individual heat pumps with a COP of 3. Finally the fuel for work transport has been transferred to the transport section. The numbers are shown in Table 32. Table 32. Conversion of space heating to electric heat pumps Industry and Service: DHC and heat Pumps and Work Transport Heat Pump COP 3 TWh/year Electricity Electricity 19 Cooling 1 Heat Pumps 0.3 Space Heating 1 Fuel DHC Sum Sum 1 3 Work Transport 7 Process and Destilation 3 Others 7 Transport Sum Transport 10 21 10 5 36 17 53 The costs of district heating and cooling networks and production units are included in the district heating and cooling sections. The additional cost of converting internally from boilers, etc., to DHC and the cost of heat 98 IDA’S ENERGY VISION 2050 pumps are assumed to be cost neutral, since new investments are replacing previous investments in boilers and cooling units, etc. Heat pumps are a little more expensive than boilers, but district heating connections are less expensive. 6.6 Replacing fossil fuels with electricity, biomass and green gas. In order to convert to a 100% renewable solution the remaining fuel consumption of 5.9 TWh will be replaced by electricity, heavy biomass or green gas. The remaining fuel consumption is primarily used for boiling, drying, evaporation, burning, distillation and process heat above 150 C. As explained above in principle the best solution for the system would be to give priority to first electricity, then heavy biomass and lastly green gas. In this report there has not been time and data available to go into a deeper analysis of this aspect. Instead an equal conversion into the three types of fuels is assumed. In the conversion from fossil fuels to electricity, an efficiency benefit of 20% is assumed, since the use of electricity compared to fossil fuels in many cases will save losses in boiler, etc. The numbers are shown in Table 33. Table 33. Conversion of the remaining industrial fuel demand to electricity, biomass and green gas Industry and Service: Conversion to Electricity and Biomass Efficiency of fuel compared to electricity 80% Electricity share of fuel replacement 33% PJ/year Electricity Electricity 19 Cooling 1 Heat Pumps 0.3 Space Heating 0.7 Biomass DHC Sum Sum 1 3 Work Transport 7 Process and Destilation 1 2 Others 2 5 Transport Sum Transport 10 24 7 5 35 17 53 The cost of this action is estimated on the basis of cost differences in boiler types. Electric boilers are in general a little cheaper than gas, oil and coal boilers. On the other hand heavy biomass boilers are more expensive. However, since green gas is most likely to replace natural gas which will not influence the costs of the boiler, heavy biomass and electricity will mostly replace coal and oil boilers. On this basis the replacement is assumed to be cost neutral with regard to the investments in the industry. The cost of fuels is included elsewhere in the assessment. 99 IDA’S ENERGY VISION 2050 Waste heat from industry As mentioned above, the industry and service sector provides an electricity production from industrial CHP of 1.2 TWh/year and a contribution to district heating of 1.3 TWh/year in 2015. With a 40% growth in industry, these contributions carry a potential of being increased. On the other hand, savings will reduce the potential. More important, however, is the increase in the potential of waste heat due to lower temperatures in future 4th generation district heating systems. In [42] an estimation of the waste heat potential from industry in 2013 came to the result of 2.5 TWh of which a large share needs heat pumps in order to be utilized under current temperature conditions. Part of the waste heat may be used internally and part of it for district heating. In future low-temperature district heating solutions, the need for heat pumps is reduced. A waste heat potential of 2.5 TWh/year would more than double the current contribution and equals around 7-8% of the current district heating. The report considers itself a first estimate similar to a screening. A more recent study [43] for one of the Regions in Denmark (RegionMidt) reaches higher waste heat potentials, namely an average of 15% of the current district heating demands. Here it is suggested to implement an estimated potential of 3 TWh/year of waste heat in 2050 equal to a little less than 10% of the current district heating demand. This potential is to be seen in relation to a transformation into 4th generation low temperature district heating technologies, which are expected to increase the potential. The saving measures and conversions described result in a fuel consumption of 27 TWh and an electricity consumption of 20 TWh in 2015 is converted into the following in the IDA Energy Vision 2050 in 2050. The numbers are shown in Table 34. Table 34. Energy demands in the industrial and service sector in the IDA scenarios after savings and conversions Energy demands in Industry and Service TWh/year 2015 2020 2035 Coal 1.5 1.3 0.6 Oil 11.2 9.6 4.8 Ngas 10.8 9.3 4.6 Biomass 3.3 3.3 3.4 3.4 0.5 1.9 3.4 Green gas 2050 Sum fuel 26.8 24.0 15.4 6.8 Electricity 20.3 20.8 22.3 23.8 District Heating 0.0 0.5 2.0 3.4 0.2 0.8 1.3 6.7 6.7 6.7 6.7 Electrcity production 1.2 1.2 1.2 1.2 Heat production 1.3 1.5 2.3 3.0 District Cooling Transport CHP 100 IDA’S ENERGY VISION 2050 7 Transport The conversion of the transport sector towards 100% renewable energy is a great challenge, not only due to the historical growth in demand but also the many different modes and needs in this sector. One solution does not exist for the transformation of transport and a mix of different alternatives must be deployed both in order to decarbonize the transport and replace fossil fuels with renewable alternatives. It is not possible to transform transport to a 100% renewable sector by 2050 by only implementing technological changes; other measures will also be necessary to reduce the overall energy demand for transport. 7.1 Transport demand in different scenarios 2011 has been defined as the reference year for transport modelling, as this was a base year in the DEA scenarios and the relevant data is available. The IDA Energy Vision transport scenarios were created with the same assumptions for vehicle efficiency improvements as in the DEA Fossil and Wind scenarios. Differently distributed growth rates in transport demands and modal shifts shape new transport demands for 2035 and 2050. For example, the IDA Energy Vision scenario has assumed higher growth in passenger transport in the period up to the 2030s than the DEA scenarios, and in the period to 2050, only growth in rail and biking and walking is assumed (see Figure 56). This is directly related to the modal shifts applied where the focus is on shifting the personal road transport and domestic aviation to a railway system. This modal shift is highly prioritized as rail is the most efficient form of passenger transport technologies. In comparison to the DEA scenarios, the passenger transport demand for rail is 3.5 times higher in IDA 2050 due to the applied modal shift. IDA’s Energy Vision 2050 has 9% lower passenger transport demand than the DEA Wind scenario. In comparison to the reference year, both the IDA and DEA scenarios meet a higher transport demand, increased by 42% and 55% respectively, and have higher numbers of personal vehicles. 160.000 Transport Demand (Mpkm) 140.000 120.000 100.000 80.000 60.000 40.000 20.000 0 2011 Cars and vans < 2 t Rail Bus 2050 2050 DEA IDA Bicycle/walking Air Sea Total Figure 56. Passenger transport demand in Mpkm for 2011, DEA 2050 and IDA Energy Vision 2050 101 IDA’S ENERGY VISION 2050 Even though the growth in passenger transport is lower for IDA’s Energy Vision, the opposite is the case of freight transport (see Figure 57). It is anticipated that the growth applied in the DEA scenarios is rather low and that more than 15% growth will occur in the freight transport. The main differences in the freight transport demand are due to the international cargo shipping. The modal shift in freight transport was not as significant as for passenger transport and only 5% of truck traffic was shifted to rail. 160.000 Transport Demand (Mtkm) 140.000 120.000 100.000 80.000 60.000 40.000 20.000 0 2011 2050 2050 DEA IDA National truck Vans (2‐6 t) National rail International rail (electricity) National cargo air International cargo air National cargo sea International cargo sea Other Total Figure 57. Freight transport demand in Mtkm for 2011, DEA 2050 and IDA Energy Vision 2050 The results of modal shifts are visible in the share of public transport in IDA 2050 that has increased by 82% in comparison to 2011. The rest of the passenger transport demand was distributed so that 45% was met by vehicles, 5% were bikes and walking, and 21% was aviation. The highest share of freight transport demand was met by marine at 82%, followed by trucks at 13%, and vans and rail at only 1.3%. Detailed background information on transport modelling can be found in the supplementary report - “Technical data and methods” [7]. 7.2 Meeting the transport demand In IDA’s Energy Vision, in order to meet the transport demand projected for 2035 and 2050, first priority is given to the electrification of the transport sector. Furthermore, the minimisation of biomass used for fuel production is prioritized in order to keep a sustainable level of biomass consumption in the system, aligned with the biomass potential. The rest of the transport demand not suitable for electrification is met by electrofuels: bioelectrofuels and CO2 electrofuels. These production processes were chosen due to their high efficiency but also as these processes are of great importance in creating the smart energy system [44]. 102 IDA’S ENERGY VISION 2050 The production of electrofuels is based on electricity conversion and storage via electrolysis and the conversion of the carbon source into valuable liquid or gaseous fuel products. The principal difference between bioelectrofuels and CO2 electrofuels is the carbon source originating either from biomass gasification or from stationary sources of CO2 emissions such as power plants or industrial plants. In case of bioelectrofuels, biomass is firstly gasified and the produced syngas is upgraded with hydrogen in the hydrogenation process. In case of CO2 electrofuels, recycled CO2 emissions are reacted with hydrogen produced with electrolysis, and creating syngas that is converted into fuel through a fuel synthesis process. It is assumed that hydrogen needed for electrofuels production can be produced by high temperature electrolysis in solid oxide electrolysers. For high temperature electrolysis, an efficiency of 73% is used for the conversion from electricity to hydrogen [45]. The costs for electrolysis in 2050 can be estimated at 0.28 M€/MW, the lifetime is 15 years and O&M costs correspond to 3 per cent of the investment costs. The end fuels assumed to be used both in the 2035 and 2050 scenarios are dimethyl ether (DME) or methanol distributed evenly in the power trains running on liquid fuels. No gaseous fuels for transport are used in the IDA scenarios as the higher efficiency of vehicles is prioritized in order to minimize the fuel demand. Electrofuels offer a solution for meeting different fuel demands while providing flexibility to the system. In this way, we compensate for the lost flexibility on the resource side by providing flexibility in the conversion processes. As the fuel production facilities produce excess heat, this is another important factor for the integration of fuel production and heating sector in the future. Uncertainty related to these fuels is of course present; however, power to liquid production plants have been demonstrated and new projects are in place [46–48]. It should be pointed out that chemical synthesis is a well developed process, while biomass gasification and high temperature electrolysers need further improvements before commercialization and large-scale utilisation [49–52]. For the DEA scenarios, the majority of the personal vehicles, busses and rail are converted to electricitypowered transport, while the remainder of the transport demand is supplied by advanced BTL (biomass-toliquid) technology with hydrogen addition that provides synthetic diesel, petrol and jet fuel. The efficiency of the process is 66%. The electrolysers for producing hydrogen for synthetic fuels are assumed to be provided by alkaline electrolysers with an efficiency of 58%. The costs for alkaline electrolysis in 2050 are estimated at 0.87 M€/MW, the lifetime is 28 years and O&M costs correspond to 4 per cent of the investment costs [45]. In all scenarios, hydrogen storage for the average consumption of one week is assumed together with a 50% operating period over a year at the electrolysis facilities. In comparison to the DEA scenarios, the implemented measures result in a lower fuel demand in 2035 and 2050 (see Figure 58). We can see that in 2050, IDA’s Energy Vision has 17% lower energy demand than the DEA Wind scenario and 25% lower than the DEA Fossil scenario and similar differences are found in 2035. 103 IDA’S ENERGY VISION 2050 Energy consumption by fuel type (PJ) 250 200 150 100 50 0 DEA Fossil DEA Wind IDA DEA Fossil 2035 DEA Wind IDA 2050 Petrol Diesel Jet‐fuel fossil NG/SNG/biogas Syn‐petrol Syn‐diesel Syn‐jetfuel Bioelectrofuel‐methanol/DME Bioelectrofuel‐jetfuel CO₂ electrofuel‐methanol/DME CO₂ electrofuel‐jetfuel Electricity Train / bus Electricity BEV + Plug‐in‐hybrid Figure 58. Energy consumption by fuel type for DEA Fossil, DEA Wind and IDA 2035 and 2050 The direct and battery electrification is of high priority and large shares of cars, vans and rail are electrified in the IDA scenario for 2050. Total transport fuel demand is 133 PJ in 2050, of which 100 PJ are liquid electrofuels and 33 PJ consist of electricity used for the electrification of transport. Half of the electrofuel demand is supplied by bio-based electrofuels, resulting in a biomass share of 47 PJ for fuel production, which is aligned with the biomass potential available for transport in Denmark, and the rest is met by CO2 electrofuels. In the DEA scenarios, the part of the transport demand depending on gaseous fuels is supplied by synthetic natural gas (SNG) produced by upgrading biogas. Total transport fuel demand for DEA Fossil is 177 PJ, of which 34 PJ is electrified and the rest is met by different mixes of fossil fuels. In DEA Wind 2050, the total energy demand of 162 PJ is met by 52 PJ of liquid fuels, syn-petrol and diesel, 29 PJ is synthetic natural gas (SNG), and the electricity consumed for powering personal vehicles, vans, trucks, busses and rail is 43 PJ. Figure 59 shows the biomass demand for fuel production for the DEA Wind and IDA scenarios. As the DEA scenario has a lower fuel process efficiency of 66%, in comparison to 78% for IDA, and the demand for liquid hydrocarbons is met only by one technology for fuel production, the DEA scenarios have a higher biomass demand. This contributes to the total biomass demand in the DEA scenarios, resulting in a total biomass demand above 300 PJ, which is higher than the potential available. It is important to note that the IDA scenarios have assumed additional 25% losses for jet fuel production and storage, meaning that if these losses are lower, the biomass demand in the scenarios would decrease. This shows the importance of diversifying the production of liquid and gaseous fuels for transport purposes, as there is a need for an energy system that can keep its biomass consumption within the available biomass potential (see Section 8). 104 IDA’S ENERGY VISION 2050 100,0 90,0 Biomass demand (PJ) 80,0 70,0 60,0 50,0 40,0 30,0 20,0 10,0 0,0 DEA Wind IDA DEA Wind 2035 IDA 2050 Figure 59. Biomass demand for transport fuel production (including demand for jet fuel) In the IDA Energy Vision 2050 scenario, battery electric vehicles meet 75% of the private car transport demand and the rest is met by electrofuels used in plug-in hybrid vehicles (10% of the demand), hybrids (5%) and internal combustion engines (ICEs) (10%). Electric busses meet 15% of the bus transport demand, while an even mix of bioelectrofuel and CO2 electrofuels supplements the remaining 85% of ICEs. The rail is completely electrified, and both aviation and marine transport are met by an even mix of electrofuels. For freight transport, 35% of the vans are battery electric vehicles and the remaining 65% of the demand is met by ICE, ICE hybrids and ICE plug-in hybrids powered by an even mix of electrofuels. The trucks covering only national demands were assumed to be 75% ICE, 20% ICE hybrid and 5% fuel-cell hybrid running on electrofuels. The same assumptions apply to aviation and marine as to passenger transport. Electricity consumption (PJ) 30 25 20 15 10 5 0 DEA Fossil DEA Wind IDA DEA Fossil 2035 Rail Busses DEA Wind IDA 2050 Trucks Vans Cars and vans < 2 t Other Figure 60. Electricity consumption for different modes of transport for DEA Fossil, Wind and IDA 2035, 2050 105 IDA’S ENERGY VISION 2050 A more detailed subdivision of the electricity demand for different transport modes can be seen in Figure 60. Here it is visible that the IDA scenarios have lower electricity consumption for different modes due to the lower share of EVs in personal transport in IDA in comparison to the DEA projections. Both DEA scenarios in 2050 have higher electricity consumption for personal vehicles and vans, while IDA’s Energy Vision has 23% lower electricity consumption than DEA Wind. However, in the DEA scenarios, it was not possible to determine the amount of electricity in transport used for battery electric vehicles and plug-in hybrids, respectively; therefore all of the EVs are modelled as battery electric vehicles and the efficiency is modified in such a way that it is aligned with the electricity consumption for cars and vans. Furthermore, the DEA scenarios have projected electrification of trucks, while this is not the case of the IDA scenarios. Unlike other sectors in the energy system, in the transport sector, investment costs for infrastructure and vehicles form a higher proportion of the costs than expenses related to fuel. The investment costs are presented in Figure 61. Transport costs here include vehicle, vehicle O&M and EV charging stations. Moreover, the costs include the O&M for road infrastructure, new road infrastructure, O&M for rail, new rail infrastructure and other. The other category includes the costs for expanding the use of bikes, buses and ITS systems. Costs for charging stations for battery electric vehicles have been included corresponding to two charging stations per vehicle and for plug-in hybrids, one charging station per vehicle. In both cases, the costs are 745 €/charging station and a lifetime of ten years is assumed [53]. 16.000 14.000 12.000 M€/year 10.000 8.000 6.000 4.000 2.000 0 DEA Fossil DEA Wind IDA DEA Fossil 2035 DEA Wind IDA 2050 Vehicle Vehicle O&M EV Charging stations Renewal infrastructure road New infrastructure road Renewal infrastructure rail New infrastructure rail Other Figure 61. Annual transport system costs for 2035 and 2050 for DEA Fossil, DEA Wind and IDA Energy vision (excluding fuel/energy costs) We can see from the costs that the IDA scenarios have lower vehicle costs, which can be explained by a lower number of vehicles due to the assumed modal shifts of road transport towards rail. Also due to the modal shifts, the IDA scenarios have higher other costs due to the investments in bike and bus infrastructure. As a 106 IDA’S ENERGY VISION 2050 result of modal shifts, it is visible that the costs for new rail infrastructure and the renewal of the existing infrastructure are higher than in the DEA scenarios. The opposite is the case for road infrastructure due to the same reasons. Overall, as a result of measures done in the transport sector, investments in this sector are lower in 2050 for the IDA Energy Vision scenario. In order to achieve this type of modal shift, there is a need of detailed planning of how to establish rail as an attractive and comfortable alternative to road transport, and investments including the expansion of this infrastructure are crucial to reach this goal. To investigate the influence of different growth patterns and modal shifts on transport costs, a sensitivity analysis was conducted in which the IDA scenarios were tested with the same growth patterns as the DEA scenarios. Figure 62 shows that if the same growth rates as in the DEA scenarios are applied in the IDA Energy Vision scenario, the total costs actually increase, mostly due to the higher share of vehicles and related costs. If the modal shift is applied, we can see that the costs drop and the infrastructure costs increase. The infrastructure costs are here presented as marginal costs, as it is important to consider the economic implications of increasing the rail network or road infrastructure. It is also visible from the figure that if no modal shift is applied in the IDA scenario with assumed growth, the costs would be higher. Moreover, no modal shift and different growth rates also result in higher fuel consumption. For the IDA scenario without modal shift, the fuel demand is increased by 4%, while in the scenario with DEA growth and no modal shift, the increase is 12% 12.000 10.000 M€/year 8.000 6.000 4.000 2.000 0 DEA Fossil DEA Wind no modal shift with modal shift no modal shift IDA (DEA growth) IDA (DEA growth) IDA IDA 2050 Vehicles Vehicles O&M Charging stations Marginal transport infrastructure Other Figure 62. Sensitivity analysis of different growth patterns and modal shifts for IDA Energy Vision 2050 Further sensitivity analyses focusing only on the influences of no modal shift for IDA’s Energy Vision 2050 were conducted in order to see the impacts on the overall energy system. The results are presented as marginal differences in comparison to the main IDA scenario. No modal shift results in a higher biomass demand due to the increase in road transport that leads to an increase in fuel demand (see Figure 63). As shown previously, an increase in transport sector costs and biomass demand occurs and this leads to the 107 IDA’S ENERGY VISION 2050 Changes in Primary Energy Supply (TWh/year) 1,6 1,4 Solar thermal 1,2 Geothermal Wave/tidal 1,0 PV Offshore 0,8 Onshore 0,6 Biomass/waste Gas 0,4 Oil 0,2 Coal 0,0 No modal shift Changes in Socio‐economic costs (Billion €/year) higher overall energy system costs of €1 billion per year. When it comes to the impact on the electricity exchange, no modal shift results in the net export of -0.6 TWh, which is not considered significant. 1,2 1 0,8 0,6 0,4 0,2 0 Investments O&M Fuels Electricity exchange CO₂ Total Figure 63. Changes in primary energy supply and socio‐economic costs for no modal shift in IDA Energy Vision 2050 108 IDA’S ENERGY VISION 2050 7.3 Transport scenario overview The transformation of the fossil fuel-based transport sector into renewable energy is possible with affordable costs. Focus is on maximizing the electrification of transport, minimizing the biomass share for transport, and reducing the transport demand by using more efficient technologies and lower growth in transport. These measures enable lower energy consumption for transport in IDA’s Energy Vision 2050, both in relation to the DEA scenarios and when compared to the level today. The results of this transformation of the transport sector are displayed in Table 35. Table 35. Transport fuel consumption for reference year, DEA Fossil and Wind 2035 and 2050, IDA 2035 and 2050 2015 Cars and vans < 2 t Vans Busses Trucks Rail Aviation Sea Other PJ Petrol Diesel NG/Biogas Syn-petrol Syn-diesel Bioelectrofuel-methanol/DME CO₂ electrofuel-methanol/DME Electricity Petrol Diesel NG/Biogas Syn-petrol Syn-diesel Bioelectrofuel-methanol/DME CO₂ electrofuel-methanol/DME Electricity Petrol Diesel NG/Biogas Syn-petrol Syn-diesel Bioelectrofuel-methanol/DME CO₂ electrofuel-methanol/DME Electricity Petrol Diesel NG/Biogas Syn-petrol Syn-diesel Bioelectrofuel-methanol/DME CO₂ electrofuel-methanol/DME Electricity Diesel Electricity Jetfuel fossil Bio & CO2-jetfuel Syn-jetfuel Diesel Syn-diesel NG/Biogas Electrofuel Petrol Syn-petrol Electrofuel Electricity SUM 54.0 46.0 DEA Fossil 72.7 2035 DEA Wind 26.8 30.1 IDA 8.1 12.4 DEA Fossil 16.6 6.5 2050 DEA Wind 11.5 17.0 4.8 19.1 6.3 37.3 6.7 6.6 20.1 IDA 13.3 12.4 25.3 10.0 20.1 26.7 5.6 5.6 21.7 14.2 1.1 2.6 5.9 0.5 4.7 0.9 9.6 1.8 4.0 3.5 4.6 10.3 4.7 2.1 3.6 1.2 1.3 0.2 0.0 22.3 27.4 5.6 23.4 5.6 11.2 1.4 16.0 22.5 4.0 6.3 0.3 2.3 1.6 37.1 10.4 0.6 1.8 157.4 210.9 0.3 1.6 2.6 26.7 10.5 8.0 2.4 0.6 1.5 0.1 192.3 2.4 2.4 0.5 22.6 15.9 8.0 7.0 3.3 1.4 9.6 9.6 6.9 2.7 24.7 10.9 14.3 14.3 1.1 1.1 3.4 37.7 3.4 2.7 31.3 37.7 7.9 9.6 2.5 1.1 0.5 9.6 2.5 11.0 0.7 0.7 0.7 159.5 0.4 177.3 0.4 161.6 0.8 0.3 138.9 109 IDA’S ENERGY VISION 2050 7.4 7.4.1 Impact of assumption variations Variation of EV share To investigate the influence of the share of electric vehicles on IDA’s Energy Vision 2050, an analysis was made in which only the battery electric vehicle share was altered, meaning that there were still 10% of plug-in hybrid vehicles in the mix apart from in the 100% case. The original share of electric vehicles was 75% for personal vehicles. The key assumptions applied were a new fuel demand depending on the share of EVs and of course new costs for vehicles and charging stations. The demand for fuel was adjusted so that all liquid fuel needed for transport was produced by electrofuels. Table 36. Assumptions that were altered within transport Unit 0% 25% 50% 100% Electricity demand for EVs TWh 2.4 3.75 5.11 7.41 Fuel demand TWh 38.09 32.4 26.7 20.23 Electrolyser capacity MW 11,548 10,183 8818 7266 Vehicles M€ 40,515 40,635 40,755 40,905 Charging station M€ 503 1052 1601 2588 Changes in Primary Energy Supply (TWh/year) When reducing the share of EVs in the transport, an increase in biomass consumption occurs (see Figure 64) due to the substitution of these vehicles with ICE vehicles powered by electrofuels. If there are no battery electric vehicles implemented in the personal vehicles category, 21 TWh of biomass need to be used to produce additional fuel for meeting the transport demand. This is has a significant influence on the primary energy supply, especially due to the restricted biomass resources. It is also visible that if the share of BEVs is increased further, there are no additional savings of biomass; therefore increasing this share further will only influence the economy of the system. 25,0 20,0 15,0 10,0 5,0 0,0 0% 25% 50% 100% Coal Oil Gas Biomass/waste Onshore Offshore PV Wave/tidal Geothermal Solar thermal Figure 64. Changes in primary energy supply due to different share of battery electric vehicles 110 IDA’S ENERGY VISION 2050 The changes in socio-economic costs are visible in Figure 65. The cost increase when 100% of BEVs are used for personal cars is €0.3 billion/year in comparison to a share of 75% of BEV in IDA’s Energy Vision. In case that no BEVs are deployed, costs increase to €1.1 billion/year. Figure 65. Changes in socio‐economic costs due to different share of battery electric vehicles Difference in Electricity Exchange (TWh/year) 2 1 0 ‐1 ‐2 ‐3 ‐4 ‐5 ‐6 0% Electricity Import 25% Electricity Export 50% 100% DEA Critical Excess Electricity Production Net export Figure 66. Changes in electricity exchange due to different share of battery electric vehicles 111 IDA’S ENERGY VISION 2050 The largest impact on electricity exchange is due to the higher electrolyser capacity installed. This results in a higher electricity demand for electrofuel production. The net export is lower than in the case of a higher share of BEVs in the system, resulting in lower income from electricity exchange. It is important to note that the higher electricity demand would enable higher capacity of wind in the system, but this was not adjusted in this sensitivity analysis. Overall, it can be concluded that a higher share of BEVs is beneficial for the system, especially from the primary energy supply perspective. 7.4.2 Variation of electrofuel ratio In IDA’s Energy Vision 2050, the supply of liquid fuels is equally distributed between bioelectrofuels and CO2 electrofuels. The variations in the share of electrofuels in favour of bioelectrofuel were investigated to identify its influence on the system. The key assumptions for this analysis are outlined in Figure 65. Table 37. Assumptions that were altered within transport Unit 60%:40% 70%:30% 80%:20% 100%:0% Biomass demand for fuel production TWh 15.27 17.82 20.35 25.44 Electrolyser capacity MW 6717 5971 5225 3731 The production of bioelectrofuel requires lower electricity demand; thus, when increasing the share of bioelectrofuel for fuel production, the electricity demand in the system is reduced. Not only is the electricity demand reduced, but the biomass demand for fuel production purposes is increased and the availability of the syngas produced from gasification for CHP and power plants is reduced. The whole system changes its dynamics in order to reflect the occurred changes, resulting in no increase in biomass consumption at the system level. Difference in Electricity Exchange (TWh/year) 12 10 8 6 4 2 0 ‐2 60%:40% Electricity Import 70%:30% Electricity Export 80%:20% Critical Excess Electricity Production 100%:0% Net export Figure 67. Changes in electricity exchange due to increasing the share of bioelectrofuels 112 IDA’S ENERGY VISION 2050 We can see from Figure 67 that, due to the high wind capacity in the system and decrease in the electricity demand as the bioelectrofuel share increases, additional export of 10 TWh occurs. This consequently influences the socio-economic cost resulting in a cheaper system than IDA’s Energy Vision (see Figure 68). Changes in Socio‐economic costs (Billion €/year) 0 ‐0,1 ‐0,2 ‐0,3 ‐0,4 ‐0,5 ‐0,6 ‐0,7 60%:40% Investments 70%:30% O&M Fuels 80%:20% Electricity exchange 100%:0% CO₂ Total Figure 68. Changes in socio‐economic costs due to different due to increasing the share of bioelectrofuels This is not only due to the earnings in electricity exchange, but also the fact that the bioelectrofuel production is less costly than the CO2 electrofuel production. This high electricity export in comparison to IDA’s Energy Vision, where 14 TWh of export is already present, does not necessarily represent a realistic scenario. Therefore, it is important to consider what would happen if it would not be possible to export the additional 10 TWh of electricity. This could occur in a situation where neighbouring countries would also have a high electricity production from wind. To have the same level of export and import as in the IDA scenario, in case that the whole liquid fuel demand is met by bio based electrofuels, the wind power capacity installed should be reduced from 14,000 MW to 10,000 MW, which would increase the biomass consumption by 14 TWh to 78 TWh. 113 IDA’S ENERGY VISION 2050 8 Sensitivity of key technologies and assumptions IDA’s Energy Vision is based on a number of assumptions regarding costs, efficiencies and capacities and these assumptions might all potentially impact the findings. The applied assumptions are documented further in the supplementary report - “Technical data and methods” [7]. In order to investigate the impacts of some of these key assumptions sensitivity analyses have been performed and the main findings regarding these assumptions are described in this chapter. The main assumptions have been selected based on the impacts on the entire energy system, i.e., an assumption may have a significant impact within its area, but if the impact on the entire system is limited it is described in the relevant chapters. Additional noteworthy impacts also occur when changing the heat saving levels and district heat expansion as well as the transport technologies and assumptions. See more in Chapter 5 and 7. The purpose of this chapter is to investigate trends when changing key assumptions rather than to identify optimal levels or changes. It may be difficult to compare the changed assumptions directly in the figures since their magnitude may differ considerably, e.g. the production assumed or the capacities installed. The changes are analysed in terms of impacts on primary energy demand, socio-economic costs and electricity exchange. For some assumptions, it has been necessary to analyse the impacts in both the IDA 2050 and the DEA wind 2050 scenarios, and for some assumptions, the impacts have only been analysed in IDA 2050. The assumptions are divided into four areas; Renewable electricity production, Renewable heating production, efficiencies and capacity factors, as well as price and cost assumptions 8.1 Renewable electricity production For renewable electricity, the assumptions that have been analysed are the types of production, the levels of production, and whether the renewable fuel mix should be altered. The key assumptions that were found in this regard relate to an increase in onshore electricity capacity of 25% and a 25% increase in offshore electricity production. For both IDA 2050 and DEA 2050, the impacts of adding additional power plant and CHP capacity to the system were analysed. Table 38. Key assumptions that were altered within electricity production Key assumptions Additional Capacity Additional Production MW TWh 25% extra onshore 1250 4.05 25% extra offshore 3500 22.3 50% extra Power plant capacity in IDA 2050 2250 2.1 50% extra decentralized CHP capacity in IDA 2050 750 0.5 50% extra centralized CHP capacity in IDA 2050 1750 0.9 50% extra Power plant capacity in DEA Wind 2050 2300 1.7 50% extra decentralized CHP capacity in DEA Wind 2050 342 0.5 114 IDA’S ENERGY VISION 2050 Renewable electricity Production IDA 2050 IDA 2050 Decentral CHP+ 50% Power plant +50% Central CHP +50% Decentral CHP+ 50% Offshore+25% Power plant +50% 20 15 10 5 0 ‐5 ‐10 ‐15 Onshore+25% Changes in Primary Energy Supply (TWh/year) When increasing the wind power production, more renewable electricity is produced, reducing the need for power plant operation and thereby reducing the biomass demand. Increasing the renewable electricity production can therefore contribute to lowering the biomass demand, but the increase also impacts the overall costs and the electricity exchange. When increasing the power plant and CHP capacity, more electricity is produced domestically instead of importing electricity and this leads to a growing biomass demand. DEA 2050 Coal Oil Gas Biomass/waste Onshore Offshore PV Wave/tidal Geothermal Solar thermal Total Figure 69. Changes in primary energy demand when changing key assumptions for electricity production Regarding the socio-economic costs, the results differ for onshore and offshore wind production. When increasing the onshore wind capacity by 25%, the overall system costs decline as the fuel savings are larger than the additional investments. However, when the offshore wind capacity is increased, the investments grow compared to the electricity output. This means that the fuel savings can no longer outweigh the additional investments. However, it is complicated to compare the two electricity technologies since the electricity installed is significantly different and this may also impact the system ability to integrate additional fluctuating electricity. The additional installment of thermal power plant and CHP capacity results in more costly systems as the saved expenses for the import of electricity are smaller than the additional fuel costs and investments. 115 Renewable electricity Production IDA 2050 Investments IDA 2050 O&M Fuels Decentral CHP+ 50% Power plant +50% Central CHP +50% Decentral CHP+ 50% Offshore+25% Power plant +50% 0,6 0,5 0,4 0,3 0,2 0,1 0 ‐0,1 ‐0,2 ‐0,3 ‐0,4 Onshore+25% Changes in Socio‐economic costs (Billion €/year) IDA’S ENERGY VISION 2050 DEA 2050 Electricity exchange CO₂ Total Figure 70. Changes in Socio‐economic costs when changing key assumptions for electricity production Difference in Electricity Exchange (TWh/year) 8 7 6 5 4 3 2 1 0 ‐1 ‐2 Onshore+25% Offshore+25% Power plant +50% Renewable electricity Production IDA 2050 Electricity Import Electricity Export Decentral CHP+ 50% Central CHP +50% Power plant +50% IDA 2050 Critical Excess Electricity Production Decentral CHP+ 50% DEA 2050 Net export Figure 71. Changes in electricity exchange when changing key assumptions for electricity production The largest impact on the electricity exchange is found when installing more wind power in the energy system. Both when installing more onshore and offshore wind power, the export and critical excess grow, showing that the system is not able to integrate all this wind. The difference in export between onshore and offshore wind power is due to the difference in the additional production installed. An increase in power plant and CHP 116 IDA’S ENERGY VISION 2050 capacity leads to a decrease in import, as it becomes cheaper to produce more electricity domestically in certain periods. 8.1.1 Renewable heat production Assumptions regarding changes in the level and type of renewable heat production have been investigated. The key assumptions that affect the system are waste incineration, district heating heat pumps capacities, and the amount of individual heat pumps installed. Table 39. Key assumptions that were altered within heat production Key assumptions Additional Capacity (decentralized/centralized) Changed Production MW TWh 50% less waste -3.65 50% more waste +3.65 50% more district heating heat pump capacity 450/600 50% less district heating heat pump capacity 150/200 50% of individual heat pump demand moved to individual biomass boilers 6.54 50% of individual heat pump demand moved to individual biomass boilers 8.85 Figure 72 shows the changes in primary energy supply compared to IDA 2050 and DEA Wind 2050 when altering specific key assumptions within heating. When reducing the waste for waste incineration, the overall biomass demand is reduced, and the opposite occurs when increasing the waste input. The change in the overall biomass demand is not similar to the change in waste input, as other sections of the energy system are also affected by this change; i.e., more biomass is used in power plants and CHP plants when the waste incineration is reduced. When increasing the district heating heat pump capacity, only small biomass improvements can be achieved, while a reduced capacity leads to an increased biomass demand. This shows that from a fuel perspective, the heat pump capacity is at a feasible level in IDA 2050. The last key assumption that has been altered is the relation between individual heating by biomass boilers and heat pumps, respectively. As expected, the biomass demand increases significantly when moving half of the heat demand from individual heat pumps to biomass boilers, so that 60% of the individual heat demand is met by biomass boilers. In the DEA Wind 2050 scenario, this impact is even further noticeable as the individual heat demand is higher in this scenario than in the IDA 2050 scenario. This indicates the importance of heat pumps in individual heating, as the biomass demand would otherwise grow to a level that would exceed the assumed potentials. 117 Changes in Primary Energy Supply (TWh/year) IDA’S ENERGY VISION 2050 10 8 6 4 2 0 ‐2 ‐4 Waste ‐50% Waste +50% DH HP capacity DH HP capacity Half individual Half individual +50% ‐50% HP to biomass HP to biomass Heat supply in IDA 2050 IDA 2050 Coal Oil Gas Biomass/waste Onshore Offshore PV Wave/tidal Geothermal Solar thermal Total DEA Wind 2050 Figure 72. Changes in primary energy demand when changing key assumptions for heat production With respect to the impacts of changes on the socio-economy, a reduced waste incineration leads to system savings while additional waste increases the costs. This is because the savings in investments and O&M are larger than the higher fuel costs with lower waste input. For district heating heat pumps, the costs increase together with an increased capacity as the efficiency gains are limited. On the other hand, a reduced heat pump capacity makes the system cheaper as the saved investments are higher than the fuel savings. When considering the impact of changing the technologies for individual heat demand, the overall costs are lower with a higher share of biomass boilers due to the high investments that are necessary for heat pumps. The waste incineration primarily has an impact on the electricity export as an increased incineration leads to higher export and vice versa. This is because waste incineration in the models operate as baseload production and hence influences the flexibility of the system negatively. When the incineration is increased, there is less room for other fluctuating productions such as wind or solar power. For district heating heat pumps, an additional capacity only has little impact on the electricity exchange, while a reduced capacity increases the export and creates less ability in the system to integrate electricity. This impact is also profound for the individual heat pumps that ensure that a significant amount of electricity can be integrated into the system rather than being exported. 118 Changes in Socio‐economic costs (Billion €/year) IDA’S ENERGY VISION 2050 0,4 0,3 0,2 0,1 0,0 ‐0,1 ‐0,2 ‐0,3 ‐0,4 ‐0,5 ‐0,6 Waste ‐50% Waste +50% DH HP capacity DH HP capacity Half individual Half individual +50% ‐50% HP to biomass HP to biomass Heat supply in IDA 2050 Investments O&M Fuels IDA 2050 Electricity exchange CO₂ DEA Wind 2050 Total Figure 73. Changes in Socio‐economic costs when changing key assumptions for heat production Difference in Electricity Exchange (TWh/year) 1,4 1,2 1 0,8 0,6 0,4 0,2 0 ‐0,2 ‐0,4 ‐0,6 Waste ‐50% Electricity Import Waste +50% Industrial excess ‐ 50% Electricity Export Industrial excess +50% DH HP capacity +50% Critical Excess Electricity Production DH HP capacity ‐ 50% Net export Figure 74. Changes in electricity exchange when changing key assumptions for heat production 119 IDA’S ENERGY VISION 2050 8.1.2 Technology efficiencies In this section, the differences between the IDA 2050 and the DEA Wind 2050 scenarios in terms of technology development are investigated. Concretely, the electrolyser efficiency (a different type) is altered along with the power plant and CHP plant efficiencies as well as the renewable electricity capacity factors. This means that the technologies are now on a similar level in terms of production per capacity. In IDA 2050, it is analysed what the lower DEA Wind 2050 efficiencies mean, and in DEA 2050, the improved IDA 2050 efficiencies are implemented to see the impact in these scenarios. Finally, one scenario is created in which the improved and lowered power plant, CHP, electrolyser and renewable efficiencies are included in the same scenario together with a reduced electrolyser cost. Table 40: Key assumptions that were altered within technology efficiencies Key assumptions Efficiency (Onshore/ Thermal CHP efficiency (decentralized/ Electric CHP efficiency (decentralized/ offshore/PV) centralized) centralized) % % % 43/52 49/38 39/52 52/38 IDA 2050 lower electrolyser efficiency 58 IDA 2050 lower power plant and CHP efficiency 44 IDA 2050 lower renewable production capacity factor 35/47/10 DEA Wind 2050 Improved electrolyser efficiency 78 DEA Wind 2050 Improved power plant and CHP efficiency DEA Wind 2050 Improved renewable production capacity factor 61.5 37/52/14 In Figure 75 the changes in primary energy supply are illustrated with the changed efficiencies. When changing the efficiencies, the fuel demand is affected by the efficiency, but to a large degree also by the electricity exchange, as for example an increasing import instead of power plant production would reduce the biomass demand. In this way, the import of electricity is “biomass free” and impacts the overall demand. In the IDA 2050 scenarios, a lower electrolyser efficiency leads to a higher biomass demand as more electricity has to produce the same amount of electrofuels. With regard to the lower power plant and CHP plant efficiencies, the fuel demand actually decreases with a lower efficiency. This can be explained by a much lower power plant production that changes from 8.5 TWh to 3.6 TWh with the lower efficiency. Instead of this production, more of the wind or solar power that was previously exported can now be integrated, while the import also increases. As both the import and export are considered to not consume biomass, the overall biomass demand decreases. 120 Changed efficiencies IDA 2050 Improved PP/CHP/electrolyser/res Improved RES Improved PP/CHP Improved electrolyser Lower PP/CHP/electrolyser/res Lower RES Lower PP/CHP 12 10 8 6 4 2 0 ‐2 ‐4 ‐6 ‐8 ‐10 Lower electrolyser Changes in Primary Energy Supply (TWh/year) IDA’S ENERGY VISION 2050 Changed efficiencies DEA Wind 2050 Coal Oil Gas Biomass/waste Onshore Offshore PV Wave/tidal Geothermal Solar thermal Total Figure 75. Changes in primary energy demand when changing key assumptions for efficiencies For the analyses of the lower capacity factors in the IDA 2050 scenario, the renewable production is replaced by a higher power plant and CHP production as well as a growing import of electricity. This leads to a significantly higher biomass demand. Finally, the impact of changing all these efficiencies in the IDA 2050 scenario is analysed, including all the system synergies. In this system, the biomass increase is lower than when only the renewable capacity factors are improved. For the DEA 2050 Wind scenario, the biomass demand is reduced with the improved electrolyser efficiency. Regarding the improved power plant and CHP efficiencies, the higher efficiency makes the domestic electricity production less expensive, thereby reducing the amount of import in the system. This means that the power plants produce 15.7 TWh instead of 8.9 TWh as in the original DEA 2050 wind. This leads to a biomass increase in the system. For the improved renewable capacity factors, the biomass demand is reduced significantly. In the system where all these improved technology efficiencies are installed simultaneously, the biomass reduction is lower than in the system where only the renewable capacity factors are improved. These results show that it is important to continue research in improving the electrolyser technology as well as the renewable electricity producing technologies. When analysing the impact on the socio-economic costs, lower efficiencies in general lead to higher costs, and improved efficiencies mean reductions in costs. This is due to the higher fuel costs and also the extra costs related to the required import of electricity when the domestic production decreases. The opposite situation exists when the DEA Wind 2050 scenario operates with higher efficiencies. In these systems, the costs are reduced due to fuel savings and an economically better electricity exchange is achieved. 121 1,5 1 0,5 0 ‐0,5 ‐1 Changed efficiencies IDA 2050 Investments O&M Fuels Improved PP/CHP/electrolyser/res Improved RES Improved PP/CHP Improved electrolyser Lower RES Lower PP/CHP Lower PP/CHP/electrolyser/res ‐1,5 Lower electrolyser Changes in Socio‐economic costs (Billion €/year) IDA’S ENERGY VISION 2050 Changed efficiencies DEA Wind 2050 Electricity exchange CO₂ Total 15 10 5 0 ‐5 Changed efficiencies IDA 2050 Electricity Import Electricity Export Improved PP/CHP/electrolyser/res Improved RES Improved PP/CHP Improved electrolyser Lower PP/CHP/electrolyser/res Lower RES Lower PP/CHP ‐10 Lower electrolyser Difference in Electricity Exchange (TWh/year) Figure 76. Changes in Socio‐economic costs when changing key assumptions for efficiencies Changed efficiencies DEA Wind 2050 Critical Excess Electricity Production Net export Figure 77. Changes in electricity exchange when changing key assumptions for efficiencies 122 IDA’S ENERGY VISION 2050 In the IDA scenarios, the export decreases when the efficiencies are lower and the import increases, especially due to the lower power plant and CHP efficiencies. The critical excess electricity production, however, remains unchanged. In the DEA 2050 Wind scenario, the import decreases while the export increases. The largest increase in electricity export takes place when all the efficiency gains are implemented and also here, the excess electricity production increases. This shows that the system is not able to integrate all the extra electricity that is produced and, in periods, this has to be curtailed. 8.1.3 Investment costs In this section the investment costs are analysed for various key technologies in the future 100% renewable scenarios. The investment costs that have been analysed include the wind, electrolyser and hydrogen storage price levels. Furthermore, an increased interest rate of 4% is analysed. As these changes only affect the socioeconomic costs no impacts on primary energy and electricity exchange are included. Table 41: Key assumptions that were altered within investment costs Key assumptions Original investment Changed investments M€/TWh 50% higher Wind power investments (onshore/offshore) 0.9/2.1 1.4/3.2 50% lower Wind power investments 0.9/2.1 0.45/1.1 50% higher hydrogen storage investments 20 30 50% lower hydrogen storage investments 20 10 0.28, 15 years, 3% 0.87, 28 years, 4% Electrolyser price (original = IDA 2050) – Investment, lifetime, O&M % of investment Interest rate 4% Figure 78 shows the impacts of changing investments for certain technologies in the energy system. In general, the changes have an equal impact on the IDA 2050 and the DEA Wind 2050 scenarios as the same savings and increases occur. The largest impacts from changes in investments are related to wind power, which can be related to the fact that the installed capacity is much higher for wind power than for other technologies. The hydrogen storage price is more significant than the electrolyser costs. The largest socio-economic cost increase occurs when the interest rate is changed from 3 to 4% as the overall costs then change by 7-8%, but it is visible that the increase is almost identical between the IDA 2050 and DEA Wind 2050 scenarios. The impacts of changes in other technologies are described in the relevant sections. 123 Investments O&M IDA 2050 Fuels Electricity exchange hydrogen storage +50% hydrogen storage ‐50% Low Electrolyser price wind price +50% wind price ‐50% Interest rate 4% Interest rate 4% hydrogen storage +50% hydrogen storage ‐50% High Electrolyser price wind price +50% wind price ‐50% Changes in Socio‐economic costs (Billion €/year) IDA’S ENERGY VISION 2050 2 1,5 1 0,5 0 ‐0,5 ‐1 ‐1,5 DEA 2050 CO₂ Figure 78. Changes in Socio‐economic costs when changing key assumptions for investments 124 IDA’S ENERGY VISION 2050 9 Biomass and waste Biomass and waste will be important resources in the future 100% renewable energy system. However these resources are limited. Due to the uncertainty about the sustainability of biomass resources, in this study estimations of the available potential are limited to the residual resources, or sustainably grown resources that can be harvested without impacting the environment. Residual biomass resources are defined as being byproducts of the primary production in bio-based sectors such as agriculture or forestry. Examples in these sectors would be straw (agriculture) or non-harvestable wood (forestry). 9.1 Biomass potential in Denmark Numerous studies have been done in the past 10 years on the potential of harvested residue biomass and biomass produced from algae or energy crops. In addition, the potential for biodegradable waste has also been estimated. When biomass potential is mentioned in this section it includes the biodegradable waste potential. The biomass potential for Denmark from different studies is presented below in Figure 79. The potential for algae and energy crops are less certain than the other resources thus in order to show the total resource excluding algae and energy crops and including these resources, the data is plotted three times. These results are sourced from previous IDA studies (IDA Energy Plan and IDA Climate Plan), the DEA, the Danish Commissions on Climate Change and other research projects. In 2006 the DEA estimated the biomass resource in Denmark for the report “Biomasseressourcer, Ressourcer til energiformål I Danmark”. The Danish Commission on Climate Change assessed the biomass potential for the “Grøn energy - vejen mod et dansk energisystem uden fossile braendsler” report [54] which took into account the economic and environmental constraints of biomass potential. It is explained in the report that it is expected that only 75 per cent of the estimated biomass resource would be realistic to use for energy purposes (233 PJ) since there may be a demand for biomass for other purposes such as for the manufacture of products currently produced from fossil fuels (plastic, etc.). In the previous IDA studies the Danish biomass potential for energy and materials purposes were estimated. In the CEESA study a detailed analysis was done on the biomass potentials, investigating numerous biomass resources [55]. In Gylling et al. (2012) [56] (+10 Mio Tons Planen - – muligheder for en øget dansk produktion af bæredygtig biomasse til bioraffinaderier) the maximum biomass potential is calculated and is based on a high level of optimisation which has some uncertainty. Therefore the study also included a less optimised, less risky and more certain scenario that considers the environmental impacts, and which has a lower biomass potential of around 230 PJ. In Elbersen et al. (2012) [57] (Atlas of EU biomass potentials) the aim was to provide an analysis of biomass supply and available options in a timeframe from 2010- 2030. This included a comprehensive mapped and quantified overview of different biomass feedstocks in Denmark. In Wenzel et al. (2014) [58] a carbon footprint was done assessing the impact of different biomass demands in Denmark. The results that that the maximum biomass potential is limited by concerns around biodiversity and security of supply. And these limitations lead to a recommended 40GJ/person/year or 200PJ per year potential. To achieve this level of biomass potential it would be necessary to use energy supply pathways that have low biomass demand, for example by supplementing the biomass conversion pathways with hydrogen. 125 IDA’S ENERGY VISION 2050 450 400 350 300 PJ 250 200 150 100 50 0 Excluding energy crops + algae Excluding algae Including all biomass resources (2006) Danish Energy Agency (2006) IDA Energy Plan 2030 (2009) IDA Climate Plan 2050 (2011) CEESA 2050 (2012) Grøn energi (2012) + 10 Mio Tons Planen (2012) Biomass futures: atlas (2014) Wenzel Carbon Footprint Figure 79: Biomass potential estimated in different studies As shown in Figure 79, when excluding the energy crops and algae most studies show a potential of around 130-150 PJ. When including all biomass resources most studies show a potential of between 200-250 PJ. In CEESA it was found that the range in biomass potentials is heavily affected by the level of food production and dietary choices in the country. The range can be from 100-800 PJ however the maximum level entails no export of agricultural products which is unlikely. In this study we assume the same agricultural structure and level of food production as today. This means that we consider mostly residual resources and this leads to an absolute maximum potential of around 250 PJ. However it is more likely that this should be closer to or below 200 PJ in order to reduce economic risk or the risk of environmental impacts. The global biomass potential has been estimated at between 10-50 GJ/capita which is based on three previous studies [59–61] (Figure 80). The studies were done by CONCITO a Danish Green Think Tank [59], the World Energy Council in a survey of energy resources [61] and International Energy Agency whom investigated the potential of bioenergy to meet the global energy demand [60]. Each of these studies investigated different scenarios for future biomass potential. 126 IDA’S ENERGY VISION 2050 Figure 80: Global biomass potential as estimated in these studies [59–61] Based on a population of 6 million in Denmark in 2050, Denmark has a share of the global biomass potential of between 60-300 PJ in total. This shows that the biomass potential in Denmark of between 200-250 PJ (3040 GJ/capita) is within the range of the global potential. Considering the biomass potential described above, when biomass was used in the IDA Energy Vision 2050 scenarios careful consideration has been made to have a biomass efficient system by utilising storage and synergies between the energy sectors. The actual use of biomass in IDA2050 and DEA Wind 2050 is subject to different context regarding how much biomass is consumed in other parts of the world and hence the biomass prices, as well as the international electricity price levels. Also the actual use of biomass would be a mix of domestic biomass and biomass traded internationally. In the IDA Energy Vision 2050 the concern is focused on the amount of biomass used and what types of biomass can be used. Not the origin of the biomass from year to year. 9.2 Biomass demand of the DEA and IDA Energy Vision 2050 scenarios The final biomass demand of the central scenarios in this study for a number of different technologies are presented in Figure 81. The results are presented for the central scenarios - reference 2015, DEA 2035 and DEA 2050 (fossil and wind), and IDA2035 and IDA2050, as well as IDA biomass optimised 2050. 127 IDA’S ENERGY VISION 2050 350 300 Waste incineration 200 Biogas, manure PJ 250 150 Straw, wood & energy crops (Solid for boilers, industry etc.) 100 50 Wood, energy crops (gasified for Transport) 0 Wood, energy crops (gasified for CHP) Figure 81: Biomass demands distributed on types in central scenarios As shown in Figure 81, the energy systems that have a high renewable energy integration (all systems excluding reference 2015 and the fossil systems) will have a biomass demand in the range of between 240310 PJ/year. 400 350 300 PJ 250 200 150 100 50 0 low medium DEA Wind 2050 high low medium high IDA 2050 biomass optimised IDA 2050 Figure 82: Biomass demand for low, medium and high biomass prices for the DEA Wind 2050 and IDA 2050, and IDA 2050 biomass optimised scenarios 128 IDA’S ENERGY VISION 2050 Future fuel prices are very uncertain as is the context of which the Danish energy system forms part. Therefore, the energy systems were modelled using low, medium and high biomass prices. The results for the DEA Wind 2050, IDA2050 and for the IDA biomass optimised 2050 scenario are presented in Figure 82. Using the medium prices for biomass, the results show that for the central scenarios the range in biomass demand is from 240-310 PJ. However, when using the different price level assumptions, it is evident that there is a large effect on the biomass consumption in the DEA biomass demand. It is evident that, when using the high biomass price in the DEA study and using the same assumptions for the energy system configuration, the biomass demand is consistent with the biomass potential of around 250 PJ. This means that the DEA study can be within the biomass potential limit, since the future biomass price is still uncertain. In the IDA scenarios, the biomass demand is between 180 and 270 PJ with the different prices. The IDA scenarios have a lower biomass demand due to the reduced biomass demand of the power plants and CHP plants and the higher wind power production. In the IDA 2050 biomass optimised scenario, the demand is 168 PJ. In this scenario, the biomass demand is minimised through ensuring that the system is fuel efficient by utilising storage and synergies between the energy sectors. As mentioned in Section 3.1 a total of 120 simulations of the effects of 10 electricity prices, the three different fuel price levels for DEA Wind 2050 and IDA2050 has been conducted for those two scenarios on their own to investigate the effects on the biomass consumption. The total range for DEA Wind 2050 is from 230 PJ to 482 PJ and for IDA2050 it is 123 PJ to 339 PJ. The biomass potential consists of numerous resource types, such as straw, wood, energy crops and not all these resource types are utilised in the same energy technologies. The same studies mentioned above, also split the biomass potential into different resource types in Denmark. The results from these studies are shown in Figure 83 [19,21,53,56,57,62,63]. 160 140 120 PJ 100 80 60 40 20 0 Wood Straw Biodegradable Biomass to waste biogas Energy crops Slurry fibre fraction (2006) Danish Energy Agency (2006) IDA Energy Plan 2030 (2009) IDA Climate Plan 2050 (2011) CEESA 2050 (2012) Danish Commission on Climate Change (2012) Gylling et al. Algae (blue biomass) Other bioenergy (2012) Elbersen et al. Figure 83: Biomass potentials from different resources based on different studies 129 IDA’S ENERGY VISION 2050 The results show that most biomass potential is in wood residues, straw, biomass for biogas (manure) and biodegradable waste. Energy crops will also provide a resource but it is uncertain how much is feasible. And there is less consistency between the studies about the potential of slurry fibre fraction, algae and other bioenergy. When comparing the biomass demand in the IDA 2050 scenario with the biomass resource types it is evident that the biomass demand is within the types of biomass available. For example the demand for wood and energy crops for gasified gas for CHP is around 100 PJ and the potential is around 100-110 PJ. Overall, based on the biomass potentials, it is evident that it is possible to construct a resource efficient IDA 2050 system that can be within reasonable levels of the biomass resources in Denmark. In addition, results indicate a good situation for Denmark in terms of utilising international biomass markets. 9.3 Waste for incineration In this study, priority was given to waste management and recycling of waste, and the remaining waste was utilised for energy. Out of the fraction of waste for energy, priority was given to gas and liquid fuel production either as part of biogas and if possible thermal biomass gasification or as bio-oil production of organic waste. The amount of biogas utilised in the IDA2035 and IDA2050 scenarios was the same as was used in the DEA scenarios. The remaining parts of waste that cannot be used for gas or liquid fuel production will be used in waste incineration together with similar fractions of biomass, which neither can be transformed into gas nor liquid fuel. The amount of waste sent to incineration is presented in Figure 81 above. For IDA2035 it was assumed that the biodegradable/non-biodegradable ratio for waste was 60/40 and in IDA2050 it was assumed that all waste will be biodegradable. The amount of incinerated waste, district heat and electricity production and efficiencies in the central DEA and IDA scenarios are presented in Table 42 below. Table 42: Waste sent to incineration and district heat and electricity produced with efficiencies for central scenarios Scenario Waste input (TWh) DH production (TWh) and efficiency Electricity production (TWh) and efficiency 2015 reference 10.42 5.39 (44%) 2.39 (28%) DEA fossil2035 10.7 7.6 (71%) 2.78 (26%) DEA wind2035 10.72 7.6 (71%) 2.78 (26%) DEA fossil2050 12.2 8.66 (71%) 3.17 (26%) DEA wind 2050 11.5 8.16 (71%) 2.98 (26%) IDA 2035 6.8 4.83 (71%) 1.77 (26%) IDA 2050 7.3 5.18 (71%) 1.89 (26%) It was assumed for the IDA Energy Vision 2050 scenarios that the recycling rate would increase in the future. This means that less waste will be sent to incineration for CHP production in the IDA2035 and IDA2050 scenarios. 130 IDA’S ENERGY VISION 2050 In the IDA Energy Vision 2050 scenarios the incinerated waste was calculated based on the waste for incineration values of the DEA Wind 2035 and 2050 scenarios (10.7 and 11.5 TWh, respectively). Firstly the amount of waste sent to recycling was determined for the IDA Energy Vision 2050 scenarios. The recycling rate in the IDA2050 scenario was set at 45% and the composting and digestion rate was set at 20%. This was based on information from Eurostat from 2014 [64] that showed that the leading countries today, Germany and Austria, have achieved these levels, and it was assumed that Denmark can also achieve this by 2035 and 2050. Figure 84: Eurostat data for municipal waste treatment by type and percentage for EU countries in 2012 [64] To determine the amount of waste for incineration in the IDA scenarios it was assumed that in the DEA 2035 and DEA 2050 scenarios the recycling rate had remained at 2012 levels. Based on Figure 84, in 2012, around 52% of the waste was incinerated in the DEA models, 32% was recycled, 13% used for composting and digestion, and around 3% was landfilled. By applying the higher recycling and composting and digesting rates in IDA 2035 and 2050, the incineration rate in the IDA models was set at 33%. This provided the adjusted waste input for incineration in the IDA scenarios. To determine the cost of recycling the additional waste instead of incinerating it, the cost was estimated based on the cost saved by reduced incineration. The cost saved by reducing the incineration was used for investment in increased recycling. The recycling costs are presented in Table 43. Table 43: Additional recycling costs in IDA 2035 and IDA 2050 Recycling costs Total cost (M€) Annual investment (M€) Fixed O&M (M€) IDA 2035 845 56 40 IDA 2050 905 61 43 131 IDA’S ENERGY VISION 2050 10 Health costs This chapter estimates the health costs associated with the reference energy systems and the energy systems in IDA’s Energy Vision 2050. The health costs are estimated for six different types of emissions. A comparison is made between the costs at an overall level and also, between the costs for the various different sectors. 10.1 Calculation of emissions for individual technologies The emissions of six different substances were calculated based on the most recent emission coefficients from [65]. The method used is similar to that used in IDA Climate Plan 2050 from 2009 [66]. Not surprisingly, emissions were greatest from the energy systems with the largest energy consumption. Emissions declined for the energy systems in the DEA Wind and IDA scenarios, primarily due to the fact that fuel consumption is either replaced by cleaner energy such as wind turbines or is eliminated in these scenarios. The results are shown in Table 44. Table 44 ‐ Emissions by six substances from energy systems in IDA’s Energy Vision 2050. Tons/year SO2 NOx CO PM2.5 Mercury Lead Ref2015 7,744 113,039 134,944 13,296 0.3 2.0 Fossil2035 5,723 116,879 183,665 16,459 0.4 2.2 Wind2035 4,554 109,915 108,309 10,751 0.1 1.9 IDA2035 7,094 109,257 50,155 3,577 0.1 1.4 Fossil2050 4,046 112,751 101,495 11,516 0.4 1.6 Wind2050 2,100 62,827 25,089 1,696 0.1 0.5 973 48,836 24,518 2,584 0.1 0.4 IDA2050 As shown in Table 44, going from the Ref2015 to Fossil2035, the Fossil2035 scenario sees a drop in SO2 emissions, whereas all other emissions are increased. This is due to an increase in coal consumption in Fossil2035 compared with Ref2015, whereas the drop in SO2 emissions mostly is due to a decrease in individual oil boilers. For Wind2035, all emissions are reduced compared with both Ref2015 and Fossil 2035, which is mainly due to coal not being used in Wind2035. In IDA2035, the NOx, CO, PM2.5 and Lead are reduced. Compared with Fossil2035, this is mainly due to a reduced coal use in IDA2035, and compared with Wind2035, it is due to a decrease in waste incineration and a reduced use of biomass for individual heating. The SO2 emissions increase in IDA2035 compared with the other 2035 scenarios, which is mainly due to a comparable high use of biomass in central CHP and power plants. Going to 2050, it is shown that Fossil2050 has significantly more emissions than both Wind2050 and IDA2050, which is primarily due to the fact that coal is still heavily utilised in the electricity and heat sectors alongside oil in the transport sector. Except for PM2.5, all emissions in IDA2050 are lower than in Wind2050. PM2.5 is higher in IDA2050 than Wind2050 due to a higher individual use of wood products for heating purposes in 132 IDA’S ENERGY VISION 2050 IDA2050. However, a lower utilisation of biomass in the central district heating and transport sectors alongside less incineration of waste in IDA2050 result in a general lower level of emissions in IDA2050. 10.2 Health costs of the individual elements of the energy systems Using the above estimation of emissions from the different sources, health costs can be calculated based on the most recent known costs for the specific fuel, specific technology, and the actual location of the point sources, as well as the number of persons who will be affected by the emission. Thus, the environmental cost of damage to natural habitats and animal species is not included in the calculations, nor is the cost of damage to cultural heritage such as buildings etc. In IDA’s Energy Vision 2050 health costs from DCE - National Centre for Environment and Energy from December 2014 [65] are used for SO2, NOx, CO and PM2.5. For mercury and lead [65] is used. According to the reference energy system for 2015 and the DEAs fossil scenarios, in the case of electricity and heat production, health costs to society are primarily linked to emissions of SO2 and NOx from the burning of coal in power and CHP stations. In relation to heat-producing boilers, the largest costs originate from the consumption of biomass for individual heating, due to its emission of small particles (PM2.5). The greatest health costs originating from the transport sector are linked to NOx emissions due to the consumption of diesel. In the energy systems from IDA’s Energy Vision 2050, costs are lower than in the DEA wind scenarios. Costs are especially reduced due to the lower consumption of coal in electricity and heat production. Similarly, the conversion to district heating, geothermal heat pumps, and solar thermal means that there is a reduction in the cost of emissions from the burning of wood in individual households. These trends continue up to 2050 when more renewable energy is introduced into the electricity system, which replaces solid fuels. In addition, health costs originating from the transport sector are further reduced as there are more electric cars, hybrid cars, and rail transport. The health costs for the six types of emissions are shown in Table 45. 133 IDA’S ENERGY VISION 2050 Table 45 ‐ Health costs by technology and fuel Health costs, € million/year Ref Power plants and CHP plants Fossil Wind IDA 2015 2035 2050 2035 2050 2035 2050 Coal Steam turbine Central plant 77 142 108 - - 1 - Natural gas Steam turbine Central plant 3 0 1 5 18 6 22 Natural gas Gas turbine Decentralised plant 11 14 14 15 7 7 10 Biogas Gas turbine Decentralised plant 4 - - 4 - 2 - Waste Steam turbine Decentralised plant 37 38 44 38 41 24 26 Biogas Motor Decentralised plant - - - - - - - Straw Steam turbine Decentralised plant 37 1 - 67 - 160 - Whole chips, residues etc. Steam turbine Decentralised plant 16 0 - 30 - 71 - Subtotal 186 196 167 158 66 271 58 - Heat-producing boilers Fuel oil, waste oil Boiler District heating plant etc. 25 11 - - - - Gas oil Boiler District heating plant etc. 85 10 - 22 - 35 - Straw Boiler District heating plant etc. 18 - - 39 21 32 7 Natural gas Boiler District heating plant etc. 22 9 - 12 4 10 9 Wood Boiler District heating plant etc. 21 - - 27 86 21 21 Natural gas Boiler Single dwelling system 13 1 - - - - - Wood etc. Boiler Single dwelling system 374 507 345 307 - 58 53 Gas oil Boiler Single dwelling system 17 - - - - - - Subtotal 574 538 345 407 111 156 90 - Transport Diesel Private vehicles Average 108 - - 54 - 26 Petrol Private vehicles Average 34 62 15 23 15 6 - Biodiesel Private vehicles Average - - - - - 16 15 Methanol 4 Private vehicles Average - - - - - 4 Diesel Busses Average - 13 11 11 - 10 - Biodiesel Busses Average - - - - - 2 - Natural gas Busses Average - 1 5 2 9 - - Methanol Busses Average - - - - - 2 - Diesel Trains Average - 7 0 7 - - - Diesel Flights & ferries Average 665 877 874 639 - 591 - Biodiesel Flights & ferries Average - - - 121 443 37 270 Diesel Lorries & trucks Average 56 39 51 62 - 50 - Biodiesel Lorries & trucks Average - - - 6 26 13 39 Biogas Lorries & trucks Average - 8 32 8 32 - - Methanol Lorries & trucks Average - - - - - 11 34 Biogas Ships Average - 8 33 8 33 - - Diesel Ships Average 67 - - - - 103 - Methanol Ships Average - - - - - 7 46 Biodiesel Ships Average - - - - - 6 40 Subtotal 930 1,014 1,021 940 558 882 448 Total 1,690 1,750 1,530 1,510 730 1,310 600 134 IDA’S ENERGY VISION 2050 10.3 Total health costs Health costs are calculated on the basis of six different emissions: SO2, NOx, CO, particles (PM2.5), mercury and lead. IDA’s Energy Vision 2050 contains, in particular, reductions in emissions of NOx, CO, and SO2. However, there are also reductions in emissions of mercury and lead. The reductions primarily occur due to reductions in the volumes of coal used in the power plants, the volumes of diesel and petrol in the transport sector, the need for oil in industry, and the requirement for wood. On the other hand, emissions increase slightly due to an increased use of CHP and power production within the Danish energy system, when comparing to DEA’s wind scenarios. Total costs can be calculated based on the most recent data on health costs originating from emissions from the different types of technologies, fuels, and locations of point sources. Costs are identified by counting the work days lost, hospital admissions, damage to health, deaths, etc. In IDA2035, these costs are reduced to approx. € 1.3 billion, while in IDA 2050 the total health costs are reduced to approx. € 0.6 billion. Thus, as seen in Figure 85, if the initiatives in IDA’s Smart Energy System are implemented, there will be savings of approx. € 0.9 billion in 2050, compared with DEA Fossil 2050, and about € 0.1 billion in 2050, when compared with DEA Wind 2050. As the total costs are based on current emission factors, it must be emphasised that this type of estimate only gives an indication of the total socio-economic costs. The health costs by sector are shown in Figure 85. 2.000 1.800 1.600 Million EUR/year 1.400 1.200 1.000 800 600 400 200 ‐ 2015 2035 Reference 2050 DEA Fossil Power and CHP plants 2035 2050 2035 DEA Wind Boilers (heat) 2050 IDA Transport Figure 85 ‐ Total health costs originating from the energy systems, by sector. The health costs included are exclusively based on the six emissions and do not include the environmental cost of damage to nature and animal life or the cost of mining for fuels and materials overseas, e.g. from a coal mine in South Africa. Thus, the estimate is rather conservative. The total health costs include costs that 135 IDA’S ENERGY VISION 2050 occur outside of Denmark, as such, it is relevant to estimate the effect in Denmark. This is done using the same method as in IDA Climate Plan 2050 from 2009 [66]. These costs are listed in Table 46. Table 46 ‐ Health costs by technology and fuel in Denmark Health costs, DKK million/year Ref Power plants and CHP plants Fossil Wind IDA 2015 2035 2050 2035 2050 2035 2050 Coal Steam turbine Central plant 6 12 9 - - 0 - Natural gas Steam turbine Central plant 0 0 0 0 1 0 1 Natural gas Gas turbine Decentralised plant 1 1 1 1 0 0 1 Biogas Gas turbine Decentralised plant 0 - - 0 - 0 - Waste Steam turbine Decentralised plant 3 3 3 3 3 2 2 Biogas Motor Decentralised plant - - - - - - - Straw Steam turbine Decentralised plant 3 0 - 5 - 13 - Whole chips, residues etc. Steam turbine Decentralised plant 9 9 8 8 4 14 3 Subtotal 22 24 21 18 8 30 7 - Heat-producing boilers Fuel oil, waste oil Boiler District heating plant etc. 3 1 - - - - Gas oil Boiler District heating plant etc. 10 1 - 3 - 4 - Straw Boiler District heating plant etc. 2 - - 5 3 4 1 Natural gas Boiler District heating plant etc. 2 1 - 1 0 1 1 Wood Boiler District heating plant etc. 3 - - 4 11 3 3 Natural gas Boiler Single dwelling system 1 0 - - - - - Wood etc. Boiler Single dwelling system 162 221 150 133 - 25 23 Gas oil Boiler Single dwelling system 3 - - - - - - Subtotal 186 224 150 145 14 37 27 Transport Diesel Private vehicles Average 22 - - 11 - 5 - Petrol Private vehicles Average 9 17 4 6 4 2 - Biodiesel Private vehicles Average - - - - - 3 3 Methanol Private vehicles Average - - - - - 1 1 Diesel Busses Average - 2 2 2 - 2 - Biodiesel Busses Average - - - - - 0 - Naturgas Busses Average - 0 0 0 0 - - Methanol Busses Average - - - - - 0 - Diesel Trains Average - 0 0 0 - - - Diesel Flights & ferries Average 21 28 28 21 - 19 - Biodiesel Flights & ferries Average - - - 4 15 1 9 Diesel Lorries & trucks Average 3 2 3 3 - 3 - Biodiesel Lorries & trucks Average - - - 0 1 1 2 Biogas Lorries & trucks Average - 0 2 0 2 - - Methanol Lorries & trucks Average - - - - - 1 2 Biogas Ships Average - 0 1 0 1 - - Diesel Ships Average 3 - - - - 4 - Methanol Ships Average - - - - - 0 2 Biodiesel Ships Average - - - - - 0 1 Subtotal 58 51 40 48 24 41 20 Total 270 300 210 210 50 110 50 136 IDA’S ENERGY VISION 2050 Costs originating from CO2 emissions are not included in the calculation of health costs. However, environmental and health costs may amount to over DKK 1,000 per ton of CO2. Thus, the market price for CO2 quotas is unlikely to cover the full socio-economic cost. As it is difficult to calculate these costs, estimates are often based on markets prices or the expected price of a CO2 quota which ideally, should reflect the cost of reducing CO2 emissions. For the purpose of the estimation of the costs in the energy systems, the CO2 quota price is included in the IDA’s Energy Vision 2050, see. Section 2.8.1. This corresponds to the cost of reducing CO2 emissions in a market that functions optimally. The cost level of 2015-€ 42 per ton of CO2 is used as a base cost. It can be debated if this figure is somewhat low compared to the cost imposed on society. 137 IDA’S ENERGY VISION 2050 11 Employment The implementation of IDA Energy Vision 2050 results in a reallocation of energy costs: the purchase of fossil fuels is replaced by investments and higher expenses on operation and maintenance. This reallocation could potentially contribute to domestic employment and improve the balance of payments at the same time. The commercial potential can be even larger if the first mover strategy spurs an industrial development and thus lays the foundation for a long-term export potential. The energy scenario may also play an important role as a contributor to economic development and employment at the local and regional level. 11.1 Calculation of types of cost and employment effect The calculation of the employment effect is based on a breakdown of IDA’s Energy Vision and reference scenarios into different categories of annual costs. The calculation does not consider the question of when specific investments are made in different technologies, infrastructures and renovations— all having diverse technical lifetimes – but refers to the aggregate annualised costs of the scenarios in 2035 and 2050, respectively. The job calculation is only done for the electricity and heating sectors. IDA Energy Vision 2050 has an expectation to future transport demand which diverges from the DEA scenarios. Therefore, for the purpose of comparison, the transport part of the system cost is excluded from the job calculations. The remaining system cost for the different categories is shown in Figure 86. As shown, IDA Energy Vision 2050 phases out costs on fossil fuels and the associated CO2 emissions, whereas they remain as an expense in the fossil reference. On the other hand, costs for investments in infrastructure and production capital increase more in the renewable scenarios than in the fossil reference. Likewise, funds allocated for operation and maintenance are higher in the renewable systems than in the fossil reference. 16000 14000 Cost/year, MEUR 12000 10000 8000 6000 4000 2000 0 ‐2000 DEAFossil2035 DEAWind2035 IDA2035 DEAFossil2050 DEAWind2050 IDA2050 Investments (Machinery & Production units) Investments (Building, DH expansion, etc) Fuels excl. Biomass Biomass O&M CO2 cost Elecricity exhange Figure 86: Total annual electricity and heat cost 138 IDA’S ENERGY VISION 2050 The investment costs are broken down into two sections: ‘Building and Construction’, including the installation of district heating, energy savings etc., and ‘Machinery and Production Units’, which includes wind turbines, CHP units, heat pumps etc. The total turnover is more or less at the same level for all scenarios. The share of turnover which is allocated to domestic employment is estimated based on prior investigations into import shares of different cost types in the energy system [67]. These shares have been applied in round numbers in order to indicate the relative large uncertainty about such figures. Table 47: Import share by type of cost Type of cost Import share in percent Investment - Buildings, construction incl. district heating network 30 per cent Investments - machinery and production units/plants 40 per cent Operations and maintenance 20 per cent Fossil fuels (Coal, oil and gas) 90 per cent Biomass fuels 20 per cent Jobs created per million € of domestic turnover: 15 Upon estimating the domestic share of turnover, it is assumed that 15 jobs will be created for every € 1 million remaining. This also includes derivative jobs. Naturally, it must be emphasised that this job effect is a rough assumption and accordingly is quite uncertain. In general, the capacity to transform turnover into jobs will depend on the exact institutional structure that will be present in 2035 and 2050, respectively. Three key elements of uncertainty should be kept in mind when assessing the job estimates, namely; 1) the applied price forecasts in the scenario modelling, 2) the applied import shares which determine domestic turnover, and 3) the applied employment-to-turnover ratio. Leaving uncertainty about the quantifications aside, the analysis may still draw some general patterns and tendencies which are relevant for the discussion on the future energy system. 11.2 Total employment effect Applying the above-mentioned method and assumptions, the employment effects of the different references have been compared. The estimated employment effect of each scenario is depicted in Figure 87. The results indicate that 50,000 additional jobs/year can be created in 2050 if IDA Energy Vision 2050 is implemented. This contribution is the net-effect compared to the fossil reference. It should be noted that the DEA’s wind scenario returns the same numbers in 2050 as IDA Energy Vision 2050. However, in 2035, the employment effect is slightly higher in IDA Energy Vision 2050 – around 15,000 jobs/year. This is mainly due to higher levels of investments in 2035 in IDA Energy Vision 2050. In 2050, the DEA’s wind scenario is catching up on investments. The effect from IDA Energy Vision 2050 is around 30,000 additional jobs/year in 2035 compared to the fossil scenario. In general, the transition to a renewable energy system means that jobs relating to the handling of fossil fuels are discontinued, whereas jobs relating to investment in renewable energy technologies are created. 139 IDA’S ENERGY VISION 2050 160.000 140.000 Jobs/year 120.000 100.000 80.000 60.000 40.000 20.000 0 DEAFossil2035 DEAWind2035 IDA2035 Investments (Machinery and Production units) Fuels excl. Biomass O&M DEAFossil2050 DEAWind2050 IDA2050 Investments (Buildings, DH expansions, etc) Biomass Figure 87: Annual employment per year In summary, the employment analysis concludes that 1) a renewable energy system creates more domestic employment compared to the fossil reference, and 2) the earlier the investments are made, the earlier will the employment effect appear. Based on these conclusions, it could be argued that the main part of investments should be made as close to the beginning of the period as possible. There are two reasons for this. Firstly, the workforce as a share of the total population declines during the whole period up to around 2040 and hence, more working capacity is available to make changes to the energy system at the beginning of the period. Secondly, Danish North Sea fossil resources will run out during the period. Hence, it is important to develop an energy supply based on renewable resources as early as possible and therefore increase the export of renewable energy technology to replace the export of oil and natural gas that will diminish and cease altogether over the next 10 to 20 years. The employment effect resulting from an increase in the exports of energy technology has not been quantified. This is an additional benefit to the numbers above. In addition to the development of the national energy supply, IDA Energy Vision 2050 may also spur innovation and contribute to an increased export potential. Currently, the export of so-called green products amounts to above € 9 billion [68]. As it has been the case in areas of, e.g., wind power, district heating and pumping technologies, a first mover policy may secure a competitive advantage for the Danish industry. Given the assumption that access to sustainable energy supply represents a global need, developing expertise in such technologies and system solutions may lay the foundation for a longer term export potential. This potential has not been quantified in the present analysis but might represent the most important long-term contribution to Danish employment. Assuming an import share of 50%, an annual export of € 20 billion would generate up to 150,000 jobs. Of course, this depends on the rate of export that would have been possible without the IDA Energy Vision 2050, the extent of unemployment, and the extent to which the unemployed workforce can be employed in other export industries. In general, it should be noted that the employment analysis above has applied a demand side approach to employment where any possible supply restraints have not been taken into consideration. In other words, it is 140 IDA’S ENERGY VISION 2050 assumed that the required labour supply would be available. In this context, it should be noted that a proportion of the Danish workforce will become available as the extraction of oil and gas from the North Sea is phased out. Any shortage in the labour supply 35 years ahead must be considered unknown today. If full employment should be permanently present in the Danish economy for the next 35 years – which in a historical perspective is to be considered unlikely – a higher net import of labour would be necessary in the renewable scenarios. In such a 'worst case' situation where domestic labour supply is not available, a renewable energy system will merely have to import labour instead of importing fuels as it is done in the fossil alternative. For the fossil alternative, however, a worst case situation of high unemployment would be further worsened by the outflow of capital for fuel import. In that respect, the renewable scenarios carry a lower economic risk - and greater opportunities. 11.3 Regional and local employment effects The above analysis concerns the aggregate levels of the employment effect. It is relevant also to consider the geographical distribution of this net contribution within the national borders. Investments in e.g. building renovations may result in local and regional employment in areas outside the bigger cities. Likewise, the bulk part of energy resources in IDA Energy Vision 2050 is located within national boarders but outside the bigger cities. Recent work on concrete local and regional energy plans finds large derived potentials for local and regional socioeconomic development and employment [69][70]. The energy scenarios presented may thus not only contribute to aggregate national employment levels but also imply a more equal and geographically distributed economic development. 141 IDA’S ENERGY VISION 2050 12 Conclusion IDA’s Energy Vision 2050 shows a pathway towards 100% renewable energy in 2050 and the scenario in this report is one of several possible ways of achieving 100% renewable energy. In this chapter, and in the executive summary, the main findings in IDA’s Energy Vision 2050 are described. The results are all based on hour-by-hour energy system analyses of the entire energy system including transport. The results are based on energy system analyses of seven scenarios using 3 different fuel price levels and 10 different levels of electricity prices on the international electricity markets. In addition, more than 80 central sensitivity analyses have been conducted. This makes the analyses based on more than 400 simulations. 12.1 Main findings From a methodology point of view, IDA’s Energy Vision 2050 is based on the fact that uncertainties predominate in relation to the future energy system regarding biomass availability and fuel costs and investments in savings and renewable energy. Moreover, prices in the northern European electricity markets are uncertain. Therefore, IDA’s Energy Vision 2050 seeks to design a system that is robust to such changes, rather than trying to identify an optimal solution on given assumptions. The comprehensive analysis behind the design of IDA’s Energy Vision 2050 shows that: Large-scale integration of fluctuating renewable energy and the design of a 100% renewable energy system are technically and physically possible in Denmark. However, further development of essential technologies is required. The costs associated with a 100% renewable energy system are comparable to the costs of current systems, even when including transport. The 100% renewable system can significantly reduce the dependence on fuels as higher focus is placed on investments in technologies that do not consume fuels. The security of supply and resilience are increased by changing the cost structure towards a more investment heavy system, lowering the risks of fluctuating fuel prices and ensuring certainty about energy costs for citizens and businesses. A sector-integrated Smart Energy System strategy is more robust than a single-sector focused approach. Such a system has lower costs, uses biomass more efficiently and exploits international electricity markets in uncertain contexts. IDA’s Energy Vision strategy is a more robust and secure system than a system design that integrates renewable energy into the electricity sector. The large-scale integration of fluctuating renewable energy takes place between all energy sectors – electricity, heating, cooling, transport and industry. A Smart Energy System approach is used to design this 100% renewable energy scenario for 2050. IDA’s Energy Vision 2050 is based on ambitious targets for electricity and heat savings, as well as savings in industry. The heat savings are designed in a way that emphasizes a balance between the costs of producing low-temperature district heating on one side and improving the building envelope on the other side. The Smart Energy System approach ensures the utilisation of cost-effective synergies with the exchange of energy between sectors, while using low-cost storages across smart electricity, smart thermal and smart gas grids. Strong emphasis is on electrifying transport, as well as heating and industry demands. Going towards 100% renewable energy, the changes in cost structure from high fuel costs to high investment costs support other activities in society. Imports of fossil fuels are replaced with energy efficiency measures and it is therefore crucial to properly plan long-term energy infrastructure investments to achieve this goal. In comparison to a fossil fuel-based energy system, IDA’s Energy Vision 2050 confirms that renewable energy systems are more job intensive for Denmark. 142 IDA’S ENERGY VISION 2050 12.2 The key technologies in IDA’s Energy Vision 2050 IDA’s Energy Vision for 2050 meets the energy demands and services in an energy system where economic growth has increased industrial production, more heat is required due to a growing building area, energy services from electricity demands increase because of more appliances, and transport demands grow. The key technologies in IDA’s Energy Vision can be categorised into savings, fluctuating renewable energy (electricity and heat), and components able to bridge the electricity, heating and gas sectors in a fuel- and cost-efficient manner. These key components result in reduced and changed demands for households, industry and transport in the future compared to today. A number of key principles have been applied in IDA’s Energy Vision as listed in Figure 88. Savings Conversion Renewable energy sources •All energy savings have high priority as they reduce energy demands and the need for new renewable energy capacity •Heat savings in buildings and industry should be prioritized •Heat savings should be implemented until a level where supplying heat becomes cheaper than additional heat savings •Modal shifts towards public transport are needed to reduce transport energy demands •District heating and cooling network expansions should be implemented where feasible •Electricity should be prioritised for efficient heating (heat pumps) purposes in industry and buildings •Transport demands should be met by electricity, e.g., in rail and in different types of electric vehicles where possible •Large‐scale implementation of onshore and offshore wind power, PV and other renewable sources should be installed •Low‐cost energy sources should be prioritised for heat supply, e.g., surplus heat from industrial processes and solar thermal •Heat pumps should be used to harvest low‐temperature heat for district heating and cooling purposes while also using electricity from wind power •Transport fuel demands should be supplied with electrofuels using electricity, CO2 and biomass Figure 88: Key principles applied in IDA’s Energy Vision 2050 The key principles applied have resulted in the following characteristics in the IDA 2035 and IDA 2050 energy system scenarios: Energy savings implemented: Electricity savings are implemented in households as a combination of more efficient appliances (15%) and behavioural changes (20%). More appliances are expected in the future counteracting savings (10%). In total, 10% savings are implemented in IDA 2035 and 25% in IDA 2050. 143 IDA’S ENERGY VISION 2050 Flexible electricity demands are implemented considering the different characteristics of “classical electricity” demands in industry and households. Some flexibility is implemented over a day and some over a week. In industry and services, high growth in both electricity and fuel demands has been offset by savings in both areas. Heat savings have been highly prioritized in existing buildings amounting to a total of 42% savings, equalling a reduction in heat demands from 132 kWh/m2 (including hot water) to approximately 80 kWh/m2. Heat savings are implemented until a level where supplying heat is assessed to become cheaper than additional heat savings. In new buildings, IDA’s Energy Vision suggests a heat demand of 55 kWh/m2. This demand should only reflect the heat demand in the building and not include onsite energy production (building codes often mix up onsite production and heat demands). For transport, a 42% higher passenger transport demand than today is covered, while freight transport demands almost double in comparison to today. High priority is given to investments in public transport and modal shifts to rail, which results in an increase in public transport of 82%. Conversions implemented: The district heating coverage has been expanded from a level of approximately 53% of the total heat demand in buildings today to a level of 66%. Large-scale heat pumps (700 MWe) for district heating have been implemented to improve system flexibility and efficiency. Individual heat pumps cover 75% of the heat demand (including hot water) outside district heating areas. Industry demands are converted to district heating and cooling, heat pumps, electric boilers, biomass and green gases. In the transport sector, electrification has been prioritised resulting in 75% coverage of the private car and van transport demand by battery electric vehicles and an additional 10% by plug-in hybrids, whereas electric busses meet 15% of the bus transport demand and the railway system is fully electrified. Renewable energy supply implemented: For onshore wind power, offshore wind power and PV, the installed capacities are, respectively, 5,000 MW, 14,000 MW and 5,000 MW. The total electric capacity for power plants and CHP plants is 6,000 MW and these are supplied by gasified biomass in combined cycle gas turbines. Solar thermal and geothermal heat production cover, respectively, 15% and 5% of the heat demand in central larger district heating areas, and 10% and 25% in decentralised smaller district heating areas. Large-scale heat pumps in district heating areas cover 20% of the district heating demands. Industrial waste heat, waste incineration (CHP) and surplus heat from gasification cover approximately 40% of the total district heating demands. Electricity is converted to hydrogen through electrolysis and the hydrogen is further used together with a carbon source to produce electrofuels. These electrofuels are primarily used in heavy duty transport and are evenly distributed between bio-based and CO2-based electrofuels. Gasified biomass is produced to meet fuel demands for electrofuels, power plants and industrial purposes. Solid biomass is used to meet energy demands and services that cannot be met by other renewable energy sources and covers minor shares of individual heating, district heating and industry. 144 IDA’S ENERGY VISION 2050 12.3 Smart Energy System components in IDA 2050 The Smart Energy System is based on three grids: Smart Electricity grids, Smart Thermal (heating and cooling) grids and Smart Gas grids. Components have been installed in the energy system to ensure a high flexibility on the demand side using the grids and storages available in the system across sectors. 100% renewable energy is achieved without batteries or electricity storage if the purpose is to put electricity back into the grid. This avoids high costs and round-trip losses. High electrolyser capacities in combination with hydrogenation o Provide flexible electricity demands (50% operation time for electrolysers) o Connect electricity, gas and thermal grids o Use gas storages and storages in liquid fuels (electrofuels) Smart charge of electric vehicles o Provides flexible electricity demands o Uses battery storage in vehicles High large-scale heat pump capacities o Provide flexible electricity demands o Provide flexible heat supply o Use large thermal storages Individual heat pumps o Provide flexible electricity demands o Use small thermal storages Flexible electricity demands in households and industry (demand shift) o Provide flexible electricity demands Thermal and gas storages o Provide flexibility between end demands and inputs from baseload and fluctuating heat and gas sources (gasified biomass and biogas) o Connect electricity, gas and thermal grids Combined heat and power plants o Provide flexible electricity supply o Provide flexible heat supply o Use thermal and gas storages 12.4 Primary energy and biomass consumption in IDA 2050 In Figure 22, the primary energy consumption in IDA 2035 and IDA 2050 is shown using medium fuel price assumptions. In IDA 2050, the total primary energy supply is decreasing from the current level of approx. 200 TWh to 160 TWh in 2050, equal to a decrease from approximately 720 PJ to 575 PJ. 145 IDA’S ENERGY VISION 2050 Primary Energy Supply (TWh/year) 250 200 150 100 50 0 DEA fossil 2015 DEA wind IDA DEA fossil 2035 DEA Wind IDA 2050 Coal Oil Gas Biomass/waste Onshore Offshore PV Wave/tidal Geothermal Solar thermal Figure 89: Primary Energy supply in 2035 and 2050 in the IDA Energy Vision, in 2015 and in the DEA scenarios using the medium fuel price assumptions corresponding to the oil price of 105 $/barrel. The IDA 2050 energy system has been analysed using combinations of three different fuel price assumptions and 10 different electricity price levels. These analyses conclude that international electricity exchange and fuel prices have very large effects on both the DEA and IDA scenarios. The biomass consumption ranges from 230 PJ to 480 PJ in the DEA Wind 2050 scenarios and from 123 PJ to 340 PJ in the IDA 2050 scenarios. The large variation shows that the system design in IDA 2050 is able to have a lower biomass demand than the DEA 2050 scenarios under all given circumstances. The large differences are mainly two very large variations in electricity exchange and the implied consumption of biomass on power and CHP plants in Denmark. In Figure 90 the biomass demands are illustrated together with the estimated Danish residual biomass resources as well as the Danish share of the global biomass resources. 146 IDA’S ENERGY VISION 2050 Biomass demands and potentials (PJ/year) 600 500 400 300 200 100 0 DEA Wind 2050 IDA 2050 Minimum demand Biomass demand according to fuel and electricity prices Danish biomass potentials range Danish share of world biomass potentials Central scenarios Figure 90: Biomass demands in DEA Wind 2050 and IDA 2050 under three fuel price level assumptions and 10 different levels of electricity prices. In addition, the biomass potentials for Denmark and an estimated Danish share of the global biomass potentials are illustrated. The central scenarios with medium fuel price and electricity assumptions. 12.5 Socio-economic costs of IDA’s Energy Vision 2050 The cost of IDA’s Energy Vision 2050 has been calculated as annual cost divided into fuel, operation and maintenance, electricity exchange, and investments. The investments are shown as annual cost using a calculation rate of 3% and the expected lifetime of the technology in question. The results are shown in Figure 91 where IDA’s Energy Vision is compared to the DEA wind scenario using the same methodology and cost assumptions. As can be seen, the direct cost of IDA’s Energy Vision, IDA 2050, is lower than for the DEA Wind 2050 scenario. The emissions of six different substances were calculated based on the most recent emission coefficients in order to find the health costs based on the specific fuel, specific technology, and the actual location of the point sources, as well as the number of persons who will be affected by the emission. The results indicate that in the IDA 2050 scenario the health costs will be 600 million €, which is rather similar to the DEA Wind 2050 scenario. The fossil scenarios cause health costs that are almost 1 billion € higher than the renewable scenarios. The IDA Energy Vision 2050 phases out costs on fossil fuels and the associated CO2 emissions, whereas they remain as an expense in the fossil reference. On the other hand, costs for investments in infrastructure and production capital increase more in the renewable scenarios than in the fossil reference. The results indicate that 50,000 additional jobs/year can be created in 2050 if IDA Energy Vision 2050 is implemented. This contribution is the net-effect compared to the fossil reference. Furthermore, in the DEA Wind 2050 a similar number of jobs in 2050 is created. The employment analysis concludes that 1) a renewable energy system 147 IDA’S ENERGY VISION 2050 creates more domestic employment compared to the fossil reference, and 2) the earlier the investments are made, the earlier the employment effect will appear. Socio‐economic costs (billion €/year) 30 25 20 15 10 5 0 ‐5 DEA Wind 2050 IDA 2050 Central scenarios cost structure Electricity exchange Investments DEA Wind 2050 IDA 2050 + 4% interest rate Fuels O&M DEA Wind 2050 IDA 2050 Verying fuel & electricity prices Minimum cost DEA Wind 2050 IDA 2050 Vehicle costs + 20% Cost range according to fuel and electricity prices Figure 91: Total socio‐economic costs for DEA Wind 2050 and IDA 2050 in the central scenarios with medium fuel and electricity assumptions, in a situation with higher interest rates and with ranges from sensitivity analyses A sensitivity analysis using an interest rate of 4% instead of 3% has been conducted and illustrated in Figure 91. As can be seen, the total costs of all scenarios are sensitive to the interest rate, since most of the costs are associated with investments. However, a change in interest rate does not have any significant influence on the difference between the two scenarios. In IDA’s Energy Vision 2050, the future fuel prices, electricity prices and the uncertainty about the international context in which Denmark is, are regarded as central for assessing the robustness and resilience of the IDA scenarios. By varying the fuel prices and the electricity prices on the international electricity markets, it is possible to show how the IDA scenarios and the DEA scenarios react to different international circumstances. Import risks exist in two forms. Firstly, there may be a lack of power plant capacity to produce electricity outside Denmark due to the current trend of declining capacities in Northern Europe. This means that situations may arise where it is not physically possible for Denmark to import due to insufficient power plant capacity in periods with low wind power production. Secondly, in these periods with low wind power production, the electricity prices may become too high due to the increased demand across countries. Low wind power production is likely to also occur outside Denmark and power plant capacities will be needed outside Denmark as well. Export risks exist as the weather patterns are rather similar between neighbouring countries, which means that there will be an excess of wind power and PV power production in these countries in the same periods as in Denmark. Firstly, congestion in transmission lines is likely to occur, making it physically impossible to export even with higher transmission line capacities than today. Secondly if transmission capacity is available, the high wind power production occurs at the same time in the northern European area, and hence, this will lead 148 IDA’S ENERGY VISION 2050 to a decreasing or even negative electricity price. These four electricity exchange risks are worth considering when planning for a future energy system. The IDA 2050 scenario represents an energy system design with electricity trade between sectors as a the main strategy to increase the cost-effectiveness using the smart energy system approach; i.e., that electricity can cost-effectively be used in heating and transport while also being traded on international electricity markets when good opportunities occur. The result of this analysis is shown in Figure 91 and concludes that IDA’s Energy Vision 2050 is robust and flexible to changes in fuel prices as well as changes in prices and potential restrictions on future international electricity markets. An example of the sensitivity of the results with regard to investments is included to give an insight into how robust the system is. The most dominant single type of investment – transport vehicles including electric vehicles – is used to illustrate this with an extra 20% cost in Figure 91. Today, a total of more than € 40 billion is invested in vehicles. This amounts to € 6.7 billion in annual costs including operation and maintenance. The costs in DEA 2050 are slightly higher at € 7.3 billion/year, while the amount is identical in IDA 2050 with € 6.7 billion/year. While this would increase the costs, the modal shift and transport in IDA 2050 means that this system has a slightly lower sensitivity than DEA 2050, due to a higher amount of vehicles in the scenario. Compared to the current 2015 energy system, where the costs of fuels on an annual basis may vary from € 6.6 billion/year to € 10.5 billion/year, the difference in both DEA 2050 and IDA 2050 is about € 1.4 billion/year. A number of sensitivity analyses have been conducted to investigate the influence of various technologies and assumptions in groups of: heat demand and production, electricity demand and production, transport, technology efficiencies, and costs. In regard to electricity production, it was found that it is possible to replace some of the biomass consumption with a higher wind power production; however, this significantly affects the export. Also the wind investment costs are significant to the overall system. Individual heat pumps are crucial for the system as these reduce the biomass significantly compared to using biomass boilers and, at the same time, they contribute with an enhanced flexibility in the system. A higher share of biomass boilers will, however, result in lower energy system costs. The efficiency and development of certain key technologies are crucial, as these technologies have a large impact on the overall system in terms of reduced costs and biomass demand. These technologies are electrolysers, power plants and CHP plants, as well as efficient renewable electricity technologies. When these technologies are implemented with similar specifications in the DEA Wind 2050 and the IDA 2050 scenarios, the cost difference between the two scenarios tends to decline. In all cases, the biomass demand is lower in the IDA 2050 scenario due to higher system efficiency and ability to integrate renewable energy. This was found when implementing higher renewable electricity production in DEA Wind 2050 and comparing the critical excess electricity production levels. In transport, the modal shift and the electric vehicle share were found to be crucial for biomass demands and overall system costs. 149 IDA’S ENERGY VISION 2050 13 References [1] of Engineers TDS. The Danish Society of Engineers’ Energy Plan 2030. [S.l.]: The Danish Society of Engineers; 2006. [2] Mathiesen BV, Lund H, Karlsson K. The IDA 2050 Climate Plan - Background Report. Technical energy system analysis, effects on fuel consumption and emissions of greenhouse gases, socio-economic consequences, commercial potentials, employment effects and health costs (IDA’S Klimaplan 2050 B. Copenhagen, Denmark, Denmark: The Danish Society of Engineers, IDA; 2009. [3] Lund H. Renewable energy systems - A smart energy systems approach to the choice and modelling of 100% renewable solutions. Second edi. ELSEVIER; 2014. [4] Mathiesen BV, Lund H, Connolly D, Wenzel H, Østergaard PA, Möller B, et al. Smart Energy Systems for coherent 100% renewable energy and transport solutions. Appl Energy 2015;145:139–54. doi:10.1016/j.apenergy.2015.01.075. [5] 4DH. 4GDH Definition 2015. http://www.4dh.dk/about-4dh/4gdh-definition (accessed November 4, 2015). [6] Danish Energy Agency. Energiscenarier frem mod 2020, 2035 og 2050 (Energy Scenarios towards 202, 2035 and 2050). Copenhagen, Denmark: Danish Energy Agency; 2014. [7] Mathiesen BV, Lund H, Hansen K, Ridjan I, Djørup S, Nielsen S, et al. IDA’s Energy Vision 2050 Technical data and methods. 2015. [8] Klimakommissionen. Green energy: the road to a Danish energy system without fossil fuels: summary of the work, results and recommendations of the Danish Commission on Climate Change Policy. [Kbh.]: Danish Commission on Climate Change Policy; 2010. [9] Energinet.dk. Energikoncept 2030 – Sammenfatning: En analyse af koncepter og udviklingsveje, der kan understøtte et konkurrencedygtigt og robust VE-baseret energisystem. 2015. [10] Danish Energy Agency. Årlig Energistatistik 2013 (Annual energy statistics 2013). 2014. [11] Danish Energy Agency. Technology Data for Energy Plants. Generation of Electricity and District Heating, Energy Storage and Energy Carrier Generation and Conversion. - certain updates made October 2013, January 2014 and March 2015. Copenhagen: 2015. 150 IDA’S ENERGY VISION 2050 [12] Agency DE. Forudsætninger for samfundsøkonomiske analyser på energiområdet, december 2014. Copenhagen: 2014. [13] Danish Energy Agency. Assumptions for Socio-Economic Analyses within Energy (Forudsætninger for Samfundsøkonomiske Analyser på Energiområdet). Danish Energy Agency; 2014. [14] Danish Energy Agency. Energistatistik 2013 2013. [15] Danish Energy Regulatory Authority. Statistik om gaspriser (Gas price statistic) http://energitilsynet.dk/gas/priser/statistik-om-gaspriser/ (accessed November 3, 2015). [16] Danish Energy Agency. Oliepriser (Oil prices) 2015. http://www.ens.dk/info/tal-kort/statistiknogletal/energipriser-afgifter/oliepriser (accessed November 3, 2015). [17] Danish Energy Agency. Basisfremskrivning af Danmarks energiforbrug frem til 2025 (Forecast of the Danish Energy Supply until 2025). 2008. [18] Lund H, Østergaard PA, Andersen AN, Hvelplund F, Mæng H, Münster E, et al. Local energy markets (Lokale energimarkeder) n.d.;http://pla:130 sider, ill. (nogle i farver). http://plan.aau.dk/GetAsset.action?contentId=3592304&assetId=3614908. [19] The Danish Society of Engineers. The Danish Society of Engineers’ Energy Plan 2030. 2006. [20] Danish Energy Authority, Energinet.dk. Technology Data for Energy Plants. vol. 978-87-784. Copenhagen, Denmark: Energistyrelsen (Danish Energy Authority); 2012. doi:ISBN: 978-87-7844-8576. [21] Mathiesen BV, Lund H, Karlsson K. The IDA 2050 Climate Plan - Background Report. Technical energy system analysis, effects on fuel consumption and emissions of greenhouse gases, socio-economic consequences, commercial potentials, employment effects and health costs. Copenhagen, Denmark: The Danish Society of Engineers, IDA; 2009. [22] Energinet.dk. Fremme af prisfleksibelt elforbrug for små og mellemstore kunder. 2011. [23] Energinet.dk. Samfundsøkonomisk analyse af udrulning af fjernaflæste timeelmålere. 2012. [24] Danmarks Statistik. Husstande 2015. https://www.dst.dk/da/Statistik/emner/husstande-familierboern/husstande (accessed November 5, 2015). 2015. 151 IDA’S ENERGY VISION 2050 [25] Danmarks Statistik. Firmastatistik 2015. https://www.dst.dk/da/Statistik/emner/virksomhedergenerelt/firmastatistik (accessed November 5, 2015). [26] Energinet.dk. Analyse af potentialet for landvind i Danmark i 2030. 2015. [27] Sørensen M, Nielsen P. Wind Turbines Onshore. Aalborg: 2015. [28] Danish Energy Agency. Electricity Generation - Non-Thermal Processes 2015 2015. http://www.ens.dk/sites/ens.dk/files/info/tal-kort/fremskrivninger-analysermodeller/teknologikataloger/20-23_electricity_generation_-_non-thermal_processes_19032015.xlsx. [29] Energinet.dk. Statistik og udtræk for VE anlæg (Statistics and extracts for RE plants). Danish Energy Agency; 2015. [30] IEA. Technology Roadmap: Solar Photovoltaic Energy 2014:60. doi:10.1007/SpringerReference_7300. [31] Bølgekraftforeningen. Danish Wave https://testafwaveenergy.wordpress.com/danske-anlaeg/. [32] Dyrelund A, Lund H, Mathiesen BV, Hvelplund F, Bojesen C, Odgaard A, et al. Varmeplan Danmark 2010 (Heat plan for Denmark 2010). vol. Project no. Copenhagen: Ramboll Denmark; 2010. [33] Lund H, Thellufsen JZ, Aggerholm S, Wittchen KB, Nielsen S, Mathiesen BV, et al. Heat Saving Strategies in Sustainable Smart Energy Systems. vol. 2014-1. 2014. [34] Rizzo M, Bach P. Fremskrivning af nettoenergiforbruget – metoder , forudsætninger og resultater. 2014. [35] Thellufsen JZ, Lund H. Energy saving synergies in national energy systems. Energy Convers Manag 2015;103:259–65. doi:10.1016/j.enconman.2015.06.052. [36] Sneum DM. Solar thermal district heating and heat demand density 2015. [37] Aalborg University. EnergyPLAN Cost Database. 2015. [38] Rambøll. Køleplan Danmark 2015 (Preliminary version, yet unpublished). 2015. Power Projects 2015. 152 IDA’S ENERGY VISION 2050 [39] Sørensen LH, Petersen PM. Kortlægning af energiforbrug i virksomheder. Copenhagen: 2015. [40] Kromann M, Kragerup H, Dalsgaard M. Kortlægning af energibesparepotentialer i erhvervslivet. 2015. [41] Energistyrelsen. Energistyrelsen notat: Forbrugsmodel: Fremskrivning af nettoenergiforbruget – metoder, forudsætninger og resultater. n.d. [42] Viegand Maagøe. Analyse af mulighederne for bedre udnyttelse af overskudsvarme fra industrien (Analysis of potentials for better utilization of excess heat from the industry). Danish Energy Agency; 2013. [43] Nielsen S, Lykkemark B. Fjernvarmeanalyse i Region Midtjylland (District Heating Analysis Central Region Denmark). 2014. [44] Ridjan I. Integrated electrofuels and renewable energy systems. Department of Development and Planning, 2015. [45] Mathiesen B V, Ridjan I, Connolly D, Nielsen MP, Hendriksen PV, Mogensen MB, et al. Technology data for high temperature solid oxide electrolyser cells, alkali and PEM electrolysers. Denmark: Department of Development and Planning, Aalborg University; 2013. [46] Carbon Recycling International. Carbon Recycling International Partners with EU Firms for Power to Fuel Development 2015. http://www.carbonrecycling.is/index.php?option=com_content&view=article&id=67%3Acri-partnerswith-eu-firms-for-power-to-fuel-development-&catid=2&Itemid=6&lang=en (accessed February 9, 2015). [47] Carbon Recycling international. George Olah Renewable Methanol Plant 2012. http://www.carbonrecycling.is/index.php?option=com_content&view=article&id=14&Itemid=8&lang=e n. [48] Karel Beckman. World’s first power-to-liquids production plant opened in Dresden 2014. [49] Ridjan I, Mathiesen B V, Connolly D. A review of biomass gasification technologies in Denmark and Sweden 2013;http://vbn. [50] Graves C, Ebbesen SD, Mogensen M, Lackner KS. Sustainable hydrocarbon fuels by recycling CO2 and H2O with renewable or nuclear energy. Renew Sustain Energy Rev 2011;15:1–23. 153 IDA’S ENERGY VISION 2050 doi:10.1016/j.rser.2010.07.014. [51] Hauch A, Ebbesen SD, Jensen SH, Mogensen M. Highly efficient high temperature electrolysis. J Mater Chem 2008;18:2331–40. [52] Ebbesen SD, Jensen SH, Hauch A, Mogensen M. High Temperature Electrolysis in Alkaline Cells, Solid Proton Conducting Cells, and Solid Oxide Cells . - Chem Rev 2014;114:10697–734. doi:10.1021/cr5000865. [53] Mathiesen B V., Connolly D, Lund H, Nielsen MP, Schaltz E, Wenzel H, et al. CEESA 100% Renewable Energy Transport Scenarios towards 2050 - Technical Background Report Part 2. Copenhagen, Danmark: Department of Development and Planning; 2015. [54] Danish Commission on Climate Change. Grøn Energi - vejen mod et dansk energisystem uden fossile braendsler. Danish Commission on Climate Change Policy; 2010. [55] Lund H, Hvelplund F, Mathiesen B V, Østergaard PA, Christensen P, Connolly D, et al. Coherent Energy and Environmental System Analysis (CEESA). Denmark: Department of Development and Planning, Aalborg University; 2011. [56] Gylling M, Jørgensen U, Bentsen NS, Kristensen IT, Dalgaard T, Felby C, et al. + 10 mio. tons planen – muligheder for en øget dansk produktion af bæredygtig biomasse til bioraffinaderier. Frederiksberg: Fødevareøkonomisk Institut; 2012. [57] Elbersen B, Startisky I, Hengeveld G, Schelhaas M-J, Naeff H, Böttcher H. Atlas of EU biomass potentials Deliverable 3.3: Spatially detailed and quantified o verview of EU biomass potential taking into account the main criteria determining biomass availability from different sources. Alterra; 2012. [58] Wenzel H, Høibye L, Hamelin L, Rune Duban G, Neil Bird D, Strange Olesen A. Carbon footprint of bioenergy pathways for the future Danish energy system. Denmark: COWI; 2014. [59] Wenzel H. Breaking the biomass bottleneck of the fossil free society. CONCITO; 2010. [60] Potential Contribution of Bioenergy to the World’s Future Energy Demand. IEA Bioenergy; 2007. [61] World Energy Council. Survey of Energy Resources. World Energy Council; 2010. [62] Biomasseressourcer, Ressourcer til energiformål i Danmark (Biomass Resources for Energy in Denmark). Danish Energy Agency; 2006. 154 IDA’S ENERGY VISION 2050 [63] Danish Commission on Climate Change. Grøn Energi - vejen mod et dansk energisystem uden fossile braendsler. Danish Commission on Climate Change Policy; 2010. [64] Commission E. Eurostat - Statistics database 2014. http://epp.eurostat.ec.europa.eu/ (accessed September 12, 2014). [65] Skou Andersen M, Brandt J. Miljøøkonomiske beregningspriser for emissioner. 2014. [66] Mathiesen BV, Lund H, Karlsson K. IDA´s klimaplan 2050 : Tekniske energisystemanalyser og samfundsøkonomisk konsekvensvurdering - Baggrundsrapport (IDAsClimate Plan 2050, backgroundreport in Danish and English). Copenhagen: 2009. [67] Hvelplund F, Lund H. Notat om data til vurdering af beskæftigelsesvirkninger af investering i forskellige energiteknologier. 2011. [68] Grønt nationalregnskab 2015. [69] Sperling K, Mathiesen BV. Landvindmøllernes lokale økonomiske effekter i Billund Kommune 2015. [70] Sperling K, Hvelplund FK, Nielsen S, Lehmann M, Madsen KB, Sejbjerg AK. Baggrundsrapport vedrørende energistrategi for Mariagerfjord kommune. 2015. 155 IDA’S ENERGY VISION 2050 156


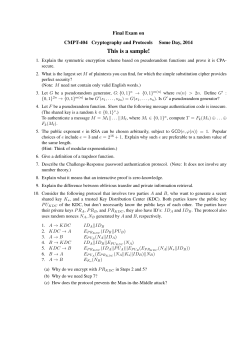

© Copyright 2026