
Designing a Sustainable System for Water Supply and
UPTEC W09024 Examensarbete 30 hp Oktober 2009 Designing a Sustainable System for Water Supply and Sanitation in Rural Peru Utformning av ett hållbart system för dricksvatten och sanitet på den peruanska landsbygden Ida Maria Linnéa Persson ABSTRACT Designing a Sustainable System for Water Supply and Sanitation in Rural Peru Ida Maria Linnéa Persson Given the tremendous importance of water supply and sanitation (WSS) on health and welfare, the purpose of this thesis was to suggest a design of a sustainable WSS system for a rural village in the sub-Andean Amazon of Northern Peru. WSS planning and intervention in the developing world have traditionally been characterized by large failures, and to understand the related problems, this work was initiated with a literature review on the topic. The review resulted in the development of a planning support, containing eight stages ranging from project identification to project realization. Within this thesis, the first four stages were implemented, including an in-field WSS situation assessment and a screening of suitable technical options. The in-field assessment contained a general fact collection, an inventory where about a fifth of the households in the village was visited and interviewed, and a water quality analysis. An analysis of the assessment findings resulted in the identification of the WSS components requiring intervention. Thereafter followed a screening of suitable technologies, and based on the results from the analysis, a selection of interesting options was done. Selected options were reviewed and evaluated according to a set of sustainability criteria. A majority of the households in the village had standpipes on their premises, delivering untreated water from an unprotected creek outside the village. Apart from surface water, rainwater and water from an open spring were also used in the village. The water analysis revealed that surface water contained elevated levels of bacteria, whereas the spring water was clean. Contaminated water remained contaminated after household treatment (boiling), indicative of poor handling. Water treatment with solar disinfection (SODIS) proved to be effective. The sanitary situation was not satisfactory; almost all households had unimproved pit latrines that could not ensure a hygienic separation of excreta, and open defecation was also practiced. Greywater, resulting from showering and cloth-washing under the standpipe, was at best diverted away from the premises by small drains, but often not managed at all. Stormwater created unhygienic conditions on both private premises and in communal areas during the rainy season; the management situation was similar to that of greywater. Solid waste was not officially managed and even though many of the households had designated a collection site, waste was commonly seen all over the premises. The selected technologies were mainly inexpensive such that could be constructed, operated and managed by the community itself. From the assessment it also became clear that the WSS situation could be considerably improved by behavior change. Following the developed planning support; with the finalization of this thesis, the next step would be to present the results from the screening and evaluation of technologies to the villagers, for them to decide which options to proceed with. Keywords: water supply, sanitation, planning support, household water treatment, solar disinfection, rural Peru Department of Energy and Technology, Swedish University of Agricultural Sciences Box 7032, SE-75007 Uppsala, Sweden i ii REFERAT Utformning av ett hållbart system för dricksvatten och sanitet på den peruanska landsbygden Ida Maria Linnéa Persson Dricksvatten och sanitet (DVS) är extremt viktigt för hälsa och välfärd, både för individen och för samhället i stort. Syftet med detta examensarbete var därför att föreslå en utformning av ett hållbart DVS-system för en by i sub-andinska Amazonas i norra Peru. DVS-planering och -projektering har traditionellt karakteriserats utav stora misslyckanden, och för att förstå denna problematik så inleddes arbetet med en översiktlig studie i ämnet. Detta resulterade i att ett vägledande planeringsstöd utvecklades, bestående av åtta steg som sträcker sig från problemidentifikation till projektrealisering. Inom ramen för detta arbete ingick de fyra första stegen, vilket inkluderade en fältundersökning av DVS-situationen i byn och en genomgång av lämpliga tekniska alternativ. Fältundersökningen innefattande en allmän faktainsamling, en inventering där en femtedel av byns hushåll besöktes och intervjuades, och en vattenanalys. Resultaten från fältundersökning sammanfattades och ett antal DVS-punkter identifierades som i behov av åtgärder. I teknikgenomgången användes resultaten från fältundersökning som grund för urvalet av intressanta alternativ, vilka sedan utvärderades utifrån en uppsättning hållbarhetskriterier. Majoriteten av hushållen i byn hade en vattenkran på sina ägor, och vattnet levererades obehandlat från ett oskyddat vattendrag utanför byn. Förutom ytvatten så använde man även regnvatten och vatten från en öppen källa. Vattenanalysen visade att ytvattnet var starkt förorenat av bakterier, medan källvattnet visade sig vara rent. Förorenat vatten förblev förorenat även efter att hushållen behandlat det (genom kokning), vilket tyder på dålig efterhantering. Soldisinfektion (SODIS) visade sig vara en effektiv reningsmetod. Den sanitära situationen var otillfredsställande – nästan alla hushåll använde sig av oförbättrade grävda latriner och även tarmtömning i det fria praktiserades. BDT-vatten, från dusch och tvätt under vattenkranen, var som bäst avlett från ägorna med enkla fåror, men oftast inte alls hanterat. Under regnperioden orsakade dagvatten ohygieniska förhållanden och hanteringen var liknande den för BDT-vattnet. Det fanns ingen officiell sophantering och även om många hushåll avsatt en speciell plats på gården för insamling så var nedskräpningen omfattande. Utvalda tekniker var främst sådana som skulle kunna bekostas, konstrueras, drivas och skötas av samhället själv. I fältundersökningen framkom det också att situationen skulle kunna förbättras avsevärt genom beteendeändringar. I och med avslutningen av detta arbete är nästa steg att, i enlighet med planeringsstödet, presentera resultaten från utvärderingen av de tekniska alternativen för invånarna i byn, och låta dem besluta om vilka som de vill gå vidare med. Nyckelord: dricksvatten, sanitet, planeringsstöd, hushållsrening av vatten, soldisinfektion, peruanska landsbygden Institutionen för energi och teknik, Sveriges lantbruksuniversitet Box 7032, 75007 Uppsala iii iv RESUMEN Diseño de un Sistema Sostenible de Agua Potable y Saneamiento en Zonas Rurales de Perú Ida Maria Linnéa Persson Debido a la gran importancia del agua potable y saneamiento (APS) para la salud y el bienestar, el objetivo de este proyecto fue proponer un sistema APS, adecuado y sostenible, para una aldea rural en la selva Amazónica en el norte de Perú. Tradicionalmente, la planificación y el diseño de APS en el mundo en desarrollo han sido caracterizados por fallos grandes, y para comprender los problemas, este trabajo comenzó con un estudio amplio sobre el tema. El estudio resultó en un apoyo de planificación, que contiene ocho etapas que van desde la identificación de un proyecto a la realización del proyecto, y fue empleado para la orientación en el trabajo posterior. Dentro de esta tesis, las primeras cuatro etapas se llevaron a cabo, incluyendo una evaluación de la situación APS en campo y un examen de las opciones técnicas adecuadas. El trabajo de campo incluía una colección de datos, un inventario, en el que una quinta parte de los hogares en el pueblo fue visitada y entrevistada, y un análisis del agua. Un análisis de los resultados del trabajo de campo resultó en la identificación de los componentes de APS que requieren una intervención. Después siguió un examen de tecnologías adecuadas, y con base en los resultados del análisis se hizo una selección de opciones interesantes. Las opciones seleccionadas fueron revisadas y evaluadas de acuerdo a un conjunto de criterios de sostenibilidad. En la mayoría de los hogares del pueblo había una pileta en sus parcelas, entregando agua no tratada de una quebrada sin protección, a fuera del pueblo. Aparte de las aguas superficiales, habían aguas de lluvia y de una fuente abierta. El análisis del agua mostraba niveles elevados de contaminación bacteriológica en las aguas superficiales, mientras que el agua de la fuente abierta era limpia. El tratamiento del agua con la desinfección solar fue demostrado ser eficaz. La situación sanitaria no era satisfactoria – casi todos los hogares tenían letrinas de foso, que no podían asegurar una separación higiénica de la excreta, y la práctica de defecación al aire libre también se veía. Aguas grises, resultante del lavado de ropa y el baño de personas debajo de la pileta, en el mejor de los casos estaban desviando de las parcelas, pero a menudo no estaban tratando. Durante las épocas de lluvia, había bastantes problemas con el agua de escorrentía, creando las condiciones antihigiénicas, y el manejo de la situación era la misma que la de las aguas grises. Los residuos sólidos no estaban oficialmente manejados y aunque muchos de los hogares habían designado un lugar especial en el patio para su recolección, eran comúnmente vistos en todas las parcelas. Las tecnologías seleccionadas fueron tales que podrían ser financiadas, construidas, operadas y administradas por la propia comunidad. La evaluación reveló que la situación también podría mejorar considerablemente con un cambio de conducta. A la finalización de este proyecto, la siguiente etapa, de acuerdo con el apoyo de la planificación, sería devolver la evaluación de las opciones seleccionadas a los habitantes del pueblo, y dejar a ellos decidan con cuales opciones quieren proceder. Palabras claves: agua potable, saneamiento, apoyo de planificación, tratamiento domiciliario de agua, desinfección solar, zonas rurales de Perú Departamento de Energía y Tecnología, Universidad Sueca de Ciencias Agrícolas Box 7032, SE-75007 Uppsala, Suecia v vi PREFACE This thesis is submitted for completion of the degree Master of Science in Aquatic and Environmental Engineering at Uppsala University. The work comprises 30 ECTS and the fieldwork was performed as a Minor Field Study (MFS), financed by the Swedish International Development Agency (SIDA). Supervisor was Lina Lindell, PhD student at the School of Pure and Applied Natural Sciences, University of Kalmar, and subject reviewer was Håkan Jönsson, professor at the Department of Energy and Technology, Swedish University of Agricultural Sciences. Many are the people who have supported my work and I would first like to thank the Institution for Tropical Ecology at Uppsala University and SIDA for the funding to realize the fieldwork in Peru – I am both grateful and proud for receiving the MFS scholarship. A special thank to Allan Rodhe, thesis examiner and professor at the Department of Earth Sciences, Uppsala University, for encouragement during the MFS application process. Thank you Lina Lindell for introducing me to this exciting part of the world and for letting me travel around with your reputable name. I am grateful for the support with the fieldwork, as well as the help during the writing process. Thank you Håkan Jönsson for inspiration in the important field of sanitation and for valuable advises during the writing process. Many thanks to Marta de la Cruz García and Pavel Pineda Díaz for reviewing my Spanish. Jackeline Pezo Pezo, muchas gracias por toda tu ayuda indispensable durante el trabajo de campo. Sin tu apoyo y amistad, mi estancia en la selva hubiese sido mucho más difícil y mucho más aburrida – ¡nunca voy a olvidar nuestras aventuras! Estoy muy agradecida con Noehmi y Willy y toda su familia, por me cuidaron durante el tiempo en Perú y me mostraron la cultura peruana. Muchas gracias a toda la comunidad de Nueva Vida por su bienvenida caliente e interés en el proyecto. Unos agradecimientos especiales a Elita y Ceferino por abrieron su casa para mí y Jackeline, a Carlos en el centro de salud por su apoyo en el proyecto y a Prudencio Tuanama Tuanama por su ayuda con las muestras de agua. Muchas gracias al Ingeniero Victor Raul Prieto por su calida bienvenida a Saposoa y la ayuda en organizar el análisis del agua. También estoy muy agradecida con Ingeniero Enrique Nuñez Perales y EMAPA San Martín por la ejecución de análisis del agua. Marco, thank you for the very-last-minute flight-booking that made it possible for me to go at all, for coming over to travel with me, and for lending me a desk with a great view. Not to mention the encouragement, the good advises and the thorough proof-reading during the writing process. I am also very grateful to my family, for all the unconditional support over the years. Maria Persson Uppsala, October 2009 Copyright © Ida Maria Linnéa Persson and the Department of Energy and Technology, Swedish University of Agricultural Science UPTEC W09024, ISSN 1401‐5765 Printed at the Department of Earth Sciences, Geotryckeriet, Uppsala University, Uppsala, Sweden 2009 vii viii POPULÄRVETENSKAPLIG SAMMANFATTNING Utformning av ett hållbart system för dricksvatten och sanitet på den peruanska landsbygden Ida Maria Linnéa Persson Bra dricksvatten och sanitet (DVS) är extremt viktigt för hälsa och välfärd. Diarrésjukdomar är en av de fem vanligaste dödsorsakerna hos barn under fem år och resulterar i cirka 1,8 miljoner dödsfall varje år. Undermålig DVS ansvarar för nio av tio av dessa dödsfall, och därtill också för åkommor som parasitinfektioner, hepatit, malaria och snäckfeber. Bristen på DVS är inte bara förödande för den drabbade individen, utan förhindrar också social och ekonomisk utveckling på en stor skala, då utsatta människor har betydligt sämre möjligheter än friska att aktivt delta i exempelvis skolundervisning, arbets- och samhällsliv. Problemen med bristande DVS har gång på gång uppmärksammats av världssamfundet, inte minst i och med de så kallade millenniummålen. Inom ramen för dessa mål har FN:s medlemsländer åtagit sig att halvera antalet människor utan hållbar tillgång till dricksvatten och sanitet tills 2015 (jämfört med 1990). 2008 kunde man konstatera att 850 miljoner människor ännu saknade säkert dricksvatten och hela 2,5 miljarder levde under oacceptabla sanitära förhållanden. I Peru har andelen människor med tillgång till förbättrat DVS ökat under de sista åren, men på landsbygden saknar fortfarande 40 procent tillgång till säkert dricksvatten och två tredjedelar använder sig av oförbättrade sanitära lösningar, varav hälften utav dessa utför sina behov i det fria. Lösningar som inte kan säkerställa en hygienisk avskiljning av den producerade avföringen klassificeras som “oförbättrade”, och tarmtömning i det fria klassas som den mest primitiva metoden. Det projekt som denna rapport behandlar utfördes 2009 i byn Nueva Vida, ett litet bondesamhälle i regnskogsområdet i norra Peru. En tidigare studie hade påvisat att barnen led av återkommande diarré och parasitinfektioner och på grund av detta inte följde en normal längd- och viktutveckling. Syftet med projektet var att undersöka vatten- och sanitetssituationen i byn, och att därefter föreslå lämpliga åtgärder för att förbättra den. Begreppet sanitet innefattar hanteringen av avföring, avloppsvatten från klosetter (KL-vatten) och bad, disk och tvätt (BDT-vatten), samt regnansamling (dagvatten) och sopor. I undersökningen av DVS-situationen i byn ingick en vattenanalys och en hushållsinventering där ett trettiotal familjer besöktes och intervjuades. Information och data om miljömässiga, socio-kulturella, institutionella och ekonomiska komponenter samlades också in för att ta fram en omfattande bild av byn och dess omgivning. Majoriteten av hushållen i byn hade en vattenkran på sina ägor, och vattnet levererades obehandlat från ett oskyddat vattendrag utanför byn. En del hushåll saknade ekonomisk och/eller geografisk möjlighet att ansluta sig till systemet, och dessa använde sig av ytvatten från närliggande bäckar, ett identifierat hushåll samlade in regnvatten och ett tog vatten från en öppen källa på deras bakgård. I inventeringen framkom det att vart tredje hushåll drack obehandlat vatten och att kokning var den vanligaste behandlingsmetoden bland de övriga. Några enstaka hushåll kompletterade kokningen med klorering och soldisinfektion (SODIS). Vattenanalysen visade att ytvattnet var starkt förorenat av bakterier, och att denna förorening bestod även efter att hushållen behandlat vattnet, vilket tyder på dålig efterhantering. Vidare framkom det att vattnet från den öppna källan var av utmärkt kvalité precis där det nådde ytan, men förorenat tre meter nedströms där det samlades in. SODIS visade sig vara en effektiv reningsmetod. ix Den sanitära situationen lämnade mycket att önska: ett intervjuat hushåll utförde sina behov i det fria, övriga använde sig av grävda latriner. Vanliga problem med latrinerna var flugor och illalukt, samt att regnvatten ansamlades i den grävda gropen och förkortade toalettens livslängd. Många toaletter saknade en fullständig yttre struktur och/eller sits och/eller lock att stänga för hålet. Några låg så långt bort från bostadshusen att det var tveksamt om de användes. Samtliga latriner måste klassificeras som “oförbättrade”. Två hushåll samt lågstadieskolan och hälsocentret hade nyligen installerat vattenburna avloppssystem, men det saknades både infrastruktur och strategier för hantering av KL-vattnet. För dusch och tvätt använde hushållen sin vattenkran alternativt en närliggande bäck (de som inte var anslutna till dricksvattensystemet) och det resulterande BDT-vattnet var som bäst avlett med hjälp av enkla fåror, men oftast inte alls hanterat. Samma hanteringsmetod gällde för dagvattnet. Det fanns ingen officiell sophantering och även om många hushåll avsatt en speciell plats på gården för insamling, så var nedskräpningen omfattande. Baserat på resultaten från DVS-undersökningen gjordes en analys av de styrkor, svagheter, möjligheter och hot som skulle kunna påverka olika DVS-åtgärder. Styrkorna innefattade invånarnas drivkraft, samhällets storelek samt de ekonomiska utvecklingsmöjligheterna i och med produktionen av cash-crops som kaffe och kakao. Till följd av det tropiska klimatet var vattentillgången god och nedbrytningshastigheten av organiska material stor, det senare viktigt för många sanitära tekniker. Svagheter var den utbredda fattigdomen, att byn ekonomiskt administrerades av en annan by med en annan agenda när det gällde resursfördelning, samt invånarnas låga utbildningsnivå och grad av jämställdhet. Det tropiska klimatet medförde också perioder av stor nederbörd, vilket försämrade vattenkvalitén och den sanitära situationen avsevärt. Exempel på möjligheter var de statliga och icke-statliga organisationer som kunde kontaktas för gratis DVS-utbildning, samt att kakaoodlande bönder kunde ansluta sig till ett kooperativ och där ta fördelaktiga lån. Hög nederbörd är bra om man vill samla in regnvatten och det låga näringsinnehållet i marken skulle kunna stimulera viljan att återvinna avfallsprodukter i jordbruket. Existerande hot för ett hållbart DVS-system var en del individers inställning till sanitära angelägenheter och DVS-relaterade sjukdomar. Vidare så fanns det en överhängande risk att de använda vattendragen och källan inte skulle kunna skyddas tillräckligt, exempelvis på grund av förekomsten av svedjebruk. Det åtgärder som identifierades som lämpliga var sådana som var tillräckligt enkla att kunna utföras av samhället själv och som inte kostade så mycket. Många problem skulle dessutom kunna lösas enbart genom beteendeändring, såsom regelbunden handtvätt och uppsamling av allt skräp på ett ställe. Ökad användning av den öppna källan, central klorering och hushållsbehandling med SODIS identifierades som intressanta möjligheter för dricksvattenförbättring. Grävda latriner kan förbättras med enkla medel och BDT- och dagvatten kan billigt hanteras med öppen dränering. Resulterande avfallsprodukter, såsom urin, behandlad avföring och komposterade sopor skulle med fördel kunna återvinnas i jordbruket. x LIST OF ABBREVIATIONS APS BDT-vatten BOD CFU CLTS COD DIGESA DIRES DVS Eawag EC EcoSan EHP EMAPA FAO FONCODES FONIPREL FWS GHG GTZ HCES IRC IWA JMP KL-vatten LFA MCS MDG MINAM MINSA MLC MPN mS MSH MSW NGO NIMBY NTU OCCA OPI OPSS OWP PEN PHAST Agua Potable y Saneamiento Bad-, disk- och tvättvatten Biodegradable Oxygen Demand Colony Forming Unit Community Led Total Sanitation Chemical Oxygen Demand Dirección General de Salud Ambiental (department of environmental health) Direccion Regional de Salud (regional department of health) Dricksvatten och sanitet Swiss Federal Institute of Aquatic Science and Technology Electric Conductivity Ecological Sanitation Environmental Health Project Empresa Municipal de servicios de Agua Potable y Alcantarillado (private drinking water company in Peru) Food and Agriculture Organization Fondo de Cooperación para el Desarrollo Social (fund for social development) Fondo de Promoción a la Inversión Pública Regional y Local (fund for social and infrastructural development) Free-water Surface constructed wetland Greenhouse Gases Deutsche Gesellschaft für Technische Zusammenarbeit Household-Centred Environmental Sanitation International Water and Sanitation Centre International Water Association Joint Monitoring Programme Klosettvatten Logical Framework Approach Municipios y Comunidades Saludables Millennium Development Goal Ministerio del Ambiente (ministry of environment) Ministerio de Salud (ministry of health) Maximum allowed Level of Contaminant Most Probable Number milli-Siemens Management Science for Health Municipal Solid Waste Non-governmental Organization Not in My Backyard Nephelometric Turbidity Units Open Comparative Consequence Analysis Oficina de Proyectas Inversion (office for inversion projects) Open Planning of Sanitation Systems Open Wastewater Planning Peruvian Nuevo Sol Participatory Hygiene and Sanitation Transformation xi PRONASAR PROPILAS RSF SDC SEI SENAMHI SODIS SSF SUNASS SWM SWOT ToR UESS UNEP US EPA USAID USDA UV VIP VIVIENDA WELL WHO WSP WSP WSS WWF Programa Nacional de Agua y Saneamiento Rural (national program for rural water and sanitation) Pilot Project to Improve District Water and Sanitation Management and Sustainability Rapid Sand Filter Swiss Agency for Development and Cooperation Stockholm Environmental Institute Servicio Nacional de Meteorología e Hidrología (national institute for meteorology and hydrology) Solar disinfection Slow Sand Filter Superintendencia Nacional de Servicios de Saneamiento (national control organ of water and sanitation services) Solid Waste Management Strengths, Weaknesses, Opportunities and Threats Terms of Requirement Urban Environmental Sanitation Services United Nation Environmental Programme United States Environmental Protection Agency United States Agency for International Development United States Department of Agriculture Ultraviolet Ventilated Improved Pit latrine Ministerio de Vivienda, Construcción y Saneamiento (ministry of housing, construction and sanitation) Water and Environment Health at London and Loughborough World Health Organization Waste Stabilization Pond Water and Sanitation Program Water Supply and Sanitation World Wide Fund for Nature xii LIST OF CONTENTS Abstract ....................................................................................................................................... i Referat ....................................................................................................................................... iii Resumen ..................................................................................................................................... v Preface ...................................................................................................................................... vii Populärvetenskaplig sammanfattning ....................................................................................... ix List of Abbreviations ................................................................................................................. xi List of Contents ....................................................................................................................... xiii 1 Introduction ............................................................................................................................. 1 1.1 Water and Sanitation Internationally and in Peru ............................................................. 1 1.2 Scope and Objectives........................................................................................................ 2 1.3 Thesis Layout ................................................................................................................... 2 2 Method Development .............................................................................................................. 3 2.1 Background ....................................................................................................................... 3 2.1.1 Why WSS Projects Fail in the Developing World..................................................... 3 2.1.2 New Approaches to WSS in the Developing World .................................................. 4 2.1.3 Defining Sustainability .............................................................................................. 4 2.2 Review of WSS Planning Supports .................................................................................. 6 2.2.1 Selection based on the Törnquist literature review .................................................... 6 2.2.2 Selection based on additional literature review ......................................................... 7 2.2.3 Comparison between reviewed planning supports..................................................... 8 2.3 WSS Planning Support for Nueva Vida ........................................................................... 9 2.3.1 Summary of findings .................................................................................................. 9 2.3.2 Developed planning support .................................................................................... 12 3 Theory ................................................................................................................................... 15 3.1 Water Supply 101 ........................................................................................................... 15 3.1.1 Water quality ............................................................................................................ 15 3.1.2 Sources of Water ...................................................................................................... 16 3.1.3 Water Treatment ...................................................................................................... 17 3.2 Sanitation 101 ................................................................................................................. 19 3.2.1 Excreta ..................................................................................................................... 19 3.2.2 Greywater ................................................................................................................. 22 3.2.3 Stormwater ............................................................................................................... 24 3.2.4 Solid Waste .............................................................................................................. 24 xiii 4 Methods ................................................................................................................................. 27 4.1 Assessment of the Current WSS Situation ..................................................................... 27 4.1.1 Fact collection .......................................................................................................... 27 4.1.2 Household inventory ................................................................................................ 27 4.1.3 Water quality ............................................................................................................ 28 4.2 Screening for Technical Options .................................................................................... 29 5 Assessment of the Current WSS Situation – Results and Discussion ................................... 31 5.1 Fact Collection and Household Inventory ...................................................................... 31 5.1.1 Environmental characteristics .................................................................................. 32 5.1.2 Socio-cultural characteristics ................................................................................... 35 5.1.3 Institutional characteristics ...................................................................................... 38 5.1.4 Economical characteristics ....................................................................................... 39 5.1.5 Health characteristics ............................................................................................... 41 5.1.6 Technical characteristics .......................................................................................... 42 5.1.7 Uncertainties ............................................................................................................ 46 5.2 Water Quality ................................................................................................................. 49 5.2.1 Crude water .............................................................................................................. 49 5.2.2 Treated water............................................................................................................ 52 5.2.3 Uncertainties ............................................................................................................ 55 5.3 SWOT-Analysis.............................................................................................................. 55 5.4 Summary of Findings and Identified Challenges ........................................................... 57 6 Screening for Technical Options – Results and Discussion .................................................. 59 6.1 Design Dimensions ......................................................................................................... 59 6.2 Water Supply .................................................................................................................. 59 6.2.1 Protection of stream water ....................................................................................... 59 6.2.2 Safe abstraction and protection of the open spring .................................................. 60 6.2.3 Centralized treatment methods ................................................................................ 61 6.2.4 Household treatment methods and storage .............................................................. 64 6.2.5 Water supply for households situated on high elevations ........................................ 66 6.2.6 Comparison of options and evaluation of feasible service combinations ................ 67 6. 3 Sanitation: Excreta and Blackwater ............................................................................... 68 6.3.1 Improved latrines ..................................................................................................... 68 6.3.2 Hygiene practices ..................................................................................................... 70 6.3.3 Collection and conveyance of blackwater ............................................................... 71 xiv 6.3.4 Centralized blackwater treatment methods .............................................................. 72 6.3.5 Use and/or disposal of end products ........................................................................ 74 6.3.6 Comparison of options and evaluation of feasible service combinations ................ 76 6.4 Sanitation: Greywater and Stormwater........................................................................... 77 6.4.1 Preventive measurements......................................................................................... 77 6.4.2 Collection and conveyance ...................................................................................... 77 6.4.3 Treatment, use and/or disposal of end products....................................................... 78 6.4.4 Comparison of options and evaluation of feasible service combinations ................ 78 6.5 Sanitation: Solid Waste .................................................................................................. 78 6.5.1 Education and behavior change ............................................................................... 78 6.5.2 Collection and conveyance ...................................................................................... 78 6.5.3 Treatment, use and/or disposal of end products....................................................... 79 6.5.4 Comparison of options and evaluation of feasible service combinations ................ 81 6.6 Proposed Action Plan ..................................................................................................... 84 7 Conclusions and Outlook ...................................................................................................... 85 Bibliography ............................................................................................................................. 87 Appendix I ............................................................................................................................... xxi Appendix II ............................................................................................................................. xxi Appendix III ............................................................................................................................... v Appendix IV .............................................................................................................................. ix Appendix V ............................................................................................................................. xxi xv xvi 1 INTRODUCTION 1.1 WATER AND SANITATION INTERNATIONALLY AND IN PERU “Water and Sanitation is one of the primary drivers of public health. I often refer to it as ‘Health 101’, which means that once we can secure access to clean water and to adequate sanitation facilities for all people, irrespective of the difference in their living conditions, a huge battle against all kinds of diseases will be won.” These words, lent from Doctor Lee Jong-wook, director-general at the WHO, summarize the important linkage between water, sanitation and health. Diarrheal diseases kill 1.8 million people every year and are the second most common cause of death in children under the age of five, and poor sanitation and contaminated drinking water account for 88 % of the deaths (UN-Water, 2008). There are several international initiatives targeting water supply and sanitation (WSS), aiming to improve access and global coverage. One example is the UN Millennium Declaration, in which the UN members commit to reduce extreme poverty and reach a series of quantified and time-bound targets, known as the Millennium Development Goals (MDGs). The goal concerning WSS is to “halve, by 2015, the proportion of people without sustainable access to safe drinking water and basic sanitation” compared to the reference year 1990. Globally, this corresponds to a rise from 77 to 89 % in water supply coverage and from 54 to 77 % in sanitation coverage, the largest increase being required in the developing regions (JMP, 2008). In the 2008 MDG assessment report, progress is seen in drinking water coverage, although more than 850 million people (13 %) still lack a safe water supply, but the sanitation goal is lagging behind with almost 2 billion people (30 %) living without basic sanitation. Definitions of the different development stages are given in Table 1 and Table 2. Table 1 Definition of stages in drinking water development, modified from JMP (2008) Piped water on premises Other improved Unimproved Piped household water connection, located on user premises Public taps/standpipes, tube wells/boreholes, protected dug wells, protected springs and rainwater collection Unprotected dug well, unprotected spring, cart and truck delivered water, surface water and bottled water Table 2 Definition of stages in sanitation development1, modified from JMP (2008) Improved Shared Unimproved Open defecation Facilities that ensure hygienic separation of excreta, for example flush or pour-flush toilets/latrines combined with piped sewer systems or a septic tank, ventilated improved pit (VIP) latrines, pit latrines with a slab and composting toilets Acceptable types of sanitation facilities that are shared between two or more households, including public toilets Facilities that cannot ensure hygienic separation of excreta, such as pit latrines without a slab or platform, hanging latrines and bucket latrines Direct defecation in the surrounding environment or disposal of feces with the solid waste In Peru, the portion of the population with access to improved water supply and sanitation has risen the last decades. In the latest assessment report, Latin America is included among the developed regions, and the process of reaching both the MDG drinking water target of 92 % coverage and the MDG sanitation target of 84 % coverage is classified as “on track” (JMP, 2008). However, there are large disparities between urban and rural areas. In Peru 2006, nine out of ten living in urban regions had piped water on their premises, less than one tenth lived without basic sanitation and open defecation was eradicated (JMP, www). In rural 1 Basic sanitation includes both improved and shared. 1 regions the picture was very different; two out of five drank water from an unimproved supply, two thirds of the population lacked access to basic sanitation, and out of these, a staggering half practiced open defecation (JMP, www). These rural statistics are considerably worse than both the global average and the average of developing regions. 1.2 SCOPE AND OBJECTIVES This thesis concerns water supply and sanitation (WSS) in rural Peru. The term water supply includes both quantitative and qualitative components, and following the WHO definition, safe drinking water is classified as such that “does not represent any significant risk to health over a lifetime of consumption, including different sensitivities that may occur between life stages” (WHO, 2004a). The definition in use of a sanitation system includes the collection, transport, treatment and end product management of human excreta, greywater, stormwater and solid waste. The studied area is a relatively new settlement in the sub-Andean Amazon of Northern Peru; the village of Nueva Vida, located in the Saposoa basin in the department of San Martín, about three hours’ drive from the nearest town Saposoa. At the time of the study, the village had a population of about 1000 people, the grand majority occupied with smallscale agriculture, and communal services included a health center, a kindergarten and a primary school. There was no electricity in the village and road access was poor. In a study in 2007, the WSS situation had been identified as deficient; both drinking water quality and hygiene practices were poor; related diseases, such as diarrhea and parasite infections, abounded. Given the occurrence of these deficiencies, it is of great importance to address the current WSS situation in the village. Changing critical WSS and hygiene practices is, in a long-term perspective, expected to improve the overall quality of life of the people living in the village as well as the health of the entire ecosystem. The purpose of this study is thus to suggest a design of a sustainable WSS system, suitable to the local conditions in Nueva Vida and the needs and wishes of its population. The specific objectives are to Develop a support for the planning process in the village and proceed with the work according to this methodology. Assess the current WSS situation in the village. Identify suitable technical options for a sustainable WSS system in the village. Share the results to the community in written form. 1.3 THESIS LAYOUT The thesis starts with a methodology development (the planning support), including a background section outlining the rationale for why this is important. Thereafter follows a theory chapter, providing a brief introduction to the fields of water supply and sanitation. In chapter four, the methods in use are described. Results from the WSS situation assessment and the screening of suitable technical options are presented and discussed in chapter five and six respectively. Chapter seven contains conclusions and outlook and the pamphlet composed to share the results to the community is included in Appendix IV. 2 2 METHOD DEVELOPMENT “Efforts to provide water and sanitation facilities in the developing world up to now have not been an outstanding success story”. These are the words of one of the earlier researchers in participatory planning, Harold McPherson (1987), commenting on the estimated 30 % of water systems in the developing world that did not work at the time. Twenty years later, the International Water Association (IWA) states that “conventional approaches to sanitation planning and design seem to fail with depressing regularity” (2006). Mainstream WSS policies have been, and continuously are, subject to extensive criticism and WSS facilities in low- and middle-income countries2 have been, and continuously are, subject to failure. To avoid repeating the many failures of traditional WSS planning approaches and to stake out a path for the fieldwork, a review of identified obstacles, and the resources seeking to overcome them, was done. A brief problem background is given in the first part of this chapter, followed by a review of existing WSS planning supports. The chapter is summarized with the development of a project specific planning support, guiding the subsequent work done within this thesis. 2.1 BACKGROUND 2.1.1 Why WSS Projects Fail in the Developing World The development of WSS services in the industrialized world coincided with the industrial revolution, by large driven by the economical progresses seen at the time. The industries’ demands of water and a healthy work force, scientific findings about disease-causing organisms coupled with an increased public attention to health, and the development of new WSS technologies resulted in increased political attention – all together, it encouraged the process and resulted in near-universal access to WSS services (Crow, 2007). In present days, the WSS branch in high income-countries is characterized by large-scale high-technology solutions, operated and managed on a centralized level by professionals, leaving to the user only to turn on a tap or push a button. The conventional approach to obtain universal access also in the developing world has been to copy the solutions of the industrialized. In low- and middle-income countries, vast amounts of foreign aid and other donor funding have been directed towards for example the construction of large-scale high-technology facilities. However, extensive investments have proved not to be equable with extensive improvements; many are the examples of system break-down after only a short period of operation. Common reasons for failing WSS projects are poor construction, inappropriate technologies, insufficient operation and maintenance, lack of financial resources and little interest or even opposition from stakeholders (McPherson & McGarry, 1987). Weak institutional structures and absence of political will are also recognized problems in the implementation of WSS policies (Elledge, 2003). The choice of technology is essential for a successful project. Operation and maintenance of conventional facilities are often costly and require professional staff, and many times the necessary spare parts must be imported. Thus, in poor communities with neither financial resources nor professionals, conventional facilities are highly unsuitable, stressing the need for low-technology options. 2 Following the World Bank definition, low-income countries are those with a gross national income (GNI) per capita equal to or less than 975 USD, middle income countries those with a GNI per capita equal to or less than 11905 USD. Within this thesis, low- and middle-income countries are interchangeably referred to as developing countries. High-income countries (GNI per capita higher than 11905 USD) are referred to as developed or industrialized. 3 According to Cozzens & Catalan (2007), major challenges in the WSS sector in the developing world are not primarily technical, but organizational, including regulatory issues, questions about land ownership and decision-making procedures. This type of issues are not as pronounced in the industrialized world due to appropriate institutional structures, and when WSS policies designed in this context are applied in the developing world, difficulties arise. Failure in WSS projects is also often faulted on their financial structure, most notably their poor cost recovery. If universal access to water and sanitation is to be achieved, and if poor people cannot afford to pay the true costs of these services, subsidies are essential. However, if funds for operation and maintenance cannot be generated locally, the sustainability of the project is at stake; if external funding one day ceases, the system will fall into degradation (Cardone & Fonseca, 2003). Further, many people criticize the commonly seen public governance of WSS services, arguing that lack of commercial orientation impedes efficiency and thus performance, favoring participation of the private sector (Mugabi et al., 2007). Another important component in a successful project is system acceptance of the future users. Traditionally, the planning of WSS projects has been done with a top-down approach, where system design is decided by donor agencies, foreign contractors or official bureaucrats (Eawag, 2005). With this approach, future users are often not consulted at all about their needs and wants, which often turn out to be different to those perceived (and provided for) by the planners. If the users are unsatisfied with the resulting services, rejection is near and as soon as the planner leaves the site, the system is left to degrade. 2.1.2 New Approaches to WSS in the Developing World During the last decades, the failures of the WSS sector have been recognized and the search of new methods to plan and provide WSS services in the developing world is constantly ongoing. Consultant companies, universities and other bodies of research, non-governmental organizations, international organizations and national development agencies are all working to replace traditional approaches with new. Participatory planning, bottom-up, circular systems, household-centred, demand-driven, user-participation, holistic approach and system function, are examples of commonly used buzz-words, developed into concepts and incorporated in the new approaches, presented as planning supports. The planning supports can be divided into a few different categories: strategic planning methodologies, defined as long-term planning approaches aiming for overall goals; models and terms of references, being more concrete supports for planning WSS-projects; frameworks for planning WSS systems, aiming for a more holistic system approach; and toolboxes for planning WSS systems, collections of a variety of tools, supporting different parts of the planning process (Törnqvist, 2007). 2.1.3 Defining Sustainability Sustainability is a recurring word in the many planning supports available, and a given system or part of a system is often evaluated according to its level of sustainability. The direct definition of sustainable, as given by Oxford English Dictionary, is something “that can be kept going or maintained”, but the word is commonly used in the context of development, namely sustainable development. The classical definition of the concept tracks back to United Nations World Commission on Environment and Development – the Brundtland Commission – and the 1987 report Our Common Future: “Sustainable development is development that meets the needs of the present without compromising the ability of future generations to meet their own needs”. Since 1987, the concept of sustainability has evolved, and not without debate; the term sustainable development is inherently contradictive, as development rarely 4 happens without some degree of environmental degradation. In the specific case of this thesis, the sustainability definition is divided into six components, to make it more applicable as an evaluation tool; environmental, socio-cultural, institutional, health, economic and technological sustainability. In the following sections, each component is shortly described together with the criteria indicators that will be used for evaluation, adopted from the list proposed by Kvarnström et al. (2004). Environmental sustainability. In WSS systems, the environment is both used as a resource (source), with the abstraction of water, and as a recipient (sink) for pollution, such as waste and wastewater. A sustainable usage of a source is when the rate of withdrawal does not exceed the rate of natural replenishment. To sustainably use the environment as a sink, the rate of discharge of pollutants must not exceed the ability of the environment to absorb the pollution. Criteria indicators include the use of land, energy, materials and chemicals during construction and operation and maintenance, the discharge of oxygen depleting substances, nutrients and hazardous substances to water bodies, air emissions, and the possibility of recovering resources such as nutrients, organic material, energy and water. Socio-cultural sustainability. For a WSS system to be socio-culturally sustainable, it must be entirely accepted by the users. To be accepted, it is important that it is compatible with local traditions and habits, perceptions and beliefs. User consultation and participation is essential for obtaining socio-cultural sustainability. Criteria indicators include comfort, personal security, smell, noise, attractiveness, adaption to different age-, gender and income groups; appropriateness to the local culture; system perception; and the ability to address awareness and information needs. Institutional sustainability. The institutional characteristics concern the society on a central level – things that often are out of reach for the individual – whereas the socio-cultural characteristics concern an individual/local level. Examples are political environment and governmental structure; institutional organization and decision-making procedures on a central level; laws and regulations and the enforcement of laws and regulations. An institutionally sustainable WSS system is politically accepted, supported by institutional organization and legally recognized. Criteria indicators include institutional requirements, responsibility distribution, organizational structure, legal acceptability and legal enforcement. Economic sustainability. On the one side, a WSS system that is affordable for the user is an economically sustainable system (Kvarnström & af Petersens, 2004). On the other side, for a system to be economically sustainable, the full costs of the system ought to be generated locally (Cardone & Fonseca, 2003). The two different views must not be exclusive, e.g., situations with full cost recovery, but many times poor people cannot afford to recover the costs, and external funding such as subsidies or credits are necessary. The economic component is often the most difficult to combine with the others. Criteria indicators include the costs of construction, operation and maintenance, financial sources, capacity and willingness to pay and local development possibilities. Health sustainability. The main purpose of a WSS system is often to improve health, and a sustainable system is thus one which minimizes the health risks, for example by maximizing the quality of drinking water and minimizing exposure to pathogens. Also possible effects on food security due to recycled nutrients and waters are included here. Criteria indicators include pathogen leakage to the surrounding environment, pathogen removal, risk of exposure 5 to pathogens and chemicals, vector proliferation, effects on food security and the available water quantity. Technological sustainability. Technical sustainability is obviously of major importance for a WSS system. The following criteria are suggested by WHO: proper and reliable function, i.e., the planned service is provided, and accessible, for all during the entire day and it is hygienically safe; design and equipment is robust and function over a longer period of time; the management is well integrated in society and involves the community; the costs of operation, maintenance and administration is covered locally; and the environmental effects must not be harmful (Brikké & Bredero, 2003). Opportunities to construct the system locally with locally available material, and the possibilities to update and enlarge the system should also be taken into consideration. Technologies can many times be easily adapted to specific settings, and this sustainability component is thus often the first to be altered in relation to the other (Kvarnström & af Petersens, 2004). Criteria indicators include system robustness (risk of failure, effect of failure, structural stability), robustness of use of system (shock loads, effects of abuse of system), robustness against extreme conditions (drought, flooding, earthquake etc.), possibility to use local competence for construction, operation and maintenance, durability/lifetime, compatibility with existing system, flexibility/adaptability (to user needs and existing environmental conditions) and upgrade possibilities. 2.2 REVIEW OF WSS PLANNING SUPPORTS There are a large number of different WSS planning supports available, coupled with an even larger number of case studies, targeting developed as well as developing regions. One of few literature reviews, or inventories, over the different supports available is the Törnquist master thesis Planning support for water supply and sanitation in peri-urban areas (2007), where 17 planning supports are evaluated. Due to the limited time frame, the review within this project draws on the findings by Törnquist, extended to additional planning supports focusing on rural areas. Nueva Vida is a small and remote village where average income as well as average level of education is low. These preconditions imply that the technical solutions must be rather simple and inexpensive, which in turn proposes a high level of household involvement, stressing the need of stakeholder participation throughout the planning process. Törnquist categorizes the reviewed supports according to their degrees of user participation and complexity. Within this thesis, the supports categorized by Törnquist as of high participation and low complexity, were subjected to an in-depth review. The extended search for WSS planning supports with a rural context resulted in mostly very local and case-specific approaches, and two of these, both tested in field in Latin America, were chosen for further analysis. 2.2.1 Selection based on the Törnquist literature review Household-Centred Environmental Sanitation (HCES). The HCES approach was developed by Eawag, the Swiss Federal Institute of Aquatic Science and Technology, and opposed to traditional centralized planning approaches it focuses the planning and decision-making process on a household level. HCES is based on the Bellagio Principles, a list of principles concerning universal access to safe environmental sanitation, developed in Bellagio 2000 by an expert group brought together by the Water Supply and Sanitation Collaborative Council (Eawag, 2005). The framework is divided into five modes and ten steps, displayed in Table 3 (pg. 10). Important concepts are the division of the city into zones (the innermost being the household), and circular systems, referring to the desired flow of resources and wastes. 6 Through recycle and reuse, waste products are kept within the system/zone it was generated, minimizing the export of environmental degradation to systems/zones outside. The method is currently tested in the field in cities in Africa, Asia and Latin America, focusing on unserved and underserved urban and peri-urban settlings. Open Planning of Sanitation Systems (OPSS). OPSS, in the Törnquist review referred to as Open Wastewater Planning (OWP), is a method for strategic planning of sanitation systems, developed by the SwedEnviro Consulting Group. The planning support is based on a methodology called Open Comparative Consequence Analysis (OCCA), developed by WRS Uppsala AB. The core of OCCA is that the desired result of sustainable household sanitation can be reached through a variety of sanitation technologies. In the choice of solution, local conditions, regulations in place and user preferences must be taken into account to obtain the most appropriate and sustainable system. The methodology is based on a set of criteria, where the function requirements (targets) to be met by the sanitation system are defined. The criteria are specific for the context and identified together with the relevant stakeholders, covering aspects of practical, economical and institutional nature. The criteria is described in Terms of Requirement (ToR), later used to analyze different sanitation alternatives. The needs described in ToR must be fulfilled by the final choice. A list of sanitation-related sustainability criteria, a survey about existing sanitation planning and implementation tools, and the input of some sanitation experts evolved the OCCA into OPSS. The process is divided into five steps, displayed in Table 3. In the first step – problem identification – OPSS recommends the use of participatory tools, such as the Logical Framework Approach (LFA) and the Participatory Hygiene and Sanitation Transformation (PHAST). The same tools are also proposed to help defining the ToR (step three). In the second step, identification of boundary conditions, an analysis of strengths, weaknesses, opportunities and threats – a so called SWOT-analysis – is recommended to obtain a thorough picture of the community. Sanitation 21. Sanitation 21 – Simple Approaches to Complex Sanitation (2006) – is a framework aiming to help develop appropriate, sustainable, effective, time- and place-specific solutions. The originator is the Core Group of the IWA Sanitation 21 Task Force, made up of engineers, water scientists and technicians. The framework is divided into three modes and nine steps displayed in Table 3, and the involved stakeholders are divided into different decision making domains, to facilitate the understanding and analysis of different interests and incentives across the city. A depictive matrix with modes and steps horizontally listed and the participation domains vertically listed is provided to help the user. Also included are lists over different technology options and their management requirements, the objectives and objective-related impacts of different domains of participation (Drivers at each level in the Sanitation System) and a list of analytical tools for assessing the sanitation system. The framework has not been tested in reality. 2.2.2 Selection based on additional literature review Environmental Health Project Guidelines. The document Improving Sanitation in Small Towns in Latin America and the Caribbean – Practical Methodology for Designing a Sustainable Sanitation Plan (2002) is prepared by the Environmental Health Project (EHP) for the U.S. Agency for International Development (USAID). The four writers promise expertise in engineering, finance, public participation, institutional development, health and environment; the target group is practitioners and the main context is small towns in Latin America. Divided into two parts, the document provides an overview of WSS issues in small towns in Latin America, including the current situation and potential improvement strategies, and offers a detailed participatory methodology (from here on referred to as guidelines) for 7 designing sustainable sanitation services in the named area. The guidelines are divided into ten steps, displayed in Table 3, and for each step the following is included: rationale (purpose and importance of the step), expected outcomes, key information needed, key activities, products (written results from the step) and tools for performing the work. Also included is a “sample planning matrix” to overview and facilitate the process. In the detailed analysis of most-feasible technical options, the options are analyzed in the contexts of technical, financial, health and environmental suitability, associated management models and policy constraints. In 2001-2002, the methodology was tested in field in three small towns in Panama, Jamaica and Ecuador, and the experiences gained have been incorporated into the guidelines (Rosensweig et al., 2002). The Pilot Project to Improve District Water and Sanitation Management and Sustainability (PROPILAS). PROPILAS, executed by CARE Peru in cooperation with the Swiss Agency for Development and Cooperation and the Water and Sanitation Program (WSP) Regional Water and Sanitation Program – Latin America and the Caribbean, aimed to design and validate sustainable methods for obtaining basic water and sanitation in rural areas. The project assisted six rural district municipalities in the department of Cajamarca, Peru, to either construct new plans for WSS development and interventions, or to improve existing plans. The results are presented in the document Experiences with strategic planning for rural drinking water and sanitation in district municipalities. The strategic planning process is divided into three phases, a preparatory stage, a design stage and a stage of institutional arrangements, in turn divided into 16 steps, displayed in Table 3. In the first step of the first stage, the methodology is designed, in the named project based on a participatory and multisectoral planning approach. The planning process was then led by each district municipality, supported by PROPILAS. In the second step of the design stage, key issues are defined, in these specific projects the following were identified: infrastructure; administration, operation and maintenance; health and hygiene education; strengthening of municipal and community management. In the forth step in the same stage, a SWOT-analysis is performed to assess the ability of the municipalities to provide services. The lessons learned from the pilot project were that (a) the participatory approach enriched the planning process, pointing out different coexisting views and interests, as well as building consensus, creating alliances and ownership, (b) the district WSS diagnose (assessment) provided a good starting point for discussions and also facilitated for appropriate decisions, and (c) a local information system, providing on-going and updated sectoral information, is useful for managing the provision of WSS services. 2.2.3 Comparison between reviewed planning supports In Table 3, where each of the reviewed planning supports is displayed, broken down into their modes and steps, a rough classification of the different stages is also presented (first column). The stages are divided into identification, introduction, assessment, options, evaluation, decision making, finalization and realization. Not all steps in all of the planning supports fall well within any of these categories, and in some supports, the steps are reversed; thus, this classification does not attempt to correctly define the supports, only to draw a general picture and facilitate for comparison. By looking in the table, or in some cases by just reading the titles, it is apparent that many of the reviewed planning supports contain similar steps. OPSS has pronounced similarities to HCES, and many of the steps in Sanitation 21 are expected outcomes from steps in OPSS and HCES, as well as the EHP planning support. Differences mainly exist in the disposition and chronological order of the steps, as well as in focus and level of particularization. OPSS is written in general terms, the EHP support provides detailed checklists and tools for each step. Another difference is that the OPSS and 8 Sanitation 21 have not been tested in a low- and middle-income country context, whereas the HCES approach have been used at pilot sites in Africa, Asia and Latin America and the EHP method as well as the PROPILAS were developed, employed and refined through projects in Latin America. Most of the reviewed planning supports are articulately opposed to the traditional topdown approach in the planning of WSS, emphasizing the need of participatory processes. Both the Sanitation 21 and HCES present a circular division of the city into different domains. In Sanitation 21, the decision making domains include the household, describing the personal sphere of families/individuals; the neighborhood/ward/district, attempting to describe the level where households either act, are politically represented, or for planning purposes can be organized together; and the city and beyond the city, areas where central planning and policy making are done (IWA Sanitation 21 Task Force, 2006). Each domain is related to the others through external influencing factors, subjected on an inner domain by an outer domain. In HCES, almost the same division is done (but with the notation zone): household, neighborhood, community, political subdivision, city, and the wider environment. A common initial step, before launching any planning process, is to ensure that the ground for change is fertile; the community must understand why and how the issue is important and themselves ask for improvements of the present situation. Participatory learning methods such as Community Led Total Sanitation (CLTS) and PHAST can stimulate the motivation among the future system users and result in the required demand for change. HCES, OPSS and PROPILAS all stress the need of “creating an enabling environment” (Eawag, 2005) and a high level of stakeholder involvement. The rhetoric in Sanitation 21 is slightly different; neither the use of participatory tools nor awareness-raising processes are mentioned. The EHP guidelines are probably the support with least emphasis on stakeholder participation; the public meetings recommended throughout the process are informative rather than consultative until the evaluative stage. 2.3 WSS PLANNING SUPPORT FOR NUEVA VIDA 2.3.1 Summary of findings Considering the many problems with WSS planning and intervention in low- and middleincome countries, outlined in Chapter 2.1, the need for changed approaches is clear. In the review of the different planning supports, notable were the many similarities seen between them. The things that appear to be important for successful WSS planning and intervention are to (a) involve the future users and listen to their needs and wants; (b) visit the community and assess the current situation, not only by looking at the WSS system but on all things affecting WSS and the provision of WSS infrastructure; (c) propose technological solutions based on the findings in (a) and (b), making sure that the required resources, for construction, and specially for operation and maintenance, are locally available (e.g., human resources, financial resources and material); and (d), to let the future users and local decision-makers have the last say before launching the implementation. Striking is the simplicity of these new approaches; the inclusion of some of the steps seems obvious, but what the steps require in terms of in-field work and results has indeed proved very difficult to live up to. 9 Table 3 Steps in the different planning supports Stages Identification HCES Project identification Request for assistance Introduction Preplanning and preparation Launch of the planning and consultative process Assessment Preparation Assessment of current status Assessment of user priorities Options Identification of options OPSS Problem identification Identification of boundary conditions Terms of requirement (ToR) Sanitation 21 Context Identification of stakeholders Identification of stakeholder interests Identification of decision driving external factors EHP PROPILAS Preparatory stage Designing the methodology Gain agreement of local decision makers Introducing the sanitation planning activity to the public and measuring public support Motivating municipal authorities; induction Sanitation system/options Identification of capacities for implementation and Map and analyze existing/new system management Gathering detailed information on sanitation related conditions, existing sanitation technologies and hygiene practices District water and sanitation diagnoses Identifying and inviting stakeholders Fit for the purpose Detailed identification of existing/new system Identification of technical options Design stage Presentation and analysis of district water and sanitation diagnoses Definition of key issues in water and sanitation management Local institutional framework for water and sanitation services 10 Stages Evaluation HCES Evaluation of feasible service combinations OPSS Analysis of possible solutions Decisionmaking Project appraisal and approval Preparation of consolidated UESS plans for project area Choice of the most appropriate solution Finalization Realization Sanitation 21 Assess the meeting of objectives Assess the matching of management Assess the successfulness of the solution EHP Discussion of feasible technical options with stakeholders Detailed analysis of most feasible technical options and development of outline of draft sanitation plan PROPILAS SWOT analysis of the municipalities’ ability to provide services Strategic goals for water and sanitation Meeting with stakeholders to discuss detailed options Deciding on one option by local/national decision makers The Vision Statement Finalization of consolidated UESS plans Final sanitation plan and report Preparation of the Annual Operating Plan Preparation of the Water and Sanitation Investment Plan Consolidation of the strategic planning document for water and sanitation Implementation Monitoring, (internal) evaluation and feedback Implementation Developing an action plan to implement the proposed sanitation plan Follow up and monitoring of the strategic plan Workshop at which strategic plan is presented Forming of support committee for district WSS management Municipal council issues resolution or ordinance approving the strategic plan 11 2.3.2 Developed planning support Due to the high level of detail, and the many analytical tools included, the EHP Guidelines were employed as a template in the development of a planning support for Nueva Vida. However, bits and pieces of the other supports were also incorporated to fill identified gaps and adopt the planning support to the specific setting. The planning process is divided into the eight stages mentioned above: Problem identification/request for assistance (identification); Launching the planning process (introduction); Assessment of the current situation (assessment); Screening for technical options (options); Outline of draft WSS plans (evaluation); Deciding on WSS plan to proceed with (decision-making); Finalizing the proposed WSS plan (finalization); and Implementation (realization). In Table 4, the process is outlined in detail. Stages 3 to 5 are divided into steps of identification, evaluation and meeting with stakeholders, the latter to ensure public participation and support. The assessment stage (3) includes a throughout assessment of the situation in the village, not only in terms of WSS; socio-cultural, institutional, environmental, economical and health characteristics are also to be assessed. The evaluation step in stage 3 is done through a SWOT-analysis, to identify abilities and possibilities within the community. The sustainability criteria from chapter 2.1 are employed to evaluate the different technical options. 12 Table 4 Developed planning support for Nueva Vida, adapted from Rosensweig et al. (2002) Stages Identification Introduction Steps 1 Planning support Nueva Vida Problem identification/request for assistance 2 Launching the planning process 2.1 2.2 2.3 Assessment 3 Gain agreement of local decision-makers Introduce the WSS planning activity to the public and measure public support Increase the motivation for improvement and rise a demand for the planning process Assessment of the current situation Identification 3.1 Gather detailed information about technical, environmental, socio-cultural, institutional, health and economical aspects concerning WSS Evaluation 3.2 3.3 Identification of stakeholders Identification of challenges Meeting with stakeholders 3.4 3.5 3.6 Discussion about the prevailing situation with stakeholders Assessment of user priorities Consensus for common visions and identification of key objectives Options 4 Screening for technical options Identification 4.1 Identification of technical options Evaluation 4.2 Evaluation of the identified technical options according to objectives and sustainability criteria Comparison of options Evaluation of feasible service combinations 4.3 4.4 Meeting with stakeholders Evaluation 4.5 5 Discussion of feasible technical options and service combinations with stakeholders and decision on which options to proceed with Outline of draft WSS plan Identification 5.1 Detailed analysis of most feasible technical options and service combinations, resulting in the development of outline of draft WSS plan Evaluation 5.2 5.3 Assess the meeting of objectives Assess the meeting of sustainability criteria Meeting with stakeholders 5.4 Meeting with stakeholders to discuss detailed options and reach consensus about the final plan Decision-making 6 6.1 Finalization 7 7.1 7.2 Realization 8 Deciding on WSS plan to proceed with Decision of final plan by local/national decision-makers Finalize the proposed WSS plan Final WSS plan and report Develop an action plan to implement the proposed WSS plan Implementation 13 14 3 THEORY 3.1 WATER SUPPLY 101 Water is fundamental to life on earth and thus one of our most valuable resources. During the last century, global water consumption has grown twice as fast as population, driven by increased irrigation, industrialization, urbanization, tourism development and per capita demand (WELL, 1998). Water is not only used as a resource, but also as a sink – pollutants of various kinds are frequently released into aquatic environments, to be diluted and dispersed. Some wastes can be degraded in the system, but the capacity for self-treatment is limited and many times it is the ecosystem itself that ends up degraded. 3.1.1 Water quality In most countries the quality of drinking water is subject to extensive quality standards, regulating the maximum allowed levels of contaminants (MLCs). Due to regional differences in the quality of the raw water, political and public attitude in the subject and uncertainties in the actual impact of different parameters on human health, the MLCs and the controlled parameters may differ between countries. Displayed in Table 5 are Peruvian, Swedish and American MLCs for control parameters in use in this thesis. Table 5 Drinking water MLCs for Peru, Sweden and United States, control parameters in use in this study Swedenb United Statesc Parameter Unit Perua Appearance pH 6.5-8.0 7,5-9d 6.5-8.5e d Conductivity (25 °C) mS/m 200 250 Turbidity NTU 5 0.5 Microorganisms Total coliform bacteria CFUf/100 ml 0 0 0 Fecal coliform bacteria CFU/100 ml 0 0 0 a) Reglamento de la calidad del agua para consumo humano (DIGESA, 2005). b) Livsmedelsverkets föreskrifter om dricksvatten SLVFS 2001:30 (Livsmedelsverket, 2001). c) US EPA Drinking Water Contaminants (US EPA, www) d) MCLs at the recipient e) Secondary MCLs, given values are only recommended, the actual MCLs may differ between states f) Colony-forming units Physical and chemical assessment. Concerning health, the most crucial chemicals to monitor are heavy metals, arsenic, fluoride and nitrate (Hedberg & Stenström, 1992). Apart from the last, these substances can often be tracked back to the regional geology and their natural occurrence in the bedrock, but anthropogenic activities such as mining may increase their concentration in the water. Excessive amounts of nitrate in water are more likely to be caused by man, e.g., due to discharge from wastewater treatment plants, leaking latrines or runoff from agricultural land. Further substances associated with health risks are organic chemicals such as pesticides and hormones, and radioactive ones such as radon. Physical parameters governing the water appearance – including color, electric conductivity (EC), hardness, odor, pH, taste and turbidity – may not be regulated mainly out of health concerns, but to ensure user acceptability. However, many of these parameters also function as indicators of other contaminants; being relatively simple and cheap to measure, they are often analyzed on a daily basis, in contrary to most of the actual contaminants. Turbidity measures how much light that is absorbed by suspended material in the water, such as soil particles and organic matter. Higher levels of suspended material, resulting from 15 discharge, erosion and stormwater, and biological growth in the water, are indicative of water contamination (US EPA, www). Microorganisms tend to reside in the organic matter fraction, and there is thus often a positive correlation between bacterial contamination and turbidity. Turbidity levels tend to vary with stream flow and velocity. Crucial for several chemical and biological processes is the acidity/alkalinity of the water, measured in pH. If the acidity/alkalinity of the water is known, it is also possible to tell in which ionic form a substance is present and which chemical reactions that will occur. Electric conductivity (EC) measures the electric current that can be passed through the water, a function of the number of ions in solution. High conductivity indicates the presence of inorganic substances, such as aluminum, calcium, chloride, iron, nitrate, phosphate, sodium and sulfate. The concentration of inorganic substances – and thus EC – is primarily dependent on the regional geology and the types of soil that the water passes through (US EPA, www). Microbiological assessment. Among all health risks associated with drinking water, the most common and widespread ones are infectious diseases, caused by water contaminated by bacteria from human or animal feces (WHO, 2004a). Bacteria are not the only group of pathogens present in water, but the most common out of four; the remaining three are viruses, protozoa and helminthes (parasitic worms). All groups can be found in human and animal feces, but bacteria are likely to be present together with any of the others, which make them suitable as indicator species. Feces are not the only cause to microbiological contamination; a large number of microorganisms also exist naturally in waters and the environment, the majority not being pathogenic (Scholz, 2000). Pathogen occurrence in water depends on several factors; apart from the magnitude and type of human and animal activities in the area, also the intrinsic physical and chemical characteristics of the catchment play a role (WHO, 2004a). Point sources of pollution include discharge of wastewater and urban stormwater; runoff from agriculture and leakage from latrines, as well as wildlife and livestock access to the water body, represent non-point sources (WHO, 2004a). Most pathogens lose their viability and infectivity after leaving their host and this commonly follows an exponential decay curve. The rate of decay increases with increased temperature and for example UV radiation. Microbial predation and competition with the indigenous microflora also accounts for substantial reductions (Scholz, 2000). Microbiological testing of water is commonly done by using total coliforms or thermotolerant fecal coliforms (from hereon referred to as fecal coliforms) as indicator species; both types are found in the intestines and feces of warm-blooded animals. Total coliforms also naturally exist in plant material and soil, and their presence in water does thus not provide conclusive evidence of fecal contamination. Fecal coliforms are safer indicators as they are more exclusively found in intestines and feces, but they include one genus (Klebisella) that can also come from non-fecal sources (Weiner, 2000). 3.1.2 Sources of Water Groundwater, the water located beneath the ground surface in the saturated zone, is usually abstracted through a well, dug or drilled. The depth of the well, and thus the cost of constructing it, depends on the distance from the surface to the groundwater aquifer, ranging from a few meters to several hundred. The potential yield depends on the size of the aquifer, and to be sustainable, withdrawal must not exceed the natural rate of recharge. The cost of abstracting groundwater, including the cost of pumping, tends to be higher than that of surface waters (Ganz, 2003). Being located beneath the ground, water quality and temperature is relatively constant over time, and turbidity, microbiological contamination and content of organic matter is usually lower than in surface water. The content of minerals is generally 16 higher in groundwater, as these substances are dissolved from the rocks and soils in which the water resides. Springwater is groundwater that naturally emerges at the ground surface, either visibly in a spring, or directly into a river. The flow of the spring sets the potential yield. The water tends to be rich in minerals, similar to groundwater, but being exposed to the atmosphere renders it more susceptible to microbiological contamination. Surface water includes all waters that are exposed to the atmosphere, such as streams, rivers, lakes and reservoirs. Abstraction can be done in a variety of ways and the potential yield depends on the size of the flow and the design of the intake. Rapid changes are characteristic for surface waters, e.g., due to seasonal changes in temperature, flow and the ecosystem, or because of single events such as heavy rainfalls and accidental anthropogenic contamination (Ganz, 2003). The microbiological quality of the water is likely to be low, as the water is exposed to many risk factors. Mineral content tends to be lower than that of groundwater. Rainwater harvesting is suitable in areas where precipitation is high: the yield can be calculated by multiplying the precipitated amount with the surface employed for harvesting. The water is often relatively clean (low content of both minerals and bacteria), especially in rural areas, however easily contaminated during collection and handling (Brikké & Bredero, 2003). 3.1.3 Water Treatment Water treatment in drinking water production is the process of converting raw water into safe and palatable drinking water, in line with the national quality standards. The treatment process involves two components, concerning health and user acceptability (esthetics). The healthrelated component has to do with the removal of microbiological and chemical contamination, making it safe for human consumption. The esthetical component involves the lowering of turbidity, hardness, color, dissolved solids and minerals, removing unpleasant taste and odor and making it attractive for human consumption. The range of available water treatment options spans from simple methods done at home, to highly advanced technologies employed in industrial plants. Below follows a short description of the main steps included in the production of drinking water, the parts about centralized water treatment is based on the book Water Treatment by Ganz (2003). Preventive measurements. The need of water treatment depends on the quality of the raw water, and a logical starting point is thus to protect the water source from being polluted in the first place. Protection is done through the introduction of multiple barriers, separating the water source from potential sources of pollution. A common barrier is the restriction of certain activities in the catchment area, for example agricultural, industrial and recreational. Limiting access to the source by introducing physical barriers is another example. Within a jurisdictional region, the regulation of the types of products available, or the means of disposing wastes, may also reduce the risks of pollution. A community-based method for water protection is the development of a so-called water safety plan, where risks throughout the system are identified and suitable control measures – actions, activities and processes to minimize the risks – are decided upon (Davison et al., 2005). Pre-treatment. If the raw water contains large particles, pre-treatment is necessary to facilitate for subsequent steps and protect the equipment in use. By screening, large objects such as sticks and plant material are removed. If larger sediment particles are present, such as gravel, sand and silt, pre-sedimentation can be necessary; common options include storage or the use of sand traps. Sedimentation is the process of particles settling due to the force of gravity, and 17 the time it takes for a given particle to settle on the bottom depends on its size and density. On a household level, sedimentation can be done by simply storing the water for some time, allowing the particles to sediment to the bottom of the container, and afterwards decant the water. Clarification. To remove smaller particles sedimentation on its own would require too much time to be a viable option. Thus, chemicals (commonly aluminum-based) are added to speed up the removal, a process referred to as coagulation and the subsequent formation of settleable particles is known as flocculation. On a household level, clarification is usually not done, but one option is the use of natural coagulants. The seeds from the Moringa oleifera plant are an example of a natural coagulant; they contain water-soluble proteins that readily bind to negatively charged particles in raw water, resulting in flocs that can be removed by sedimentation (WELL, www). Filtration. The purpose of filtration is to reduce turbidity as well as bacteria levels; water is passed through a filter medium, by which suspended particles are removed from the water. There are many types of filtration methods, differing in the filter media employed and/or the rate of filtration. This process step can be employed on its own or in combination with other process steps, the latter often necessary to obtain good quality water. Two of the most common technologies are rapid sand filtration (RSF) and slow sand filtration (SSF) (also known as biological filtration). Both RSF and SSF can be adapted to fit a household level design as well as large-scale treatment plants. In conventional water treatment, filtration is normally done after the clarification step to remove remaining flocs. Disinfection. Disinfection is the process of inactivating the pathogens in water, and it is usually the final step in the treatment process. Disinfection methods include treatment with heat, UV radiation and chemicals. In conventional water treatment, chemical disinfection is the most commonly employed, and most notable the use of chlorine. The main advantage of this type of disinfection is the residual concentration of the chemical in use, which protects water from re-contamination. On a household level, heat treatment – boiling – is the most common, but chlorination also exists, as well as the method of solar disinfection (SODIS). With SODIS, water is filled up in plastic bottles and placed in the sun, for UV-A radiation (wavelengths of 320-400 nm) to destroy the pathogens. Die-off increases further when water temperature exceeds 45 °C. Chlorination. The addition of chlorine in water results in three types of reactions; (a) the irreversible precipitation of some dissolved substances such as manganese, iron and hydrogen sulfide, (b) reversible reactions with organic matter and ammonia, forming weak disinfectant compounds, and (c) reaction with or dissociation in water, resulting in efficient disinfectants if the water is not alkaline. The amount of chlorine involved in process (a) and (b) is referred to as chlorine demand, and this is the amount that is consumed in the treatment process. The amount of chlorine in process (c) is known as residual chlorine and this is the main advantage of the chlorine treatment; re-contamination of the treated water is minimized due to its existence. Peruvian drinking standards state that chlorine residual must not fall below 0.5 mg/l throughout the distribution system. The actual chlorine demand most notably depends on the concentration of organic matter in the water, and is thus related to turbidity; for direct chlorination WHO guidelines state that the turbidity of water must not exceed 5 NTU, ideally be less than 1 NTU (WHO, www). Reactions are not instantaneous, and a reaction time of at least half an hour is required to ensure the die-off of resistant microbes such as amoebic cysts. However, to inactivate protozoa cysts and eggs and helminthes, both higher doses and longer contact times are required, unviable in drinking water treatment (WHO, www). 18 3.2 SANITATION 101 The need of waste management arose as human settlements grew larger, when the health and environmental complications from the practices of open defecation and littering became too large to sidestep attention. Two of the main objectives of improving sanitation are to promote human health, by minimizing exposure to pathogens and toxics, and to promote environmental health, by protecting air, land and waters from pollution. Hygiene is a concept closely tied to the matter of sanitation, defined as “removal of dirt and disease causing elements from the humans and their surroundings” (Rylander, www) and thus targeting user behavior in the sanitation system. The following sections give a brief introduction to the different types of wastes – human excreta, greywater, stormwater and solid waste – and common ways of dealing with them. Based on the definitions proposed in the Eawag Compendium of Sanitation Systems and Technologies (2008), each of the sections is initiated with a list of the terms in use. 3.2.1 Excreta Excreta are the human waste consisting of urine (liquid part) and feces (semi-solid part). Cleansing material is the material used for anal cleansing, such as paper and rags, including menstrual hygiene products. Flushwater is the water transporting excreta through a waterbased (sewage) system. The mixture of urine, feces, flushwater and cleansing material is defined as blackwater, interchangeably referred to as sewage. Wastewater is used as the general term for blackwater that may or may not include greywater and stormwater. When excreta or blackwater are stored for some time, fecal sludge is the resulting product, and when fecal sludge is digested, partially or entirely, it is referred to as treated sludge. The treated liquid part is denoted effluent. Brownwater is the mixture of feces and flushwater, obtained in a urine-diverting toilet. The different methods for excreta management can illustratively be classified in the three main groups drop-and-store, flush-and-discharge and ecological sanitation. Drop-and-store refers to the use of latrines, and being simple to construct and relatively inexpensive, latrines are the most common method of managing excreta in the developing world. In the industrialized world, sewage systems, the flush-and-discharge method, is the most widely used. The methods of drop-and-store and flush-and-discharge have both been questioned regarding their sustainability, and as a response to this, the concept of ecological sanitation was developed. Drop-and-store. Excreta are “dropped” in excavated pits in the ground, and in the simplest design – the traditional pit latrine – there is no need for collection or transport, treatment/disposal is performed by “storing” the excreta in the pit. The main advantages of drop-and-store management are its simplicity and low cost, making it a viable choice for poor people. The drawbacks, however, are manifold. To construct a latrine, the ground must be accessible, both in terms of property rights and of physical properties. New pits must be constructed every few years, requiring land, and in crowded areas, land is scarce. The digging of pits is restricted by a hard ground, or a high water table, or because of constant flooding in the area (Winblad & Simpson-Hébert, 2004). Highly permeable grounds are also unsuitable, since leakage from the pits may pollute nearby water bodies. Even though latrines have the potential of being safe, experience shows that they often degrade to a health-threatening state. Further, the use of latrines is many times perceived as an inferior method and for many people, flush-and-discharge is a desired sign of economical development. The traditional latrine consists of the pit, a slab with a drop hole and a superstructure of optional material. Improved traditional pit latrines are such that ensure a hygienic separation 19 of excreta. This can be accomplished by a hygienic slab, a tight-fitting lid to cover the drop hole, a raised floor to prevent flooding and if necessary, a lined pit hole (Brikké & Bredero, 2003). A ventilated improved pit (VIP) latrine is an improved traditional pit latrine, complemented with a vent pipe in order to reduce odor and insect proliferation. An alternative to the pit latrine is to collect the excreta in a container above ground. When the container fills up, the material is removed to another site where it is left to hygienize. This method allows for a permanent superstructure and eliminates the need of digging pits, making it possible to locate the latrine closer to the house and on less suitable grounds. Flush-and-discharge. Flush-and-discharge systems include a water-flushed toilet, a piped network for transportation of the blackwater, and, in the best case scenario, a process step where the blackwater is treated, and the resulting sludge managed, prior to discharge into the recipient. In high-income countries, the method is often associated with advanced treatment techniques and stiff regulations on the allowed minimum quality of discharged effluent. In low- and middle-income countries, systems are often fragile and blackwater is many times directly discharged into nearby waters, without treatment. From a user point of view, this is the most convenient method of handling excreta, as it involves a minimum of operation and maintenance tasks, and as long as the discharge is done with care and the operation-required water supply is reliable, the system is also safe for the user. In densely populated areas, in high- as well as low- and middle-income countries, flushand-discharge is an effective method with the possibility of obtaining high quality treatment to a low per capita cost. However, to transport excreta from the toilet to the point of discharge, large volumes of water are used; the 500 liters of excreta produced by one person in one year is flushed away with some 15000 liters of water (Winblad & Simpson-Hébert, 2004). Other drawbacks include the high initial capital cost, the expensive maintenance of old infrastructure, and the inflexibility in regard to research and development of new techniques which results from the high capital cost (IWA Sanitation 21 Task Force, 2006). Blackwater contains the same amount of nutrients and pathogens as the excreta, but diluted by flushwater, and to be able to safely discharge the water into a recipient, treatment is necessary. The constituents of primary concern in blackwater treatment are suspended solids and dissolved inorganic products, biodegradable organics, pathogens, nutrients, priority pollutants, refractory organics and heavy metals (Basak, 2002). Transportation of excreta from the toilet to the point of treatment and/or discharge is done with water through a piped network/sewer system. The capacity of different sewer systems varies; in high-income countries, high quality large-diameter tubing allow for the transportation of cleansing material, whereas in low- and middle-income countries, the commonly installed low cost tubing rarely manage to handle additional materials. Examples of lower cost conveyance technologies are simplified sewers and solids-free sewers. Blackwater treatment can be divided into mechanical, biological and chemical such. Mechanical treatment, including pre-treatment and primary sedimentation, is the initiating step and its main purpose is to remove larger particles from the blackwater. Screens, sand traps and skimming tanks are examples of pre-treatment techniques. The purpose of biological treatment is to remove the remaining organic compounds by biological processes; microorganisms are employed to degrade the organic matter into carbon dioxide and biosludge. Examples of technologies based on biological treatment suitable for tropical climates are aerobic and anaerobic ponds, wetlands and biological beds. The removal of nutrients and heavy metals is often associated with environmental protection, commonly done through biological and/or chemical treatment. 20 Ecological sanitation. Ecological sanitation (EcoSan) is an alternative approach of dealing with sanitation, where excreta are viewed as a resource instead of as a waste product, and through its main component – the toilet – valuable nutrients are recovered and recycled into fertilizers for food production. This section is based on the document Ecological Sanitation – revised and enlarged edition (2004) by Winblad & Simpson-Hébert from Stockholm Environmental Institute (SEI) and for the different types of facilities, the compendium Toilets That Make Compost (2007) by Morgan. EcoSan includes three main system types: dehydrating, composting and soil-composting. The dehydrating system employs urine diversion to separate urine from feces, resulting in urine that can be used as fertilizer and dry feces that are easier to handle than excreta. In composting systems, excreta are mixed with household organic waste, resulting in the existence of a large variety of decomposing organisms. The process takes place in a process chamber, and some operation and maintenance are required to obtain the optimal decomposition conditions. In soil-composting systems, excreta are mixed with generous amounts of soil. The resulting compost product is referred to as eco-humus. The main characteristic (and advantage) of EcoSan is the recycling of nutrients; food is turned into excreta, excreta are turned into fertilizers, fertilizers in soil boost crop yield that becomes food. The disadvantages of EcoSan are those of the drop-and-store method; being on-site, it requires a higher degree of user operation and maintenance than flush-anddischarge, which open up for the risk of neglect and the subsequent facility degradation resulting in health risks. In many cultures, the thought of handling and using human excreta in food production is repelling, making EcoSan difficult to promote. The Arborloo is a composting latrine, based on a temporary single pit. In short, it is the same improved traditional pit latrine as described above, but with a few modifications in operation and final disposal. By adding organic material and soil and ash after every use, the excreta are more rapidly decomposed, and fly and odor problems are reduced. When the pit is full, instead of abandoning the site a tree is planted on top of it, feeding on the eco-humus and recycling the nutrients. With Fossa alterna, two permanent shallow pits are used alternatively, the structure is the same as that of the improved pit latrine and the operation the same as of the Arborloo. When one pit is full, the filling is left to decompose while the other one is used. When the second pit is full, the eco-humus in the first pit is hygienized and can be safely excavated, whereupon the pit is taken into use again. The urine-diverting toilet has a special pedestal or squat plate which separates the urine from the feces. Alternatives for urinediversion are the urinal and the eco-lily (which can be used by both men and women), userinterfaces employed only for urination. Use and/or disposal of end products. End products, such as latrine filling (eco-humus) and blackwater effluent and sludge, can be either recycled or disposed of. Recycling can be done by using the eco-humus and sludge as fertilizer and soil conditioner in agriculture, construction material, fish-food and fuel. Methods of disposal include uncontrolled dumping, the use of landfills and incineration. Treated blackwater effluent can be discharged to surface water, percolated to the groundwater or reused for irrigation. With irrigation, care must be taken in the choice of application method and crop, and the time between application and harvest. When percolated into groundwater, it is important that the effluent is safe and allowed to infiltrate unsaturated ground before reaching the watertable. The point of infiltration must not be in the vicinity of extraction wells. Nutrient recycling in agriculture. Winblad & Simpson-Hébert (2004) identify four main reasons for recycling nutrients: (a) to obtain food security and alleviate poverty – in many parts of the world weather conditions, soil quality, land availability and economical resources put severe constraints on food production, resulting in undernourishment and sever poverty; 21 (b) to give cost savings to farmers – commercial fertilizers are expensive whereas urine is free, the two having similar impacts on growth; (c) to prevent nitrogen pollution in water – traditional pit latrines close to water bodies often result in leakage; and (d) to restore lost topsoil – erosion results in great losses of topsoil every year, and by adding organic material from compost (eco-humus), some of this can be restored, resulting in improved food security and environmental sustainability. The following section is based on the EcoSanRes report Guidelines on the Use of Urine and Feces in Crop Production (2004) by Jönsson et al. One person produces about 500 liters of urine and 50 liters of feces in one year, corresponding to about 5 kg of elemental nitrogen, phosphorus and potassium; exact amounts vary with diet. The majority of the nutrients, about 85 %, is accounted for by the urine, in which 90-100 % is in a form that is readily available to plants. The number of pathogens in urine is low and on a household level, urine diverted at the source can be applied in agriculture without further treatment. Feces have a lower flow of nutrients per person compared to urine, and half of the nitrogen and most of phosphorus exist in the undigested fraction of the fecal matter, which must be let to decompose in the soil before the nutrients become available for plants. However, potassium is readily available and the relatively high concentration of phosphorus in feces still makes it interesting as a fertilizer. Further, the main advantage with fecal matter is its high content of organic carbon, which improves soil structure, water-holding capacity and buffering capacity, as well as providing soil microbes with required energy. Feces must be subject to secondary treatment prior to soil application. Fecal pathogens are sensitive to a number of environmental factors, such as storage time, temperature, dryness, pH, UV radiation and competition with other soil organisms. Increasing any of these parameters will result in an increased inactivation of pathogens and this could be done through incineration, thermophilic composting, low temperature composting, storage, anaerobic digestion and chemical sanitation with urea. Application of urine can be done on almost any type of crop, a few times or continuously during its growth, but preferably before the plant reaches its reproductive stage and the nutrient uptake drops. Application of fecal material to the soil should be done prior to sowing or planting; the large amount of phosphorus available in the material is especially beneficial in the first stages of growth. To minimize the risk of pathogen contamination, vegetables that are eaten raw should not be treated with fecal matter. 3.2.2 Greywater Greywater is household wastewater without blackwater, or more specific: the wastewater created in the kitchen, shower and during cloth-washing, and it is sometimes also referred to as sullage, grey or light wastewater. Typically, greywater contains low levels of pathogens and nutrients compared to blackwater, but it is relatively high in biodegradable organics. The latter is responsible for the most notable problem with greywater: when the organics are decomposed, oxygen is depleted and anaerobic conditions occur, creating bad odors. Greywater from the kitchen has relatively high levels of nutrients and suspended solids due to the presence of food residues and also detergents. The suspended solids account for the high content of biodegradable organics. Greywater from the bathroom is usually the least polluted, containing hygiene products such as soap and shampoo, but also skin, hair, body-fat and traces of excreta. In greywater from cloth-washing the content of chemicals is high, coming from detergents and bleaches, but also from the dirty clothes. Detergents may contain considerable amounts of phosphorus. If diapers are washed, the load of pathogens, which commonly is marginal in greywater, increases considerably. The amount of greywater produced mostly depends on the availability of water; if water abounds, and the costs are not associated with actual usage, the amounts can reach several hundred liters per person and day. If water is scarce and difficult to access, the amounts go 22 down to a bare 20-30 liters per person and day. In Table 6, examples are given on the produced amounts in different countries. According to Ridderstolpe (2004), a desirable yet viable production would be 80 liters per person and day. In low- and middle-income countries, greywater is often discharged into the stormwater sewers and discharged untreated into aquatic systems. If sewers do not exist, it is commonly discharged directly onto the streets or ground, resulting in pools of water that, apart from smelling and being unaesthetic, also may spread pathogens, become breeding sites for mosquitoes and destruct the streets (Morel & Diener, 2006). Table 6 Greywater production in different countries, note that the data are examples and not country averages, modified and complemented from Morel & Diener (2006). Mali Perua South Africa Swedenb Vietnam Country 250 20 190 80–110 Total amount 30 (L/day) In-house taps Community In-house taps In-house taps Water source Single tap a) Greywater production in Tarapoto, largest city in the San Martín region, Nuñes Perales (2009) b) Ridderstolpe (2004) The following section is based on the EcoSanRes report Introduction to greywater management (2004) and complemented with the Eawag production Greywater Management in Low- and Middle-Income Countries (2006). To minimize the need for treatment, pollution should be prevented at the source, where the specific habits of the households have an important role to play. Toxic products ought to be replaced by non-toxic alternatives, phosphorus-based detergents removed from the stores, and food residuals thrown into the garbage bin instead of into the sink. The installation of a grease trap in the home effectively reduces BOD load in the greywater. Refraining from overdosing hygiene products and detergents, and minimizing greywater production, would further improve the situation. Treatment facilities are dimensioned after the hydrological load and the contents of biodegradable organics and BOD, and decreasing these parameters at the source saves both money and land. To transport the greywater from the point of production to that of final disposal, a sewer system is necessary. Instead of constructing a special sewer system, the greywater have commonly been directed into the blackwater stream. However, greywater and blackwater have very different requirements in terms of treatment and by mixing the two, greywater becomes contaminated by pathogens from the blackwater and blackwater treatment becomes more difficult due to the substantial increase in volume. A piped network for greywater alone is more efficient and allows for the usage of thinner pipes. The aims of greywater treatment are to reduce (a) biodegradable organics, (b) microbiological load and (c) organic pollutants and heavy metals. Treatment can be done on a household level or a (semi-) centralized, the need for pre-treatment commonly arises in the latter case. To prevent biodegradable organics from clogging the system or creating odor, the amount of solids in suspension should be reduced. Removal can be done mechanically and common pre-treatment technologies for doing so are septic tanks, screens and filters. There are three main methods for treatment, ranging from extensive (in terms of land and time requirements) to intensive (energy-wise): sorption and irrigation systems, vertical soil filter systems and biofilter reactors. Methods for use and/or disposal of the end product are similar to those of blackwater effluent. 23 3.2.3 Stormwater Stormwater is water resulting from precipitation events. In stormwater management, concerns lie in the part of stormwater that does not infiltrate the ground, but ends up as runoff and, if excessive, results in flooding. The percentage of stormwater that is infiltrated into the ground depends on the permeability of the soil, topography and land cover. Sand has higher permeability than clay and can thus accommodate more water, water has more time to infiltrate in flat areas than in steep, and vegetation traps the water and allows for higher infiltration than bare surfaces (WHO, 1991). Frequent flooding and poor stormwater management commonly creates problems in many low- and middle-income countries, and the problems are generally aggravated by poverty. The physical negative impacts with flooding include disruption in transportation, power and communication systems and damage to buildings and infrastructure. The impacts on health can also be severe. In places with poor sanitation, stormwater mixes with excreta and solid waste, and pathogens are effectively spread throughout the community; contaminated water can infiltrate to water supplies and water supply systems; and standing water and wet soil are excellent sites for mosquitoes to breed and parasitic worms to lay eggs (Parkinson, 2003). A system for stormwater management consists of a drainage network and possibly a treatment step. When it comes to technology choice, a central question is open or closed drains. Closed drains minimize exposure, but are more difficult and expensive to construct, operate and maintain, and if ventilation is poor, slowly moving sewage can produce bad odor gases that deteriorates the infrastructure (WHO, 1991). The next question is whether or not the stormwater should be treated. As mentioned above, pathogenic contamination may occur in areas with poor sanitation and in urban areas, several polluting substances may end up in the water. The different treatment technologies available and methods for use and/or disposal of end products are similar to those of greywater. 3.2.4 Solid Waste Solid waste is non-liquid material without value for the person who is responsible for its creation, and it is commonly referred to as garbage, trash and rubbish (Zurbrügg, 2002). The generation of solid waste normally follows the production and consumption of goods, and can thus be divided into industrial and municipal such. The choice of management depends on the nature of the waste, which broadly can be categorized as organic, inorganic or hazardous. Organic wastes are those that contain carbon, often derived from plant or animal material and degradable, such as food residues and paper. The organic fraction of waste is often wetter and thus heavier than the inorganic fraction. Glass, metal, sand and synthetics are examples of inorganic materials, often used for packaging before ending up in the bin. Hazardous wastes are those that, due to their physical, chemical or biological properties (e.g., radioactivity, corrosivity and infectivity), have the potential to damage human and environmental health, such as batteries, household chemicals and medicines. Included in this category are healthcare wastes. The amount of produced solid wastes is also of importance for management matters and production tends to increase with economic development. In Table 7, data about municipal solid waste generation in different countries is given. The per capita production is highest in the industrialized world, whereas the highest increase is seen in China, where production rose with more than 30 % between 2000 and 2006. In low- and middle-income countries, 50-90 % of the total waste is organic (UNEP, www), whereas in high-income countries, the inorganic fraction tends to be larger (Zurbrügg, 2002). 24 Apart from issues of general unaesthetic and odor, problems associated with poor solid waste management (SWM) concern human and environmental health. Uncontrolled dumps pollute land, water and air, resulting in a general environmental degradation. Waste that is not collected tends to end up in streets and drains, severing flooding events, breeding of insect and rodent vectors and the spread of disease (Zurbrügg, 2002). Table 7 Production of municipal solid waste in 2006 (OECD, 2009) Sweden United States China Mexico Perua Country 115 345 394 495 760 Per capita production (kg/capita/year) 30.4 17.6 n.a.b 18.6 5.5 Production growth 2000-2006 (%) a) Based on 2007 per capita daily production of 1.08 kg (Red RRSS, 2007) and a population of 27412157 people (UN population statistics, 2007 census) b) Not applicable The main components of SWM, including waste reduction, collection and treatment/disposal methods, are covered in the following sections, based on the comprehensive UNEP International Source Book on Environmentally Sound Technologies for Municipal Solid Waste Management. Waste reduction strategies are a common part of SWM, including material reuse and recycling. On a central level, waste reduction is done by minimizing product packaging, stimulating public awareness and regulating producer responsibility. On a local level, materials can be separated or recovered from the general waste stream and traded for reuse and recycling, composting can be promoted and pressure put on the central level to play its part. Waste collection is often the most expensive part of SWM, accounting for 60-70 % of the total costs in high-income countries, and a hefty 70-90 % in low- and middle-income countries. In developing countries, collection is often carried out in the informal sector, by poor individuals or small unregistered enterprises. Small muscle-powered vehicles, such as wagons and animal-drawn carts, are used to collect the material, which is later screened for valuable material that can be sold or processed. The point of collection could be in the home (curbside collection) or at a communal site. Communal sites are appropriate in areas where curbside collection is economically, practically and technically unfeasible, such as poor and dense neighborhoods with inaccessible roads. Composting, incineration and landfills are the three main methods of treating/disposing solid waste. By composting organic waste material, not only waste reduction can be obtained, but the resulting product can be used as a fertilizer and soil amender. The method is common all over the world, ranging from small-scale household composts to large-scale centralized facilities. However, according to the UNEP Sourcebook, composting is the SWM system responsible for the largest number of poor-performing and failing facilities in the world. Identified problems include high costs of collection, operation and maintenance; low market demand for the compost product; and poor compost product quality, due to failing waste stream separation and little understanding of the complex decomposition process. There are a number of factors that affect the composting process, requiring knowledge and labor from the compost caretaker and thus restricting the effectiveness of the technique. The most important factors are the type of material and its nutrient contents, a particle size that maximizes the surface area without clogging the pile, a moisture content that optimize microbiological growth, oxygen availability throughout the pile and temperature (Raabe, 2008). Incineration is the combustion of solid waste, also known as thermal treatment. With incineration of municipal solid waste, weight is reduced by up to 75 % and volume up to 25 90 %, which is the main benefit of the technique. Another pro is the effective destruction of hazardous organic wastes and pathogens, making it the preferred choice for healthcare special wastes. On the negative side are the economics: high capital and operational costs make this technique cost-effective only in areas where land for landfills is scarce. Through incineration several pollutants are released into the atmosphere, including greenhouse gases (GHG), photochemical ozone, acidic nitric oxides and dioxins (Liamsanguan & Gheewala, 2007). The resulting ash contains elevated levels of heavy metals such as lead, cadmium, copper and zinc. Landfills are the simplest and oldest technique for waste disposal, where the waste is basically dumped on or in the ground and left there. Today, landfills range from uncontrolled open dumps to carefully managed and secure sanitary such. The advantages and disadvantages of landfills depend on the status of the facility. Open dumps are cheap and easy to construct, the waste is subject to aerobic degradation and there is a potential for material recovery through free waste picking and trading; drawbacks include the substantial risks imposed on humans and the environment, such as pathogen spreading, vector provision and the leakage of detrimental fluids and gases. Sanitary landfills minimize the environmental risks and protect the health of people living in the area, but the costs are high, sitting more difficult and waste pickers cannot freely access the area. Compared with other techniques, the cost-effectiveness of landfills depends on land availability; if land is cheap, the method is generally the cheapest. Final disposal at its best (i.e., sanitary landfills) involves sealing of the dump, application of a final cover and continuous monitoring of leaking liquids and gases. 26 4 METHODS The planning process was carried out, according to developed planning support (methodology), in the village of Nueva Vida between April and June 2009, and in the office between July and September the same year. Due to the scope of the project, the entire planning process was not implemented, but only the stages of identification (stage 1), introduction (stage 2), assessment (stage 3) and options (stage 4). The deficient WSS situation was identified in a preceding study about child health and drinking water quality (Sandström, 2008), and during the working course in the village, it became clear that many asked for improvements (stage 1). The project, along with the results from the preceding study, was introduced through a meeting with the local governor (2009-04-03) and a meeting with the public (2009-04-04) (stage 2). Support from both the governor and the public was granted. 4.1 ASSESSMENT OF THE CURRENT WSS SITUATION The assessment work (step 3.1) was carried out in the field between April and June 2009. In line with the developed planning support, technical, environmental, socio-cultural, institutional, health and economical characteristics were compiled, to present a thorough picture of the WSS situation. Stakeholders were identified (step 3.2) and the collective results were evaluated through a SWOT-analysis, to identify the possibilities and challenges for WSS intervention in Nueva Vida (step 3.3). During a meeting with the local health technician (2009-05-30), the public was gathered and the findings from the assessment were presented (step 3.4). A discussion about the results followed, and many people asked questions about the existing problems and possible solutions. The meeting was finalized with a review of some of the viable technical solutions, resulting in a new discussion and also opinions to take into consideration in the proceeding work (step 3.5). 4.1.1 Fact collection Information and data were obtained through interviews with involved stakeholders and professionals in the different topics, field trips to WSS sites both in Nueva Vida and in other parts of the region, and a literature study. 4.1.2 Household inventory In-depth interviews were done with 30 households, about a fifth of the total number of households in the village. The interviews, performed in day-time during a weekend in the houses of the interviewees, were semi-structured and assisted by a local guide. Based on set of predefined questions (see Appendix I), the level of breath and depth in the different topic areas was modified depending on the individual households and their answers. During the interviews, water treatment and storage methods and sanitary facilities in the households were also inspected. Topic areas included general information about the household (size, occupation, level of education, housing) and its economical situation, agricultural practices, health and hygiene practices, water supply and treatment, and sanitation. The selection of interviewees was done based on geographical location; the village was divided into 26 blocks, with the streets as natural division lines, and about a forth of the households in each block was arbitrarily selected for participation. In the households, it was often more than one person participating in the interview, but the most active adult was defined as the main interviewee. 27 4.1.3 Water quality The main water supply in the village was a centralized distribution system (pg. 42) and in the household inventory, two additional sources of water were identified; one open spring (pg. 42) and rainwater collected by a household through rooftop harvesting (pg. 43). Water samples from all of these sources were taken for physical and microbiological analyses. The efficiency of different water treatment methods were also analyzed for, including samples treated by households and with SODIS. Two sets of water samples were taken during May and June 2009 (Table 8). The first sampling round is referred to as round a, and the two sampling dates a1 and a2. The second round is denoted with b, including the three sampling days b1, b2 and b3. The turn of the month May/June is the end of the rainy season and the beginning of the dry, and prior to both sampling rounds, there had been no rain for a couple of days. During the first sampling round however, there was a heavy rainfall early in the morning on the day of collection, lasting for about 2 h. Samples were analyzed for bacteria concentration (total and fecal coliforms) and physiochemical variables (turbidity, pH and EC) by the EMAPA3 laboratory in Tarapoto. Samples for bacteriological analysis were stored refrigerated and analyzed within 24 h after collection. The microbiological analysis was carried out on a sample volume of 10 ml, filtered through a 45 µm membrane and incubated for 24 h. For total coliform bacteria, the media was Agar mEndo and the temperature 36 °C; the like for fecal bacteria was m_FC and 44.5 °C. Turbidity was determined with a Hach 2100N turbidity meter, pH with an Orion 420 A pH meter and EC with an Orion 3-Star conductivity meter. Measurements on pH could not be done in situ, and given the oxygen dependence of pH and the likely oxygen depletion during the storing time, the laboratory values are not very informative, and will thus not be discussed in detail. During the second round, additional samples were taken for physiochemical analysis. To identify if there was any correlation between turbidity and bacteria concentration, the resulting data were evaluated with the Spearman’s rank correlation test, and the MannWhitney test was employed to identify significant differences between the bacteria concentration in crude and treated water samples (i.e., the efficiency of the treatment). Both tests were performed with a confidence interval of 95 %, and bacteria concentrations above the detection limit were assigned a value of 25 % above the highest detected concentration. Crude water. Water samples were collected from important points along the distribution system: the stream point of capture (CP), the sand trap (ST), the reservoir (RE), and from three household connections, located north (H1), east (H2) and south (H3) of the reservoir (Figure 1). From the open spring, water was sampled from its point of emergence (OS) and from the distribution pipe (OD), located about five meters from the point of emergence. In the first sampling round, rainwater collected through household rooftop harvesting (RW) was included for analysis. The rainwater was stored by the household in an open plastic jar from the time of the last rainfall to the time of collection (see pg. 48). The flow of water at the stream point of catchment was measured with a floater; three transects were defined no more than 4.5 m apart (limited by the physical conditions at the site), and the length and depth (at five points) were recorded for each transect, as well as the type of bottom. The time taken for the floater (a 50 ml bottle filled with water) to go from the first to the last transect was measured, a procedure repeated five times. Given the stationary water level in the reservoir, the flow of water into it was estimated to be equal to the outflow 3 Empresa Municipal de Servicios de Agua Potable y Alcantarillado de San Martín, the regional drinking water provider. 28 (at the outlet used for emptying the reservoir). The outflow was measured by recording the time it took for it to fill up a 20 L bucket, a procedure that was repeated five times. The flow of the open spring was measured with the same method as the reservoir flow. Treated water. At each of the household connection sites, including the rainwater harvesting site, the family was asked to prepare a water sample treated and handled with their usual method of treatment and handling. Collection was done on the same day as the treatment. The method employed by all of the households was boiling, but H1 also filtered the water through a cotton cloth after boiling it (Figure 2). While H3 and RW stored the treated water in the kettle used for boiling it, H1 and H2 transferred it to a plastic jar for storage. For the SODIS treatment, water samples were collected from the household connection sites in 625 ml plastic bottles, placed in the sun on an aluminum roof and left overnight. The first set included a sample of the rainwater, the second set a sample from the point of capture in the river. During the first round (a), the bottles were placed in the sun at 3 pm and collected at 11 am the following day. In the second round (b), bottles were placed in the sun at 9 am and collected at 9 am the following day. The sun sets around 6-7 pm and rises around 5-6 am, resulting in a total of about 9 h of daylight. Thus, the a samples were exposed to sun for 9 h and the b samples for 12 h. Table 8 Water sampling schedule, abbreviations are explained in Section 4.1.3 Sampling Date Crude samples (n=30) Treated samples – boiling (n=7) 2009-05-12 (a1) H1a, H2a, H3a, RWa 2009-05-13 (a2) CP, RE, OS, H1, H2, H3, RW 2009-05-30 (b1) CPa, STa 2009-05-31 (b2) CPa, STa, REa×2b, OSa×2b, H1a, H2a, H3a 2009-06-01 (b3) CP, ST, RE, OS, OD, H1, H2, H3 a) Only physiochemical analysis. b) First sample taken in the morning, second at night. Treated samples – SODIS (n=8) H1, H2, H3, RW H1, H2, H3, RW CAP, H1, H2, H3 H1, H2, H3 4.2 SCREENING FOR TECHNICAL OPTIONS Stage four of the planning support – screening for technical options – was done partly in field and partly in office, finalized in September 2009. Through international organizations and bodies of research, several documents exist that overview the different WSS methods and technologies available on the market, especially suitable for a low-tech, low-cost context. Some of these documents are more comprehensive than others, summarizing not only what is available, but also the pros and cons of the different methods and technologies, often including lessons learned from previous applications in the developing world. Based on the results from stage three, some of these documents were employed for a first selection of methods and technologies of interest for the village of Nueva Vida. Selected methods and technologies were then subjected to an in-depth review, mainly through a literature study, but also by interviews. In step 4.2, the set of sustainability criteria defined in Chapter 2 (pg. 4) was employed to evaluate identified technical options, to facilitate for comparison (step 4.3) and the identification of feasible service combinations (step 4.4). The next step (not included in this project/thesis) would be to return the findings to the community, for discussion with the stakeholders about the feasibility of the different options and service combinations, followed by a decision-making on which options and service combinations to proceed with (step 4.5). For water supply, the first selection was mainly based on the WHO reference document Linking technology choice with operation and maintenance in the context of community water 29 supply and sanitation (2003), which targets planners and project staff and gives a broad overview of the available types and technologies for water sources and intakes, water-lifting devices, power supplies, water treatment, and storage and distribution. The comprehensive Eawag report Compendium of Sanitation Systems and Technologies (2008) was employed for a first selection of excreta and blackwater management methods, reviewing available types and technologies for user interfaces, collection and storage/treatment on-site, conveyance, (semi-) centralized treatment, use and/or disposal. For greywater and stormwater techniques, the selection guiding documents were Introduction to Greywater Management (Ridderstolpe, 2004) and Surface water drainage for low-income communities (WHO, 1991). The main source of information in the review of solid waste management methods was the UNEP webbased International Source Book on Environmentally Sound Technologies for Municipal Solid Waste Management. Figure 1 Water sampling points. Figure 2 Household water treatment by boiling (left) and after treatment with filtration through a cotton cloth, employed by household H1 (right). 30 5 ASSESSMENT OF THE CURRENT WSS SITUATION – RESULTS AND DISCUSSION This chapter composes stage three in the planning support and includes the steps of identification (step 3.1) and evaluation (step 3.2 and 3.3). The results from step 3.1 include information and data obtained from the fact collection and household inventory – presented in categories according to characteristic group and level of influence (household zone, community zone, and the wider environment zone4) – and the water analysis. The chapter ends with a summary of the assessment findings and an identification of stakeholders and the challenges concerning water supply, excreta and blackwater, greywater and stormwater, and solid waste in Nueva Vida. 5.1 FACT COLLECTION AND HOUSEHOLD INVENTORY The village of Nueva Vida (76°49’58”W 6°43’33”S) is located in the San Martín department in northern Peru, two hours by foot or a 45 minutes’ drive north from the larger village of Pasarraya (76°48’50”W 6°45’55”S) (see Figure 3). The town of Saposoa (76°46’31”W 6°55’38”S), center of administration for the province, is located one hour’s drive south of Pasarraya. At the time of the study, the road from Pasarraya to Nueva Vida was in extremely poor conditions and during the rainy season frequently inaccessible with motor vehicles. The road between Saposoa and Pasarraya was in slightly better conditions and public vehicles traveled the distance on a daily basis. Figure 3 Overview of the region, including the main settlements in the Huallaga Province, larger cities close-by (Tarapoto is the commercial center of San Martín), the Saposoa and Huallaga Rivers and their main tributaries. 4 Refer to the HCES zone classification (pg. 8). 31 5.1.1 ENVIRONMENTAL CHARACTERISTICS Wider environment zone Nueva Vida is situated in the Saposoa basin, which has a catchment area of about 200000 ha and drains into the Saposoa River (Figure 6, pg. 34). The basin, including the river and its main tributaries, is depicted in Figure 3 (pg. 31). The basin has a length of about 100 km, dropping from an elevation of about 3000 m.a.s.l. down to 250 m.a.s.l. where the Saposoa River discharges in to the larger Huallaga River. In the southern parts of the Saposoa basin, most land is deforested for the purpose of agricultural production, whereas the northern parts, almost 50 % of the total area, are to a large degree unexploited. The areas of urban expansion in the river basin are small, concentrated to the towns of Saposoa, Piscoyacu and El Eslabon. Concerning geology, the Saposoa basin is located in the sub-Andean zone, stretching from the high Andes to the lowland and still tectonically active and subject to intensive erosion processes (Nagel, 2005). The most common classes of soil in the region of San Martín in general (Escobedo Torres, 2004) as well as in the Saposoa basin (Lindell & Åström, 2008) are entisols, inceptisols and ultisols. Entisols have a homogenous horizon due to a low degree of weathering, indicative of recently deposited parent materials or that the processes of erosion or deposition are more rapid than the process of soil development. Inceptisols are moderately weathered soil, common in climates ranging from humid to semi-arid. The clayrich utisols are typical for tropical climates, in which soils, due to the hot and humid climate, are characterized by a by a high degree of weathering and high decomposition rates (Troeh & Thompson, 2005). The high degree of weathering answers for elevated levels of iron oxides and high decomposition results in low levels of organic matter. San Martín has a tropical climate with high temperatures and relatively high precipitation for all months. There are two rainy seasons, February to April and October to November; the driest period is between June and September (Nagel, 2005). There is little meteorological data available for Nueva Vida and the nearest weather station, run by the national service for meteorology and hydrology (Servicio Nacional de Meteorología e hidrología, SENAMHI), is found in Saposoa (320 m.a.s.l.). The monthly average precipitation in Saposoa has its peak in the rainy seasons in March and October with values of 206 and 155 mm/month respectively, and the lowest precipitation is seen in the summer months, dropping to 71 mm/month in July (Figure 4). The temperature is fairly constant throughout the year, averaging at 26.7 °C, with a small drop during the summer months (Figure 5). Maximum temperatures fluctuate between 31 and 35 °C and minimum ones between 19 and 22 °C. 250 (mm/month) 200 150 Precipitation 100 Evaporation 50 0 Jan Feb Mar Apr May Jun Jul Aug Sep Oct Nov Dec Figure 4 Precipitation and evaporation in Saposoa, 1999-2004 (SENAMHI). Evaporation is measured with the open tank method. The blue part of the bars, the difference between precipitation and evaporation, depicts the water availability. 32 40 Temperature (°C) 35 30 Maximum Average 25 Minimum 20 15 Jan Feb Mar Apr May Jun Jul Aug Sep Oct Nov Dec Figure 5 Average monthly air temperatures in Saposoa, 1999-2004 (SENAMHI) During the rainy season, the water level in Saposoa River rises, resulting in a decreased riverbank and aggravated navigability. Upstream the village, forest cover is relatively intact and the sources of pollution are likely fewer than downstream the village, where more villages are using the river as a recipient. In Saposoa (population 129515), wastewater and stormwater are for example discharged without prior treatment into the river. In 2005, a study about the hydrological conditions in the Saposoa Basin was done by WWF (Nagel, 2005), with four sampling locations along the river (Nueva Vida, Saposoa, Sacanche and Tingo de Saposoa). The results revealed that the physiochemical quality of the water in the Saposoa River was acceptable for drinking water, but parameters that with notable frequency exceeded Peruvian MLCs were nitrate, iron and lead. The microbiological quality was poor; the level of contamination had median values of 430000 total coliforms and 9000 fecal coliforms (MPN/100 ml), the highest figures observed in the vicinity of urban areas. Due to fierce erosion, both natural and that driven by increased deforestation, the content of suspended solids in the water is high, especially in the rainy season (Nagel, 2005). One of the most urgent environmental problems in San Martín, and the entire Amazon basin, is deforestation – the one anthropogenic activity responsible for the greatest environmental changes worldwide (Hubendick, www). Whether or not it is done to clear land for agricultural purposes, or to log trees, it causes great losses in biodiversity and habitats. Bare land is subject to increased erosion and thus loss of soil and nutrients, and the water holding capacity of the ground decreases, as well as the evapotranspiration. Slash-and-burn, also known as shifting cultivation, is a method to clear land for agricultural purposes; the forest is cut down, whereupon the material is burned and the crops are planted in the nutrientrich ash. When the production is smaller than the effort to cultivate the land, often within a few years after forest clearing for annual crops, the land is abandoned and new forest is burned. Slash-and-burn is common in many places in this region, but given that the farmers in this region are settled, it is inherently unsustainable. Littering is another environmental concern; both in terms of a general degradation of the environment and, more alarming, the uncontrolled dumping of hazardous wastes, such as batteries, motor oil, paints and pesticides. In the region of San Martín, large-scale energy production is commonly done by plants burning fossil fuel; on a small-scale, in remote villages, batteries are sometimes employed but access to electricity is generally scarce. In June 2009, biogas production did not exist in the San Martín region, but some communities were interested in the technology and projects were about to initiate (del Costillo Barrera, 2009). 5 2007 consensus. 33 Community zone In Nueva Vida, the main geological formation is Ipururo, formed through fluvial sedimentation processes during the Miocene epoch (24 million years ago) and composed by lime-rich clays, sandstone and layers of conglomerated cobblestone (Núñez del Prado et al., 2006). The main soils types in and around Nueva Vida were identified with the help of one of the farmers (Figure 8; Villager 1, 2009). A lime-rich clay and sand mix, referred to as Greda (loam) by the farmers, is the most common soil, suitable for growing cacao and coffee due to its high humidity retaining capacity. It usually contains a high percentage of aluminum silicates and can be identified by its red color. Greda negro (black loam) and arcilla reynoso (Reynoso clay) are other common types. The river bed and shore contained alluvial sand, suitable for growing food bananas and peanuts. The high clay content of the soils and the frequent runoffs during the rainy season are indicative of low permeability of the ground. The Saposoa River is the main recipient in Nueva Vida. It would be desirable to minimize the discharge of contaminating substances from the village of Nueva Vida, but the contribution of the village can be assumed to be relatively small and thus, the impact of reductive measures is also likely to be small, especially as long as the sources of pollution downstream remain (e.g., the town of Saposoa). There is a small creek passing through the village of Nueva Vida, used both as a source of water and a sink of waste products by the many households that cluster around it. Due to for example close-by latrines and roaming animals (Figure 12, pg. 48), the quality of the water is expected to be low. In the lower part of the village, there is an open spring, located about five meters from the creek and used as a source of drinking water by a handful of households close by. For the central water distribution system, water is abstracted from the creek Yacusicillo. The point of capture is located about 15 minutes walk upstream from the village and the creek springs about four km further west and drains into Saposoa River. Although there were no settlements in the area surrounding Yacusicillo at the time of the study, the land was partly cultivated, and at a point directly downstream the capture point, the forest was illegally cleared with the slash-and-burn method (Figure 6, pg. 34). The waters in Nueva Vida are depicted in Figure 1 (pg. 30). Figure 6 Main recipient in the Saposoa basin: River Saposoa, in Nueva Vida (left) and downstream in Saposoa (middle); slash-and-burn practices in Nueva Vida, a few meters downstream the drinking water point of capture (right). 34 Figure 7 Common soil types in Nueva Vida, photos from the left: greda, greda negro and arcilla reynoso. Figure 8 Map of Nueva Vida. 5.1.2 Socio-cultural characteristics Wider environment zone Compared to other parts of Peru, the number of non-governmental organizations (NGOs) is relatively low in San Martín, some of the most important being Amresam, Caritas and Management Science for Health (MSH). Amresam is an organization consisting of representatives from the different municipalities in San Martín, joined together to collect and transfer the joint experience in development projects; their main function is of intelligence. 35 Caritas is the international aid organ of the Catholic Church, and they have three offices in the San Martín region, staffed with administrators and engineers. They run about four to five projects annually, and at the time of the study, their main projects concerned improving rice production and promoting fish production, develop the family situations in the rural parts of the region as well as a project about ecological sanitation. Additionally, they offer microcredits for farmers and small-scale commercial enterprises. Caritas does not have their own capital, but performs their project with external such (Father Lorente Gutiernes, 2009). MSH is an international organization aiming to improve health in the developing world by assisting the public health management. In Peru they mainly work with the Municipios y Comunidades Saludables (MCS), a locally based program aiming to map and promote development in rural areas, in cooperation with USAID. MCS targets municipalities, communities, schools and families, mainly through workshops and with information materials. Their fields of interference include hygiene practices, water supply and treatment, improved latrines and ecological sanitation, and improved housing. The office in Tarapoto opened in 2004 and mainly works with intelligence. If a village requests educational help, MCS can provide it for free (Valle Donayre, 2009). The governmental bodies and initiatives that targets WSS, health and development includes EsSalud, MINSA, DIRES, DIGESA, FONCODES and PRONASAR (acronyms are explained below). EsSalud is the public health provider, working with ordinary health care but also with health promotion and socio-economic development. They provide education on health and hygiene to villagers. Community zone The settlement of Nueva Vida consists of both the village itself and the surrounding agricultural and forested land; the exact boundaries are not well defined. The focus of this study was the village itself; an area of about 54 ha situated on the west shore of river Saposoa. At the time of the study, the village also included six households on the east shore of the river. A map of the village can be seen in Figure 8. Households clustered around the main street, Av. Lima, and the central square. Also on Av. Loreta and the eastern parts of Jr. A. Shapiama and Jr. Bolognesa households were relatively dense, whereas the rest of the village was sparsely populated. In the western part of the village, the land was mostly unexploited and many of the streets were no more than narrow trails; some parts of the street system were not developed at all. In the end of 2008, the population reached 932 persons (Gusman Bajes, 2009). The demographic pattern, displayed in Figure 9, indicates a young population; 44 % are under the age of 20 and 75 % under the age of 40. A large part of the population in Nueva Vida consisted of emigrants from less fertile lands, such as the coast and the high Andes, a migration pattern commonly seen in many parts of the jungle regions. The population was thus characterized by a large diversity in ethnicity and culture, which could have been a possible source of disturbance in the community, but in Nueva Vida this was not identified as a problem (Villager 1, 2009). There were four different churches in the village (one under construction); one catholic and three evangelists (adventista, penecotes and avivamiento), the evangelists being most populous. 36 80-89 70-79 Age groups 60-69 50-59 40-49 30-39 20-29 10-19 0-9 0 50 100 150 200 250 Number of people Figure 9 Demographic pattern in Nueva Vida, December 2008. The roles of men and women in the village were very traditional; both men and women worked on their chacra6, but household work – such as child caring, shopping, cooking, cleaning and cloth washing – was almost exclusively done by women, and economical matters were often managed by the men (Villager 2, 2009). The local governor identified one of the largest problems in the village to be “family matters”, referring to the abuse of women in the home. The citizen army, responsible for the local law enforcement, had a female branch (ronda femenina) where the women were in charge of dealing with these “family matters” (Villager 2, 2009). At the time of the study, there was only a primary school in Nueva Vida (for children in the age of 6-13), where 95-98 % of the children were enrolled. There was a slightly higher percentage of boys enrolled than girls, and girls were more frequently absent, caring for younger siblings when the parents worked at the chacra (Luna Salas, 2009). According to the head of the primary school, Jonax Luna Salas (2009), the children that did not attend school were absent because their families lacked the required financial resources (15 Peruvian Nuevo Soles7 (PEN) for matriculation and an additional 30-50 PEN for material and clothes annually), did not see the importance of education, or because the family was living on the chacra during the week. For secondary school, students were referred to a school in Pasarraya, but very few continued to this level. In the years 2005 to 2008, the school in Nueva Vida had an average 126 students and out of these, only 2.5 students annually continued to secondary level (Luna Salas, 2009). Those that not continued commonly started to work on the family chacra. In 2007, 12 mothers in the ages of 25 to 56 were interviewed about their levels of education, and the result showed that 17 % had no education at all, 66 % had only primary, and 25 % considered themselves illiterate (Sandström, 2008). There were two community organizations active in Nueva Vida at the time of the study: Vaso de Leche and Club de Madres. Vaso de Leche is a national program in which the government supplies milk to all children in Peru, and in Nueva Vida, the work with this program was carried out by all mothers in the village, taking turn to prepare and serve the milk to the children before school. Club de Madres was a club for mothers in the village, mostly the younger ones, but at the time of the study they had no official activities, only infrequent and informal meetings. 6 7 Plot for cultivation. At the time of the study, 1.00 PEN equaled about 0.25 EUR. 37 Household zone The median household size was 5 persons (min 1 and max 10). Teenagers that had finished primary school and worked in their families were classified as adults. The median number of children was 2 (max 6 and in 10 % of the households there were no children at all). Agriculture occupied 93 % of the households, and 13 % had small commercial enterprises in the village. Three people, all of them men, had a professional degree (priest/engineer, oncologist and health technician) but only the health technician worked full-time within his profession. Almost three quarters (73 %) owned their own house and land, and the size of the premises ranged from about 100 to 900 m2 (Villager 1, 2009). The houses were mostly constructed of clay or wood with sheet metal or plant roofing, but the school and health clinic buildings were cemented. Cooking was done either on the ground or on a special table (tullpa), mostly in the house or in some cases in a specially assigned house on the yard. The energy needs of the households were mostly limited to that of cooking, for which 93 % used wood fuels and 57 % used gas occasionally (n=27). At the time of the study, many households had already installed the necessary equipment for electricity use, but the electricity net had not yet reached the village and no plans existed for when and how this would actually be accomplished. 5.1.3 Institutional characteristics Wider environment zone Ley General de Servicios de Saneamiento (no. 26338) is the law that governs the WSS sector in Peru. Sanitation services include drinking water, sewage, stormwater and excreta, and the law is applicable in urban and rural areas the like. The provincial municipalities are responsible for the service provision, but this responsibility can be allocated to both public and private, or mixed, entities (referred to as service providers). The work of controlling implementation and compliance of the law falls under the Superintendencia Nacional de Servicios de Saneamiento (SUNASS), with ultimate responsibility for the quality of the WSS services, the health of the population and the preservation of the environment (referred to as controlling organ). The service provider is obligated to provide service for all persons living within their jurisdictional area, to frequently control and ensure the quality and continuity of the service. All persons (some exceptions) living within a WSS district are obliged to connect to the services, according to the legal norms, on their own expenses and also ensure adequate usage. The service provider is responsible for operation, maintenance, required reparations and enlargements of the services, as well as providing the controlling organ access to the facility and financial and technical information. It is allowed to charge the users for their services. The tariffs, set by the controlling organ, should reflect the actual costs of providing the service, but are also said to take for example social equity into account. Solid waste is regulated in law no. 27314 (Ley General de Residuos Sólidos), controlled by Dirección General de Salud Ambiental (DIGESA) at the ministry of health (Ministerio de Salud – MINSA). The law specifies how different types of solid waste should be stored, collected and conveyed, treated and disposed of, including waste reduction strategies and waste commercialization. The regional governments are responsible for centralized planning and regulation of SWM; authorization, supervision and sanctioning of SWM within the jurisdictional area. Collection, conveyance, treatment and final disposal are managed by district governments. New sites for SWM must be subject to an environmental impact assessment (EIA) and accepted by DIGESA. According to the law, incineration should be the ultimate option for SWM. Final disposal of hazardous wastes should be done in sanitary landfills, authorized on a national level. However, at the time of the study, not even the largest 38 city in San Martín, Tarapoto, had this kind of facility; hazardous wastes were disposed of with the general waste stream (Nuñes Perales, 2009). Community zone Nueva Vida is a so-called caserío, administrated by the municipality of Pasarraya and located within the district of Alto Saposoa, the province of Huallaga in the region of San Martín. The village has its own governor – alcalde – elected for a length of office of two years. The responsible major is located in Pasarraya and also has a length of office of two years. At the time of the study, the current governor was in the end of his two years, and a new election was about to take place. The current major was relatively new and inexperienced, and in an interview (2009-04-21) he showed little interest in WSS issues. The law and order in the village was controlled by the governor, supported by so-called rondas, a citizen army in which the villagers took turn to service. The police in Saposoa were the nearest official instance, to which problems that could not be solved locally were taken. 5.1.4 Economical characteristics Wider environment zone The official procedure for the planning and projection of large projects include the following steps. (a) A detailed technical description – so-called perfil – of the project is done by contracted engineers, including the planned working procedures and the costs of the project. (b) The perfil is then presented in the Oficina de Proyectas Inversion (OPI) at the provincial municipality, which reviews it and passes it on to the national department for economics and finance. (c) At the department for economics and finance, projects are processes by the Banco de Proyectos, which reviews the perfil and accepts or rejects it. When a perfil is accepted, the project is supplied with funding. (d) If the national funding is insufficient, the provincial government must supply the rest of the money. The community often supports the project by supplying their workforce – mano de obra. According to Ruiz Olori, secretary at the infrastructure office of the provincial municipality of Huallaga, the limiting step is the first; making a perfil is very expensive and time consuming, and the local alcalde has to find finance for this work (2009). Once the perfil exists, the remaining procedure is often painless – the projects that reach the Banco de Proyectos are commonly accepted, and once the national funding exists, the provincial government usually supported the project. They key is thus to find financial sources for the perfil. Apart from the national and provincial governments, other sources of finance are NGOs and national funds specifically targeting development projects, such as FONIPREL, FONCODES and PRONASAR. Fondo de Promoción a la Inversión Pública Regional y Local (FONIPREL), administrated by the ministry of economics and finance, is a competitive fund aiming to improve development in the areas of education, health, sanitation and infrastructure. FONIPREL works with regional and local governments and finances projects and also pre-investment studies (perfils) with up to 98 % of the costs. Their projects are classified according to level of necessity. Fondo de Cooperación para el Desarrollo Social (FONCODES), administrated by the ministry of women and social development, funds and runs projects for economic and infrastructural development. In a given project, they usually provide 30 % of the costs and let the municipal cover the rest of the costs and the population supplies the manual work. However, their financial resources are limited and they often run out of money early in the budget year – the Tarapoto office did not afford any projects during the year of the study, but if financial sources were available, they could have sustained a project with technical expertise. Programa Nacional de Agua y Saneamiento Rural (PRONASAR) is a national initiative specially targeting rural WSS: their mode of 39 intervention includes the construction of new infrastructure (up to 80 % of the costs), improvements of existing infrastructure (up to 60 %), capacity building in the community, and hygiene education. The community must not be provided with WSS by any other organization and it must have resources to co-finance the project. At the time of the study, San Martín was not included in the program, but was planned to be so in the next extension (PRONASAR, 2009). Acopagro is a regional cooperative of small-scale cacao growers, exporting organic and fair-trade produce, and providing a set cacao price, insurances and loans to their members. To take on a loan, requirements include at least 1.5 ha cacao in production, payments of a member fee of 50 PEN/year and 20 PEN/year during the first five years as a security (returned). Further, a deposit of 10 PEN/month into an interest account (15 % annually) must be done during the first four years. Loan term is April to December, the size of the loan proportional to the estimated income from the cacao production (4.5 PEN/kg cacao) and the rate of interest 1.7 % monthly (22.4 % annually). The payback time is 15 months, which could be delayed with 3 months, and the loan can be used to improve crops, housing and health. The Catholic NGO Caritas offers microcredits to farmers. Requirements include the security of an own house, and before a loan is accepted, the loan-taker is subject to a socioeconomic assessment. The loans are normally on 1500-8000 PEN and must be repaid in the 510 months following harvest, with a rate of interest of 3 % monthly (42.6 % annually). Community zone Agricultural production is the single most important source of income and also the dominant food source for the households. Many farmers were new in the area, and the limiting factor was not land, but the expansion rate: a family could increase their production with a maximum of 0.5 ha per year (Villager 1, 2009). Household zone Information about the economical situation of the households was particularly difficult to achieve; only few kept records of incomes and expenses. In the village cash was mainly gained through the production and trade of cash-crops. Reported median annual income was 1500 PEN (min 0 and max 6000, n=21), but some households which stated zero income also had newly purchased goods on their property. At the time of the study, cacao beans vended at 4.5 PEN/kg and cafe beans at 4.0 PEN/kg. Given the potential annual cacao production of 1000 kg/ha and an average household production area of 3 ha, the average income should have ranged between 12000 and 13500 PEN. According to a Nueva Vida farmer (Villager 1, 2009), 5 ha were required for a lucrative production, which would correspond to an annual income of 20000-22500 PEN. A comparison between these expected incomes and those reported in the household inventory emphasizes the large uncertainties. The reason for the uncertainties may be because many of the households were just about to start up or enlarge their production. Thus, they did not know how much income to expect. Some households were not participating in the formal economy, surviving on what they cultivated on their chacra. Poor households could gain cash by working on better-off households’ chacras, yielding about 10 PEN/day, and apart from agriculture, commerce was a common trade in the region, in Nueva Vida composited by a handful of bodegas. Incomes from bodegas varied, but many of the vending families reported that the high competition decreased the profits considerably. Typical regular expenses included the costs of water (2 PEN/month), gas (median 37 PEN/month, n=3) and matriculation fees and school material for the children (about 50 PEN/child and year (Luna Salas, 2009)). At the time of the study, 29 % of the households (n=28) had taken on loans (many from Acopagro) and all of them had used the money to 40 invest in their chacra. Future loans were wished for by 89 % (n=27), and most households wanted to use it to improve and enlarge their chacra and their home. When asked about their willingness to pay for improved water services (e.g., safe drinking water), most stated that they were willing to pay more (apart from those currently without a water connection). Families were prepared to pay from the current 2 PEN/month to a max of 10 (median 5 PEN, n=20). 5.1.5 Health characteristics Wider environment zone The health ministry (Ministerio de Salud, MINSA) is the ultimately responsible for health in Peru, a responsibility passed on to Direccion Regional de Salud (DIRES) which in the case of San Martín is located in Tarapoto, and divided into sub-divisions. For Nueva Vida, the nearest instance is Micro-Red de Servicios de Salud (district of Alto Saposoa), followed by the Red de Servicios de Salud (province of Huallaga), both located in Saposoa. According to Marcelina del Costillo Barrera (2008), representative for health promotion at DIRES Red de Servicios de Salud Huallaga, the largest threats to health in the Huallaga province are dengue (for urban areas), undernourishment, parasitic infections such as leishmania, diarrhea and respiratory diseases. Community zone At the time of the study, there was one health clinic in Nueva Vida, staffed by health technicians and a midwife. To see a doctor people were referred to the health clinic in Pasarraya and the nearest hospital was in Saposoa. One of the health technicians was responsible for a water and sanitation program and visited households on an annual basis to assess the water and sanitation situation. The results were reported to the Micro-Red de Servicios de Salud. Apart from the WSS program at the health center, many of the official institutions and the NGOs had educational initiatives and material for health and hygiene promotion. Manuals on how to construct hygienic latrines and how to obtain safe drinking water were commonly seen in the governmental offices, but the problem was that they often only existed in one copy. The school in Nueva Vida also had educative material, based on the CLTS learning method, but also there the number of copies was sparse. In 2007, Sandström studied the correlation between drinking water quality and child health in four villages in the San Martín region, including Nueva Vida. 48 children under the age of five participated, twelve of them from Nueva Vida. The results showed that about a third of the children were stunted or severely stunted, five out of 43 were underweight or severely underweight. The average number of days a child had diarrhea in a month was 4.7 in the entire study, 4.6 in Nueva Vida. Almost all children (97 %, n=38) were infected by parasites, 89 % of the children in Nueva Vida (n=9). Household zone The most common health problems among children were diarrheal diseases and parasites, followed by infections and cough. Adults suffered from chronic diseases, infections, workrelated attritional wear, and to a lesser extent diarrhea. Children were more frequently ill than adults, but 30 % of the households also stated that they were perfectly healthy. When asked about the most serious health threat on a communal level, problems related to poor drinking water, sanitation and hygiene practices (e.g., diarrhea and parasites), and infection diseases, were mentioned. 41 No common construct concerning WSS beliefs and practices could be identified; they seemed to depend on the level of education and the relative income of the individual households, and also the age of the mother. Increased social and economical development, and age, appeared to result in a better understanding of the importance of hygiene. The cleanliness of the home environment left much to ask for; the garbage lying around, the animals living and eating and littering all around, and the frequent flooding during the rainy season created dirty premises, on which children played and food was cooked. Observations made it clear that food hygiene practices were poor; the compartments were many times dirty and so were the spaces and equipment used for food preparation. Animals often had free access to both the cooking and eating areas and the food storage. Many could not identify the linkage between hygiene in the home and diseases, and diarrhea in children seemed to be regarded as normal and inevitable. All interviewees stated that they washed their hands on a regular basis, and 89 % that they used soap doing so. In four families, children where assisted when washing their hands. 5.1.6 Technical characteristics Community zone Water supply. In Nueva Vida, the responsibility of WSS service provision falls under the municipally of Pasarraya, which constructed the existing water supply (WS) system, financed by large through governmental funding earmarked for this type of projects (Soto Tapullima, 2009). After the construction, a local water board of six persons was formed, with the administrative and executive responsibility of the WS system. At the time of the study, the local water board was in effect autonomic. From the Yacusicillo creek, water is pooled by a small dam and lead to a sand trap and thereafter to a reservoir in the village (Figure 10, pg. 47). From the reservoir, sized 24 m3, the water is distributed to stand-pipes on the premises of the connected households. At the time of the study, the water was not treated prior to distribution, and at least one leak in the tubing was identified, located on the tubing between the sand trap and reservoir. The water board employed a person for operation and maintenance and the system was cleaned once a week with chloride. Cleaning involved opening up the dam at the point of capture and allow it to empty to enable dredging. The treasure of the board collected the monthly fee, at the time of the study 2 PEN/household/month, and a total of 120 households were connected. Once a year, officials from the Red de Servicios de Salud Huallaga in Saposoa came to inspect the water and sanitation situation in the village. The inspection was done by visiting the water distribution system and interviewing people in the village as well as at the local health center. Twice a year, a sample from the reservoir was sent for microbiological analysis. At the time of the study, the most recent inspection (December 2008) had identified the following deficiencies: no protection of water course, point of capture or the reservoir – all parts of the distribution system were easily accessible by the public; the reservoir lacked a sanitary tap and the water quality was infrequently screened; the general maintenance and cleanliness of the system was poor. The lack of filter was also noticed. Results from the last microbiological analysis are given in Table 9, together with data from another study in 2008, demonstrating both a poor quality of the stream water and deficient household treatment methods and/or storage practices. 42 Table 9 Median results from previous microbiological analyses in the Nueva Vida water distribution system Date Study Method 2007-10-05 Sandström 2008 2007-10-05 Sandström 2008 2008-01-22 Red Huallaga, Servicios de Salud 2008 NMP/100 ml, analyzed after 48 h NMP/100 ml, analyzed after 48 h NMP/100 ml, analyzed after 24 h Point of sampling Boiled by the households Number of samples 5 Total coliforms 16000 Fecal coliforms - Stand pipe 4 16000 - Stand pipe 1 1100 1100 Future improvements and enlargements of the WSS services in Nueva Vida, such as centralized treatment of the drinking water or construction of a sewage system, lie in the hands of the municipality in Pasarraya. However, the finances of the municipality are weak, and at the time of the study, there were other villages within the municipality that still lacked a water distribution system and they were thus prioritized (Soto Tapullima, 2009). To abstract the springwater, the households had placed a PVC tube at the point of emergence, ending over the creek, from where they collected water with buckets. If not collected, the water simply continued into the creek. Blackwater management. Both the health center and the school had water-borne facilities. At the health center, WC and shower were located on the premises, and sewage was directly discharged into the nearby river, about three meters from the main road (Figure 11, pg. 47). At the school, WCs were installed in 2007, paid for by a governmental fund especially targeting sanitation projects. The school whished to construct a filter to clean the sewage, but funding was not available and a closed septic tank located on the premises was employed for final disposal (Luna Salas, 2009). According to the head of the primary school, in May 2009, the tank had not yet been filled up, but this could also be explained by a leaking tank. In 2008, nine households in one block, with sufficient financial resources, joined together to construct a sewage system on their own. The participating households formed a board and shared the required costs and labor to lay down the tubing (10 cm in diameter PVC tubes), resulting in a 120 PEN bill and six working days for each household (Villager 1, 2009). In the end of the system, on the riverbank, a septic tank was constructed to collect the sewage (18 m3). At the time of the study, there existed no clear plans on how to proceed with the septic tank, and the wastewater was at times directly discharged into the river (it remained unclear how often this was done). The construction of the private toilets was the responsibility of the individual households, and in May 2009, only two families had finalized the work and were thus the only ones that actually used the system (see Figure 11, pg. 47). The estimated cost of constructing a toilet was about 1000 PEN (Villager 1, 2009). Household zone Water supply. A majority of the interviewed households had access to water from the distribution net: 77 % had an own standpipe on their premises and an additional 17 % shared a water connection with some other household close by (often relatives). One household collected rainwater (Figure 12, pg. 48) and complemented with water from a creek, one other household collected water from an open spring. According to the concerned interviewees, water from the distribution system was available 24 hours a day, every day all the year, apart from one day a week when the reservoir was cleaned. However, in other parts of the region, water distribution systems are often put out of operation following heavy rains, which also is a suspected problem in Nueva Vida. Households at higher elevations than the reservoir could 43 not be supplied with water from the distribution system due to the lack of head. Collection of water directly from passing-by creeks was common among these families, critical due to the many sources of pollution nearby and upstream, such as latrines, animals and agricultural activities (Figure 12, pg. 48). The household that used the open spring reported incessant availability throughout the year. During the summer months, some of the farmers experienced water scarcity on their chacras (Villager 2, 2009), stressing the need for water saving practices on at least a location-specific level. Even though the local health technician stated that most households did not treat their drinking water, 63 % of the households reported that they boiled all drinking water, and another 10 % that they did so occasionally. One family used the SODIS method and one family treated their water with chlorine, both complementing with boiling if necessary. A resulting 20 % of the households drank crude water all the time. The median daily amount of treated drinking water was 3 L per household (min 1 and max 10). Dividing the total amount treated with the number of persons in each household that reported that they treated all the water, the median daily amount per person was 0.7 L (min 0.2 and max 1.8). These numbers indicate that the interviewees and their families either drank very little water, did not know how much they treated, or answered falsely on the question, giving an improved picture of reality. While many household could agree on the need of treating the drinking water, few recognized the necessity of handling it with care afterwards. The treated water was stored in buckets, jugs, plastic bottles or the kettle used for boiling it, uncovered or covered with lids, plates or clothes. In the case of buckets, cups were used to serve the water, but two households had a special bucket with a tap. Equipment was cleaned on a daily basis by 71 % of interviewees. Given the results from the water analysis of water treated by the households (see below in Table 11, pg. 53), as well as the results from previous studies (Table 9, pg. 43), handling and storage are suspected to be poor. Excreta management. Drop-and-store was the most common method for excreta management; all but one household had pit latrines on their premises, the remaining one practiced open defecation. Two households had recently installed WCs, and one more was about to do it. The need of improved facilities was recognized by 78 % of the households (n=18), and they wished for less odor, less entering rain and better commodity, cleanliness and health. The most popular solution was a wastewater system, but some interviewees mentioned improving the superstructure of the latrine and providing it with a lid. The superstructure of the latrines commonly had walls of wood or plaster; roofs were constructed with plant material, sheets of metal and wood; and floorings were made out of wood, the majority covered by clay (Figure 13, pg. 48). Common user interfaces are displayed in Figure 13; 31 % of the latrines were provided with a seating and 24 % had covers over the pit hole or the seating. Results from the interviews revealed that the median pit depth was 2.0 m and the median lifetime 3.0 years. The required depth per person per year was on average 0.2 m, (min 0.1 and max 0.3). Assuming a pit with a diameter of one meter (which seemed to be the standard), the median person accounted for 157 L of latrine filling annually, a number to compare with the 50 L of feces that a person produces annually. When a latrine was full, it was covered with soil and abandoned, and a new pit was excavated on the premises. At six sites, the latrine was built closer than five meters from a water body. Some cleaned the latrine on a daily basis, but more commonly only once a week. Women did the majority of this work, but men helped out in four of the households. One out of two had problems with rain entering the pit. Other observed problems included odors, insects and poor hygiene; one site was covered with diarrhea and at a few others, used cleansing paper was lying around. The superstructure was many times instable and/or incomplete; most notable was the poor flooring. Some pits were placed so inconveniently or remote from the house 44 (e.g., in very steep slopes or more than 50 m away from the house), it was doubtful that they were actually used. The fact that most people worked within agriculture made WSS not only an issue in the home, but also on the chacra, where open defecation and latrines were the two methods of excreta management. This has implications on the dimensioning of facilities in the home and also on the risk of pathogen exposure outside the home. Grey- and stormwater management. All 28 households (93 %) with access to a stand-pipe used it for showering, and all but one of these also washed their clothes under it. The resulting greywater was at the best diverted from the premises by small channels, but in most households not managed at all. The ground under the stand-pipe was commonly supported with stones or boards (Figure 14, pg. 49), but pools of greywater readily built up nevertheless, both underneath the stand-pipe and in areas close by. Households without access to a standpipe washed themselves and their clothes in passing-by creeks. Nine families had babies using diapers and eight washed them separately. Women were solemnly responsible for washing in all but one household. Dish-washing was done in tubes and the resulting water simply discharged on the yard. During the rain seasons, large precipitation in combination with the poor infiltration capacity of the soil made runoff a common problem. Of the interviewed households, 64 % reported problems with stormwater, but pools of rainwater and extensive mud were seen on many more premises (Figure 14, pg. 49). Most families had dug out shallow drains to divert the stormwater away from the premises, but they were often not sufficient in coverage or capacity. Solid waste management. There was no official solid waste management in place in Nueva Vida. Littering was illegal and signs set up around the village stated that the punishment for disobeying the law was 20 PEN, but as no one controlled and enforced it, no one had ever been fined. Organic waste was sorted, and to a varying degree composted, by 28 % of the households (n=29), but it seemed like many did not know what was organic and what was not, resulting in an unsorted mix. Plastic bottles was collected and sold to a passingby trader by 15 % (n=27). Three quarters (n=28) had sites on their premises for organic waste, either collected in a pile or a pit and in a few cases covered with a roof (Figure 15, pg. 49), the corresponding number for inorganic waste was 68 %. Burning was a common method of disposal. Off-site disposal of organic and inorganic waste was employed by 36 and 48 % of the households respectively; on the verge towards the river Saposoa a few more or less public but illegal dumps – barrancos – were seen. Many of the households had a bin for inorganic garbage outside their houses, but emptying was sporadic. In a majority of the households, garbage was observed all over the premises and 63 % recognized this as a problem (n=19). The problems mentioned in the interviews were related to rain, odor and insects, and many asked for a public site. Agriculture. The two most common cash-crops in the area were coffee and cacao, which 90 and 67 % of the families cultivated, respectively (n=29). Apart from this, common crops for household use included corn, rice, food bananas, beans, cassava and vegetables. According to one of the farmers in Nueva Vida (Villager 1, 2009), the average chacra size was about 3 ha, and the potential cacao bean production was 1000 kg/ha. Agricultural plots (chacras) were located outside of the village, at walking distances ranging from a quarter of an hour to three or four hours. Modes of transportation were walking and horse-back riding. More than half of the farmers (56 %) used organic fertilizers to some extent, such as manure, and 14 % of them used commercial products (n=27). More than three quarters (78 %) were positive about using fertilizers, but many added that they were only interested in organic such. Of those households that did not use fertilizer, the majority believed that it was not necessary. However, for example in the case of cacao, a comparison of the size and quality of 45 the crops (and the single beans) between plants cultivated with and without fertilizers, made it clear that the need for extra nutrients was great. The idea of using human feces as fertilizers was met with skepticisms (a third of the households definitely rejected the idea), but in discussion during a public meeting (2009-05-31), the idea of using urine, traditionally used for medical purposes, was welcomed. The long distances and limited capacities of the modes of transportation interfere with the possibilities of transporting sanitary end products from the house to the chacra, and thus restrain nutrient recycling in agriculture. Chickens were kept in 93 % of the households for eggs and meat, occasionally complemented with guinea pigs. Cats and dogs were common and horses existed in 23 % of the households, used in agriculture and for transportation. About a tenth of the households had a cow or a couple of pigs (13 and 10 % respectively). Animals mostly walked around freely, either in the home (in two thirds of the households) or on the chacra (one third), feeding on organic wastes and drinking from nearby creeks or provided water bowls. To keep the yard tidy, animal droppings were regularly picked up by 48 % of the households (n=25). 5.1.7 Uncertainties Much of the information compiled was collected through interviews and informal talk, and even though the interviewees were elected based on their professional function and level of involvement in the topic of the interview, precautions should be applied when analyzing the information. Written information and long-time data from this region is sparse, both concerning socio-economics and environment. During the working course, it became evident that the consensus between different information sources often was poor. Thus, as far as possible, the obtained information was controlled with one or more additional source, but the risk of some invalid or incorrect information remains. The temporal nature of some of the gathered information must also be taken into consideration. In the day time, many farmers (most notably the men), were away, working on the chacra. This likely affected the results of the interviews; selection was not entirely random and the interviewees were unproportionately represented by households and household members that were at home in daytime and during weekends, most notable women. However, the interview concerned topics that were often dealt with by women, such as household work and hygiene practices, and thus may have resulted in more accurate and detailed information when the interviewee was female. Many of the topics regarding health and hygiene practices were rather delicate, and the answers to some questions, such as those about water treatment, hand washing and cleaning frequencies, were suspected to give an improved picture of reality. This at least means that the interviewees knew that they ought to treat their drinking water, wash their hands and perform regular cleaning. 46 Figure 10 Parts of the water distribution system: point of capture (upper left) and the dam when emptied for cleaning (upper right), sand trap (lower left) and reservoir (lower right). Figure 11 Blackwater systems in Nueva Vida. Toilet at the health center (left), wastewater discharge by the health center (middle) and one of the two household installations in use at the time of the study (right). 47 Figure 12 Sources of drinking water for households on high elevations. Animals and solid waste disposal close to the stream used for drinking water collection (left). Rooftop rainwater harvesting in one of the households (middle) and the subsequent storage in plastic compartments (right). Figure 13 Common latrine superstructures and different types of user interfaces. 48 Figure 14 Standpipe used as shower (left) and for laundering (middle); unhygienic conditions resulting from the lack of stormwater management (right). Figure 15 Solid waste management: flooded unimproved facility (left) and improved facility with roof (middle); sign informing about the unenforced law against littering (right). 5.2 WATER QUALITY 5.2.1 Crude water Surface water and water distribution system. Results from the analysis of crude water are given in Table 10 and in Appendix II. In the distribution system, from the point of capture (CP) to the last household (H3), EC was relatively constant with a median of 51.2 mS/m which is well below the Peruvian drinking water MLC. The laboratory analysis resulted in relatively similar values for pH (median 7.6) and all but one sample had pH values within the range allowed by the Peruvian drinking water MLC. Turbidity peaked in the sand trap (ST) with a maximum value of 13.9 NTU (median 12.2 NTU), indicative of proper functioning. Thereafter, turbidity dropped in the reservoir (median 3.8 NTU) and rose slightly again in the end of the distribution net (median 4.0 NTU in H1, H2 and H3). The maximum value in the distribution net (6.8 NTU) was measured in H2, which also was the lowest point in the entire system and thus a more likely site for particle settling. Nine out of the total 23 samples exceeded the Peruvian drinking water MLC of 5 NTU. The sampling was carried out in the 49 end of the rainy season, and the turbidity of the water could thus have been higher than during drier parts of the year. However, the maximum levels of turbidity over the year are important in the choice of treatment technology. Bacteria levels, both total and fecal, were high in all samples from the distribution system (median 1970 and 620 CFU/100 ml respectively), highest at the point of capture (max total coliform of 6000 CFU/100 ml) and in the sand trap (max total coliform of 3800 CFU/100 ml), dropping along the system and rising again in the end of the distribution net, in a manner similar to that of turbidity (Figure 16). The initial drop could be explained by bacteria being associated with settling particles, whereas the final rise could be due to recontamination by dirty and/or leaking tubing and higher exposure because of longer retention times in the system. The last sampling day (b3), the dam at the point of capture was emptied for cleaning, and the CP sample was taken about 20 m upstream the point of capture, which is suspected to be cleaner than the actual point of capture. Turbidity and bacteria levels showed a weak positive correlation (Figure 17), the correlation coefficients were 0.64 for total coliform and 0.21 for fecal coliform, the former correlation being significant. This implies that turbidity could be an interesting dummy parameter for total coliform bacteria concentration in stream water, but not ideal for predicting the concentration of fecal bacteria. The stream flow (Appendix II) decreased between the two sampling events, reaching 107 L/s at the first measurement (a1) and 6.7 L/s at the last (b2). The decrease could be explained by the change from rainy season to dry. It was not possible to do any flow measurements on the last of the sampling days (b3) as the dam was emptied for cleaning. The flow at the outlet of the reservoir was measured three times (b1-b3) and the median flow was 5.7 L/s. Table 10 Median results from the analysis of crude water, including the distribution system (CP, ST, RE, H1, H2, H3), the open spring (OS, OD) and the rainwater harvesting site (RW) (abbreviations are explained in Section 4.1.3) Point n Total coliforms Fecal coliforms n Turbidity (CFU/100 ml) (CFU/100 ml) (NTU) CP 2 5250 2875 4 6.6 ST 1 3800 620 3 12.2 RE 2 1740 755 4 3.8 H1 2 1270 420 4 3.7 H2 2 1345 505 4 4.4 H3 2 2160 870 4 4.0 OS 2 35 0 4 0.7 OD 1 3400 230 1 0.5 RW 1 7500a, b 7500a, b 3 3.7 a) Uncountable number of bacteria, the samples are assigned a 25 % higher detected. b) Bacteria were atypical, i.e. not originating from an animal source. 50 pH 7.8 7.7 7.8 7.7 7.6 7.7 7.1 7.1 6.7 value than the EC (mS/m) 52.1 50.2 51.5 51.3 47.8 50.6 72.4 72.7 54.1 highest value Bacteria (CFU/100 ml) 6000 5000 4000 3000 Total coliforms 2000 Fecal coliforms 1000 0 Figure 16 Bacteria along the distribution system for the two sampling days, starting at the point of capture (CP) and ending at the most distant household (H3). 7000 Bacteria (CFU/100 ml) 6000 5000 4000 3000 Total coliforms 2000 Fecal coliforms 1000 0 0 2 4 6 8 10 12 14 Turbidity (NTU) Figure 17 Scatter plot of turbidity and bacteria concentration in the samples from the distribution system (stream water). With a confidence interval of 95 %, the Spearman’s rank coefficients are 0.64 and 0.21 for total and fecal coliform bacteria respectively. Springwater. In the springwater, turbidity reached a median of 0.7 NTU and a median EC of 72.4 mS/m at the point of emergence (OS), both parameters were below the Peruvian drinking water MLCs. In the first round (a), no bacteria at all were detected in the springwater. In the second round (b) there was a small contamination of total bacteria, resulting in the median of 35 CFU/100 ml, but still no fecal bacteria. Springwater EC was high compared to the stream water EC, indicative of that the water resides in mineral-rich ground, and the low levels of turbidity and bacteria could be explained by the absence of surface sources of pollution. Five meters away from the point of emergence, in the end of the distribution pipe (OD), the water was contaminated by both total and fecal bacteria (3400 and 230 CFU/100 ml respectively). The high contamination demonstrates how easily a safe source can be contaminated and stresses the need for proper protection. Turbidity and EC levels were similar to those measured in the OS samples. The median flow was 2.3 L/s (n=3) which corresponds to 8.3 m3/h or almost 200 m3/day, and given the low contamination levels, the spring is an interesting option for abstraction on a larger-scale. 51 Rainwater. In the collected rainwater, median pH was 6.7, turbidity 3.7 NTU, and EC 54.1 mS/m. The variations in the latter two parameters, in samples presumably coming from the same rain event, were high (min/max values were 2.7/6.1 NTU and 27.1/87.2 mS/m respectively) and make it difficult to draw any conclusions about the quality of the source. The large number of bacteria in the sample was atypical in that sense that the bacteria did not originate from an animal source, but rather from the surrounding environment. The rooftop (galvanized metal) used to collect water was very dirty, and so where the plastic jars were the water was stored by the household (Figure 12, pg. 48), providing an explanation of the poor quality. It would be interesting to analyze rainwater collected with a more secure method, but this was unfortunately not possible during the two sampling rounds due to the lack of rain events. 5.2.2 Treated water Household treatment (boiling). Results from the analysis of samples treated by the households are displayed in Table 11 and in Appendix II. Turbidity tended to increase following treatment; looking at the H samples, the median turbidity of the crude samples was 3.9 NTU, and 6.1 following treatment. The corresponding median EC was 50.7 mS/m before treatment and 28.7 after, indicating a decrease. Bacteria levels in the crude and treated samples are displayed in Figure 18. All the treated samples remained contaminated, in H2_b the amount of fecal bacteria doubled and several other samples (H3_a2, H1_b3 and H3_b3) contained elevated levels of atypical bacteria. Median bacteria levels dropped following household treatment (Figure 20, pg. 55), but this was due to the relatively high removal in the RW sample. Looking at only the H samples, the median concentration of total coliform bacteria increased from 1515 to 4070 CFU/100 ml following treatment. The fact that all households boiled their water, which should be sufficient to kill all bacteria if done properly, indicates that the observed contamination was due to recontamination. This is further strengthened by the increase in turbidity and the large number of atypical bacteria seen in some of the treated samples but in none of the crude. The method of filtering the boiled water with a cotton cloth (H1 samples), aiming to remove sooth particles and further improve the quality, appeared to have had the opposite effect, given the resulting high levels of both bacteria and turbidity. In the second sampling round, the same method managed to remove all fecal bacteria, but total bacteria and the increased turbidity still indicates substantial re-contamination. The better result of the RW sample could possibly be explained by the fact that the water was stored in the same (enclosed) kettle as it was boiled in. However, the same storage method was also employed by H3, the samples with the highest bacteria contamination. 52 Table 11 Median results from the samples treated by the households (boiling), including crude samples (abbreviations are explained in Section 4.1.3) Point n Total coliforms (CFU/100 ml) Fecal coliforms (CFU/100 ml) n Crude samples H1 2 1270 420 2 H2 2 1345 505 2 H3 2 2160 870 2 RW 1 7500a 7500a 1 Treated samples – households (boiling) H1 2 4070a 285 2 H2 2 270 185 2 H3 2 7500a 3770a 2 RW 1 74 10 1 a) Uncountable number of bacteria, the samples are assigned a detected. Turbidity (NTU) pH EC (mS/m) 3.9 3.2 3.9 2.7 7.8 7.7 7.8 6.5 45.6 48.7 50.8 87.2 13.9 7.5 7.5 8.3 3.7 7.9 3.7 7.0 25 % higher value than the 32.4 28.1 25.1 27.1 highest value 7000 Bacteria (CFU/100 ml) 6000 5000 4000 3000 Total coliforms 2000 Fecal coliforms 1000 0 Figure 18 Pairs of crude and household treated (boiled) water samples. The dark colored bars indicate the amount of total coliforms of which the fraction of fecal coliforms is shown in light color. SODIS treatment. Results from the analysis of water samples treated with the SODIS method are displayed in Table 12 and in Appendix II. Median EC in crude and treated samples was 51.2 mS/m. Median turbidity in the crude samples was 3.9 NTU, and in the treated 5.1 NTU. Bacteria levels in the crude and treated samples are displayed in Figure 19. When samples were not exposed to the strong sun at noon (a) all samples remained contaminated. However, the bacteria levels did decrease from a median of 1890 to 100 CFU/100 ml for total coliforms and from 850 to 72 CFU/100 ml for fecal coliforms. In the second sampling round (b), three out of four treated samples contained no bacteria at all, decreasing from a median of 1785 to 0 CFU/100 ml for total coliforms, and from 160 to 0 CFU/100 ml for fecal coliforms. The differences between the two sampling rounds are illustrative of the importance of length and timing of the solar exposure. Worth keeping in mind is that the treated samples were taken one day earlier than the crude samples that they are compared with; ideally microbiological analysis must be done within 24 h and due to the field conditions this could not be realized for the a1 and b2 samples. This resulted in that samples with different turbidity were compared. The largest difference was seen in the CP samples, where turbidity in the crude sample (CP_b3) was 53 7.7 NTU higher than in the SODIS-treated sample (CP_b2), which may imply that the removal was not as large as shown in Figure 19. However, the difference between the turbidity in crude and treated samples was not significant, and the median difference between crude and treated samples was 1.2 NTU higher turbidity in the treated samples. Table 12 Median results from the samples treated with SODIS, including crude samples (abbreviations are explained in Section 4.1.3) Point n Total coliforms (CFU/100 ml) Crude samples H1 2 1270 H2 2 1345 H3 2 2160 RW 1 7500a CP 1 4500 Treated samples – SODIS H1 2 30 H2 2 155 H3 2 10 RW 1 140 CP 1 0 a) Uncountable number of bacteria, detected. Fecal coliforms (CFU/100 ml) n Turbidity (NTU) pH EC (mS/m) 420 505 870 7500a 620 2 2 2 1 1 3.9 3.2 3.9 2.7 13.1 7.8 7.7 7.8 6.5 7.8 45.6 48.7 50.8 87.2 49.0 12 2 100 2 5 2 120 1 0 1 the samples are assigned a 2.8 7.7 5.8 7.6 4.7 7.7 6.1 6.7 5.4 7.8 25 % higher value than the 52.0 46.4 50.5 54.1 52.4 highest value 7000 Bacteria (CFU/100 ml) 6000 5000 4000 3000 Total coliforms 2000 Fecal coliforms 1000 0 Figure 19 Pairs of crude and SODIS treated water samples. The dark colored bars indicate the amount of total coliforms of which the fraction of fecal coliforms is shown in light color. a samples were exposed to 9 h of daylight, not including the strong sun at noon, whereas b samples were exposed for an entire day and night. Efficiency of household and SODIS treatment. Bacteria levels in crude and treated samples (households and SODIS) are depicted in a box plot diagram (Figure 20), which indicates that SODIS is the superior treatment method. Even though both treatment methods decreased median contamination levels, the 75 percentile of the household treated samples is large and contains the maximum sample value, whereas the same percentile for SODIS is small, and the 25 percentile contains zero contaminated samples. Household treatment did not result in a significant bacteria removal (p>0.05) whereas the SODIS method significantly decreased both total and fecal coliform levels. Comparing household treatment with SODIS treatment, the 54 8000 8000 7000 7000 6000 6000 Bacteria (CFU/100 ml) Bacteria (CFU/100 ml) latter was significantly better than the first in the removal of total coliforms, but no such difference was seen in the removal of fecal coliforms. 5000 4000 3000 5000 4000 3000 2000 2000 1000 1000 0 0 Crude Household (boiling) SODIS Crude Household (boiling) SODIS Figure 20 Box plots of the crude and treated water (boiled by the households and SODIS), total coliforms (left) and fecal coliforms (right). 5.2.3 Uncertainties The village of Nueva Vida is remotely located, difficult to reach due to poor road conditions and at the time of the study it still lacked electricity. This imposed some constraints to the study and some sources of errors to the water analysis. Samples were taken in the morning and stored in a cooling box, but ice could not be supplied until around noon the same day, when a nearby village with electricity was reached. Thus, there was a risk of bacterial growth in the samples. However, the un-contaminated springwater samples are indicative of adequate handling. The few samples taken (mainly two samples at each location) make it hard to draw general conclusions. The quality of water depends on, and varies with, a number of factors and complex processes, abiotic and biotic, anthropogenic and natural. Seasonal and daily fluctuations are likely and for reliable predictions, the water quality must be analyzed during a longer period of time, and affecting processes must be carefully studied in parallel. However, in this study the parameter of specific interest was the bacteriological load. Since water for drinking purposes must contain no bacteria at all, any level of bacteria is too high, allowing for less sensitivity. The high levels of bacteria seen in previous studies (Sandström (2008), Red Huallaga (2008), Nagel (2005)) support the results and indicate that the bacteriological contamination is prevalent, both in the surface water and in water treated by households. 5.3 SWOT-ANALYSIS In the following section, strengths, weaknesses, opportunities and threats for the provision of a suitable and sustainable WSS system are discussed. The analysis is based on the assessment findings and the outcome is used for guidance in Chapter 6. Strengths. The strength of Nueva Vida lies in its inhabitants, a young and enterprising population consisting of immigrants from less fertile lands, convicted to improve their life quality and possibilities through the hard work of agriculture. The population is relatively 55 small, making rapid changes more viable and effective, but yet large enough to benefit from large-scale solutions. There exists a tradition of solving problems locally, e.g., with the citizen army and the sewage system initiative, the former fostering community ownership and promoting responsibility, the latter an excellent example of the enterprising spirit. The community also has experience from WSS administration, operation and management with the existing water board and the responsibility of the current water distribution system, a suitable base to build on with the provision of additional and extended WSS services. Further, the cash-crop production in the area is a precursor to economical development in the community and has a large potential not only as a source of employment, but also for capital generation. From a technical point of view, an important strength in Nueva Vida is the warm and wet climate. Water availability is large throughout the year and the process of decomposition of organic matter is rapid, important for several sanitation technologies. The clay-rich soil may be used as an inexpensive building material. Weaknesses. Given the local suitability for agriculture, people do not have to starve in the village, but nevertheless, the poverty is loudly pronounced. Some families stated that they had zero income and in this case, any price is too high and if WSS improvements are not for free, they will not be an option. For larger infrastructural projects, capital is essential, and if people are struggling to put food on the table, they cannot save much for the future. Self-sufficiency of food is probably the most inexpensive for the individual, but for society it results in little economic activity and thus cash scarcity. Another weakness is that the governmental money comes not directly to the village itself, but is administrated and allocated by the municipality of Pasarraya, which must not necessarily have the same interests, needs and wants as Nueva Vida. Paradoxically, a weakness of Nueva Vida is its relatively high development – the existing water distribution system renders it better off than other communities in the area and thus not prioritized by the municipality. Further, the prevailing low level of education and the gender inequalities inhibit social development, which is, among many other things, essential for health and hygiene awareness. The technical challenges include the high precipitation during the rainy season, destroying roads and interfering with sanitation management, making the community inaccessible and unhygienic. Rain also floods the river delta, making the surrounding area uncertain for construction, and increases water turbidity, resulting in higher treatment requirements. The clay soils have little permeability which severs the runoff problem. On the other hand, during the drier summer, water is scarce on some of the agricultural land. The locally available sand is too coarse for cement production. Opportunities. The institutional and non-governmental organizations in the area could provide information and education about hygiene and hygienic sanitation practices as well as advises on how to treat the water properly. The local organizations, such as the churches, Vaso de Leche and Club de Madres, could be suitable forums for promoting WSS awareness. The farmers could themselves finance small-scale WSS solutions by taking on loans with Acopagro, and given the loan terms of Acopagro, they are also fostered into economical planning and financial awareness. External funding could possibly by applied for from PRONASAR when they start up in San Martín. High precipitation open up for successful rainwater harvesting, which could be an option for the households currently out of reach of the distribution system. Low organic content and little nutrients in the soils have the potential to make excreta and organic waste recycling in agriculture an attractive choice. The application of urine is further supported by the local habit of using urine as medicine. 56 Threats. One problem experienced in the community was that although people appeared to know that water and sanitation was important, they did not recognize the need to change their practices. Or to state it differently: people were aware of the need for change but fore some reason change was not happening. Some families viewed diarrhea and parasites as inevitable and thus accepted that their children were sick, underweight and stunted. This is a very serious threat because if problems are not perceived as problems, they will forego solutions. WSS issues are traditionally managed by women, whereas money tends to be managed by men, and this mismatch may result in little availability of financial resources for WSS. Further, a water-borne sewage system is perceived as the most developed method for excreta management; if in the same time, people prefer this method but it turns out to be unsuitable, the risk is that disappointment and rejection of all other technologies arise. Technical threats include the inability to protect the existing water sources sufficiently. If the land is deforested, agriculture extended and cattle allowed to graze in the surroundings of the Yacusicillo River, the contamination of the water (in the distribution system) can be expected to increase. The same is true for the open spring in the village. A strong opposition against the use of human feces as fertilizer may result in the rejection of ecological sanitation. 5.4 SUMMARY OF FINDINGS AND IDENTIFIED CHALLENGES In the following section, the WSS situation in Nueva Vida is summarized and the most urgent WSS challenges to target are identified. The identification is based on the assessment findings and the outcome is used for guidance in Chapter 6. Stakeholders. The concerned stakeholders are primarily all people living in the village of Nueva Vida, including the staff at the health center, kindergarten and school; the local alcalde and the citizen army; the social organizations and the faith communities. Institutional stakeholders are the municipal government of Pasarraya, the district and provincial governments located in Saposoa, and on a regional and national level, the governmental bodies responsible for health and development, such as MINSA, DIRES and DIGESA. Additionally, external social organizations such as MCS, Caritas and Acopagro all have rolls to play in the planning and provision of WSS in Nueva Vida. Water supply. In regards of quantities, the existing water supply in Nueva Vida was sufficient, but the quality of the distributed water was poor; high microbiological contamination was observed throughout the distribution system. Further, the necessary treatment was not accomplished in the households, even the families that did treat the water failed to make it safe, partly due to the unsuitable storage of the treated water. Households on an elevation higher than the reservoir could not connect to the distribution system due to insufficient head. The open spring employed by a few households turned out to be an interesting option due to the high-quality water. The identified challenges are how to (a) protect the stream water from further contamination and (b) exploit the open spring safely and sustainable; how and where to (c) treat the water and (d) safely store it in the home; and (e), how the unserved households could be provided for. Sanitation: Excreta and blackwater. The existing excreta and blackwater situation in Nueva Vida was characterized by discrepancies; while the grand majority still struggled with unimproved sanitation solutions, some households had moved on, or were on the verge of doing so, to more advanced water-borne sewage systems. Thus, the search of suitable technologies both had to include finding simple methods of improving the excreta management, and also finding ways of facilitating the introduction of a blackwater system and safely manage the produced blackwater. 57 The traditional pit latrine, seen in the great majority of the households in the village, did not ensure a hygienic separation of human excreta from human contact. A poor base structure made it possible for the rain to enter the pit, mix with its content and also leave the pit. Poor flooring together with improper location of the latrine exposed the user to the contents of the pit. Rain entering the pit also decreased the lifetime of the latrine, and since full latrines were covered with soil and abandoned followed by the excavation of new pits, this speeded up land exploitation. The single most important intervention would thus be to make the pit impenetrable (a). Further identified problems include (b) odor and insects; little commodity due to (c) the location of the latrine and (d) the lack of a suitable user interface; and (e) poor hygiene practices. The existing sewage system, or in fact, the numbers of individual sewage systems in Nueva Vida, consisted of WCs connected to simplified sewer systems, from where the sewage was released into either an enclosed sewer tank or directly into a water body. The identified most important questions to answer are how to (a) improve and enlarge the sewer system (to accommodate for more users in the future); (b) properly treat and dispose the sewage; and (c) centralize the management to enable (a) and (b). Sanitation: Greywater and stormwater. During the rainy season, stormwater runoff occurred on a daily basis in Nueva Vida. Many households had constructed drains to divert the runoff away from their premises, but the drains were often too shallow and their coverage too small, resulting in water pools and mud around the house. Greywater disposal was not managed, and at the best, water was diverted into the same drains as the stormwater. Critical interventions (for stormwater as well as greywater) include the enlargement of the draining system on both (a) a household and (b) a community level. The need for treatment must also be evaluated (c). Sanitation: Solid waste. Organized solid waste management did not exist in Nueva Vida, and the general waste situation was poor; garbage was lying around on both the private yards and in public spaces. Even though forbidden, several dumps were seen on the river side. Some households reported that they composted their organic waste, but yet many failed to identify what was organic and what was not. The identified problems include (a) poor hygiene practices and awareness and (b) lack of knowledge of the different types of material and their proper disposal, as well as the lack of (c) central collection and (d) treatment and disposal. 58 6 SCREENING FOR TECHNICAL OPTIONS – RESULTS AND DISCUSSION This chapter composes stage four in the planning support and includes the steps of identification (4.1) and evaluation (4.2-4.4). Based on the findings in the previous chapter, each subsection is divided into categories of the identified challenges, under which selected technical options are reviewed and evaluated according to defined sustainability criteria (refer to pg. 4). The options are summarized in Tables 13 to 16 (pg. 82) in the end of the chapter and their suitability is discussed in each subsection, together with feasible service combinations. 6.1 DESIGN DIMENSIONS All the dimensioning and cost calculations done in the following chapter are rough estimation, done to be able to compare different alternatives and not for direct implementation. Not all options are evaluated with the same level of detail and in some cases, only one option is identified as interesting, ruling out comparison. There were no estimations on per capita water usage in Nueva Vida, but in Tarapoto, the largest city in San Martín, this consumption amounted 250 L/person/day, including flush-anddischarge usage and large system losses. To be conservative, an estimation of 200 L/person/day is done for Nueva Vida. Worth keeping in mind is that this number is very high (to compare with other countries, see Table 6, pg. 23), but due to the relatively high water availability in Nueva Vida, incentives for water-saving measurements are few. The drinking water requirement per capita and day is assumed to be two liters. Solid waste generation is set equal to the national mean of 1.08 kg/person/day (Table 7, pg. 25). To accommodate for population growth, calculations are done on a population size of 1500 persons, allowing for a 4 % growth in the following decade8. For cost estimations, unless else stated, the number of households in use is 120, corresponding to the number of households that, at the time of the study, was paying for water from the distribution net. The prices in use are based on actual prices in the region in the beginning of 2009; these are due to change with time, but the figures can be used for comparison between different alternatives. The most common building material is cement, or rather the mix of cement and sand (1:3 volumetric ratio), both can be imported from Saposoa and the latter free of cost. With cement vending at 0.54 PEN/kg and a transportation cost of 0.1 PEN/kg (Villager 1, 2009), the total cost of one cubic meter construction mix is 382 PEN (including the cost of transporting sand). The requirements and costs of professional labor are uncertain; manual work is traditionally supplied for free by the community. Due to the named difficulties, in some cases only material costs are estimated. 6.2 WATER SUPPLY The identified and targeted issues concern protection of stream water, safe abstraction and protection of the open spring, centralized treatment methods, household treatment methods and storage and water supply for households situated on high elevations. 6.2.1 Protection of stream water At places where laws and regulations, or the enforcement of laws and regulations, are relaxed, the community itself must establish and arrange appropriate management strategies. In the case of Nueva Vida, hazardous activities such as slash-and-burn agriculture are forbidden close to streams, but there is little control in place and at the time of the study, the named practice was seen a few meters downstream the water intake. In the latest annual inspection, 8 To compare with the 2009 national population growth in Peru of 1.2 %. 59 the system was criticized for the lack of protection of the stream, point of capture and reservoir (pg. 42). A basic protection of these components could be inexpensively constructed in the form of a wooden fence, preventing both humans and animals from polluting the water. However, the most suitable would be if the village itself could have a meeting to define and discuss the existing problems concerning water, and come up with solutions on how to best manage them. The results from the meeting could be summarized in a water safety plan for the village. A participatory approach would be necessary, not only to foster an ownership and sense of responsibility, but also to stimulate a public disapproval of detrimental activities, e.g., condemnation of someone who threatens the quality of water and thus the health of the entire village. 6.2.2 Safe abstraction and protection of the open spring The water analysis revealed that the springwater, at the time of the study only used by a few households, was free from contamination. Ideally, this clean water would be directed into the distribution net and the contaminated stream water could be entirely abandoned and safe water would be delivered to the households. However, the amount of water available (about 200 m3/day) will not be sufficient to cover the total water demand for the entire village, and stream water would have to be used as a complement. To maintain the quality of the springwater, a separated distribution network must be installed, which is unviable. Further, in the water analysis there were signs of water being contaminated in the distribution net, and it would probably be unwise to believe that the once clean springwater would still be clean when arriving at the households. A more suitable option would be to secure the water quality by protecting the source, collect the water on a medium scale and promote it as safe drinking water, which could be manually delivered or picked-up by all households in the village. The quantity of water would be sufficient to supply the whole village with drinking water, and for many households it would probably be a lot easier and time saving to walk to the spring to pick up drinking water than to treat the tap water. To minimize the risk of contamination during pickup, collection could be done in clear plastic bottles and the bottles could be stored on the roof (see SODIS method below). Technology. A common method for springwater abstraction is the construction of a so called spring box, a collection chamber built at the eye of the spring, covered by impervious layers to protect the source. A spring box allows for water to be stored for some time, which is beneficial when the flow is low or the water is turbid. If flow and turbidity are not a problem, springwater can be protected and collected with less expensive simpler designs. The water analysis revealed low levels of turbidity in the end of the rainy season and the flow to be sufficient to not necessitate a storage tank. The latter should be controlled in the driest season, but the families already using the springwater reported a similar flow over the year. A simplified spring box, as proposed by Skinner & Shaw (1999), consists of a pipe (sized 30-50 mm in diameter) or a stone-filled trench for water conveyance, and a cemented headwall from where abstraction is done (Figure 21). The spring eye is covered by a 10 cm layer of clean stones (diameter 10-40 mm), a layer of rocks and a 10 cm layer of puddled clay, where the purpose of the stone layer is to enable water to flow freely into the conveyance pipe/trench and the clay to protect from surface water infiltration. After the clay, the trench is backfilled with sand and soil and a final layer of topsoil. The headwall is located at a suitable distance from the eye and complemented with an abstraction pipe and an apron slab for convenient withdrawal. The surrounding area, most notable the upstream area, must be protected with a fence to keep people and animals away and a ditch to divert runoff water (Figure 21). If the source is incorporated into the communal water distribution system, the tasks of the current caretaker could be extended to also include the operation and maintenance 60 of this part. If the system is kept among the households currently using the system, some type of protection still ought to be constructed, and maintenance performed by themselves. Economy. Financially, it would be a lot easier to realize a safe abstraction of the source if it was communal and a small charge could be imposed on usage to recover the operation and maintenance costs. The estimated cost of construction is 190 PEN9, and the community could finance this on its own by collecting a one-time fee of 2 PEN from the future users. Environment. If not done with care, the construction work may affect the quality of the water. Currently, the springwater is directly released into a passing-by creek, but given the relatively small contribution of water from the spring to the creek, the capture is not likely to result in any impacts on the creek ecosystem. Health, institutional and socio-cultural aspects. If done with care, the abstraction of the springwater would provide the village with a safe source of drinking water, not needing any further treatment. However, during transportation and storage, the risk of contamination is substantial, and thus the marketing of the water as “safe” may be misleading. Another issue is the property rights of the land; the families already using the water might be concerned about the abstraction, especially if fees are imposed on a good that they currently pay nothing for. Figure 21 Sketch of a simplified spring box: the illustration to the left is a cross-section and the one to the right is from above, where the spring is surrounded by a fence and a ditch. Illustration Maria Persson 6.2.3 Centralized treatment methods Slow sand filter The slow sand filter (SSF) has been recognized for its suitability in a low- and middleincome-country context, due to its relatively low operation and maintenance requirements and because it does not require chemicals or electricity. SSF is also referred to as biological filtration: due to the slow filtration rate (0.1–0.4 m3/m2h (Huisman & Wood, 1974)), a biofilm is allowed to develop in the uppermost layer of the filter bed within a couple of days. This layer partakes in the treatment process by biologically degrading organic matter. Desired preconditions include low water turbidity, pre-treatment is necessary if turbidity exceeds 30 NTU (Brikké & Bredero, 2003), and low levels of contamination (Sánchez et al., 2006). Technology. Common components in an SSF are a (a) supernatant water reservoir to ensure a constant head onto the filter, (b) bed of filter medium (sand), (c) under-drainage system to direct the water into (d), the clean water reservoir (Figure 22). According to Huisman & Wood (1974), the height of the supernatant water should be 1-1.5 m to maintain a sufficient head and the height of the sand filter 1.4 m to allow for scrapings without material recycling in the first years10. A filter design dimensioned for Nueva Vida11 would require a 9 See Appendix III, Table 21 for calculations. This is essential for the ripening of the biofilm; once it is mature, a one meter filter layer is sufficient and scraped-off material can be recycled. 11 Total water demand of 12.5 m3/h and with the maximum recommended filtration rate of 0.4 m/h, see Appendix III, Table 23 for calculations. 10 61 total surface area of 70 m2 (two filter units, each capable of sustaining the population on its own). The design would be optimized with a filter box with the length 7 m and width 5 m, letting the two units share one length side. To accommodate for supernatant water, the filter and the under-drainage system, the height would be 3.4 m and the suggested wall thickness is 20 cm. Operation and maintenance include controlling the water flow (daily); open and close valves to prevent them from getting stuck (monthly); drain the filter, scrape off the top layer and clean the sand before returning it to the filter (annually); and on a regular basis screen the system and repair it when necessary (Brikké & Bredero, 2003). According to Brikké & Bredero (2003), SSF can be operated and monitored by the community if the caretaker is well-trained, whereas Sánchez et al. (2006) consider it important with a professional system operation and maintenance, due to the sensitivity of the biofilm. Construction would have to be done by professionals, but if money and time were invested in educating a local caretaker, the plant could probably be operated and monitored within the community with a similar administrative set-up as the current water distribution system, including regular check-ups from the authorities to ensure water quality and the health of the plant. Economy. A rough estimation of the construction costs shows that the design (2×35 m2) would cost about 41085 PEN (343 PEN/household)12. One alternative financing would be that each household took on a loan to cover their part, but it is highly improbable that all could afford (or even want) to do so. External funding is thus necessary and the next PRONASAR expansion could be a potential source. To increase the probability of receiving funding, the community could market itself as a pilot site for this, in the region relatively new technology. If the cost of making a perfil could be covered, funding could be applied for at OPI Huallaga in Saposoa. Environment. The construction of a SSF requires land (70 m2 for the suggested design), and at the time of the study, land was available above the reservoir (more than 2500 m2). During construction, large volumes of material and tools must be transported to the site, which requires both energy and proper roads. During operation and maintenance, environmental impacts are small as neither pumps nor chemicals are required. Health, institutional and socio-cultural aspects. With SSF, high bacteria removal can be expected (Brikké & Bredero, 2003), but a problem is the risk of re-contamination within the distribution system. The planning and provision of the system require the involvement of professionals and probably the local and provincial governments (due to the funding requirements). Concerning socio-cultural acceptance; due to its physical appearance, the ability of the biofilm to provide safe drinking water may be questioned, but if the technology and the plant is promoted as modern, it is likely to be accepted. Figure 22 Cross-section of a SSF, the reservoir is displayed to the right. Illustration Maria Persson 12 See Appendix III, Table 23 for calculations. 62 Centralized chlorination Technology. Diluted to the appropriate concentration, chlorine solution is continuously released from a separated compartment into the water inlet of the reservoir. Dosage is regulated by a special device, e.g., a floating bowl chlorinator Figure 23, to match the actual inflow of water (Brikké & Bredero, 2003). To control the process, i.e., ensuring that the residual chlorine is sufficient, there are simple test kits available. It is difficult to predict the actual chlorine demand beforehand – it is usually recalculated from the chlorine residual in the outgoing water – but in a study by LeChevallier et al. (1981), the relationship between turbidity and chlorine demand is examined for chlorine treated surface waters in Oregon, USA. The results show that surface water chlorine demand is positively correlated with turbidity, a relationship described in Equation 1: ሾܿℎ݈݀݊ܽ݉݁݀ ݁݊݅ݎ, ݉݃/݈ሿ = 0.040 + 0.086ሾݕݐܾ݅݀݅ݎݑݐ, ܷܰܶሿ Equation 1 In the water analysis, the relationship between turbidity and bacteria load (refer to Figure 17, pg. 51) indicated that turbidity was not ideal for estimating contamination. However, for total coliforms, the positive correlation was significant, and for practical reasons, the mentioned equation will be employed to estimate the chlorine demand in the Nueva Vida water. In the water analysis, the highest turbidity observed in the reservoir was 5.9 NTU, but for a conservative estimation, 10 NTU is used in the calculations, resulting in a chlorine demand of 0.9 mg Cl/L. With a desired residual of 0.6 mg Cl/L, the total demand works out to 1.5 mg Cl/L; this figure is assumed to cover the maximum demand during the rainy season, and in drier parts of the year, the demand is likely smaller and monitoring this would result in cost savings. Worth keeping in mind is that WHO does not recommend chlorination without pretreatment if water turbidity exceeds 5 NTU, but according to engineers at EMAPA Tarapoto, values up to 20 NTU are acceptable (Nuñes Perales, 2009). Operation and maintenance include controlling and adjusting the inflow of water, purchasing and preparing the chlorine solution and refilling the chlorinator. All parts of the system must be regularly cleaned, and if necessary, repaired. The chlorination could be administrated by the water board, and the responsibility of operation and maintenance would preferably fall on the current distribution system caretaker. Quality control could be done by the health center. Economy. The cost of the necessary equipment for chlorination of the piped system is about 250 PEN (Nuñes Perales, 2009), and the maximum monthly cost of chlorine (i.e., during the rainy season) is 169 PEN13. The installation must probably be supervised by a professional, who also instructs the caretaker. Equipment for controlling the residual amount of chlorine can be obtained for free from DIGESA in Tarapoto. With the currently 120 paying households, this works out to a one-time charge of 3.5 PEN/household and a monthly rise of 1.4 PEN. If the work of the caretaker increases, a pay rise would be appropriate, but by increasing the monthly fee to a total of 4.5 PEN this cost and more would likely be covered. This cost is below the median willingness to pay (5 PEN, refer to pg. 41) and the treatment could thus be financed by the community. Environment. Land and energy requirements are low, but there is a permanent need of chemicals (chlorine). Possible environmental impacts include contamination of flora and fauna by the chlorine product. Health, institutional and socio-cultural aspects. Undiluted chlorine is a hazardous substance and thus the product may become a risk to humans if not treated with care. The institutional acceptability of chlorine is high as it is considered to be a prime treatment method as well as a necessary step in safe drinking water production; the social acceptability 13 See Appendix III, Tables 24 and 25 for calculations. 63 is high for the same reasons. One drawback is the change in taste – the necessary chlorine residual is detectable. Figure 23 Cross-section of the floating bowl chlorinator with a tank size of about 100-200 L. The floating bowl is used to ensure a constant addition of chlorine solution, and it could be a plastic or light metal bowl, perforated in the bottom. The hole must accommodate for three plastic tubes; one for the string which attach the bowl to the tank; one to let water from the tank into the bowl; and one to deliver chlorine solution to the reservoir. The hole is sealed with a cork and the floating bowl is balanced with small pebbles. (Water for the World, www). Illustration Maria Persson 6.2.4 Household treatment methods and storage As long as no (semi-) centralized treatment of water is in place, drinking water must be treated in the household. Several methods for household water treatment exist, but some of the most common, also recommended by the MCS in Tarapoto (2008), are boiling, chlorination and SODIS. The effectiveness of chlorination and SODIS are limited by water turbidity and clarifying pre-treatment might thus be required. As identified in the water analysis, safe storage and handling after treatment are essential to obtain safe drinking water. Pre-treatment – Reducing turbidity The MCS program manual states that slightly turbid water can be treated by boiling or with an increased dosage of chlorine. Highly turbid water, defined as such that “appears like chocolate”, requires pre-treatment prior to any other treatment method than boiling (Younger & Peralta, 2008). Settling and decanting. Water is left in a container for about 24 h, resulting in particle settlement. The clear water is then decanted into a second container, leaving the turbiditycausing particles on the bottom of the first container (Figure 24). The required material includes the two containers. Turbidity and chlorine demand reductions have been proven in laboratory studies (USAID, 2008). Drawbacks include the length of time required. Filtration through a fine cloth. Water is poured from one container into another through one or many layers of cloth. The method is simple and the required material includes the two containers and the cloth. A major drawback is that laboratory studies have shown that even though turbidity is reduced, the chlorine demand is not (USAID, 2008). Sand filtration. Small-scale sand filtration is a fast and simple method of reducing not only turbidity, but also some bacteria. The filter is constructed with a 20 L bucket with an initial layer of gravel in the bottom and then a filling-up layer of sand (Figure 24). Water is poured from a container at the top, and recovered into a second container through a spigot on the bottom of the sand filter-bucket. This option requires a bit more material than the other two – including three containers, gravel, sand and a spigot – but the reduction of turbidity and chlorine demand is significant (USAID, 2008). Boiling Technology. Microorganisms are killed by boiling the water violently for a couple of minutes. The water can be stored in the same pot in which it was boiled or else directly transferred into a clean enclosed container to prevent re-contamination. Turbidity does not impact the efficiency of the treatment, but if the water is to be filtered, this must be done prior to 64 treatment (Brikké & Bredero, 2003). Operation and maintenance tasks include collecting fuel for the stove, boiling the water and cleaning the equipment in use on a daily basis. Economy. Material cost is small as the equipment is already present, the cost of fuel ranges from zero to a considerable part of household spending. In Nueva Vida, wood fuels are inexpensive. The treatment is financed by the household. Environment. Apart from the fuel, the use of natural resources is low. Burning emits GHGs and smoke. Health, institutional and socio-cultural aspects. The risk of re-contamination is high, and the air-emissions degrade the indoor environment and may result in respiratory problems. The method is commonly used and thus accepted by both individuals and institutions. Boiled water often has a smoky taste that may be rejected by some people. Household chlorination Technology. Water chlorination on household level consists of adding a certain amount of concentrated chlorine solution to the water, mix it and let it rest for at least half an hour for the solution to react. The MCS program manual suggests the following procedure: chlorine mixture is prepared by mixing one capsule of concentrated chlorine product with one liter of water and then, depending on the turbidity, 2-4 capsules of the chloride mixture are added to 20 L of water (Younger & Peralta, 2008). The required material includes a chlorine product (purchasable in bodegas in Nueva Vida), a 1 L bottle and a 20 L bucket, preferably with a lid. Maintenance is done by cleaning the equipment on a daily basis. Economy. The cost of this method, as proposed by the MCS manual, is about 0.2-0.4 PEN/m3 of water, depending on the turbidity of water. As only the water meant for drinking is treated, the cost is low and the treatment is financed by the household. Environment. See centralized chlorination, but impacts are likely lower, as smaller amounts of the chemical are used. Health, institutional and socio-cultural aspects. See centralized chlorination. SODIS Technology. Water is filled into transparent plastic bottles, placed in the sun and left there for a certain amount of time. SODIS efficiently decreases the bacteria load but does not improve the chemical or physical quality of the water, and to work efficiently, the turbidity of the water should be lower than 30 NTU (Sandec, 2009). The efficiency of the process can be improved by placing the bottles on a solar concentrating surface, such as an aluminum rooftop, or by painting the ground-facing side of the bottles black. In sunny weather (over 500 W/m2) it is sufficient with six hours of exposure, if it is cloudy two days are necessary and during prolonged periods of rain, other treatment methods should be employed (Sandec, 2009). The material required are plastic bottles and preferably a metal sheet to place the bottles on (Figure 24). Maintenance is limited to the regular cleaning of the bottles. Economy. The costs of the SODIS method are small, including the one-time cost of a sheet of aluminum (10 PEN) and the cost of plastic bottles (vending at 0.3 PEN/kg). The treatment is financed by the household. Environment. Negligible impacts. Health, institutional and socio-cultural aspects. Treatment bottles can be directly used to drink or serve the water, minimizing the risk of re-contamination during handling. SODIS is promoted in the region by the MCS program, and it is known and accepted by the health authorities. In Nueva Vida, few were aware of the method, but one family that used it reported that the taste of the water was a lot better compared to that of boiled water, which would facilitate method promotion. 65 Safe storage To safely store the water after treatment is of major importance to prevent re-contamination, and the compartment of choice should (a) be closable, (b) have a small opening that eliminates the possibility of entering contaminating material, such as cups and hands, (c) be equipped with a tap or a spigot for water withdrawal, and (d) be appropriate for the employed treatment method. Examples of suitable containers are jars with lids, plastic bottles, jerry cans and a bucket with lid and tap. Maintenance includes daily cleaning of the compartment with disinfectants. Costs range from almost nothing (with the plastic bottles), to about 12 PEN for a jerry can and up to 25 PEN for a 12 L bucket with lid and tap. Figure 24 Turbidity reduction on household level: settling and decanting (left) and sand filtration (middle). Water treatment with the SODIS method: plastic bottles on a metal roof (right). Illustration Maria Persson 6.2.5 Water supply for households situated on high elevations Surface water and water distribution system Households situated on a higher elevation than the reservoir could not be supplied with water from the distribution system due to lack of head. The majority of them collected water directly from passing-by creeks, or, in one identified case, by rooftop rainwater harvesting. As long as the distribution system remains unimproved, it is unnecessary to consider how to extend it to these households, as their current supplies are expected to have an equal quality. If a centralized water treatment would be realized, the question about an extension arises and the associated costs must be analyzed. The search for a safe water supply for these households is thus directed towards improving the existing supplies, such as protecting the streams and extending rainwater harvesting, and at the same time stress the necessity of household treatment. Each household would probably have to look for an individual solution and the question is how to support this. Stream protection is discussed above, and one option would be for each household to create their own water safety plan on how to minimize contamination of their water supply. Critical issues include the location of latrines and solid waste deposits, as well as the presence of animals. Rainwater harvesting Technology. Rainwater is collected on the rooftop and led to storage by gutters and pipes. The rooftop is preferably made of aluminum, the pipes could be of wood, galvanized iron or PVC, and the storage tank could be everything from a plastic jar to a large tank made of cement. The first 20 L of rain should be diverted before collection is started; this could be done manually or with a so-called foul-flush diverter, the latter is preferable but the device and its installation might have to be done by a craftsman. Water treatment is necessary in most cases. Maintenance includes cleaning the entire system on a regular basis, and checking for leaks and repairing them, which could be done by the household itself. The possible yield depends on the amount of precipitation and surface area for collection; in the driest month, July, a surface area of 0.85 m2/person would be required to obtain sufficient amounts of drinking 66 water14 whereas the same amount could be collected on less than 0.3 m2 during the rainy season. Economy. If the roof already exists, the costs of installing this system include the costs of the gutters and pipes, the diversion device and the storage. The cheapest option would be to use PVC pipes and store the water in plastic bottles. The collection is financed by the household. Environment. Rooftop rainwater harvesting claims little resources, be it land, water or energy, and the environmental impacts are likely to be negligible. Health, institutional and socio-cultural aspects. All water should be treated to ensure that no bacteria are present. Problems based on socio-cultural issues are unlikely. 6.2.6 Comparison of options and evaluation of feasible service combinations A summary of the evaluation of the different technical options is given in Table 13 (pg. 82), including the system complexity, on which level construction, operation and management and financing could be done, and the sustainability of the option (economical, environmental, socio-cultural, institutional and health). The development of a water safety plan could be an inexpensive method to protect a water body, but a successful implementation requires a strong socio-cultural and institutional support and the actual impact on environment and health is uncertain. To protect the open spring and increase the abstraction, a simplified spring box could be constructed relatively inexpensively, and for households nearby, collection of the uncontaminated water would be a good option to treating surface water. Property rights and level of organization are issues that must be considered. Both the water safety plan development and the construction of a spring box require some degree of expert supervision. When it comes to treatment methods, a central question is on which level it should be done. Given the prevailing health situation and the results from both the water quality analysis and the household interviews, it is apparent that not all households treat their water and that the ones that do so fail to do it safely, implying that there is much to gain on a centralized treatment. A slow sand filter requires large amounts of both external expertise and external funding, but it is a refined technique that produces high quality water if properly constructed and operated. If the community has a great interest in this type of technology, it could market itself as a suitable pilot site and improve it chances for external support. Critical issues with centralized chlorination are that chemicals must be imported and that the chemical requirements vary with water quality which thus should be controlled. However, the chemicals could be purchased relatively inexpensive (total cost recovery) and a default addition could be done to cover the chlorine demand of the maximum turbidity expected. All centralized solutions require some level of communal organization. The main pros with household treatment are that it does not require any centralized organization, technical options are inexpensive and only the fraction meant for human consumption is treated. Boiling is advantageous since its effectiveness does not depend on water turbidity and the method could thus be used throughout the year, also in the rainy season. However, boiling requires energy, and the cheapest (and most commonly employed) source of energy is wood fuel, which creates smoke that causes respiratory problems. The SODIS method is very effective in the drier seasons when solar radiation is high and water turbidity low; in the rainy seasons it must be complemented with pre-treatment of the water and/or longer exposure times. With chlorination, re-contamination is prevented through the chlorine residual in the water, but the method costs a bit more than the other two (the purchase of chlorine product) and has the same dependency on water turbidity as SODIS. The 14 Saposoa precipitation data (refer to Figure 4, pg. 34), not taking the required diversion of 20 L with every rainfall into account. 67 three described methods of turbidity reducing pre-treatment are similar in their performance; the drawback with settling and decanting is the time requirements; the sand filtration method is more complex and requires a bit more material; filtration through a fine cloth might be less effective in its removal than the other two. Storage is very important but as long as the compartment fulfills the criteria stated above, the specific design is trivial. SODIS is advantageous since the water is directly treated in a safe compartment and transfer to storage is unnecessary. For households situated on high elevations (and those that cannot afford a system connection), rainwater harvesting is an interesting option for drinking water. Rainwater is generally cleaner than surface water, and also abounds when the quality of surface water is the worst – during the rainy season. However, it is extremely important that households are informed about the need for a hygienic collection and subsequent treatment, requiring some degree of external expertise. Expertise is also necessary to assist the development of household level water safety plans. Water source protection of both the creek Yacusicillo and the spring is necessary regardless of the choice of subsequent treatment. If centralized water treatment is realized, household treatment will not be necessary, and a rationale for extending the system to include unreached households on high elevations arises. If no centralized solution is realized, household treatment is necessary and the techniques described above can be employed in parallel, if possible complemented with the collection of water from the open spring. Rainwater harvesting could be employed by people unserved by the distribution system, but also by the connected households as a complement during the rainy season when surface water is turbid. Creeks in the village will be continuously used by unserved household for times to come and source protection must thus be implemented regardless of other technological choices. 6. 3 SANITATION: EXCRETA AND BLACKWATER The identified and targeted issues concern improved latrines, hygiene practices, collection and conveyance of blackwater, centralized blackwater treatment methods and use and/or disposal of end products. 6.3.1 Improved latrines Improved traditional pit latrine and ventilated improved pit (VIP) latrine The improved latrine consists of the pit; a hygienic slab with a drop hole and a tight-fitting lid; a floor raised at least 0.15 m above the ground to prevent flooding; and a superstructure of optional material. In the compendium Toilets That Make Compost (2007), Morgan proposes how to make a slab and a supporting ring-beam out of concrete (pp. 9-22) and also how to make a simple toilet seat to improve comfort (pp. 39-43) (Figure 25). The soil in Nueva Vida contains a high percentage of clay and pits can thus be constructed without lining. The VIP latrine is complemented with a vent pipe; the lower end is connected to the pit and the upper end is covered with a fly screen (Figure 25). Wind passing by the top of the vent creates an air flow that drags out odor from the pit and causes fresh air to enter into the superstructure. Insects in the pit are attracted to the light in top of the vent but are trapped in the screen, and insects from outside, attracted by the odor, are prevented from entering. Above-ground latrine The latrine can be built in a number of manners, important is that the excreta-storing container is safely enclosed (preventing water from entering and pathogens from escaping) and yet easy to empty. A commonly seen container design is a concrete vault, emptied from the outside 68 (Figure 25); another alternative would be the use of a large plastic bucket, easy and inexpensive to install. Figure 25 Concrete slab, ring-beam and pedestal to ensure a hygienic separation of feces (left). VIP-latrine with a vent pipe to reduce problems with odor and flies (middle). Latrine where feces are collected and temporarily stored in a compartment above ground, when the compartment is full, filling is transferred to another site for treatment (right). Illustration Maria Persson Composting latrines The structure is the same as the improved traditional pit latrine. When the pit fills up, dry soil or plant material should preferably be applied after each use and some soil and wood ash should also be added once a day. Mixing the excreta with organic material speeds up the composting rate and improves the quality of the end product. Soil and ash application also dry out the pit, resulting in reduced problems with flies and odor. With the Arborloo, the pit it is covered with a thick layer of soil when it is full and a tree is planted on top of it (Figure 26). With the Fossa alterna, two pits (1.5 m deep) are used alternatively and when one is full (after about a year), it is left to compost while the other pit is used. When the second pit is full, the eco-humus in the first pit is hygienized and can be safely excavated, whereupon the pit is taken into use again (Figure 26). Figure 26 Composting latrines: Arborloo where a tree is planted on top of the full pit to recover the nutrients in the eco-humus (left) and Fossa alterna with two pits in alternate use, after hygienisation, the eco-humus is excavated and applied to agricultural land (right). Illustration Maria Persson Urine-diverting interfaces In a urine-diverting toilet, urine is diverted through a pipe, placed in the front of the pedestal, into an enclosed container, whereas feces fall into another compartment in the back, treated with soil or ash after every use. How to simply make a urine-diverting pedestal is described by Morgan (2007, pp. 47-53). Urinals and eco-lilies can be simply constructed with a jerry can and a plastic funnel (Figure 27). 69 Summary improved latrines Technology. The different designs described above can be combined in a number of ways, and each of the designs can be constructed in a complexity ranging from very simple, including only the basic components and a primitive superstructure, to very advanced, with bricked walls and porcelain pedestals. Construction can be done by the household itself, and operation consists of regular cleaning of the slab with water and disinfectant. Suitable cleansing material should be available in the latrine and the lid must be replaced after each use. Maintenance includes repairing the latrine when necessary and either digging new pits or emptying full pits/compartments. Economy. The costs of the different designs in their most basic appearance are fairly similar: the cost of one concrete slab and one ring beam is about 32 PEN, a ventilation pipe about 15 PEN. A jerry can to store the urine in costs 12 PEN and a 75 L bucket for the feces vends for about 55 PEN. The cost of the superstructure depends on the used material: 20 PEN for an aluminum roof whereas wood and plant material often can be found on the chacra. The construction of an own pedestal in concrete would cost about 30 PEN, a porcelain pedestal costs about 250 PEN. Environment. Except for the Fossa alterna and above-ground designs, the other latrines constantly require more land area. In the case of Arborloo, the land is somewhat recovered by plant cultivation. Water and energy usage is low during construction as well as operation and maintenance. Unlined pits may leak excessive amounts of nutrients and pathogens into the ground and nearby water bodies and appropriate sitting is thus of major importance. With the composting toilets, and especially the urine diversion, nutrients can be recycled in agriculture. Health, institutional and socio-cultural aspects. A properly designed, constructed, operated and maintained improved latrine does not pose any health risks. However, if the opposite is true, the latrine may result in pathogen exposure and vector proliferation; with the emptying of latrines, pathogen exposure is particularly high. Latrines are perceived as inferior to flush-and-discharge sanitation and improved technologies may thus be difficult to promote as they never will be more than a secondary choice. The much lower cost compared to flush toilets is at the same time a large advantage for the improved latrine. Many people in Nueva Vida were skeptic about excreta recycling in agriculture, which put the success of ecological sanitation at stake. The usage of urine in traditional medicine can however facilitate the promotion of urine recycling. Figure 27 Urine-diverting interfaces, enabling nutrient recovery from urine and reducing problems with odor and flies in the pit: an ecolily (left) and a urine-diverting pedestal (middle). Simple hand-washing devise (made out of a plastic bottle), hung close to the latrine and accompanied by a bar of soap, to improve hygiene practices (right). Illustration Maria Persson 6.3.2 Hygiene practices To ensure satisfactory results from WSS interventions, it is essential to also target hygiene practices; studies have shown that, e.g., diarrheal diseases can be reduced by 45 % with hygiene interventions alone (WHO, 2004b). Improved hygiene practices follow from behavior change, and even though this component of WSS intervention many times is the most inexpensive to implement, a successful result might be difficult to obtain. A central part of 70 hygiene practices is hand washing, and any sanitary facility ought to be complemented with a hand washing device and a soap. Very simple devices can be constructed out of a tin can or a plastic bottle, as proposed by Morgan (pp. 73-75). The bottom of the compartment of choice is pierced and the devise is hung up in a string close-by the facility, accompanied by a suspended bar of soap (Figure 27). 6.3.3 Collection and conveyance of blackwater Simplified Sewer Technology. Simplified sewers are a conveyance technology with basically the same features as conventional gravity sewers, but the pipes have smaller diameters (about 100 mm) and are laid on shallower depths (covers of 400 mm or less) at a smaller gradient, keeping the costs down and allowing for more flexibility (Mara et al., 2000). Inspection chambers are installed instead of expensive manholes and all households are connected through an interception tank, minimizing the amount of settleable solids and garbage in the sewers and grease is prevented from entering by traps in the households (Tilley et al., 2008). Important design dimensioning parameters involve population size and per capita blackwater production, legal norms, a number of factors concerning design flow, and the placement and minimum depth of the network (Mara et al., 2000). The system could be managed on a community level; a special board would preferably be responsible for administration and the employment and training of a system caretaker. The system caretaker would regularly control the inspection chambers, from where accumulated debris must be removed and sewer blockages can be managed. Household operation and maintenance tasks include looking after and emptying the interceptor tanks and the grease trap. System design and construction must be supervised by professionals, but the already existing sewer system implies that the manual work could be done by the community. Economy. In Saposoa, the cheapest plastic pipes (diameter 100 mm) vend at 5 PEN/m. Interception tanks can be constructed out of cement; a 0.5 m diameter such, height 0.75 m, would cost about 100 PEN. Each household could pay for their connection, including a “connection fee” to cover the cost of the main sewer. Environment. Land requirements are relatively high, the need for energy and chemicals small. Environmental concerns arise with system failures, such as leakage to groundwater and surface waters. Health, institutional and socio-cultural aspects. If properly designed, constructed and maintained, the sewer system safely conveys wastewater from the households to the point of treatment. The households are responsible for their part of the sewer system and must thus receive sufficient training. If the most suitable routing passes through private premises, issues of property rights and responsibilities may arise. Septic tanks Technology. The septic tank is employed for collection and primary treatment of blackwater. The tank is commonly located underground and it could be designed for single households as well as communities. Within the tank, which consists of two or more compartments, solids settle to the bottom where they are partially decomposed, whereas oils and grease float to the surface forming a scum (Tilley et al., 2008). The wastewater should be retained for a minimum of 24 h, ideally for a longer time, and the resulting effluent should be treated in a subsequent treatment step since pathogen removal is low (US EPA, 2000). Applying this technology as a pre-treatment step helps the subsequent treatment technology by reducing the loads of bacteria (1-log reduction), BOD (30-40 %) and TSS (up to 50 %) and by ensuring a constant wastewater flow (Tilley et al., 2008). The design and dimensioning of the tank 71 depends on the wastewater load (number of households, household size, per capita production and system losses) and its constituents, average annual temperature and pumping frequency. Operation and maintenance include regular control of the tank and the levels of sludge and scum, which must be removed when necessary, usually on an annual basis. To remove the sludge, a vacuum truck should ideally be used, but manual options exist (Tilley et al., 2008). A suggested design for a 10 household-tank would be 17.5 m3 (3.5×3.3×1.5 m), allowing for about a one week retention time15. Economy. The suggested design would cost about 200 PEN/household (including 260 PEN for additional material), but the larger the number of connected households, the smaller is the cost per household. Environment. If sewage treatment in the septic tank is not followed by additional treatment steps, but directly released into receiving waters, the environmental contamination is considerable. Bacteria, BOD and TSS in the effluent are reduced, but most of the nutrients remain (Tilley et al., 2008). High groundwater tables and frequent runoff might render the septic tank unsuitable as the risk of leakage increases. Health, institutional and socio-cultural aspects. Being underground, septic tanks minimize human exposure to pathogens and are usually a safe storage option. To ensure human health throughout the system, care must be taken to safely dispose of resulting effluent, sludge and scum. 6.3.4 Centralized blackwater treatment methods Waste stabilization ponds Waste stabilization ponds (WSP) are one of the most common and efficient methods for wastewater treatment in the world, and variations of the technology are used in San Martín. The following section is based on notes from Duncan Mara (2006). Technology. WSP are a system of three different types of ponds in series; an anaerobic pond, a facultative pond, and – depending on the required quality of the effluent – one or more maturation ponds. The main purpose of the anaerobic pond (2-4 m deep) is to reduce SS and BOD by decomposing organic molecules. The facultative pond (1-2 m deep) has components of both the anaerobic and the maturation ponds and aims to further reduce BOD levels; if the blackwater is pre-treated, the facultative pond can replace the anaerobic. The prime purpose of maturation ponds (0.5-1.5 m) is to remove pathogens. Bacteria-removing mechanisms in WSP include high temperatures and the high levels of dissolved oxygen and pH that result from algae activity. Helminthes eggs and protozoan cysts are large enough to sediment and UV radiation is likely to further reduce pathogen levels. Maturation ponds can be combined with fish and plant production and harvesting, resulting in effective removal of also nitrogen and phosphorus (Tilley et al., 2008). The ponds should be lined with impermeable material, such as clay or asphalt, and to protect from runoff and erosion, a wall should be constructed to surround the ponds. The suggested design for Nueva Vida16 is one facultative pond (12.5×8×1.5 m) with a retention time of four days, followed by two maturation ponds (15×7.5×1 m), each with a retention time of three days. The design requires a total of 326 m2 (0.43 m2/person) and the excavation of 376 m3 soil material and it results in 15 Only the blackwater fraction is diverted to the tank. Calculations are based on a household size of 5 persons (refer to pg. 37), with an estimated blackwater production of 50 L/day. Calculations are given in Appendix III, Tables 26 and 27. 16 Half of the future population is connected and per capita production of blackwater is estimated to be 50 L/day. The estimated BOD load of the raw blackwater is 100 g/m3 (Mara, 2006). The design temperature is 25.4 °C, the mean temperature during the coldest month and net evaporation is -2.5 mm/day. Calculations are given in Appendix III, Table 28. 72 about 80 % BOD removal and a 4-log reduction of fecal bacteria17. A possible placement would be on the riverbank southeast of the village. Operation and maintenance include general care of the facility, regular plant removal and desludging of the ponds (every 3-5 years for the facultative pond and every 10-20 year for the others) to ensure their effectiveness and reduce the risk of vector proliferation. The construction must be supervised by professionals, but administration, operation and maintenance could be done by trained locals. Economy. Construction costs include the cost of land, professional design and supervision, as well as the cost of excavating 376 m3 of soil material. See the discussion about external funding in the economy section under the SSF technology (pg. 62). Environment. BOD, SS and pathogen removal is high, and if the system is combined with fish and plant production and harvesting, nutrients are recycled and the effluent is low on eutrophying substances. Land requirements are high but energy and chemical usage low. Health, institutional and socio-cultural aspects. High pathogen removal ensures health qualifications, but the WSP area must not be easily accessible by the public to minimize exposure. The technology is known about in the area and should not be subject to any institutional complications, and the people living in areas serviced by WSP appeared to be proud of the system, implying socio-cultural acceptance. Figure 28 WSP with a facultative pond (depth 1.5 m) and two maturation ponds (depth 1 m), the latter complemented with aquaculture. Illustration Maria Persson Free-water surface constructed wetland Free-water surface constructed wetlands (FWS) are designed to resemble natural wetlands and carry out the associated decomposition processes, with the wastewater flowing above ground. Helpful in the following section was the US EPA manual Constructed Wetlands Treatment of Municipal Wastewaters (2000). Technology. The system consists of one or more treatment cells; the bottom is often lined with clay or other impervious material and covered with rocks, gravel and soil. The cells are divided into three zones; the first and third zones are fully vegetated and flooded to a depth of 0.1-0.8 m, the second zone consists primarily of open water to a depth of about 1.2 m. In the first zone, solid particles are removed by sedimentation (reducing BOD), and retention times over two days are considered unnecessary since the arising anaerobic conditions counteract further removal. In the second zone, natural re-aeration and photosynthesis supply the oxygen necessary for BOD removal and the oxidation of ammonia to nitrate. With retention times over two days, undesired algae blooms may occur and these should thus be avoided. In the third zone, denitrification continues, and both nitrogen and phosphorus can temporarily be taken up by the vegetation. Pathogens are reduced by natural decay and microbiological decomposition throughout the system, in the vegetated zones they adsorb to and sediment with solid particles, in open water zones die-off occurs due to UV radiation. FWS effectively 17 BOD removal according to Mara (2006), and to be able to compare WSP and FWS, the desired bacteria removal was set to 4-log (output value from FWS dimensioning, input value to WSP dimensioning). 73 reduce TSS levels, whereas the removal of nutrients, pathogens and other pollutants is only moderate, calling for low strength wastewater or pretreatment steps (Tilley et al., 2008); pretreatment options include septic tanks and/or facultative ponds. A FWS design for Nueva Vida18 could consist of two vegetated zones (each with an area of 359 m2, depth 0.6 m), separated by an open water zone (area 125 m2, depth 1.2 m), with a total retention time of 12 days, divided equally between the three zones. The design requires a total of 844 m2 (1.13 m2/person) and the excavation of 1010 m3 soil material, and results in about 80 % BOD removal and a 4-log reduction of fecal bacteria. A possible placement would be on the riverbank southeast of the village. Operation and maintenance include the removal of blocking objects, such as plant material or solid waste, and accumulated sludge, to prevent short-circuiting and occasionally cutting back vegetation (Tilley et al., 2008). Design and construction of FWS must be supervised by professionals, but administration, operation and maintenance can be done by locals. Economy. Construction costs include the cost of land, professional design and supervision, as well as the cost of excavating 1010 m3 of material. See the discussion about external funding in the economy section under the SSF technology (pg. 62). Environment. The FWS system has very high land requirements but can operate without energy and chemicals. To ensure sufficient BOD and nutrient removal it is often necessary with further treatment steps, before or after the FWS. The artificial wetland provides habitat for many species and increases diversity. Health, institutional and socio-cultural aspects. To ensure sufficient pathogen removal, complementary treatment steps might be necessary and the large water surfaces facilitate for vector proliferation. The system is generally accepted by the community due to its aesthetical appearance, but due to the contaminated effluent, public access must be restricted. Figure 29 Artificial wetland (FWS) with two vegetated zones (depth 0.8 m) and one open water zone (depth 1.2 m). Illustration Maria Persson 6.3.5 Use and/or disposal of end products The resulting products from the different sanitation systems that remain to take care of are excreta (pit latrines), urine (urine-diverting toilets), eco-humus/dry feces (urine-diverting toilets), raw sludge (septic tanks), treated sludge (WSP, FWS), and effluent (septic tanks, WSP, FWS). The different methods for end-use and/or disposal identified as interesting for Nueva Vida are nutrient/organic matter recycling in agriculture (excreta, urine, ecohumus/dry feces, treated sludge), nutrient recycling in ponds with fishes and plants (excreta, sludge, effluent), disposal into water bodies (effluent) and surface disposal (excreta, ecohumus/dry feces, raw sludge and treated sludge). 18 Half of the future population is connected and per capita production of blackwater is estimated to be 50 L/day. The estimated BOD load of the raw blackwater is 100 g/m3 (Mara, 2006) and the maximum surface loading rate of BOD is 6 g/m3/day (US EPA, 2000). The design temperature is 25.4 °C, the mean temperature during the coldest month and net evaporation is -2.5 mm/day. The porosity of the vegetated zones is 0.75 (US EPA, 2000). Calculations are given in Appendix III, Table 29. 74 Reuse in agriculture How to safely recycle waste products in agriculture is described in Chapter 3 (pg. 21). Of major importance is that the product has been left to hygienize prior to application, and the required time is often a function of the ambient temperature. Urine is commonly free of pathogens and directly ready to use. To ensure total bacterial die-off, eco-humus should be stored for minimum a year prior to application. Treated sludge may have to be additionally hygienized prior to application, depending on the efficiency of the sludge generating technology. Important to consider is how transportation to the many times distant agricultural plots should be done; especially for households without a horse, transportation of products to and from the chacra is a labor-intensive and time-consuming business. However, given that agricultural produce is transported away from the chacra, it must also be possible to bring things there. The potential yield of nutrients depends on the daily dietary intake of proteins. Nutritional data for Peru can be obtained from FAO and the amount of nutrients in urine and feces can be calculated from this data with a method proposed by Jönsson et al. (2004)19. Calculations show that the annual nutrient yield from the urine from one person is 2920 g nitrogen and 223 g phosphorus; the same numbers for feces are 402 and 112 g respectively. Reuse in aquaculture Fish production and harvesting can be done in a separate pond, by feeding the fishes with excreta, sludge and effluent, or incorporated into the WSP maturation ponds to further increase its removal efficiency. The treatment achieved by the fishes is limited, but by vending the harvest, operation and maintenance costs can be recovered (Tilley et al., 2008). Floating plants can also be cultivated and harvested in ponds; their hanging roots both take up nutrients and filter the water that passes by, resulting in efficient BOD and TSS removal. The technology can be employed either on its own or in combination with fish production. Disposal in water Water discharge is a common method of effluent disposal, in which nearby water bodies, such as streams, lakes and oceans, are used as a recipient. To ensure water quality and health of the receiving ecosystem, the effluent must be treated and the rate of discharge must not exceed the assimilation capacity of the recipient. The quality of effluent ought to be controlled on a regular basis and interventions done when any of the control parameters of concern is elevated, but this is unlikely to happen in a rural community. Arising concerns include the communities downstream the village of Nueva Vida. Disposal on land Surface disposal of wastes must be done if product recycling is not demanded or accepted. Excreta, eco-humus, raw and treated sludge (biosolids) are discharged into permanent landfills, which in the best case scenario are appropriately lined to minimize leakage and controlled to minimize public access and thus human exposure. Biosolids should not be disposed of together with the more noxious MSW. Summary use and/or disposal of end products Economy. From an economical point of view, waste recycling in agriculture or aquaculture is the soundest option, as it reduces both the costs of disposal and fertilizers/irrigation water. If laws and regulations are relaxed, water disposal is the cheapest option. The costs of landfills vary with land availability and how strict the regulations on landfills are. 19 Daily protein intake and the vegetal percentage of the daily protein intake, data from 2005 (FAO, 2008a) (FAO, 2008b). For calculations see Appendix III, Table 30. 75 Environment. From an environmental point of view, waste recycling is also the soundest option; land disposal requires large land areas and may leach to contaminate nearby water bodies and the groundwater, whereas wastes disposed of in water often accounts for a considerable degradation of the recipient. Health, institutional and socio-cultural aspects. Depending on the type and time of treatment, end products contain more or less pathogens; if recycling in agriculture or aquaculture is done according to guideline recommendations, health concerns are marginal. Land and water disposal tend to be associated with a lower level of hygienisation and if the disposal is uncontrolled, the risk of human exposure increases. Obtaining socio-cultural acceptance of human waste recycling in food production is a potential problem, as well as little institutional condemnation of water and land disposal. The promotion of waste recycling must be coupled with information about sustainable agricultural practices and crop yield maximization, for people to understand the economical benefits of using soil conditioners. 6.3.6 Comparison of options and evaluation of feasible service combinations A summary of the evaluation of the different technical options is given in Table 14 (pg. 82). In Nueva Vida, latrines will still be used by the majority of the households for many years to come, but as the economic situation improves, it is likely that more and more households want to install water-based facilities. Thus, the sanitary situation is dual; in one end, simple and inexpensive methods are required to improve latrines and extend the coverage of basic sanitation, whereas in the other end, blackwater collection, conveyance and treatment techniques are needed for the household starting to climb the sanitation ladder. When it comes to latrines, improvements can be done in steps, preferably starting with the construction of a slab and a ring beam to ensure excreta separation and minimize the problems related to flooding. To minimize odor and flies, the drop hole could be covered by a tight-fitting lid, a ventilation pipe could be installed and the operational process of the composting toilets could be employed. Given the nutrient yield from excreta and the need for nutrients in agriculture, recycling should be promoted; a fist step is the recycling of urine, which has a higher socio-cultural acceptance than feces. Urine separation could inexpensively be done with a urinal/eco-lily, but for higher commodity and social acceptance, a urinediverting pedestal could be constructed. To recycle the eco-humus/dried feces, the Arborloo might be a suitable first step, whereas the Fossa alterna and above-ground designs both save land and facilitate for nutrient recovery. To ensure the expected health effects from the latrine improvements, it is very important to also target hygiene behavior, e.g., with the installation and use of hand-washing devices. The cost of constructing an interceptor tank is about half of the cost of constructing a septic tank for 10 households. The latter is advantageous because a higher degree of pretreatment that can be obtained with it, unburdening subsequent treatment steps. The question about centralized collection and conveyance does not arise until a centralized secondary treatment step is in place. When it comes to blackwater treatment, WSP are advantageous due to their high removal of pathogens and organic matter, and because they are already known about in the region and thus socio-culturally and institutionally accepted. Wetland cells would be interesting as they are more easily integrated in the landscape, but for optimal efficiency (in terms of contamination removal) they would probably require more external expertise than the WSP. FWS requires almost three times as much land as WSP for the same BOD and bacteria removal. All centralized options require centralized organization and administration, and even though the excavation work, at least partly, could be done by the community, external funding is likely necessary to cover the cost of land (see discussion about external funding on pg. 67). Both WSP and wetland cells could be complemented with aquaculture. It is probably difficult to establish incentives for effluent recycling, due to the generally long 76 distances to the chacras and the relatively good water availability in the area. Disposal in the Saposoa River might be inevitable and efforts must be made to maximize effluent treatment. Latrines and water-borne solutions can and will coexist. All latrine designs can be used in parallel, which also is the case for end product use/disposal techniques. A choice must be done on which method to employ for centralized blackwater treatment, and based on this choice, suitable methods for collection and conveyance can be determined, as well as the best option for end products. Private interceptor tanks can be upgraded to communal septic tanks. 6.4 SANITATION: GREYWATER AND STORMWATER The identified and targeted issues concern preventive measurements, collection and conveyance on a household and centralized level and treatment, use and/or disposal of end products. 6.4.1 Preventive measurements To reduce the risk of chemical contamination, an agreement could be reached with the local shop owners to remove the most detrimental chemicals from their assortment. Given the lack of incentive mechanisms (such as costs based on consumption and water scarcity), greywater reduction is likely to be hard to promote and obtain. 6.4.2 Collection and conveyance Greywater and stormwater management on a household level plays an essential role for preventing the leakage and, most notably, the spread of pathogens in the home. A simple measure would be to construct a net of open drains on the premises, with a sufficient coverage and depth, to collect stormwater, surplus water from the standpipe and wastewater from the kitchen. Around the standpipe, used both for cloth-washing and showering, better drainage could be obtained by for example excavating the soil and filling up the trench with gravel. To further improve commodity, the trench could be covered by large flat stones or a perforated cement slab. To upgrade the system, the open drains could be converted to closed such through the use of PVC pipes; this would minimize exposure to potentially contaminated water, but also lower water reduction by evaporation and natural treatment processes. A public network should be set up to transport wastewater away from households, ensuring that water from one yard does not simply end up on the next one downstream. Given the relatively low level of pollution, an open drainage system with unlined bottom would be suitable; being open, the water is subjected to natural treatment processes and evaporation, and being unlined, infiltration can proceed throughout the length of the drain, resulting in a higher quality and lower quantity of the wastewater. Care must be taken to ensure that the slope of the channel as well as its breadth and depth is sufficient, and the layout should facilitate for the connection of household drains. For more advanced systems, it is necessary with professional design and supervision, but a simpler system could very well be constructed, operated and maintained by the community. Operation and maintenance include the removal of large objects or accumulated soil material from the drains. It is also important to ensure that people do not use the system for other purposes, such as blackwater and solid waste disposal, which would both clog the system and increase the level of contamination and thus the health risks. Economy. The costs of constructing a drain network on both a household and a community level can be limited to the costs of labor, which can be provided by the community. Environment. Land is required for the construction of a drainage system, but no energy or chemicals. If sanitation is poor and/or chemical use increases, the risk of pollution of the 77 receiving water arises. If the production of kitchen greywater increases, elevated BOD and nutrient levels are probable. Health, institutional and socio-cultural aspects. Health concerns arise if excreta management is poor and pathogens mix into the greywater and stormwater, exposed in the open drains, especially if blackwater streams are directed into the network. The disposal of solid waste into the drains must also be avoided. If the most suitable routing passes through private premises, issues of property rights and responsibilities may arise. 6.4.3 Treatment, use and/or disposal of end products Given the rural setting and the limited industrial activities in the village, chemical contamination of stormwater is relatively small, and if the excreta management is improved, pathogen leakage to stormwater will be reduced. Thus, the need for stormwater treatment is considered sufficiently small to safely neglect. The same conclusion is drawn in the case of greywater; contamination is likely to be higher than in stormwater, but the number of chemicals in use is still small, the kitchen load is marginal and pollution from cloth-washing and showers is diluted due to the high water availability. The most viable option for disposal is discharge into Saposoa River. 6.4.4 Comparison of options and evaluation of feasible service combinations A summary of the evaluation of the different technical options is given in Table 15 (pg. 83). All techniques described above are recommended to use in parallel; the removal of detrimental products from the stores and the construction of open drains in the households and on a communal level. The construction of open drains can be done inexpensively and the operation and management requirements of the communal system could be coordinated with other centralized sanitation measurements. 6.5 SANITATION: SOLID WASTE The identified and targeted issues concern education and behavior change, collection and conveyance and treatment, use and/or disposal of end products. Based on the Peruvian mean waste production of 1.08 kg/person/day, the total amount of solid waste generated in Nueva Vida in one year is nearly 600 metric tons. Given the rural setting, 80 % is estimated to be organic, resulting in 480 metric tons organic and 120 metric tons inorganic solid waste. 6.5.1 Education and behavior change A large part of the work with improving the solid waste situation in Nueva Vida lies in the change of habits: if people refrained from dropping garbage all over their premises and in public areas, and instead collected it at one place, much would be gained. Many households had defined special places for collection, but failed to use them consistently and in addition did not recognize this failure, stressing the need for education and training. 6.5.2 Collection and conveyance Two possible options for collection and conveyance were identified, requiring no professional involvement but an administrative organization to coordinate workers, plan routes and collect user fees. The first option is small-scale curbside collection by one or two collectors and a horse. The small volumes that could be transported in this manner require daily collection. The community could either pay one or more persons to do this, or share the work between all system users. The second option is a communal collection system where households bring their waste to a communal point of collection, which may either be the point of disposal or a 78 transfer station. In the latter case, it is necessary with a collection crew (same set-up as in the first option). The usage of transfer stations also allows for more than one station, facilitating for the households. Under this scheme, the households themselves, and the generated amounts of waste, set the frequency of collection/transfer. If the communal collection point is a transfer station, the frequency of central collection must be adapted to the frequency of household transfer. The central collection could be done by an employed team or shared by the community. If all waste is to be collected, assuming that the maximum load of a horse is 100 kg, 17 rounds to the site of disposal must be done every day; if only the inorganic fraction is collected, it is sufficient with 4 rounds, but this would require that the organic fraction is managed in the households. Economy. Drawing from experiences in the close-by village of Pasarraya, the costs of the first option, including an employed collection team, are probably too high to be covered only by user fees. The minimum salary in Peru is 15 PEN/day, and with one collector and 120 paying households this works out to a monthly fee of almost 4 PEN/household20, which is twice the cost of water; the willingness to pay that much for something that otherwise is free is likely not sufficient. With the second option, less time would be required for central collection and transfer, and if people have to bring the waste to the point of disposal or a transfer station themselves, the generated amount is likely to be smaller and there are incentives for on-site composting. Thus the costs of employing someone would be lower and a monthly fee of 1 PEN/household could be viable. Environment. The environmental impacts of collecting and conveying MSW include the wear of the public roads and potential waste dropping along the way from point of collection to point of disposal. For the environmental concerns associated with transfer stations, see the section about landfills. With collection, solid waste is prevented from ending up in the surrounding environment, a large step towards a cleaner and more hygienic community. Health, institutional and socio-cultural aspects. During collection and conveyance, someone must manually handle the waste, be it the hired caretaker or the family itself, and this imposes health risks. Due to the convenience, curbside collection would probably be more readily accepted by the community, apart from its cost component. If communal collection points are far away, and associated with a cost (however small), the risk of continued illegal dumping is substantial, especially with relaxed law enforcement. 6.5.3 Treatment, use and/or disposal of end products Composting Given that almost the entire population is occupied with agriculture and that tropical soils are inherently low in organic matter, the most obvious solution for organic solid waste management is composting and subsequent recycling of the compost product in the field. With a mean household size of five persons, the yearly household production of organic waste is about 1.58 metric tons, or21 3.15 m3. Technology. To obtain a hygienic storage and efficient treatment, the composting area should be fenced – and the fencing preferably complemented with a low clay wall to prevent water from entering and effluent from escaping – and covered by a roof to protect from the rain. Operation and maintenance include grinding and shredding large materials with a shovel, turning the pile and transferring the product to agricultural land. To optimize the composting process, the substrate carbon-nitrogen ratio and the moisture content must be controlled and adjusted if necessary, e.g., by adding nitrogen rich material (green plants or manure) or dry 20 However, if the cost is shared by the estimated 600 households that compose the future population (five persons/household), the cost would be only 1.5 PEN. 21 With an estimated density of organic waste of 0.5 metric tons/m3. 79 material to soak up excessive water. Two composting piles would enable alternating use and maximize composting efficiency. The different methods for composting include rapid and slow such. The former requires only 2-3 weeks treatment, but is work-intensive and the piles must be turned on a daily basis (Raabe, 2008). The required land area for one pile, with retention time one month and height 0.5 m, is 0.6 m2. With the slower method, piles are turned two to four times a month, but it takes longer time for the treatment to be finalized and more land is thus required. The required land area for one pile, with retention time six months and height 1.0 m, is 1.6 m2. Management could be done on a household or a community level. The latter is advantageous since it only requires that the caretaker is familiar to the composting process, but the drawbacks include the need for collection and conveyance and the necessity of financial transfers and marketing of the end product. On a household scale, the waste could be treated and reused directly, without the need of paying for the waste disposal service or the fertilizing/soil improving product. Economy. If managed on a household level, the financial costs are minimized. The construction of the composting site can be done with local material, such as clay for the wall, and sticks and plant material for the roof. Environment. The land requirements are modest on a household level and no energy or chemicals are required. There risk of nutrient leakage and gas emission (ammonia) is potential but could be minimized by proper management. Nutrients are recycled in agriculture. Health, institutional and socio-cultural aspects. Composts can attract rodent vectors and create odor if not properly managed. Essential for a successful composting scheme is the demand for the compost product; in the case of Nueva Vida this was not implicitly expressed and many did not recognize the need for fertilizers/organic matter in agriculture. The promotion and training on composting must thus be accompanied by information about sustainable agricultural practices and crop yield maximization (including demonstrations), for people to understand the economical benefits of using soil conditioners. Landfills Given the high land availability and the local customs, landfill is probably the most suitable option for non-organic solid waste management in Nueva Vida. The landfill should be sited outside the village, far enough to enable increased settlement but close enough for manual conveyance to be viable. The cost of constructing, administrating, operating and managing a sanitary landfill is high, and even though the ambition should be to get the landfill as sanitary as possible, it is unlikely that a safe and sustainable facility will be realized, e.g., concerning leakage control of fluids and gases. Technology. A cell for waste disposal is manually excavated and lined with clay to minimize leakage. While filling up, the cell should be protected with a roof and surrounded by a lower clay wall and a draining trench, to prevent water from entering the cell and thus maximizing its lifetime. When full, the roof is removed and the cell is covered by a layer of clay followed by a layer of soil to be vegetated. A new cell is excavated close by and the procedure is repeated. In this manner, infrastructure cost (i.e., the cost of the roof), as well as the exposed surface area, is kept at a minimum, and the heavy excavation work is spread out over time. To restrict public access, the area should be fenced. The appropriate level for this kind of SWM is communal, and administration could preferably be done by a specific board, responsible for collecting fees, employing and supervising caretakers. Construction work could be done by the community itself, but siting and initial supervision should be done by a professional. Economy. Capital costs include the costs of land, the construction of the moveable roof and the fencing. Excavation and final cover application could be done by the community. 80 General care and control of the site could be included in the tasks of the waste collector, and thus covered by the collection fees. Environment. Land requirements are high (especially if organic waste is included) and the risks of leakage of environmentally harmful fluids and gases exist. Health, institutional and socio-cultural aspects. Health concerns arise with the communal involvement during landfill construction and maintenance, as well as with the rodents, birds and other disease vectors often associated with landfill sites. When siting landfills a common problem is the “not in my backyard” (NIMBY) phenomenon – when everyone agrees on the need of a disposal site but no one wants it in their vicinity – but due to the high land availability, this should not be a problem. For a successful SWM, it is important to strengthen the law enforcement of illegal dumping. Special wastes Medical wastes from the health center must be incinerated to ensure that they pose no risk, biological nor chemical, to the community. Hazardous substances, such as batteries, paints and pesticides, should not be discharged into the general waste stream due to their detrimental effect on the environment. Treatment of hazardous substances is not possible in Nueva Vida, and the wastes must thus be collected and transported to a larger city for appropriate disposal, but not even the larger cities in San Martín have these facilities. The only option at the time being is to restrict usage and thus minimize the production of hazardous wastes, and if that cannot be done, to safely collect and store it until centralized treatment exists. 6.5.4 Comparison of options and evaluation of feasible service combinations A summary of the evaluation of the different technical options is given in Table 16 (pg. 83). Education and behavior change, including improved legal enforcement, are very important for the success of the different treatment methods, and should thus be first step in municipal SWM. Waste separation also has a large impact on the subsequent choices of collection and conveyance and treatment and/or disposal of end products. A large fraction of the generated waste is organic, and if this is handled on a household level, collection and conveyance would go from being very expensive to affordable, and the environmental impacts of landfill would be considerably less. Curb-side collection costs more than the use of communal transfer stations, but would probably result in a considerably better SWM. The composting of organic waste provides a source of nutrients and organic material that could be beneficially recycled in agriculture. Given that incineration is recommended only as the ultimate choice of treatment by Peruvian law (refer to pg. 38) and that land availability is high, landfills are advantageous for inorganic waste disposal. The choices for special wastes are few; health care wastes ought to be incinerated and hazardous wastes collected and stored in the absence of proper treatment methods. Collection, conveyance and landfill management need a centralized organization. Notes on Tables 13 to 16. The results from the evaluation of technical options are summarized in the following tables. The levels for construction, operation and management and financing are households (HH), community (COM, COMB (board), COMU (users)), external expertise (EX) and educational program (EP). The evaluation criteria are ranked from 1 to 3, where the lower the score, the better result (less complex, less expensive, less environmental impact, higher socio-cultural and institutional acceptance and less health risks). The grading is done relative to other similar options and where two numbers are given, the results depend on the degree of implementation and/or the choice of associated technical options. In the last column, the ranks are summed up, assuming that all criteria are equally important. If the different criteria are not equally important, this could be adjusted for by assigning the relative importance of each criterion a numeric value, and multiplying the ranks with this numeric value, resulting in a weighted rank sum. 81 Table 13 Summary of technical options for water supply management Technology Protection of stream and springwater Water safety plan Simplified spring box Centralized treatment methods Slow sand filter Centralized chlorination Household treatment methods and storage Settling and decanting Filtration through a fine cloth Sand filtration Boiling Household chlorination SODIS Safe storage Water supply for households situated on high elevations Water safety plan – household level Rainwater harvesting System complexity Construction Operation and management Econ. Financed by Env. Sociocult. Inst. Health Rank sum 2 2 COM COM + EX COM + EX COMB 1 2 EP + COM COMU 2 1 2 2 2 1 2 2 11 10 3 2 COM + EX COM + EX COMB COMB 3 2 External/COMU COMU 2 2 2 1 2 1 1 1 13 9 1 1 2 1 2 1 1 HH HH HH HH HH HH HH HH HH HH HH HH HH HH 1 1 1 1 1 1 1 HH HH HH HH HH HH HH 1 1 1 1 1 1 1 1 1 2 1 1 1 1 1 1 1 1 1 1 1 1 2 1 2 1 1 1 6 7 8 7 7 6 6 2 2 HH + EX HH + EX HH HH 1 2 EP + HH HH 1 1 2 2 1 1 2 2 9 10 Table 14 Summary of technical options for excreta and blackwater management Technology Improved latrines Improved traditional pit latrine VIP latrine Above-ground latrine Arborloo Fossa alterna Urine diverting toilet Urinal/eco-lily Hand-washing device Collection and conveyance of blackwater System complexity Construction Operation and management Econ. Financed by Env. Sociocult. Inst. Health Rank sum 1 1 2 1 1 2 1 1 HH HH HH HH HH HH + EX HH HH HH HH HH HH HH HH HH HH 1 1 2 1 1 2 1 1 HH HH HH HH HH HH HH HH 3 3 1 2 1 1 1 1 2 2 2 2 2 2 2 1 1 1 1 1 1 1 1 1 2 2 2 2 2 2 1 1 10 10 10 9 8 10 7 6 82 Simplified sewer Septic tanks Centralized blackwater treatment methods Waste stabilization ponds Free-water surface constructed wetland Use and/or disposal of end products Reuse in agriculture Reuse in aquaculture Disposal in water Disposal on land 2 2 COM + EX COM HH/COMB COMB 2 2 HH/COMU COMU 2 2 1 1 1 1 1 1 9 9 3 3 COM + EX COM + EX COMB COMB 3 3 External/ COMU External/ COMU 2 3 1 2 1 2 1 2 11 15 2 3 1 1 HH + EX COM + EX HH/COM HH/COM HH COMB HH/COMB HH/COMB 1 2 1-3 1-2 HH COMU HH/COMU HH/COMU 1-2 1-2 2-3 2-3 3 3 1 1 2 2 2 2 1-2 1-2 2-3 2-3 10-12 12-14 9-13 9-12 Table 15 Summary of technical options for greywater and stormwater management Technology Collection and conveyance Drains on a household level Drains on a centralized level System complexity Construction Operation and management Econ. Financed by Env. Sociocult. Inst. Health Rank sum 1 1 HH COM HH COMB 1 1 HH COMU 2 2 1 2 1 1 2 2 8 9 Econ. Financed by Env. Inst. Health 1 EP 1 Sociocult. 2 1 1 - Table 16 Summary of technical options for solid waste management Technology Education on SWM Collection and conveyance Curbside collection Communal point of collection Treatment, use and/or disposal of end products Rapid composting Slower composting Landfills Incineration of medical wastes Collection of hazardous wastes System complexity - Construction - Operation and management COM 1 1 COM COM COMB COMB 3 1 COMU COMU 1 2 1 2 1 1 1 2 8 9 2 1 2 1 1 HH HH COM + EX Health center COM HH HH COMB Health center COMB 1 1 2 1 1 HH HH COMU Health center COMU 1 2 3 2 1 2 1 1 1 3 1 1 2 1 2 1 1 1 1 1 8 7 11 7 9 83 6.6 PROPOSED ACTION PLAN The next step in the planning process, following the planning support, would be to return the findings from this chapter to the community, to discuss and decide on which options and service combinations that would be suitable for them. However, if external guidance cannot be provided, which is the most probable scenario, the planning process will be terminated. In this case, future WSS improvements lie in the hands of the community itself. For this reason, this section is included; a proposed action plan on how to proceed with the improvement work. Three meetings are recommended to initiate the improvement work. MCS, which runs free workshops on WSS issues in rural communities in the region, could be asked for assistance in these matters. They would preferably run the meetings, and the situation assessment and technology screening done within this thesis could be used as a starting point, with the distribution of the developed pamphlet (Appendix IV). The first meeting is dedicated to water-related issues, starting with information about the current water quality, the need for household treatment, different treatment methods that exist, and the importance of safe subsequent handling and storage. Centralized treatment is discussed to determine if people are interested in it and prepared to work and pay for its realization. Thereafter follows information about the importance of protecting water sources and a discussion about how this could be done. In the second meeting, sanitation is targeted, including the management of excreta, greywater/stormwater and solid waste. A suggested starting point would be to inform about disease transmission routes and the importance of hygiene. A feature of the participatory learning method CTLS is the so-called “walk of shame” where participants are taken on a tour around their village and sanitary deficiencies are pointed out. This method is recommended to get people to recognize individual behavior patterns, identify sanitary problems and to start up a discussion about what they could do to improve both their hygiene behavior and the problems. Thereafter follows information about methods (technological options) to overcome the problems. The proposed meeting could be finalized with a discussion about suitable schemes for communal SWM. A third meeting is dedicated to education of sustainable agricultural practices, which is essential not only for many of the sanitation technologies and the environment, but also to increase crop yield and thus household income. This meeting should be run by an expert in the field, and the question is where to find one; potential resources are the Universities in Tarapoto, Acopagro or an NGO such as Caritas. 84 7 CONCLUSIONS AND OUTLOOK Results from the water analysis revealed that the microbiological quality of the surface water in the central distribution system was poor, containing elevated levels of both total and fecal coliforms. Household treatment (boiling) did not significantly improve the quality of the crude water; all samples remained contaminated and in some, the concentration of bacteria even increased following treatment. The results imply that either the treatment method, or the subsequent handling and storage, was poor. Solar disinfection proved to be very efficient; the concentration of bacteria was significantly reduced and 75 % of the samples that received 12 h of sunshine contained no bacteria at all. Another interesting finding was that water from an open spring, used by a handful of households in the village, was almost entirely free from bacteria, making it an interesting option for abstraction on a larger scale. Central questions to answer are how to protect the surface water and the spring water, how and where to perform the necessary treatment, how to obtain a safe subsequent handling and storage, and how to provide for households that cannot be connected to the distribution system. Some of the technical options identified as suitable for Nueva Vida were a simplified spring box to protect the open spring; slow sand filtration or direct chlorination of the water in the distribution system; household treatment and storage with solar disinfection and the plastic bottles in use; and rainwater harvesting. Further studies of importance would be to regularly monitor the turbidity in the surface water during at least a full year and to analyze the quality of rainwater under more secure conditions than what was possible within this study. The grand majority of the households in Nueva Vida used unimproved latrines that could not ensure a hygienic separation of excreta, and the most important question to answer concerning excreta management is thus how to inexpensively construct improved latrines. In the screening for technical options, several simple designs for improved latrines were identified, for example VIP latrines, above ground latrines and EcoSan models such as the Fossa alterna and urine-diverting user interfaces. The blackwater management of the few flush-and-discharge systems that existed in the village was highly deficient. Simplified sewers complemented with interception chambers or septic tanks are possible options for collection, conveyance and primary treatment, whereas waste stabilization ponds could be a suitable secondary treatment technology. The contamination of greywater and stormwater was considered low enough to not necessitate treatment, but to improve household hygiene conditions, the wastewater should be collected and diverted off the premises, for example with the use of open drains. Improving solid waste management on both a household and a community level is essential for obtaining sanitary conditions. Waste separation was identified as important for an economically and environmentally sound management. Household composting is the recommended option for treatment of the organic waste fraction, whereas communal collection, conveyance and final disposal in landfills could be an option for the inorganic fraction. Another important part of improving the sanitary situation is to target hygiene behavior and practices. The missing component for many of the proposed sanitary solutions is a defined location; ground characteristics as well as property rights remain to be investigated at interesting sites, and this would be a natural continuation of this study. The nutrients and organic matter found in many of the sanitary wastes could beneficially be recycled in agriculture, solving problems of both waste disposal and low-fertility soils. Deforestation is one of the greatest environmental threats in the area, partly driven by the habit of shifting cultivation (slash-and-burn), which in turn partly is driven by inadequate nutrient levels in the soils. If nutrients and organic matter could continuously be replenished, e.g., with the addition of urine, eco-humus or composted material to the soil, a higher fertility level could be achieved and sustained over time in agricultural land. This could slow down 85 the rate of deforestation and also increase crop yield, which in turn promotes economical development. Absolutely essential for this to happen is to ensure that the farmers understand the basics of sustainable agricultural practices and the purpose and need of fertilizers. The socio-cultural obstacles with recycling excreta in agriculture could be step-wise overcome, starting with the use of urine and demonstrations of the positive effects on crop yields. With the finalization of this project, the next step would be to return the selection and evaluation of technical options to the community, for discussion and decision-making on how to proceed with the WSS improvements. However, to continue the planning process according to the developed planning support, external guidance would be necessary. The optimal scenario would be that a local organization, with both educational and financial resources, could proceed with the planning process, building on the results from this study. At the present time, the named scenario is unrealistic and further steps to improve the WSS situation must probably be taken by the community itself. This was known in the beginning of the project – resulting in the focus on inexpensive solutions on a household level – and following the distribution of the developed pamphlet, the wish is that this study can inspire and guide their future work. The developed planning support was found very helpful as a checklist, stating what should be done where and when. By defining the steps, the methods for executing them and their desired outcome beforehand, the work in field became more effective. Concerning stakeholder participation; apart from the meetings specified in the planning support, a way of involving people that was found particularly successful, was to let them participate in the assessment work. During sampling and measuring in the village, people gathered out of curiosity and this were excellent occasions to discuss WSS issues. The experience I would like to pass on to future project planners is thus to ensure that everyone working in field – be it the volunteer or the engineer – has the interest and ability, and also is allowed to take the time, to involve the community in his or her work. And in the same time, he or she gets a great opportunity to inform about WSS and why it matters, to gather the ideas, opinions and thoughts of the community, and to create an ownership for the future solution. 86 BIBLIOGRAPHY Basak, N. N. (2002). Environmental Engineering. Tata McGraw-Hill, Chennai. Brikké, F., & Bredero, M. (2003). Linking technology choice with operation and maintenance in the context of community water supply and sanitation. World Health Organization and IRC Water and Sanitation Centre, Geneva. Cardone, R., & Fonseca, C. (2003). Financing and Cost Recovery - Thematic Overview Paper. Retrieved March 7, 2009, from IRC International Water and Sanitation Centre: http://www.irc.nl/page/3272 Cozzens, S., & Catalán, P. (2007). Water Supply and Sanitation as a Sectoral Innovation System. Retrieved July 16, 2009, from 5th International Conference Globelics 2007: http://globelics2007.sstu.ru/globelics.nsf Crow, B. (2007). Bare Knuckle and Better Technics: Trajectories of Access to Safe Water in History and in the Global South. Journal of International Development, 19, 89-98. Davison, A., Howard, G., Stevens, M., Callan, M., Fewtrell, L., Deere, D., et al. (2005). Water Safety Plans - Managing drinking-water quality from catchment to consumer. World Health Organization, Geneva. Deverill, P., Bibby, S., Wedgwood, A., & Smout, I. (2002). Designing water supply and sanitation projects to meet demand in rural and peri-urban communities. WEDC, Leicestershire. DIGESA. (2005). Reglamento de la calidad del agua para consumo humano. Retrieved July 11, 2009, from Dirección General de Salud Ambiental (DIGESA): http://www.digesa.minsa.gob.pe/normas_leg321.asp Eawag. (2005). Household-Centred Environmental Sanitation Implementing the Bellagio Principles in Urban Environmental Sanitation Provisional Guideline for Decision-Makers. Swiss Federal Institute of Aquatic Science and Technology (Eawag), Dübendorf. Elledge, M. F. (2003). Sanitation Policies - Thematic Overview Paper . Retrieved March 5, 2009, from IRC International Water and Sanitation Centre: http://www.irc.nl/page/3272 Escobedo Torres, R. (2004). Zonificación ecológica económica de la región San Martín Suelo y Capacidad de Uso Mayor de las Tierras Gobierno Regional de San Martín. Grupo Técnico de la ZEE, Instituto de Investigaciones de la Amazonía Peruana (IIAP). FAO. (2008a). Food consumption pattern of main food groups: Dietary Protein. Retrieved September 4, 2009, from Food and Agriculture Organization (FAO) of the United Nations: http://www.fao.org/economic/ess/food-security-statistics/en/ FAO. (2008b). Nutrients: Dietary Energy, Protein and Fat. Retrieved September 4, 2009, from Food and Agriculture Organization (FAO) of the United Nations: http://www.fao.org/economic/ess/food-security-statistics/en/ Ganz, Y. (2003). Water Treatment, third edition. American Water Works Association, Denver. 87 Huisman, L., & Wood, W. E. (1974). Slow Sand Filtration. World Health Organization, Geneva. IWA Sanitation 21 Task Force. (2006). Sanitation 21 Simple Approaches to Complex Sanitation. Retrieved March 3, 2009, from International Water Association (IWA): http://www.iwahq.org/templates/ld_templates/layout_633184.aspx?ObjectId=639588 JMP. (2008a). The Millennium Development Goals Report 2008. Geneva: World Health Organization/United Nations Children’s Fund Joint Monitoring Programme (JMP) for Water Supply and Sanitation. Jönsson, H., Richert Stintzing, A., Vinnerås, B., & Salomon, E. (2004). Guidelines on the Use of Urine and Faeces in Crop Production. Stockholm Environment Institute, Stockholm. Kvarnström, E., & af Petersens, E. (2004). Open Planning of Sanitation Systems. Stockholm Environment Institute, Stockholm. LeChevallier, M., Evans, T. M., & Seidler, R. J. (1981). Effect of Turbidity on Chlorination Efficiency and Bacterial Persistence in Drinking Water. Applied and Environmental Microbiology , 42 (1), 159-167. Liamsanguan, C., & Gheewala, S. H. (2007). Environmental Assessment of Energy Production from Municipal Solid Waste Incineration. The International Journal of Life Cycle Assessment, 12 (7), 529–536. Lindell, L., & Åström, M. (2008). Los Efectos de la Agricultura de Tala y Quema sobre la Fertilidad de los Suelos de la Amazonia Subandina, Perú (abstract). Proceedings of XI Congreso Nacional y IV Internacional de la Ciencia del Suelo, (pp. 114-117). Tarapoto. Livsmedelsverket. (2001). Livsmedelsverkets föreskrifter om dricksvatten SLVFS 2001:30. Retrieved July 11, 2009, from Livsmedelsverket: http://www.slv.se/upload/dokument/lagstiftning/2000-2005/2001_30.pdf Mara, D. (2006). Waste Stabilization Ponds. Retrieved May 16, 2009, from School of Civil Engineering, University of Leeds: http://www.personal.leeds.ac.uk/~cen6ddm/WSP.html Mara, D., Sleigh, A., & Tayler, K. (2000). PC-based Simplified Sewer Design. Retrieved July 30, 2009, from School of Civil Engineering, University of Leeds: http://www.efm.leeds.ac.uk/CIVE/Sewerage/ McPherson, H. J., & McGarry, M. G. (1987). User participation and implementation strategies in water and sanitation projects. International Journal of Water Resources Development, 3 (1), 23-30. Morel, A., & Diener, S. (2006). Greywater Management in Low- and Middle-Income Countries, Review of different treatment systems for households or neighbourhoods. Swiss Federal Institute of Aquatic Science and Technology (Eawag), Dübendorf. Morgan, P. (2007). Toilets That Make Compost - Low-cost, sanitary toilets that produce valuable compost for crops in an African context . Stockholm Environment Institute, Stockholm. 88 Mugabi, J., Kayaga, S., & Njiru, C. (2007). Strategic planning for water utilities in developing countries. Utilities Policy, 15, 1-8. Nagel, W. (2005). Línea de base de la Situación Hidrológica de la Cuenca del Río Saposoa en la Región San Martín, Perú. Oficial Agua Dulce WWF Perú. Núñez del Prado, H., Jaimes, F., Lopez, F., Romero, L., Rasanen, M., & Hovikosky, J. (2006). Nueva nomenclatura estratigráfica del Paleógeno-Neógeno en la Amazonía Peruana. XIII Congreso Peruano de Geología. Resúmenes Extendidos (pp. 562-565). Sociedad Geológica del Perú, Lima. OECD. (2009). OECD Factbook 2009 Economic, Environmental and Social Statistics. Retrieved July 20, 2009, from SourceOECD : http://puck.sourceoecd.org/vl=17530051/cl=16/nw=1/rpsv/factbook2009/08/02/02/index.htm Parkinson, J. (2003). Drainage and stormwater management strategies for low-income urban communities. Environment & Urbanization, 15, 115-126. PRONASAR. (2009, January 1). Programa Nacional de Agua y Saneamiento Rural. Retrieved July 14, 2009, from Ministerio de Vivienda, Construcción y Saneamiento: http://www.vivienda.gob.pe/pronasar/ Raabe, R. D. (2008). The Rapid Composting Method. Retrieved August 4, 2009, from Vegetable Research and Information Center, Division of Agriculture and Natural Resources, University of California: http://vric.ucdavis.edu/pdf/compost_rapidcompost.pdf Red RRSS. (2007). Estadisticas. Retrieved August 4, 2009, from Red de Instituciones Especializadas en Capacitación para la Gestión Integral de los Residuos Sólidos (Red RRSS): http://www.redrrss.pe/estadisticas.php Ridderstolpe, P. (2004). Introduction to Greywater Management. Stockholm Environment Institute, Stockholm. Rosensweig, F., Perez, E., Corvetto, J., & Tobias, S. (2002). Improving Sanitation in Small Towns In Latin America and the Caribbean - Practical Methodology for Designing. Office of Health, Infectious Diseases and Nutrition Bureau for Global Health, USAID, Washington. Sánchez, L. D., Sánchez, A., Galvis, G., & Latorre, J. (2006). Multi-Stage Filtration Thematic Overview Paper 15. Retrieved May 4, 2009, from IRC International Water and Sanitation Centre: http://www.irc.nl/page/31601 Sandec. (2009). Solar Water Disinfection. Retrieved July 7, 2009, from Swiss Federal Institute of Aquatic Science and Technology (Eawag): http://www.sodis.ch/index.htm Sandström, E. (2008). The state of the environment and child health in four villages in the department of San Martín, Peru. School of Pure and Applied Natural Sciences, Kalmar. Scholz, B. (2000). Limiting the number of pathogens in service water and wastewater. Eschborn: Deutsche Gesellschaft für Technische Zusammenarbeit (GTZ) GmbH. Skinner, B., & Shaw, R. (1999). 34 Protecting springs - an alternative to spring boxes. Retrieved July 30, 2009, from WELL - Resource Centre Network for Water, Sanitation and 89 Environmental Health, WEDC Loughborough University: http://www.lboro.ac.uk/well/resources/technical-briefs/ Tilley, E., Lüthi, C., Morel, A., Zurbrügg, C., & Schertenleib, R. (2008). Compendium of Sanitation Systems and Technologies. Swiss Federal Institute of Aquatic Science and Technology (Eawag), Dübendorf. Troeh, F. R., & Thompson, L. M. (2005). Soils and Soil Fertility (6th ed.). Blackwell Publishing. Törnqvist, R. (2007). Planning support for water supply and sanitation in peri-urban areas. Geotryckeriet, Uppsala. UN-Water. (2008). Tackling a global crisis: International Year of Sanitation 2008. Retrieved January 26, 2009, from International Year of Sanitation 2008: http://esa.un.org/iys/ US EPA. (2000). Constructed Wetlands Treatment of Municipal Wastewaters. US EPA Office of Research and Development, Cincinnati, Ohio. US EPA. (2000). Decentralized Systems Technology Fact Sheet - Septic System Tank. Retrieved May 15, 2009, from Technology Fact Sheets - Municipal Technologies Wastewater Management - US EPA: http://www.epa.gov/owm/mtb/mtbfact.htm USAID. (2008). Options to Pre-treat Water in Chlorination Projects. Retrieved May 8, 2009, from Environmental Health at USAID: http://www.ehproject.org/ Weiner, E. R. (2000). Applications of Environmental Chemistry: A Practical Guide for Environmental Professionals. Lewis Publishers, London. WELL. (1998). Guidance manual on water supply and sanitation programmes. Department for International Development (DFID), London. WHO. (2004a). Guidelines for Drinking-water Quality. World Health Organization, Geneva. WHO. (2004b). Water, Sanitation and Hygiene Links to Health Facts and Figures. Retrieved March 3, 2009, from World Health Organization: http://www.who.int/water_sanitation_health/publications/facts2004/en/ WHO. (1991). Surface water drainage for low-income communities. World Health Organization, Geneva. Winblad, U., & Simpson-Hébert, M. (2004). Ecological Sanitation - revised and enlarged edition. Stockholm Environment Institute, Stockholm. Vinnerås, B., & Jönsson, H. (2002). Faecal separation for nutrient management - evaluation of different separation techniques. Urban Water, 4 (4), 321-329. Younger, E., & Peralta, K. (2008). Guía Comunitaria para el Mejoramiento del Agua y la Higiene Familiar - Dirigido a los miembros de la Junta Vecinal Comunal. USAID & MSH Perú for the programme Municipios y Comunidades Saludables (MCS) en zonas del PDA, Tarapoto. 90 Zurbrügg, C. (2002). Solid Waste Management in Developing Countries. Retrieved July 19, 2009, from Swiss Federal Institute of Aquatic Science and Technology (Eawag): http://www.eawag.ch/organisation/abteilungen/sandec/publikationen/publications_swm/ Web pages Alvarsson, J.-Å., & Myrdal, J. (www). Svedjebruk. Retrieved July 18, 2009, from Nationalencyklopedin: http://www.ne.se/lang/svedjebruk Hubendick, B. (www). Avskogning. Retrieved July 18, 2009, from Nationalencyklopedin: http://www.ne.se/lang/avskogning JMP. (www). Joint Monitoring Programme for Water Supply and Sanitation Coverage Estimates Improved Water Supply Peru. Retrieved January 26, 2009, from WHO/Unicef Joint Monitoring Programme (JMP) for Water Supply and Sanitation: www.wssinfo.org/pdf/country/PER_wat.pdf UNEP. (www). International Source Book on Environmentally Sound Technologies (ESTs) for Municipal Solid Waste Management (MSWM). Retrieved July 20, 2009, from United Nations Environment Programme Division of Technology, Industry and Economics: http://www.unep.or.jp/ietc/estdir/pub/msw/index.asp US EPA. (www). Monitoring and Assessing Water Quality. Retrieved July 2, 2009, from US Environmental Protection Agency (US EPA): http://www.epa.gov/volunteer/stream/vms50.html Water for the World. (www). Designing a Small Community Disinfection Unit, Technical Note No. RWS. 3.D.4. Retrieved August 13, 2009, from Lifewater International: http://www.lifewater.org/resources/rws3/rws3d4.pdf WELL. (www). Water clarification using Moringa oleifera seed coagulant. Retrieved July 10, 2009, from Water and Environmental Health at London and Loughborough (WELL): http://www.lboro.ac.uk/well/ WHO. (www). Chlorination concepts - Fact Sheet 2.17. Retrieved July 3, 2009, from WHO Water Sanitation and Health (WSH): http://www.who.int/water_sanitation_health/emergencies/envsanfactsheets/en/index1.html Personal communication del Costillo Barrera, M. (2009, April 22). Representative for health promotion, DIRES RED Huallaga, Saposoa. Father Lorente Gutiernes, A. L. (2009, May 8). Head of Caritas Tarapoto. Gusman Bajes, C. (2009, April 4). Health technician, health centre Nueva Vida. Luna Salas, J. (2009, April 20). Head of the primary school Nueva Vida. Nuñes Perales, E. (2009, May 7). Engineer at EMAPA Tarapoto. Ruiz Olori, J. J. (2009, May 28). Secretary at Oficina de Infrastructura de la Municipalidad Provincial de Huallaga. 91 Soldaña Rengifo, Y. (2009, May 28). Gerencia Desarollo Economica, Saposoa. Soto Tapullima, D. (2009, April 21). Local governor Pasarraya. Valle Donayre, R. (2009, May 6). Representative for Municipiales y Comunidades Saludables, Tarapoto. Villager 1. (2009, April 4). Farmer Nueva Vida. Villager 2. (2009, April 20). Farmer Nueva Vida. 92 APPENDIX I Questionnaire – Household inventory ¿Qué cantidad de agua usa la familia cada día (litros)? ¿Tratan el agua antes de usarle para beber/cocinar? ¿Cómo tratan el agua (hirviendo/cloro/otro)? ¿Qué cantidad de agua tratada usa la familia cada día? ¿Como almacenan el agua tratada (balde/vasija/ollas/botellas/tinaja/plásticos/metál icas/otro)? ¿Que tipos de depósitos son utilizados para sacar el agua almacenada? ¿Con qué frecuencia están los almacenes/depósitos limpiadas? Familia Nombre Número de personas en la vivienda (adultos/niños) Oficio Casa ¿Esta es la casa de ustedes? ¿Qué tipos de energía utilizan? ¿Dónde cocinan? ¿Dónde almacenar los alimentos (abarrotes/carne/leche/verduras/frutas)? Agricultura ¿Qué tipos de cultivos tienen (café/cacao/plátanos/maíz/yuca/verduras/otros)? ¿Utilizan fertilizantes (químico/orgánico)? ¿Querrían utilizar fertilizantes? ¿Hay algún problema en que usted utilice excremento humano/animal? ¿Podrían usar excrementos de humano/animales como abono? Higiene ¿Usted se lava las manos regularmente y utiliza jabón (antes de cocinar y comer/después de ir al baño/después de limpiar al niño/después de estar en contacto con los animales)? ¿Usted ayudada al niño a lavarse las manos? ¿Dónde se bañan? ¿Qué pasa con el agua residual? ¿Dónde lavan las ropas? ¿Qué pasa con el agua residual? Sí el niño utiliza pañales, ¿cómo lavan estas? ¿Quien en la familia es responsable de lavar las ropas? Animales ¿Tienen animales (cuáles)? ¿Dónde viven los animales (aire libre/en el terreno/corral)? ¿Dónde toman los animales agua? ¿Qué hacen con las heces de los animales? Saneamiento ¿Donde hacen sus necesidades (hombres/mujeres/niños/en la noche)? ¿Qué material de limpieza se utiliza y dónde disponerla? ¿En mejorar la situación de saneamiento, que beneficios son los más importantes para ustedes (comodidad/costo/limpieza/olor/salud)? ¿Tienes problemas de la gestión de los excrementos humanos? Económica ¿Cuál es su ingreso anual? ¿Cuáles son sus gastos regulares (agua/gas/escuela/otro)? ¿Cuánto más podrían pagar para obtener agua potable? ¿Tienen un préstamo (para que)? ¿Querrían tomar un préstamo (para que)? Letrina ¿Cuál es la profundidad y la duración de la letrina? ¿Que menuda es la letrina limpiada y quien es responsable de hacerlo? ¿Qué hacen cuando la letrina está llena? ¿Qué problemas existen con la letrina? Salud ¿Qué problemas de salud existen en su familia (por los adultos/niños)? ¿Con que frecuencia existen estos problemas? ¿Cuál es el problema más fuerte de salud en la comunidad? Basura ¿Donde botan la basura (orgánico/plástico/recargable)? ¿Que problemas existen con la basura? Agua potable ¿Qué tipo de servicio de agua tienen? ¿Hay servicio de agua todo el tiempo? i APPENDIX I Do you treat your drinking water? How? How much? How do you store the drinking water? How do you abstract the drinking water from its storage? How often do you clean the equipment? Family Name Number of people living in the household Occupation Housing Is this your house? Which sources of energy do you use? Where do you cook? Where do you store the groceries? Hygiene Do you wash your hands regularly and do you use soap (before cooking and eating/after visiting the toilet/after cleaning the baby/after being in contact with animals)? Do you help your children with their handwashing? Where do you shower? What happens with the residual water? Where do you wash your clothes? What happens with the residual water? If your baby uses napkins, how do you wash these? Who is responsible for the family cloth washing? Agriculture Which crops do you have? Do you use fertilizers? Would you like to use fertilizers? Could you use human/animal excreta as fertilizer? Animals Which animals do you have? Where do they live? Where do they drink? What do you do with their feces? Sanitation Where do you do your needs (men/women/children/during night-time)? Which cleansing material do you use and where do you dispose of it? If the sanitary situation was to improve, which benefits would be the most important for you? Do you have problems managing human excreta? Economy What is your annual income? Which are your regular expenses? How much more you pay for safe drinking water? Do you have a loan? Would you like to take on a loan? Latrine What is the depth and lifetime of the latrine? How often is it cleaned and by whom? How do you proceed when the latrine is full? Which problems exist with the latrine? Health Which health problems do you have (adults/children)? How frequent are these problems? Which is the greatest health problem in the community? Solid waste Where do you dispose of the solid waste (organic/inorganic/recyclables)? Which problems exist with solid waste? Water How do you get your water? Can you get water whenever you want? How much water does your family use? ii APPENDIX II Results from water quality analysis Table 17 Measured microbiological and physiochemical parameters, crude water along the distribution system Point Date Total coliforms Fecal coliforms Turbidity (CFU/100 ml) (CFU/100 ml) (NTU) CP_a2 2009-05-13 6000 5130 7.8 CP_b1 2009-05-30 n.a. n.a. 4.2 CP_b2 2009-05-31 n.a. n.a. 5.4 CP_b3 2009-06-01 4500 620 13.1 ST_b1 2009-05-30 n.a. n.a. 13.9 ST_b2 2009-05-31 n.a. n.a. 12.2 ST_b3 2009-06-01 3800 620 6.0 RE_a2 2009-05-13 1400 940 5.9 RE_b1 2009-05-31 n.a. n.a. 2.7 RE_b2 2009-05-31 n.a. n.a. 3.7 RE_b3 2009-06-01 2080 570 3.9 H1_a1 2009-05-12 n.a. n.a. 3.7 H1_a2 2009-05-13 940 650 3.7 H1_b1 2009-05-31 n.a. n.a. 2.0 H1_b3 2009-06-01 1600 190 4.1 H2_a1 2009-05-12 n.a. n.a. 4.9 H2_a2 2009-05-13 1430 850 4.0 H2_b1 2009-05-31 n.a. n.a. 6.8 H2_b3 2009-06-01 1260 160 2.4 H3_a1 2009-05-12 n.a. n.a. 4.0 H3_a2 2009-05-13 2350 1580 3.7 H3_b1 2009-05-31 n.a. n.a. 5.3 H3_b3 2009-06-01 1970 160 4.1 OS_a2 2009-05-13 0 0 1.2 OS_b1 2009-05-31 n.a. n.a. 0.7 OS_b2 2009-05-31 n.a. n.a. 0.7 OS_b3 2009-06-01 70 0 0.7 OD_b3 2009-06-01 3400 230 0.5 RW_a1 2009-05-12 n.a. n.a. 6.1 RW_a2 2009-05-13 n.a. n.a. 3.7 RW_a2 2009-05-13 7500a 7500a 2.7 a) Uncountable number of bacteria, the samples are assigned a 25 % higher detected. iii pH 7.6 7.8 7.8 7.8 7.7 7.8 7.4 7.6 7.8 7.8 7.9 7.6 7.6 7.8 7.9 7.6 7.5 7.7 7.9 7.6 7.6 7.8 7.9 6.9 7.1 7.1 7.2 7.1 6.7 7.0 6.5 value than the EC (mS/m) 52.7 51.8 52.4 49.0 48.9 50.2 51.7 49.4 51.5 51.4 51.7 52.8 39.9 51.2 51.3 43.3 46.1 49.4 51.3 49.9 51.4 51.1 50.1 73.1 72.0 71.6 72.8 72.7 54.1 27.1 87.2 highest value APPENDIX II Table 18 Measured microbiological and physiochemical parameters, crude and household-treated (boiled) water Point Date Total coliforms (CFU/100 ml) Fecal coliforms (CFU/100 ml) Turbidity (NTU) Crude H1_a2 2009-05-13 940 650 3.7 H1_b3 2009-06-01 1600 190 4.1 H2_a2 2009-05-13 1430 850 4.0 H2_b3 2009-06-01 1260 160 2.4 H3_a2 2009-05-13 2350 1580 3.7 H3_b3 2009-06-01 1970 160 4.1 RW_a2 2009-05-13 7500a 7500a 2.7 Treated H1_a2 2009-05-13 640 570 7.6 H1_b3 2009-06-01 7500a 0 20.2 H2_a2 2009-05-13 130 50 4.4 H2_b3 2009-06-01 410 320 10.7 H3_a2 2009-05-13 7500a 40 4.6 H3_b3 2009-06-01 7500a 7500a 2.8 RW_a2 2009-05-13 74 10 3.7 a) Uncountable number of bacteria, the samples are assigned a 25 % higher detected. pH EC (mS/m) 7.6 7.9 7.5 7.9 7.6 7.9 6.5 39.9 51.3 46.1 51.3 51.4 50.1 87.2 7.6 7.5 7.7 9.0 7.2 8.6 7.0 value than the 36.8 28.0 38.2 17.9 29.4 20.7 27.1 highest value Table 19 Measured microbiological and physiochemical parameters, crude and SODIS-treated water Point Date Total coliforms (CFU/100 ml) Fecal coliforms (CFU/100 ml) Turbidity (NTU) Crude H1_a2 2009-05-13 940 650 3.7 H1_b3 2009-06-01 1600 190 4.1 H2_a2 2009-05-13 1430 850 4.0 H2_b3 2009-06-01 1260 160 2.4 H3_a2 2009-05-13 2350 1580 3.7 H3_b3 2009-06-01 1970 160 4.1 RW_a2 2009-05-13 7500a 7500a 2.7 CP_b3 2009-06-01 4500 620 13.1 Treated H1_a2 2009-05-13 60 23 3.7 H1_b3 2009-06-01 0 0 2.0 H2_a2 2009-05-13 230 170 4.9 H2_b3 2009-06-01 80 30 6.8 H3_a2 2009-05-13 20 10 4.0 H3_b3 2009-06-01 0 0 5.3 RW_a2 2009-05-13 140 120 6.1 CP_b2 2009-06-01 0 0 5.4 a) Uncountable number of bacteria, the samples are assigned a 25 % higher detected. pH EC (mS/m) 7.6 7.9 7.5 7.9 7.6 7.9 6.5 7.8 39.9 51.3 46.1 51.3 51.4 50.1 87.2 49.0 7.6 7.8 7.6 7.7 7.6 7.8 6.7 7.8 value than the 52.8 51.2 43.3 49.4 49.9 51.1 54.1 52.4 highest value Table 20 Measured flows at point of capture (CP), the reservoir (RE) and at the open spring (OD) Day CP (L/s) RE (L/s) OD (L/s) a1 107.1 - a2 104.6 - b1 88.3 5.7 2.3 iv b2 66.9 6.0 2.3 b3 5.2 2.3 APPENDIX III Dimension calculations and cost estimations of technical options Table 21 Spring box, construction cost estimation Resource Material Cement mix Plastic pipe, diameter 12.5 mm Gravel Rocks Clay Sand Fencing material Labor Professional Community Total cost Cost per household Amount Unit Price per unit Total cost 0.19 5 0.03 0.1 0.12 - m3 m m3 m3 m3 m3 m 382 2 0 0 0 0 0 73 10 0 0 0 0 0 1 3 days days PEN PEN 150 0 150 0 233 1.9 Value 12.5 0.4 31.3 2 62.5 1.5 1.4 0.2 0.3 3.4 Equation Table 22 SSF, dimensioning calculations, refer to Brikké & Bredero (2003) Parameter Water requirements ܳ Filtration rate ݒ Required area, per unit ܣ Number of units Required area, total Supernatant water reservoir Sand filter Drainage Extra height above water surface Total height of the filter Unit m3/h m/h m2 m2 m m m m m ܳ = ܣ/ݒ 1 Equation 1 Table 23 SSF, construction cost estimation Resource Amount Unit Price per unit Total cost Material Cement mix 48.3 m3 382 18453 Sand 98.0 m3 160a 15680 Gravel 12.5 m3 168b 2352 Valves, other components 1 2500c 2500 Labor Professional 14 days 150 2100 Community 14 days 0 0 Total cost PEN 41085 Cost per household PEN 343 a) The material is assumed to be free of cost, but the unit price includes the cost of transportation. b) The material is assumed to be free of cost, but the unit price includes the cost of transportation. c) Rough estimation of the additional cost of components. v APPENDIX III Table 24 Centralized chlorination, dimensioning calculations Parameter Water production Turbidity ܷܰܶ Chlorine demand ݀ܥ Chlorine residual ݎܥ Total chlorine demand ݀ܥ,ݐݐ Monthly chlorine demand ݀ܯ,ݐݐ Unit m3/month NTU mg/L mg/L mg/L kg Value 9000 10 0.9 0.6 1.5 13.5 Equation 1 2 3 ܥௗ = 0.040 + 0.086 ∙ ܷܰܶ Equation 1 ܥௗ,௧௧ = ܥௗ + ܥ Equation 2 ܯௗ,௧௧ = , ∙ Equation 3 ଵ Table 25 Centralized chlorination, cost estimations Resource Construction cost Floating bowl chlorinator Professional Total cost Cost per household Monthly fee Chlorine product (65 %) Operation and maintenance Total cost per month Cost per household per month Amount Unit Price per unit Total cost 1 1 days PEN PEN 250 150 250 150 400 3.3 20.8 30 kg days PEN PEN 8.1 4.0 168.2 120.0 288.2 2.4 Table 26 Septic tank, dimensioning calculations Parameter Unit Value Total loada m3/day 2.5 Retention time days 7 Required tank size m3 17.5 Suggested height/length/breadth/thickness m 1.5/3.5/3.3/0.1 a) 10 households, 5 persons/household and a blackwater production of 0.05 m3/person/day. Equation Table 27 Septic tank, cost estimations Resource Cement Additional material Total cost Cost per household Amount 4.6 1 Unit m3 PEN PEN vi Price per unit 382 130 Total cost 1740 260 2000 200 APPENDIX III Table 28 WSP dimensioning calculations, refer to Mara (2006) Parameter Wastewater production ܳ Estimated BOD load in the wastewater ܥ Mean temperature during the coldest month ܶ Depth of facultative pond ݀ Retention time in facultative pond ߠ Estimated BOD removal in facultative pond ܥ௨௧ /ܥ Number of facultative ponds Surface loading rate of BOD ߣ Area of facultative pond ܣ Depth of maturation pond ݀௧ Net evaporation ݁ Desired removal of fecal bacteria ܰ௨௧ /ܰ Bacteria removal constant (first order) ݇ Number of maturation ponds ݊ Retention time in maturation pond ߠ௧ Area of maturation pond ܣ௧ Unit m3/day g/m3 °C m days kg/ha/day m2 m mm/day days m2 Value 37.5 100 25.4 1.5 4 0.7-0.8 1 358 100 1.0 -2.5 4-log 6.65 2 3 113 ߣ = 350(1.107 − 0.002ܶ)்ିଶହ ܣ = ே ொ ∙ఏೌ 3 4 4 5 Equation 2 ௗೌ Equation 3 1 Equation 4 ଶொ ∙ఏೌ Equation 5 = ቀ1+݇ ܣ௧ = 1 2 Equation 1 ݇ = 2.6(1.19)்ିଶ ܰݐݑ Equation ݊ ݂ܿܽߠ∙ ܤቁ(1+݇) ݐܽ݉ߠ∙ ܤ (ଶௗೌ ା.ଵ∙ఏೌ Table 29 FWS dimensioning calculations, refer to US EPA (2000) Parameter Wastewater production ܳ݅݊ Estimated BOD load in the wastewater ݊݅ܥ Mean temperature during the coldest month ܶ Number of vegetated zones Number of open water zones ܰ Depth of vegetated zones ݀௩௭ Depth of open water zone ݀௭ Porosity of vegetated zone ߝ௩௭ Porosity of open water zone ߝ௭ Maximum surface loading rate of BOD ܴܵܮ Required total area ܣ௧௧ Retention time in entire FWS ߠ௧௧ Area of total FWS, including 25 % extra ܣ௧௧ାଶହ Area of open water zone ܣ௭ Area of vegetated zone ܣ௭ BOD removal constant (first order) ݇ை BOD removala ܥ௨௧ /ܥ Bacteria removal constant (first order) ݇ Bacteria removala ܰ௨௧ /ܰ Unit m3/day Value 37.5 g/m3 °C m m kg/ha/day m2 days m2 m2 m2 - 100 25.4 2 1 0.6 1.2 0.75 1 60 675 12 844 125 359 0.19 0.19 6.65 4-log vii Equation 1 2 3 4 5 6 7 8 9 APPENDIX III a) These values only account for the removal in the open water zone. Removal of both BOD and bacteria also occurs in the vegetated zones, but to offset the natural addition of BOD and bacteria by wildlife, this part is not included in the calculations. ܣ௧௧ = ொ ߠ௧௧ = ௗೌೡೝೌ ఌೌೡೝೌ Equation 1 ௌோ ܣ௧௧ାଶହ = 1.25 ܣ௭ = Equation 2 ொ ఏ ொ Equation 3 ௗೌೡೝೌ ఌೌೡೝೌ ఏ ொ Equation 4 ௗ ఌ ܣ௩௭ = 0.5(ܣ௧௧ − ܣ௭ ) Equation 5 ݇ை = 0.15(1.04)்ିଶ Equation 6 ೠ = (ଵାఏ ଵ Equation 7 ಿ ಳೀವ ) ݇ = 2.6(1.19)்ିଶ ேೠ ே = Equation 8 ଵ Equation 9 (ଵାఏ ಳ )ಿ Table 30 Nutrients in excreta, refer to Jönsson et al. (2004) Parameter Total food protein Part of total food protein coming from vegetables Nitrogen in excreta ܰ Phosphorus in excreta ܲ Part of total nitrogen found in urine/feces Part of total phosphorus found in urine/feces Nitrogen in urine/feces Phosphorus in urine/feces Household production nitrogen, urine/feces Household production phosphorus, urine/feces Unit g/person/day g g g/year g/year kg/year kg/year Value 70.00 0.19 9.10 0.92 0.88/0.12 0.67/0.33 2920/402 223/112 14.60/2.01 1.11/0.56 Equation 1 2 ܰ = 0.13 ∙ ݊݅݁ݐݎ ݂݀ ݈ܽݐݐ Equation 1 ܲ = 0.011( ݊݅݁ݐݎ ݂݀ ݈ܽݐݐ+ )݊݅݁ݐݎ ݂݀ ݈ܾ݁ܽݐ݁݃݁ݒ Equation 2 viii APPENDIX IV Agua Potable y Saneamiento en Nueva Vida Entre abril y junio de 2009, una investigación se hizo en Nueva Vida, sobre la situación del agua potable y saneamiento en la comunidad. El propósito de la investigación era identificar los problemas más importantes, y, con base en los resultados, buscar soluciones adecuadas para resolverlos. La investigación incluyó un análisis de muestras de agua, así como entrevistas con los hogares. En este informe, se presenta un resumen de las soluciones identificadas como adecuadas. En primero lugar, resumimos en los siguientes puntos, los resultados más importantes: El agua cruda en Nueva Vida tiene bastante de bacterias – ¡para mantener su salud, es absolutamente necesario tratarla y conservarla bien después! Las letrinas en Nueva Vida constituyan un gran riesgo para la salud, al no poder separar a los usuarios de las bacterias de las heces – ¡es necesario mejorarlas! No importa que la calidad de agua esté bien o que la letrina esté segura – ¡si las prácticas de higiene no mejora, la situación sanitaria no va a mejorar! Es muy importante que ustedes se pregunten, ¿qué soluciones pueden funcionar para ustedes? – porque si no les gustan, entonces no son sostenibles. La falta de plata es constante un problema, así mismo, se pueden hacer mejores con medios económicos limitados: ¡lo importante es que quieran mejorar su situación y prueben a hacerlo! Mi sugerencia es que tienen una reunión con toda la comunidad para discutir lo que quisieran hacer. Cuando yo estaba en la selva, hablé con personas del programa Municipios y Comunidades Saludables (MCS), y ellos me dijeron que podrían darlos educación gratuita, sobre agua potable y saneamiento. ¡Llámenles y piden ayuda! También hay un programa nacional que se llama PRONASAR, que ayuda a aldeas rurales con su agua potable y saneamiento. Todavía no existe en San Martín, pero dicen que va a estar allí pronto. Espero que ustedes puedan utilizar este informe como inspiración en su trabajo de mejorar la situación del agua potable y saneamiento en la comunidad. También quiero decir: ¡muchas gracias a toda la comunidad de Nueva Vida por su calurosa bienvenida caliente e interés en mi proyecto – nunca voy a olvidar mi tiempo en su hermosa aldea! Maria Persson Octubre de 2009, Suecia Fotografías de la reunión en Nueva Vida, en Abril 2009 ix APPENDIX IV Importancia para la salud ¿Por qué son importantes el agua potable y el saneamiento? El agua potable de alta calidad y un saneamiento adecuado son muy importantes para la salud de los niños y los adultos y también para el bienestar de toda la comunidad. Con agua potable de baja calidad y un saneamiento malo, bacterias y parásitos pueden entrar en el cuerpo humano, que se traduce en diversas enfermedades, por ejemplo la diarrea. Un niño con bacteria y parásitos en su cuerpo no puede desarrollarse normalmente. Un estudio anterior en Nueva Vida (en 2007) demostró que mayoría de los niños sufrían diarrea y tenían parásitos. También estaban por debajo de la media en estatura y peso para su edad. Los niños con enfermedades no pueden aprender tan bien en la escuela como los niños con buena salud. Adultos con enfermedades no pueden trabajar tan bien en la chacra como los adultos con buena salud. Cuando los habitantes tienen mala salud, es muy difícil para la comunidad alcanzar el buen desarrollo que sería posible. ¿Cómo hacen las bacterias para entrar en su cuerpo? Las bacterias pueden entrar en el cuerpo por cuatro caminos diferentes: vieren por las manos, moscas, el suelo o el agua, y entran el cuerpo directamente o por la comida (como indica la figura más arriba). Para proteger su cuerpo de las bacterias se deben hacer lo siguiente: lavarse las manos con mucho agua y jabón (mejorar sus prácticas de higiene y el uso del agua) tratar el agua para beber y el agua utilizada para hacer la comida (mejorar la calidad del agua potable) evitar que el agua de la pileta y de la lluvia recogen en charcos en la aldea, para evitar moscas y la fuga del bacterias de la letrina (minimizar la cantidad del agua) x APPENDIX IV Agua potable Los resultados del análisis de agua mostraron que el agua en el reservorio contenía bastante bacteria: ¡en una taza de agua, hay más que 2000 bacterias! Y en el punto de captación, ¡una taza de agua contenía más que 5000 bacteria! Debido a esto, es muy importante a tratar el agua para beber. Hay dos maneras: tratar el agua en todos los hogares o en un nivel centralizado. Métodos de tratamiento en los hogares y el almacenamiento adecuado Si el agua no se trata a nivel central, es absolutamente esencial que cada hogar trate su agua para beber en casa. Unos métodos que se pueden utilizar en Nueva Vida son el hervido, cloración y SODIS. El beneficio del hervido es que purifica el agua que tiene una alta turbidez. El problema de hervido es el humo asociado, que hace que los niños y los adultos desarrollen problemas respiratorios (tos). Cloración y SODIS Cuando el agua es clara, se pueden utilizar el cloro o el método SODIS para tratarla. La ventaja de la cloración es que el cloro permanece en el agua, y previene la contaminación de nuevo. Con SODIS, utilizando los rayos del sol para eliminar las bacterias. Para utilizar este método, se llenan las botellas de plástico transparente con agua, se tapan y se dejaran en el sol durante un día y una noche, preferentemente en un techo de calamina. El sol es más fuerte entre 11.00 y 14.00 – el medio día – y por eso es muy importante que las botellas estén en el sol durante este tiempo. Si está nublado, las botellas deben estar fuera varios días, y si llueve durante varios días, es mejor utilizar otro método. Figura 1 SODIS – un buen método para tratar agua en los hogares con el sol. Las botellas de agua cruda se colocan en el techo de calamina durante un día y una noche. Pasado este tiempo, las bacterias se han eliminado. Ilustración Maria Persson Métodos para hacer el agua clara Hay muchas técnicas para eliminar la turbidez en el agua (hacerla clara), por ejemplo, dejar el agua en un bidón durante un día, para que las partículas se depositen, o filtrarla a través de una tela o un filtro de arena y gravas pequeñas. Si filtran el agua con una tela, es muy importante hacerlo antes de tratar el agua, porque si lo hacen después, contaminarán de nuevo. Figura 2 Métodos para hacer el agua clara. A la izquierda las partículas se dejen durante un día en un bidón para se depositen, y después el agua clara se retira a otro bidón. A la derecha, un microfiltro de arena, que se compone de un cubo con una pileta, llena de gravas pequeñas y arena. Ilustración Maria Persson xi APPENDIX IV Métodos para guardar el agua tratada Un almacenamiento adecuado debe estar tapado, tener una apertura pequeña que elimine la posibilidad de introducir materiales contaminantes (como tazas y manos), y estar equipado con un grifo. Ejemplos de almacenamientos adecuados son las jarras con tapas, botellas de plástico, bidones y baldes con tapas y grifos. Cantidad de bacteria (CFU/100 ml) Análisis del agua de Nueva Vida También es muy importante guardar el agua tratada con mucho cuidado. Muestras del agua tratada fueron recogidas de los hogares en Nueva Vida para el análisis. Los hogares habían tratado el agua de estas muestras con su método habitual – hervido – y después la conservaban con su método habitual – en jarras, ollas tapadas, o en teteras. Los resultados mostraron que todas las muestras contenían bacteria después del tratamiento (Figura 3), y en la mitad de las muestras, ¡la cantidad de bacteria había crecido después del tratamiento! El hervido es un método que debería matar todas las bacterias porque es muy probable que el agua fuese contaminada de nuevo durante su almacenamiento. Esto demuestra la importancia de los almacenamientos adecuados: si el agua se contamina de nuevo a causa de un mal almacenamiento, hay poco uso en el tratamiento en primer lugar. Muestras del agua tratada con SODIS también fueran analizadas, con resultados muy buenos (Figura 3): en comparación de las muestras de agua hervida, SODIS mató muchas más bacterias en el agua. En las muestras que fueron tratadas durante 24 horas, ¡todas las bacterias se eliminaron! 2000 1800 1600 1400 1200 1000 Bacteria en agua tratada 800 Bacteria en agua cruda 600 400 200 0 cruda hervida cruda SODIS 20 h cruda SODIS 24 h Figura 3 Resultados del análisis del agua, el diagrama muestra los niveles de las bacterias en agua cruda y después del tratamiento (valores medianas). Las muestras tratadas en los hogares (hirviendo) contenían bastante bacteria después del tratamiento – lo que indica que el método de tratamiento o el almacenamiento después del tratamiento no son adecuados. En las muestras tratadas con SODIS, casi todas las bacterias se eliminaron – lo que indica que el método es muy eficaz. Métodos de tratamiento centralizado En las entrevistas, casi la mitad dijo que no tratan toda su agua para beber. Debido a esto, hay mucho que ganar teniendo un tratamiento de agua a un nivel central. Las dificultades del tratamiento central son: la necesidad de un experto para construir la solución central, la necesidad de administración central y una persona que maneje el sistema, y que lo cuesta más plata. Sin embargo, en las entrevistas las personan decían que pueden pagar una tarifa mensual más elevada si el agua fuera potable: 2 a 10 soles/mes (media 5 soles/mes). Dos propuestas que pueden ser interesantes para Nueva Vida son un filtro biológico y cloración central. xii APPENDIX IV Filtro biológico En un filtro biológico el agua purifica al correr lentamente a través de una capa de arena. Las necesidades de la tecnología son una estructura grande de concreto, una gran cantidad de arena y grava, y una persona que maneje la planta con frecuencia. Para construir la planta es necesario asistencia externa – tanto para diseñarla y financiarla. Figura 4 Un filtro biológico de arena, situado antes del reservorio para tratar el agua cruda. La técnica se compone de una estructura de cemento, una capa de gravas pequeñas y una capa de arena. Ilustración Maria Persson Cloración central Para la cloración central, pueden utilizar un aparato que se llama clorador-de-un-platoflotante. Pueden construirlo de un barril de 100-200 litros, un plato que flota y las tuberías de plástico. Se compran una solución de cloro y se mezcla con el agua en el barril. El barril está conectado al reservorio con la tubería, y la solución de cloro gotea continuamente al agua en el reservorio, tratándola así. Esta tecnología funciona bien sólo si el agua no tiene una alta turbidez. También es necesaria una persona que sepa como hacer para mezclar la correcta solución de cloro, que cambia con la turbidez del agua. No debe ser demasiado caro de financiar este sistema: es quizás una sola tasa de 4 soles/hogar para cobrar el clorador, y una tarifa mensual de 4.5 soles para el agua tratada. Figura 5 Una técnica para clorar el agua del reservorio, que se llama clorador-de-un-plato-flotante. Se construye con un barril de 100-200 litros, un plato que flota y tubos de plástico. El barril está lleno de la solución de cloro, que gotea continuamente al agua en el reservorio. Ilustración Maria Persson El uso y la protección de la fuente abierta El agua de la fuente abierta, que algunos hogares en Nueva Vida ya utilizan, era de buena calidad (casi ninguna bacteria), pero el agua se contaminaba muy rápido: en la pileta de donde se recoge, ¡la cantidad de bacteria había crecido a más de 3000 bacterias en una taza de agua! Esto significa que la fuente puede ser un buen recurso de agua potable, pero es necesario protegerla, porque si no, su buena calidad se destruirá. Un método simplificado para proteger la fuente es un diseño que se llama un cuadro de fuente (ver Figura 6). La propia comunidad puede construir y financiar el cuadro, pero necesita ayuda externa para diseñarlo y gestionar la obra de mano. También es importante limitar el acceso a la fuente de personas y animales, por ejemplo con una valla y una zanja que le rodee. xiii APPENDIX IV Figura 6 Para proteger la fuente abierta: un cuadro de fuente que se construye con un tubo de plástico, un muro de cemento, gravas pequeñas, piedras, lodo y arena. A la izquierda una sección transversal y a la derecha una vista desde arriba, incluyendo una valla y una zanja. Ilustración Maria Persson Agua para los hogares que no tienen una pileta Las entrevistas revelaron que los hogares que no tienen acceso a una pileta recogían agua en el riachuelo que pasa por la aldea o, en algún caso, agua de lluvia. El problema con el agua del riachuelo es que hay muchas cosas cerca que la contaminan, por ejemplo letrinas y animales. El agua de lluvia se recoge en un techo (de calamina), y con un tubo de plástico se lleva a un almacenamiento. La calidad del agua de lluvia es a menudo mejor que la calidad del agua de los riachuelos, pero si el techo está sucio, el agua estará sucia. Por lo tanto, es importante lavar el techo menudo. Además, cuando empieza a llover, deben botar los primeros litros de agua recogida, porque contienen la mayoría de la contaminación. Es necesario tratar tanto el agua del riachuelo como el agua de lluvia. Letrinas Prácticas de higiene No importa que la calidad de agua esté bien o que la letrina sea segura – si no tienen las prácticas de higiene adecuadas, la situación sanitaria no va a mejorar. Por ejemplo: si no se lavan las manos después de hacer su necesidades, habrá bacterias en las manos, y si no se lavan las manos antes de comer, comen estas bacterias (y se enferma). Un método sencillo para construir un aparato para lavar las manos se presenta en la Figura 10. También es importante usar jabón para disolver la suciedad y eliminar las bacterias de las manos. Los niños pequeños necesitan ayuda para lavarse bien las manos. Letrinas mejoradas Una letrina mejorada es un baño que puede separar a las heces de los usuarios, que no es un riesgo para la salud de los niños y los adultos, ni el medio ambiente circundante la letrina. La letrina típica que la mayoría de los hogares en Nueva Vida utiliza, no es una letrina mejorada, porque no puede cumplir con estos criterios. En las entrevistas, más que tres cuartas partes dijeron que querían mejorar sus letrinas. Los problemas mencionados fueron el olor feo, agua que entra en el foso, la comodidad y la higiene deficientes, y las superestructuras no terminadas. Base de cemento Un primer paso para obtener una separación segura de las heces y de los usuarios es la construcción de una base de cemento, para evitar que las bacterias en las heces puedan escaparse y que el agua no pueda entrar. Esta construcción no debe costar más que 35 soles y los propios hogares pueden hacerlos. He dejado un libro sobre cómo hacer esta base de xiv APPENDIX IV cemento en el centro de salud en Nueva Vida, y es también posible descargarlo de esta página de Internet: http://www.ecosanres.org/toilets_that_make_compost.htm (es en inglés pero con muchas fotos). Para minimizar el olor y las moscas, pueden usar una tapa para cerrar el foso e instalar una tubería de ventilación. Un otro método es que aplicar el suelo seco o materia de plantas en el foso después cada uso, y también, una vez al día, aplicar ceniza. Figura 7 A la izquierda: la base de cemento. El anillo se utiliza para apoyar el foso excavado, la placa se coloca encima del anillo (como un piso) y el pedestal encima de la placa. Es posible construir todas las partes de cemento, el pedestal además necesita un cubo de plástico. La forma no debe ser circular, pero también cuadrado. En la mitad: una letrina mejorada con una base de cemento y una tubería de ventilación para minimizar el olor y las moscas. A la derecha: una letrina mejorada sin foso – las heces son colectadas en un compartimiento encima del suelo. Con esta letrina es necesario separar la orina (vean más abajo), porque si no, va a oler feo. Ilustración Maria Persson Letrinas ecológicas La orina y las heces (las excretas) contienen muchas cosas que son importantes para las plantas – fertilizantes orgánicos (abono) – por ejemplo, nitrógeno, fósforo y materia de carbono. Si usan fertilizantes en las chacras, sus plantas crecen mejor y la cosecha también va a ser mayor (¡que significa más comida o más plata!). Además, esto es un método a tratar el relleno de la letrina, con el resultado que no es necesario cavar nuevas letrinas así menudo. La orina es normalmente limpia y pueden utilizarla directamente en las chacras (aplicarla en el suelo). Las heces necesitan descansar un año antes del uso, para eliminar todas las bacterias. Después es posible usar el relleno en las chacras: aplicarlo en el suelo antes de la siembra. Hay diferentes tipos de letrinas ecológicas y algunos se describen aquí. Arborloo La letrina ecológica más simple – el Arborloo – es una letrina tradicional, mejorada con una base de cemento. Cuando el foso está llena, mueven la casa y la base de cemento, tapar el foso con una tapa de suelo y plantar un árbol frutal allí. El árbol utiliza los fertilizantes en las excretas para 8 Arborloo – una letrina ecológica. Ilustración Maria crecer bien, y en el mismo tiempo, las Figura Persson bacterias en el foso están eliminadas. El anillo se coloca en un luego nuevo, y un nuevo foso es excavado en su interior. Luego colocan el resto de la base de cemento y la casa encima del anillo. xv APPENDIX IV Fossa alterna Este modelo se compone de dos fosos permanentes con una profundidad de 1.5 metros. Cuando el primero foso está lleno, mueven la casa y la base de cemento al segundo foso y empezar usarlo. Tapan el primero pozo con una tapa de suelo y dejarlo descansar. Cuando el segundo foso está lleno (después más o menos un año), las bacterias en las 9 Fossa alterna – una letrina ecológica. excretas del primero foso están eliminadas y está Figura Ilustración Maria Persson seguro a excavar este foso. Después de lo excavan, mover la base de cemento y la casa de nuevo al primero foso y tapar el segundo con una tapa de suelo, y así sucesivamente. La materia excavada contiene nutrientes y carbón, y pueden utilizarlo en la chacra como abono, o botarlo. Uso de orina Si piensan que es desagradable utilizar las heces en sus chacras, pueden empezar utilizar solo la orina (que es puro y contiene más nutrientes). Para extraer la orina, pueden orinar en un compartimento separado, por ejemplo en un bidón con un embudo (este modelo se llama eco-lily, ver Figura 10). O pueden diseñar un pedestal especial que separa la orina (Figura 10). Las ventajas de separar la orina son que el foso de la letrina se llena más lentamente (y por lo tanto tiene una mayor esperanza de vida) y que la materia (heces) en el foso está más seca, reduciendo los problemas con olor feo y moscas. Figura 10 Métodos para extraer orina. A la izquierda un eco-lily que se compone de un bidón y un embudo. En la mitad un pedestal especial que separa la orina y las heces: el modelo es construido de cemento y un cubo de plástico, la orina es colectada en un bidón (con tubería plástica) y las heces en un otro compartimiento o un foso de letrina. A la derecha una botella perforada, con agua para lavar las manos, y jabón. Coloquen juntos cerca de la letrina. Ilustración Maria Persson Sistemas de desagüe Un sistema de desagüe es normalmente una forma segura de separar las heces de los usuarios si hay suficiente agua, pero para que el sistema sea seguro, las aguas residuales deben ser recogidas, transportadas y tratadas adecuadamente. Alcantarillado simplificado (tubos con diámetros de 10 cm) y las fosas sépticas son tecnologías buenas para transportar y recolectar aguas residuales. Debido al gran cueste y mano de obra necesarios para construir éstos, es una buena idea si varias familias construyen un sistema juntas – ¡así xvi APPENDIX IV como ya han hecho algunas familias en Nueva Vida! Pero el agua no se trata en fosas sépticas – todavía contiene una gran cantidad de bacterias, nutrientes y partículas sólidas (que afectan negativamente el medio ambiente del río). Por eso es necesario usar una tecnología de purificación. Laguna de oxidación Un ejemplo de tecnología de purificación es una laguna de oxidación, así como en Pasarraya. Pero para purificar el agua suficientemente, es necesario tres lagunas en serie – una con una profundidad de 1.5 metros a donde el agua permanece 4 días, y dos lagunas con una profundidad de 1 metro a donde el agua permanece 3 días en cada una (ver Figura 11). Figura 11 Lagunas de oxidación, la última laguna es combinada con peces – un método para tratar desagüe. Ilustración Maria Persson Humedal artificial Otra tecnología para purificar agua es un humedal artificial: este se parece a un humedal natural con zonas de vegetación (profundidad 0.8 m) y zonas de agua (profundidad 1.2 m) (Figura 11). Para diseñar y construir lagunas o un humedal artificial es necesario ayuda externa, pero la propia comunidad podría administrarlos y manejarlos (con una formación externa). Figura 12 humedal artificial con dos zonas de vegetación y una zona de agua abierta en la mitad – un método para tratar desagüe. Ilustración Maria Persson Ningún de los dos sistemas (laguna de oxidación y humedal artificial) requiere mucho material, pero sí mucha superficie (0.7 m2/persona para las lagunas y 1.8 m2/persona para el humedal) y mano de obra (para excavar la superficie). Para mejorar aún más el tratamiento, y también obtener una fuente adicional de alimentos, es posible criar peces en las lagunas y el humedal. Aguas residuales de la pileta y de la lluvia ¿Cuál es el problema con las aguas residuales de la pileta y de la lluvia? Bueno, a menos que se gestione, el agua recogida en charcos puede propagar enfermedades. El agua mezclada con xvii APPENDIX IV excrementos y basura, y por lo tanto contiene bacteria, que se propaga tan fácilmente a los humanos (porque es también importante a mejorar su letrina y su gestión de basura). Si lavan las pañales de los bebes, hay bacterias fecales en el agua (porque deben lavar los pañales separados). Cuando hay bastante de lodo en el patio, es más difícil a mantenerlo limpia. Casi dos tercios de las familias entrevistadas dijeron que tenían problemas con agua de lluvia. Canales en el patio Una forma fácil de desviar las aguas residuales sucias y evitar las condiciones no higiénicas, es excavar canales en el patio. Muchos hogares en Nueva Vida ya tenían canales, pero como el problema de agua sigue, es necesario hacer canales con una cobertura más grande, y de una profundidad más grande. Lo bueno con los canales abiertos es que el sol puede “tratar” el agua un poco y también reducir la cantidad (evaporación), el problema es que los niños pueden jugar en ellos e infectarse allí. Si quieren y tienen dinero, pueden utilizar tubería (canales cerrados), para que los niños no puedan acceder al agua sucia. Recogida del agua de la pileta Para evitar charcos del agua debajo de la pileta, pueden excavar un foso allí, y rellenarlo con arena y piedras grandes, y conectarlo con el sistema de canales. Si utilizan productos químicos muy fuertes para lavar las ropas, el agua residual va a ser tóxica para el medio ambiente y debe ser tratada – lo más fácil es que no utilicen estos productos. Canales en la comunidad Para evitar que el agua sucia de un patio no sólo termine en otro patio, es necesario excavar más canales a nivel comunal, para transportar el agua fuera de la aldea. Para hacer esto, necesitan mano de obra, pero no material adicional, y la propia sociedad puede hacerlo. Para que los canales funcionen bien, deben quitar la basura que puede acabar en ellos. Y, evidentemente, no deben colocar desagüe en ellos, porque éste necesita un tratamiento adecuado. Basura La situación de basura en Nueva Vida no era buena. A pesar de que muchos hogares tenían lugares especiales para recoger su basura en su granja, todavía había basura por casi todas las granjas y en la comunidad. La basura por todas partes crea condiciones no higiénicas (problemas como olor, moscas, roedores, y colecciones de bacteria), especialmente junto con las aguas residuales (de la pileta y de la lluvia). No cuesta nada recolectar la basura en un solo logar, en vez de en todas partes, y lo que se necesita es un cambio del comportamiento. Recogida municipal de basura Una manera eficaz de mejorar la situación es la recogida municipal de basura. Una forma es pagar a alguien para ir a recoger la basura en los hogares (como en Pasarraya). Otra forma es que cada hogar se turnara para recoger la basura en los hogares (como con la ronda) – esta forma no cuesta plata, pero sí mano de obra. Otra forma es que todos los hogares dejaran su basura en una lugar en la comunidad, y luego pagar a alguien/se turnar para transportarla a un lugar especial a fuera de la aldea – esta forma cuesta menos que las xviii APPENDIX IV otras, pero no es tan eficaz como la primera. ¿Cuánto cuesta pagar a alguien para hacer el trabajo? ¿Cuánto pueden pagar/trabajar por el servicio de la recogida municipal de basura? Basura orgánica Si toda la basura se recoge y se transporta, probablemente va a ser muy caro/va a requerir mucho trabajo. Pero es posible bajar los costos y el trabajo, si separan los diferentes tipos de basura, y manejar algunos tipos con otros métodos. Por ejemplo, la basura orgánica puede ser tratada en su casa. Si ustedes recogen la basura orgánica en un montón de compost, protegida por un techo simple y un muro pequeño de lodo (vean Figura 13), y dejarla allí por unos meses, la basura se convierte en abono. El abono contiene nutrientes y materia orgánica, que es buena para la tierra – pueden utilizarlo en su chacra. ¡Esto es una buena manera para eliminar la basura orgánica y, al mismo tiempo, aumentar la producción agrícola! Basura inorgánica Para la basura inorgánica (la que no puede descomponerse en la naturaleza) un método es transportarla a un lugar municipal a fuera de la aldea (donde no haya gente o cursos de agua). Allí, se pueden excavar un foso séptico, protegido por un techo simple y un muro pequeño de lodo. Cuando el foso está lleno, mover el techo y taparlo bien con lodo y suelo. Después excavar un nuevo foso séptico, protegerlo con el techo y un muro de lodo, y seguir así. Es posible a vender las botellas de plástico a un comprador viajando. Basuras peligrosas Baterías son un ejemplo de los residuos peligrosos, que es muy tóxico para los humanos, los animales, las aguas y el medio ambiente. Por lo tanto, no deben botarlas con el resto de la basura. Todavía no existen servicios para gestionar los residuos peligrosos en su región, y por eso tienen que recogerlos y esperar hasta que un servicio exista (por ejemplo en Saposoa o Tarapoto). Una forma para almacenar los residuos peligrosos es en un compartimiento cerrado. La basura del centro de salud puede contener una gran cantidad de bacterias y otros vectores de infección, y por eso es necesario quemarla. Figura 13 Un montón de compost, protegido por un techo simple y un muro pequeño de lodo. Dejar la basura orgánica allí por unos meses, y va a convertirse a abono. Ilustración Maria Persson xix APPENDIX IV Mapa de Nueva Vida, Mayo 2009 xx APPENDIX V 7 CONCLUSIONES Y PERSPECTIVAS FUTURAS El análisis del agua mostraba que el agua del sistema de distribución central tenía una calidad microbiológica muy baja, con niveles elevados de coliformes totales y fecales. El tratamiento en los hogares (hirviendo) no mejoró la calidad de agua cruda significativamente; todas las muestras permanecieron contaminadas y en algunas, la cantidad de bacterias aumentó después del tratamiento. Los resultados implican que el método de tratamiento, o la gestión posterior, era pobre. La desinfección solar (SODIS) se demostró muy eficaz; la concentración de bacterias bajó significativamente, y 75 % de las muestras que recibieron 12 horas de luz solar, no contenían ninguna bacteria. Otro resultado interesante era que el agua de la fuente abierta estaba limpia, y por eso es una opción interesante para captación a una escala mayor. Cuestiones centrales a responder son: cómo proteger el agua superficial y el agua de la fuente abierta; cómo y dónde realizar el tratamiento necesario; cómo obtener una segura gestión posterior y almacenamiento; y cómo proveer agua para los hogares que no pueden conectarse al sistema de distribución central. Algunas de las opciones técnicas identificadas como adecuadas para Nueva Vida fueron un cuadro de fuente simplificado, para proteger la fuente abierta; un filtro biológico de arena o la cloración directa, para el agua del sistema de distribución central; el uso de SODIS para el tratamiento y almacenamiento del agua en los hogares; y recolección de agua pluvial. Estudios futuros de importancia serían que periódicamente vigilar la turbidez en el agua del sistema de distribución central, y analizar la calidad de agua pluvial en condiciones más seguras de lo que era posible en este proyecto. La gran mayoría de los hogares en Nueva Vida utiliza letrinas que no podían asegurar una separación higiénica de las excretas, y por eso, la pregunta más importante a responder sobre la gestión de excretas es cómo hacer para construir letrinas mejoradas a baja costo. En el examen de opciones técnicas, varios diseños de letrinas mejoradas fueron identificados, por ejemplo letrinas con ventilación y letrinas ecológicas, como el diseño Fossa alterna y la separación de orina. La gestión del sistemas de desagüe que existían en la aldea era muy deficiente. Alcantarillado simplificado, complementado con cámaras de interceptación o fosas sépticas, son opciones posibles para la recogida, transporte y tratamiento primero. Lagunas de oxidación podrían ser una tecnología adecuada para el tratamiento secundario. La contaminación de aguas residuales de la pileta y de la lluvia era considerado suficientemente bajo para no necesita tratamiento. Para mejorar la situación higiénica en los hogares, las aguas deberán ser recogidas y transportadas fuera de los hogares (y la aldea), por ejemplo con canales abiertas. Una gestión mejorada de los residuos sólidos, en los hogares y a nivel municipal, es esencial para obtener condiciones higiénicas. La separación de residuos sólidos fue identificada como importante para una gestión económicamente y ecológicamente viable. Compostaje en los hogares es la opción recomendada para el tratamiento de los residuos orgánicos, mientras que los residuos inorgánicos podrían ser gestionados a nivel municipal, con recogida, transporte y disposición final en rellenos sanitarios. La situación higiénica también podría mejorar considerablemente con un cambio de conducta. El componente que falta para muchas de las tecnologías sanitarias propuestas, es un lugar determinado; las características del terreno, así como los derechos de propiedad quedan a investigar en los sitios de interés, y esto sería una continuación natural de este proyecto. Los nutrientes y la materia orgánica que se encuentran en muchos de los residuos sanitarios, beneficiosamente podrían ser reciclados en la agricultura, resuelven los problemas de eliminación de residuos y también de los suelos de baja fertilidad. La deforestación es un de los mayores problemas ambientales en la selva, en parte afectada del hábito de la agricultura migratoria (slash and burn), que a su vez, en parte afectado de los niveles insuficientes de xxi APPENDIX V nutrientes en los suelos. Si nutrientes y materia orgánica podrían ser repuestos continuamente en el suelo, por ejemplo, con la adición de orina, eco-humus o residuos orgánicos de montones de compost, la fertilidad podría aumentar y quedar en las tierras agrícolas. Esto podría disminuir la tasa de deforestación y también aumentar la producción agrícola, que a su vez promueve el desarrollo económico. Absolutamente esencial para que esto pase, es que los agricultores comprendan los conceptos básicos de las prácticas agrícolas sostenibles y el propósito y la necesidad de fertilizantes. Los obstáculos socioculturales con el reciclaje de excretas en la agricultura podrían ser superados en etapas, comenzando con el uso de orina y manifestaciones de los efectos positivos en la rendimiento de cultivos. Con la finalización de este proyecto, la siguiente etapa sería devolver la evaluación de las opciones seleccionadas a los habitantes de la aldea, para discusiones y toma de decisiones, con cuales opciones APS quieren proceder. Sin embargo, para continuar el proceso de planificación, de acuerdo con el apoyo de la planificación, es necesario una orientación externa. El óptimo escenario sería que una organización local, con recursos educativos y financieros, pudiese continuar el proceso de planificación, basado en los resultados de este proyecto. Actualmente, este escenario es improbable, y otras medidas para mejorar la situación de APS probablemente deberán ser tomadas de la propia comunidad. Este fue conocido en el comienzo del proyecto – resulta en el foco en las soluciones de bajo costo a nivel de los hogares – y después de la distribución del folleto desarrollado, el deseo es que este estudio pueda inspirar y guiar el trabajo futuro de la comunidad. El apoyo de planificación desarrollado era muy útil como una lista de verificación, indicando lo que debía hacer, dónde y cuándo. Al definir los pasos, los métodos de su ejecución y los resultados deseados, antemano, el trabajo en el campo llegó a ser más eficaz. En cuanto a la participación de los interesados; además de las reuniones especificadas en el apoyo de planificación, una forma que se encontró particularmente exitosa para estimular participación, era dejar a la gente ayudar en el trabajo de evaluación de la situación. Durante la toma de muestras y las medidas en la aldea, la gente reunida por curiosidad, y estas reuniones eran oportunidades excelentes para discutir temas de APS. La experiencia, que yo querría transmitir a los planificadores de proyectos de la futura, es que asegurar que todos los personas que trabajan en el campo – ya sea el voluntario o el ingeniero – tienen el interés y la capacidad, y también están autorizados a tomar el tiempo, para involucrar la comunidad en sus trabajos. Y al mismo tiempo, ellos reciben una gran oportunidad para informar sobre temas de APS y sus importancias; para reunir las ideas, opiniones y pensamientos de la comunidad; y para crear una propiedad de la solución APS futuro. xxii


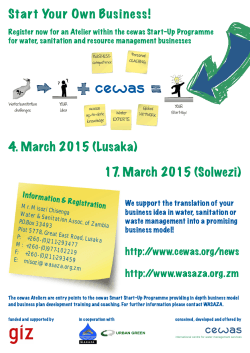


© Copyright 2026